Heart Rate and Lactate During Endurance Training Programs ... · Section 4 - Heart Rate and Lactate...
21
Section 4 - Heart Rate and Lactate During Endurance Training Programs in Rowing Heart Rate and Lactate During Endurance Training Programs in Rowing and its Relation to the Duration of Exercise by Top Elite Rowers Authors: U. Hartmann, A. Mader and W. Hollmann (GER) Secher (29) states that in the course of the last 30 years races in rowing eights have become about 35 seconds faster. Because of the improvement of the performances and the closeness of the results achieved by world class rowers, scientific investigations on rowing have become more and more important. The objectives of these investigations are first the analysis and second the improvement of the physiological performance capacity of rowers (5, 6, 7, 8, 10, 21, 27, 28, 29, 30, 34). Even a superficial look at the training practice of rowers reveals gaps in the knowledge of the physiological and, more precisely, the metabolic effects of rowing exercises (1, 17). The aim of this study is therefore to analyse and classify the rowing-specific training loads on the water. During both the preparation and competition periods, several highly qualified (elite) West German rowers underwent lactate tests at different training loads on the water. The results of these tests make the determination of the real intensity of the training exercises possible. Method Between 1985 and 1988, about 40 male rowers (elite) were tested during training in camps and at home (at sea level). The height of the rowers varied between 194 and 197 cm (6'4" and 6'6"), their average weight was 90 to 95 kg (198-209 lbs.), and their average age was 23 years. They had trained for competition for at least five years. Heart rate was measured by hand immediately after each exercise. In a number of cases, for reasons of comparison, heart rate was measured both by hand and by telemetry. The maximal individual differences between both methods amounted to four to six beats/minute. Twenty microlitres of capillary blood were taken from the earlobe at the first and third minute after a submaximal exercise and additionally at the fifth, seventh and tenth minutes after a more intensive exercise (see Table 1)(11). The lactate concentrations were determined enzymatically (20). For every training exercise (see Table 1) the mean and the standard deviation of both the lactate concentrations (LA) and the heart rates (HR) were calculated. Results and Discussion 121
Transcript of Heart Rate and Lactate During Endurance Training Programs ... · Section 4 - Heart Rate and Lactate...

Section 4 - Heart Rate and Lactate During Endurance Training Programs in Rowing
Heart Rate and Lactate During Endurance
Training Programs in Rowing and its Relation to the Duration of Exercise by Top Elite
Rowers Authors: U. Hartmann, A. Mader and W. Hollmann (GER) Secher (29) states that in the course of the last 30 years races in rowing eights have become about 35 seconds faster. Because of the improvement of the performances and the closeness of the results achieved by world class rowers, scientific investigations on rowing have become more and more important. The objectives of these investigations are first the analysis and second the improvement of the physiological performance capacity of rowers (5, 6, 7, 8, 10, 21, 27, 28, 29, 30, 34). Even a superficial look at the training practice of rowers reveals gaps in the knowledge of the physiological and, more precisely, the metabolic effects of rowing exercises (1, 17). The aim of this study is therefore to analyse and classify the rowing-specific training loads on the water. During both the preparation and competition periods, several highly qualified (elite) West German rowers underwent lactate tests at different training loads on the water. The results of these tests make the determination of the real intensity of the training exercises possible. Method Between 1985 and 1988, about 40 male rowers (elite) were tested during training in camps and at home (at sea level). The height of the rowers varied between 194 and 197 cm (6'4" and 6'6"), their average weight was 90 to 95 kg (198-209 lbs.), and their average age was 23 years. They had trained for competition for at least five years. Heart rate was measured by hand immediately after each exercise. In a number of cases, for reasons of comparison, heart rate was measured both by hand and by telemetry. The maximal individual differences between both methods amounted to four to six beats/minute. Twenty microlitres of capillary blood were taken from the earlobe at the first and third minute after a submaximal exercise and additionally at the fifth, seventh and tenth minutes after a more intensive exercise (see Table 1)(11). The lactate concentrations were determined enzymatically (20). For every training exercise (see Table 1) the mean and the standard deviation of both the lactate concentrations (LA) and the heart rates (HR) were calculated. Results and Discussion
121

FISA Coaching Development Programme Course - Level III
Table l shows the relationship between lactate and heart rate during different rowing-specific training exercises on the water. As expected, the lowest heart rates were measured during the exercises with the lowest metabolic activities. During extensive endurance training exercises (moderate long distance training - ModLDT), 1.47 +/- 0.65 millimol/litre (mmol/l) blood lactate and 146.5 +/-15.1 beats/minute heart rate were measured. During intensive endurance training (medium long distance training - MedLDT), 2.47 +/- 0.88 mmol/l blood lactate and 163.6 +/- 9.4 beats/minute were measured. As far as 4 to 7 minute workouts are concerned, lactate concentrations were found between 4.48 +/-1.73 mmol/l and 8.52 +/- 2.00 mmol/l and heart rates between 172.7 + 8.8 beats/minute and 183.8 + 12.9 beats/minute. During tempo training over different distances (500, 1000, 1500 and 2000m), lactate levels increased to 15.24 +/- 3.30 mmol/l. Heart rate was not measured during competition. However, various authors found a maximal heart rate of 190 beats/minute after maximal rowing exercises in the laboratory (7, 8, 30, 34). This heart rate can be considered as a competition value. Table 1: Number, mean, and standard deviation of lactate [LA (mmol/l)] and heart rate [HR (min-1)] for different rowing specific intensities.
Training Program
Number of
Sessions (n)
Lactate (mmol/l)
Heart Rate (per min)
Moderate Long Distance (ModLDT) 236 1.47 +/- 0.65 146.5 +/- 15.1 Medium Long Distance (MedLDT) 39 2.47 +/- 0.88 163.6 +/- 9.2 Long Distance Training with 15 strokes 12 3.04 +/- 0.76 163.1 +/- 9.4 Power (endurance) Training (PT) including 80-120 strokes 36 3.64 +/- 0.96 171.5 +/- 10.0
Intensive Long Distance Training (IntLDT; 15-20 min) 16 3.66 +/- 1.28 168.8 +/- 7.8
Intensive Long Distance Training (IntLDT; 10 min) 46 4.48 +/- 1.73 172.7 +/- 8.8
Pyramid (e.g., 30-40-50-60-50-40-30 strokes) 28 5.95 +/- 1.33 175.5 +/- 12.6
5 km in Short Time (with heart rate) 9 5.88 +/- 1.75 165.0 +/- 11.1 5 km in Short Time (without heart rate) 20 6.87 +/- 2.03 10 km in Short Time 25 6.23 +/- 1.67 Alternate Training, 3 x 7 min 32 6.84 +/- 1.49 184.1 +/- 10.6 Alternate Training, 3 x 4 min 26 8.52 +/- 2.00 183.8 +/- 12.9 Alternate Training, 3 x 7 and 3 x 4 min 48 7.59 +/- 1.92 184.0 +/- 11.6 Alternate Training, 2 or 3 x 2 min 10 10.74 +/- 1.17 2000 m Temp Training, 6 strokes < race frequency 17 7.27 +/- 2.02 177.8 +/- 13.0
1500 m Tempo Training, 3 strokes ~ race frequency 16 10.57 +/- 2.48 178.8 +/- 7.6
500m Tempo Training 158 9.88 +/- 2.17 1000m Tempo Training 83 12.48 +/- 2.61 1500m Tempo Training 14 12.90 +/- 2.08 Test Regatta - Duisburg 45 13.75 +/- 2.59 International Regatta - Lucerne 38 15.24 +/- 3.30 On the basis of the results mentioned above (see Table 1), we divided the different training exercises into four categories:
122

Section 4 - Heart Rate and Lactate During Endurance Training Programs in Rowing
• category I = more than 8 mmol/l of blood lactate • category II = 4 mmol/l to 8 mmol/l of blood lactate • category III = 2 mmol/l to 4 mmol/l of blood lactate • category IV = lactate at rest to 2 mmol/l of blood lactate This division is not arbitrary, but can be justified as follows: If after a submaximal exercise of 10 to 15 minute duration the lactate concentration is four mmol/l, the lactate concentration will not increase by more than 0.5 to 1.0 mmol/l when continuing this exercise at the same constant speed (intensity) (12, 22). The maximal, but constant intensity for long-term exercises of more than 10 to 15 minute duration can be defined as the maximal lactate steady state (MaxLass) (13, 19). The mean lactic acid concentration at MaxLass is four mmol/l. All sports medicine specialists consider four mmol/l a reference value (12, 13, 15, 16, 19, 22, 34). In our study on the rowing ergometer, we found lactate concentrations between two and four mmol/l during long-term exercises (24 to 40 min) (8). However, an endurance training session of more than one hour duration at a lactate concentration close to MaxLass is not possible. We can therefore consider this range of intensities as the upper limit for MedLDT. The division of training intensities into different values reaching from lactate at rest to a lactate concentration of two mmol/l is based on the high number of values measured in this range (n = 236) and on reasons in connection with metabolic energy supply (11). During exercises at a higher, but still constant speed, we generally found a continuous increase in lactate concentration (16). Lactate concentrations of more than eight mmol/l can lead to exhaustion. Such high lactate concentrations can also be observed on the water. A concentration of eight mmol/l blood lactate can be considered as the limit between exercises of moderate and high intensity. Specialists in the field of sport sciences, however, regard a concentration of eight mmol/l blood lactate as the transition between exercises of low and moderate intensity. They consider a lactate concentration of 12 mmol/l or more as a value indicating exhaustion (22). It is not necessary to further subdivide the training intensities at higher lactate concentrations because of the low percentage of those exercises in training (see Table 2). For training practice, it is important to know to what extent the load structures of different exercise categories (see above) are involved in the successive training phases. Table 2: Percentage of the different training intensities related to the total amount of training and to the training phase. For further information, see discussion in the text.
123

FISA Coaching Development Programme Course - Level III
Categories (% of the total amount of training Training Period IV III IV + III II I
Preparation period Autumn/winter 90-94 8-5 98-99 1 1-0 Winter/spring 86-88 9-5 95-93 4 1-3 Competition period 70-77 22-15 92-93 6 2 Table 2 is the presentation of the analysis of training data in accordance with the different intensity categories and depending on the active training time (32) in the course of one year. It is remarkable that in both preparation phases the greatest part of training (90% and more) consists of exercises at an intensity lower than two mmol/l (cat. IV). About 7% of the training is done at an intensity between two and four mmol/l (cat. 111). In the training period before a competition, the percentage of exercises of category IV decreases to 73.5%, while the percentage of exercises of category III increases to 17.5%. Both categories (III and IV) make up 92% of training, which is a significant amount of aerobic work. This is not in accordance with modern training conceptions, advice and plans (1, 2, 3, 23, 24, 25). In the competition period, the amount of training between four and eight mmol/l (6%) is higher than in the preparation period. Training at moderate and maximal intensity amounts only to one to two percent and varies slightly depending on the respective season. Heart rate seems to be the only meaningful parameter for controlling training intensity. During long distance rowing at about two mmol/l blood lactate, the heart rate corresponds to 87 to 88%, of the heart rate at a lactate concentration of four mmol/l. This is in accordance with results in athletics and swimming (4, 26). Many authors claim that endurance training is only effective if it is done at a lactate concentration between 2.5 and 3.5 mmol/1 (18, 31, 33) or four mmol/l (1, 14). The results of most intensity checks done in the field show that coaches generally assume that long distance training should be done at a lactate concentration of about three mmol/l or just under four mmol/l. However, the results of our lactate measurements (Table 1) conflict with this assumption. The athletes examined by us seem to choose lower and more tolerable training intensities depending on their individual feelings. These intensities, which are chosen for purely subjective reasons, seem to be more effective for the improvement of the athletes' endurance than the intensities suggested by the coaches which are based on theoretical concepts. If necessary the athletes could sustain a load intensity corresponding to a lactate concentration of 3.5 mmol/l for 45 minutes, but they found it very hard. Higher intensities were felt as very exhausting. Despite its unscientific character, this observation is typical of the quality of their subjective load perception. Training at an intensity corresponding to a lactate concentration of four mmol/l in order to achieve a better effectiveness can no longer be justified physiologically.
124

Section 4 - Heart Rate and Lactate During Endurance Training Programs in Rowing
Literature (I) Fritsch, W.: Zur Entwicklung der speziellen Ausdauer im Rudern. In: DSB (eds.): Informationen zum Training: Fudern. Frankfurt: DSB, Bundesausschuss Leistungssport, 1981 (Supplement No. 26). (2) Fritsch W.: Triningssteuerung im Rudern. Rudersport Vol. 35, (1985), No. 10, Trainerjournal No. 80. (3) Fritsch, W.: Die letzten Wochen vor dem Fianle. Rudersprot Vol. 36, (1986), No. 32, Trainerjournal No. 82. (4) Foehrenbach, R.: Leistungsdiagnostik, Traininsanalyse und Teuerung bei Läuferinnen und Läufern verschiederner Laufdisziplinen. Hartung-Forre, Konstanz 1896. (5) Hagerman, F.C.: Applied Physiology of Rwing. Sports Med. Vol. 1, (1984), No. 4, pp 303. (6) Hagerman, F.C., M.C. Conners, J.A. Gault, G.R. Hagerman, W.J. Plinski: Energy Expenditure During Simulated Rowing. J.Appl.Physiol. Vol. 45, (1978), No. 1, pp 87. (7) Hagerman, F.C., G.R. Hagerman, T.C. Mickelson; Physiological Prifiles of Elite Rowers. The Physician and Sportsmedicine Vol. 7, (1979), No. 7, pp 74. (8) Hartmann, U.: Querschnittuntersuchungen an Leistungsruderern im Flachland und Längsschnittuntersuchungen an Eliteruderern in der Höhe mittels eines zweistufigen Teste auf einem GJESSING-Ruderergometer. Hartung-Forre, Konstanz 1987. (9) Hartmann, U., A. Mader, W. Hollmann: Zur Differenz der Bestimmung der Ausdauerleistung (4 mmol/l Arbeitskapazität) bei zweistufigen und mehrstufigen Testverfahren. In: Steinacker, J.M. (eds.): Rudern,. Springer, Berlin-Heidelberg-New York 1988. (10) Hartmann, U., A. Mader, W. Hollmann: Querschnittuntersuchungen an Leistungsruderern mit einem zweistufigen Test auf einen Fjessing-Ruderergometer. In.: Rieckert, H. (eds.): Sportmedizin-Kursbestimmung. Springer, Berlin-heidelberg 1987. (11) Hartman, U., A. Mader, G. Petersmann, V. Grabow, W. Hollmann: Verhalten von Herzfrequenz und Laktat während ruderspezifischer Trainingsmethoden bei A- und B-Kaderruderern und deren Interpretation für die Traininssteuerung. Dt. Z. Sportmed., in press. (12) Heck, G., G. Hess, A. Mader; Vergleichende Untersuchungen zu verschiedenen Laktat-Schwellenkonsepten. Dt. Z. Sportmed. Vol. 36, (1985), No. 1 and 2. (13) Heck, H., A. Mader, G. Hess, S. Mücke, R. Muller, W. Hollmann: Justification of the 4 mmol/l Lactate Threshold. Int. J. Sports Med. Vol. 6, (1985), no. 33, pp 117. (14) Hirsch, L.: Traininsformen zur Verbesserung der aeroben Kapazität . In: DSB (eds.): Informationen zum Training; Ausdauertraining, Stoffwechselgrundlagen und Steuerungsansätze. Frankfurt; DSB, Bundesausschuss Leistungssport, 1977 (Supplement No. 9. (15) Hollman, W., T. Hettinger; Sportmedizin - Arbeits- und Trainingsgrundlagen. Schattauer, Stuttgart, New York 1980. (16) Jacobs, I., B. Sjoedin, P. Kaiser, Jl. Karlsson; Onset of Blood Lactate Exercise Accumulation After Prolonged Exercise. Acta Physiol. Scand. Vol. 114, (1981), pp 461.
125

FISA Coaching Development Programme Course - Level III
(17) Koerner, T., P. Schwanitz; Rudern. Sportverlag, Berlin (Ost) 1985. (18) Lormes, W., R.J.W. Michalsky, M. Gruenert-Fuchs, J.M. Steinacker; Belasung und Beanspruchunsempfinden im Rudern. In: Steinacker, J.M. (eds.): Rudern. Springer, Berlin-Heidelber-New York 1988. (19) Mader, A., H. Heck; A Theory of the Metabolic Origin of "Anaerobic Thershold." Int. J. Sports Med. Vol. 7, (1986), Supplement pp 45. (20) Mader, A., H. Heck, R. Föhrenbach, W. Hollmann; Das statische und dynamische Verhalten des Laktats und des Säure-Basen-Status im Bereich niedriger bis maximaler Azidosen bei 400- und 800-m-Läufern bei beiden Geschlechtern nach Belastungsabbruch. Dt.Z. Sportmed. Vol.30, (1979), No. 7, pp 203 und No. 8, pp 249. (21) Mader, A., W. Hollmann; Zur Bedeutung der Stoffwechselleistungsfähigkeit des Eliteruderers im Training und Wettkampf. In; DSB (eds.); Informationen zum Trining; Ausdauertaining Stoffwechselgrundlagen und Steuerungsansätze. Frankfurt; DSB, Bundesausschuss Leistungssport, 1977 (Supplement No. 9). (22) Mader, A., Hl. Liesen, H. Heck, H. Phiippe, P.M. Schürch, W. Hollmann; Zur Beurteilung der sprotartspezifischen Ausdauerleistungsfähigkeit im Labor. Sportrzt u. Sportmed. Vol. 27, (1976), No. 4, pp 80 und No. 5 pp 109. (23) Marx, U., J.M. Steinacker; Rudersiroergometrische Länsschnittuntersuchungen über 2 Jahre bei zwei Weltmeisterschaftsteilnehmern. In; Steinacker, J.M. (eds,): Rudern. Springer, Berlin-Heidelberg-New York 1988. (24) Nort, V.; Triningsprotokollierung- Für wen? Und wie? Welche Konsequenzen werden daraus gezogen? In; Steinacker, J.M. (eds.): Rudern. Springer. Berlin-Heidelberg-New York 1988. (25) Norle, V.: Triningssterungs-Voraussetzungen, Anwendung, Grenzen. Leistungssport Vol. 16, (1986), No. 2, pp 39. (26) Olbrecht, J., O. Madsen, A. Mader, H. Liesen, W. Hollman: Relationship Between Velocity and Lactic Acid Concentration During Continuous and Intermitted Training Exercises with Different Rest Periods and Interval Distance, Related to the Individual Performance Capacity. Int.J. Sports Med. Vol 6, (1985), No 22, pp 74. (27) Roth, W., E. Hasart, W. Wolf, B. Pansold: Untersuchungen zur Dynamik der Energiebereitstellung während maximaler Mittelzeitausdauerbelastung. Med.U. Sport Vol. 23, (1983), No. 4, pp 107. (28) Schneider, E.: Leistungsanalyse bei Rudermannschaften. Limpert, Bad Homburg 1980. (29) Secher, N.H.: The Physiology of Rowing. J. Sports Sciences Vol. 1, (1983), No. 1, pp 23. (30) Secher, N.H., M. Espersen, R.A. Brinkhorst, P.A. Andersen, N. Rube: Aerobic Power at the Onset of Maximal Exercice. Scand. J. Sports Science Vol. 4, (1982), No. 1, pp 12. (31) Steinacker, J.M.: Methoden für die Leistungsdiagnostik und Trainingssteuerung im Rudern un dihre Andwendung. In: Steinacker, J.M. (eds.): Rudern. Springer, Berlin-Heidelberg-New York 1988.
126

Section 4 - Heart Rate and Lactate During Endurance Training Programs in Rowing
(32) Stork, H.M., V. Grabow, T. Friedhoff; Computergestütze Trainingsdokumentation; Funktion der Trainingsdokumentation im Rahmen der Leistungssteuerung Rudern. In: Steinacker, J.M. (eds.): Rudern. Springer, Berlin-Heidelber-New York 1988. (33) Urhausen, A., M. Müller, H.J. Förester, B. Weiler, W. Kindermann: Trainingssteuerung im Rudern. Dt.Z. Sportmed. Vol. 37, (1986), No. 11, pp 340. (34) Vrijens, J., J. Bouckaert: Prktijkgericht fysiologisch onderaoek bij roeiers. Werken van de Vlaamse Vereneging van Sportgeneeskunde en Sportwetenschappen. Vo. 32, (1982 - 83), pp 79.
127

FISA Coaching Development Programme Course - Level III
Physiological Measurements
Compiled by Fritz Hagerman (USA) Some or all of these responses will be measured, depending on the time available for testing, the types of tests conducted, and the objectives of the testing. 1. Exercise Tests During the 25 years that our research group has evaluated elite rowers we have used a variety of tests to measure specific physiological responses. Currently we use exercise tests to simulate competitive efforts, evaluate anaerobic threshold, and observe responses to a standard submaximal exertion. Simulated Competitive Effort (Max Test) This has been the most consistent test we have used over the years and perhaps the most revealing. The test consists of a 2000 m all-out effort. Since the physiological responses are obtained during simulation of a competitive effort, the results of these tests are probably the most applicable. Physiological data including ventilation, VO2, heart rate, and lactates are usually the highest for these tests and although maximal respiratory, metabolic, and cardiovascular data are normally reported in the laboratory using a progressive exercise test to exhaustion on a treadmill or bicycle ergometer, it is our belief that the peak or highest values are indeed maximal. What is more important is that these peak or maximal values are obtained during an exercise that attempts to duplicate as close as possible a competitive effort. We are now attempting to standardize these tests by consistently using the Concept II ergometer. The maximal test involves rowing 2000 m simulating as close as possible a competitive effort on the water for this distance. Depending on whether you are male or female, it usually takes between 5:30 minutes and 8:00 minutes to complete the 2000 m on the Concept II. The max test is performed with the speed ring vents closed and the chain placed on the small sprocket. Direct Anaerobic Threshold (AT) Test This test resembles a standardized progressive resistance test designed primarily to measure VO2 max with the exception that during the early stages of the exercise the resistance is increased very slowly so that AT can be estimated by changes in ventilation, CO2 output, and VO2. In this test, when AT is reached, the athlete is then instructed to work maximally until exhausted. In this way both AT physiological and maximal physiological responses can be observed. The following represent the AT procedures:
128

Section 4 - Physiological Measurements
Time
(minutes) Power
(Watts) 0-1 125 1-2 150 2-3 175 3-4 200 4-5 225 5-6 250 6-7 275 7-8 300 8-9 325
9-10 350 10-11 375
As seen in the suggested protocol the power output is carefully controlled before and beyond the AT level. However, once eleven minutes of exercise has been completed the athlete is instructed to row as hard as possible until maximal physiological responses are obtained. This usually occurs in minutes 11-12 for heavyweight men and earlier for heavyweight women and all lightweights, and since we are using either a semi-automated or automated metabolic measuring system, it is possible to determine when maximum values have been achieved. Maximal-Submaximal Exercise Sequence This test protocol was developed and first used in 1989 and has provided important information for the coach and athlete concerning training responses, especially changes in the utilization system. Following a maximal 2000 m effort on a Concept II ergometer on the previous day, the athlete performs two consecutive five minute ergometer efforts on the Concept II, the first at 70% of maximal power output recorded in watts on the previous day and the second at 85%. All ergometer tests are performed with the new speed rings, vents are closed, and the chain is placed on the small sprocket. Heart rate is monitored at the end of each minute of exercise and for each minute of a five minute recovery period following these submaximal efforts. A small blood sample is taken via finger prick at five minute recovery following each exercise and analyzed for lactic acid. It is important that the athlete not perform a vigorous warm-up prior to the first effort and that recovery following each submaximal effort be in a quiet sitting position. Heart rate is also observed at the end of each minute of the five minute recovery period. The 70% test should elicit end-exercise heart rates in optimally trained rowers ranging from 140-150 b/min and lactates between 1.0-3.5 mmol/L while the 85% test should produce heart rates between 160-170 b/min and lactates between 3.5-5.0 mmol/L. Once the maximal test has been performed then no further max testing is necessary. This initial max test becomes the baseline and the 70% and 85% tests can then be performed periodically during the training period to determine the effects of training. Since an abundance of utilization training is used these submaximal tests will provide an excellent means of charting training responses. As training progresses the heart rate and lactate values should gradually decrease for the standard exercises.
129

FISA Coaching Development Programme Course - Level III
Submaximal testing has recently been revised so that now athletes perform three consecutive submaximal rowing tests on the Concept II ergometer at steady-state, again with the speed ring vents closed and the chain placed on the small sprocket. The testing protocol is based on a maximal 2000 m performance and dictates five minutes of rowing at approximately 60% of maximal power followed by another five minute test at 70% max power, and then ends with a final five minute test at 80% max power. Heart rate is monitored at the end of each minute of exercise for all three tests and blood samples are taken immediately after each of the first two tests and then after a five minute recovery period following the 80% test. As soon as the blood sample is taken following the 60 and 70% tests, the athlete begins the next test. The athlete should stretch well before the first test but should not warm-up on the ergometer; also no warm-downs should be performed as activity will affect lactate values. The following is a detailed description of test protocol:
60% 70% 80% Category 500m
split Stroke
rate 500m split
Stroke rate
500m split
Stroke rate
Male Heavy 1:47 18-20 1:42 20-22 1:37 22-24 Female Heavy 2:03 18-20 1:58 20-22 1:53 22-24 Male Light 1:55 18-20 1:50 20-22 1:45 22-24 Female Light 2:11 18-20 2:06 20-22 2:01 22-24 Suggested heart rate and lactate ranges are as follows:
Percentage of maximum HR (beats/minute) LA (mmol) 60% 120-140 1-2 70% 140-160 2-4 80% 160-180 4-6
Results can be used to monitor training and determine relative aerobic and anaerobic fitness. It is recommended that some form of submaximal testing be conducted on a periodic basis in order to accurately plot training effects. 2. Body Composition The ideal body weight, that weight which includes only a minimal amount of body fat, is an important factor. Excess weight, in the form of fat, is generally detrimental to performance. Accurate estimation of fat free weight (lean body mass), and fat mass (% fat), can be obtained by the underwater weighing procedures or skinfold determinations. Percent body fat values provide an objective guideline for adjusting body weight towards a more optimal lean/fat ratio as required by a sport. Percent body fat for rowers during the competitive season is as follows: heavyweight men, 8-10%; heavyweight women, 15-18%; lightweight men, 7-10%; and lightweight women, 12-15%. 3. Power Power is measured and reported specifically in a variety of ways: horsepower, watts, ft.-lbs./min, kgm/min, and kilocalories/min. Power is defined as the rate of
130

Section 4 - Physiological Measurements
doing work. For exercise purposes power may be easily estimated by simply noting either the accumulated revolution data or direct display of watts or kcals on the rowing ergometer for a given time period or the final speed and percent grade of the treadmill at the end of a maximal exercise. If the maximal exercise test is progressive then noting the time to exhaustion is important. Also, if an individual is more fit they should be able to work at a higher percentage of their maximal physical work capacity for a longer period of time than their more unfit counterpart; this observation can be used to estimate power. 4. Pulmonary or Minute Ventilation VE is measured in liters per minute. This is the volume of air expired for a period of one minute and is equal to tidal volume (depth of respiration) x respiratory rate (number of breaths per minute). Maximal exercise values for highly conditioned male athletes can exceed 200 liters/min. Maximal VE values for women can exceed 180 liters/min. This measurement increases proportionally to the body size of the individual, will become higher as respiratory fitness improves, and is elevated as metabolism is increased. If an individual can respire large volumes of air in a given time period it reflects exceptional lung power and excellent contraction capabilities of respiratory muscles. 5. Maximal Oxygen Consumption of Uptake VO2 max is measured in liters per minute or milliliters per kilogram body weight per minute. Maximum oxygen consumption is one of the best measures of general endurance fitness as many exercise physiologists believe that this variable, along with cardiac output, is probably the single most important limiting factor in one's ability to do prolonged work. This factor represents the combined ability of the respiratory and circulatory systems to pick up and deliver oxygen to the working muscles. It is therefore a measure of aerobic capacity. The measurement can be reported as an absolute value (liters/min) or as a relative value adjusted to body weight (ml/kg/min). Relative VO2 is important during exercise when an individual is required to lift or move the body through a given distance over a prolonged period of time. Outstanding male distance runners and cross-country skiers have achieved O2 uptake values in excess of 5.0 liters/minute and 80 ml/kg/min; their female counterparts have achieved the highest values among women athletes exceeding 4.5 liters/minute and 70 ml/kg/min. Recent research seems to indicate that to compete successfully as an international oarsman, absolute VO2 should be about 6 liters/minute and relative values should be between 65-70 ml/kg/min. For women these values should range between 4.0-4.5 liters/minute and between 50-60 ml/kg/min. The absolute values are lower for lightweight rowers (4.5-5.5 for men and 3.5-4.0 for women) but since rowing technique dictates a sitting position perhaps the absolute VO2 measurement should be considered the most important. Oxygen consumption is trainable and increases significantly in response to either single long sustained submaximal exercise bouts or many shorter intermediate bouts of running, swimming, cross-country skiing, cycling, or rowing. 6. Average Oxygen Consumption This value can be reported either in absolute or relative terms (see VO2 max), and may be even more important to the endurance-type athlete than VO2 max. With the
131

FISA Coaching Development Programme Course - Level III
exception of the first minute of a high intensity exercise, during which aerobic metabolism is still increasing, it is important for a rower to achieve as high an average minute by minute O2 consumption as possible. In this way, energy is derived more efficiently and the deleterious metabolic by-products (i.e., lactic acid) of anaerobic metabolism are significantly reduced. It is therefore important for oarsmen or oarswomen rowing a 2000 m piece, which is hopefully simulating a 2 km competitive row, to maintain as high an O2 consumption as possible, particularly if the responses are representative of maximal power output on the ergometer. Because of the variability of aerobic metabolism during the first minute of simulated rowing, average O2 consumption is the mean or average VO2 for minute 2 through the end of exercise. An international caliber oarsman and oarswoman, with the exception of the first minute of exercise, should be able to maintain 98% or greater of their maximal oxygen consumption during this part of the test. 7. Heart Rate The heart rate is measured in number of beats per minute. Heart rate increases proportionally with the intensity of the exercise and it is one of the easiest physiological variables to measure. It relates important information concerning the adaptability of the cardiovascular system to exercise. Heart rate can be used to determine the severity of an exercise and to indicate recovery ability of an athlete. It is often used as an indirect measurement of an individual's physical fitness and their response to a stress. Maximal heart rates for oarsmen usually range from 175-200 beats/minute while oarswomen's maximal heart rates are slightly higher ranging from 175-210 beats/minute. 8. Oxygen Debt Oxygen debt is measured in liters or milliliters. This term originated from early research and is a misrepresentation of what really happens physiologically. We have no means of storing large quantities of O2 in the body and therefore we have no source for borrowing it. Perhaps a better description of this measurement would be the ability to tolerate an O2 lack or deficit. Oxygen debt is the volume of O2 that is consumed during the recovery period following exercise above that ordinarily consumed at rest in the same time period and represents that O2 which cannot be supplied during the exercise to sustain muscular contraction. The O2 debt increases proportionally with the intensity of the exercise and indirectly represents anaerobic capacity. The total amount of O2 needed to carry out a maximal endurance exercise always exceeds the amount that the athlete can consume (VO2 or aerobic capacity). The athlete must therefore be able to tolerate or incur a temporary O2 deficit during the exercise based on the inability of the O2 transport system to keep pace with the total O2 requirement of the exercise. During a submaximal exercise the O2 requirement can be met almost fully by aerobic energy sources, but when the muscles begin to work at maximum energy levels their metabolic needs quickly exceed their ability to produce energy aerobically and thus the muscles must rely to some degree on their anaerobic energy sources. Anaerobic metabolism produces lactic acid and this substance has been found to increase proportionally with O2 debt. Although some of the O2 consumed during recovery following a maximal exercise is used to replenish small amounts of O2 stores and energy sources, the largest portion is used to convert lactic acid onto glycogen. The recovery O2 or O2 debt apparently recharges our energy stores. At least 40-60 minutes are needed to
132

Section 4 - Physiological Measurements
achieve complete recovery following severe exercise if the athlete recovers in a sitting or reclining position. However, the recovery process can be accelerated by performing a mild or light exercise during recovery. This warm-down procedure seems to promote a more rapid oxidation of lactate by permitting the respiratory and circulatory systems to remain slightly elevated and thus transport the lactic acid more quickly to the muscles and liver where it is oxidized. A maximal endurance exercise of 5-7 minutes in duration should produce oxygen debts ranging from 10-20 liters. 9. Mechanical Efficiency This parameter is specifically defined as a ratio: energy (work or power) output X 100 energy input and is therefore expressed as a percent. In human energy cost studies, efficiency is indirectly estimated by calculating power output (watts, horsepower, kilocalories) on the treadmill or rowing ergometer and then placing this value as a common quantity (kilocalories) in a ratio with energy input, which is estimated by the amount of oxygen consumed. Since VO2 can be converted to kcal, it is quite simple to get an estimation of efficiency. For our purposes, efficiency measures are valid and comparable only if each individual is working at prescribed equated or standard levels of exercise. Obviously the higher their efficiency value, the better. However, if a person works at only 70-75% of their maximal physical working capacity, efficiency measures could be higher since aerobic metabolism predominates in easier steady-state types of exercise. Therefore, obtaining a high efficiency value at maximal work or power output is a good indicator of potential excellence in performance. The highest efficiency values for human subjects range between 30-32% (competitive cyclists). Highest efficiencies recorded for rowers range from 20-24%. 10. Anaerobic Threshold Anaerobic threshold (AT) is usually measured as that percent of maximal O2 consumption or work below which no significant amounts of lactic acid are produced. In other words that point just before skeletal muscle metabolism shifts significantly from aerobic to anaerobic or that work level below which aerobic mechanisms can totally meet the energy demands of the exercise, and above which anaerobic metabolism becomes increasingly more important as exercise intensity is increased. As a result, the anaerobic threshold is an important factor to consider when an exercise lasts longer than one to two minutes, since the higher the anaerobic threshold, the longer a person can stay below the anaerobic threshold while exercising at an intensity close to maximum and thus delay the deleterious effects of anaerobic metabolism (production of lactic acid). When the average healthy adult engages in submaximal exercise below approximately 50% of max, there is little anaerobic metabolism. Thus, a relatively small O2 deficit is incurred with only a minimum amount of lactate produced in the skeletal muscles and accumulating in the blood. However, as exercise intensity increases above 50% max, anaerobic metabolism plays an ever-increasing role in order to meet the higher energy demands. As a result of elevated anaerobic metabolism, lactate levels in the exercising muscle, and consequently the blood, begin to rise.
133

FISA Coaching Development Programme Course - Level III
Obviously a highly conditioned endurance athlete has a higher anaerobic threshold than an untrained person, and recently it has been suggested that, although VO2 max is an important limiting factor in long-term exhaustive exercise, one's ability to perform at a high percentage of one's VO2 max without a significant involvement of anaerobic metabolism may be just as important. It therefore appears that an elevated anaerobic threshold leads to better sustained athletic performances. Outstanding distance runners have achieved anaerobic thresholds exceeding 90% of max while our research with oarsman has revealed a range of 75-98% depending on when AT is measured. This variable is usually lower during the off-season and should peak at the height of the competitive season. Knowledge of anaerobic threshold could also serve to regulate training more precisely; the measurement of heart rate compatible with the anaerobic threshold would provide a control factor which could be used during training to reflect the relative use of aerobic and anaerobic metabolism in a workout. 11. Blood Lactates Blood lactates are measured in mg% (mg/dl), or mmol/liter. During severe exhaustive exercise, O2 consumption cannot keep pace with the energy needs of the muscle cells. As a result, the cells become increasingly more dependent on anaerobic metabolism. Where CO2 and water are the by-products of aerobic metabolism and can easily be eliminated or handled by the body, extensive use of anaerobic energy sources produces large amounts of lactic acid, which build up in the working muscles and overflow into the blood. There seems to be a high correlation between extensive use of anaerobic energy sources and elevated levels of venous blood lactates. Elevated lactate levels have been associated with acute muscular fatigue and pain. Blood lactate levels measured during recovery can provide useful information regarding an athlete's efficiency in oxidizing the lactate to glycogen. The 5 minute recovery lactate measurement, since it takes time for the muscle lactate to diffuse into the blood, is taken as the maximal value produced during exercise. An end-of-recovery lactate measurement indicates oxidative efficiency of resynthesis processes to convert lactate to glycogen. A dominance of slow-twitch muscle fibers will probably improve this oxidative resynthesis. Lactic acid levels for oarsmen and oarswomen following 2000 m of maximal ergometric rowing ranged from 10-20 mmol/L. Lactic acid concentrations following competition have been higher; 20-28 mmol/L for men and 15-20 mmol/L for women. 12. Muscular Strength and Power These factors are measured by an isokinetic dynamometer (Cybex II) which evaluates muscular output at pre-selected controlled velocities from isometric (0°/sec) to fast and more functional speeds (up to 300°/sec) and the results are reported in foot-pounds or foot-pounds per minute. Torque (force) achieved through a range of motion and the speed at which the specific torque is achieved complete the performance evaluation. Slow contractile velocity specifically tests muscular strength and joint stability. The dynamometer evaluates strength at every point throughout the range of motion in maximum effort contractions. Peak power is then calculated from the single muscle group's force-velocity curves over the range of contraction frequencies studied. Standard testing procedure dictates beginning with a specific contractile velocity setting of, for example, 30°/sec, the
134

Section 4 - Physiological Measurements
subject repeats up to three maximal voluntary contractions at a given speed with full recovery between contractions. Strength is measured at each point throughout the range of motion and displayed (in foot-pounds) on a recorder. This procedure, repeated at increasing velocities (60°, 90°...300°/sec), enables assessment of strength levels at higher speed contraction rates when the proportion of muscle mass (numbers of fibers recruited) is less. Local muscular endurance or power endurance assesses the ability to sustain high levels of muscular performance over time. Measurements include a tracing of the fatigue curve and digital read-out of the total work performed over selected time intervals during sustained maximal dynamic contractions; this test requires each athlete to perform repetitive contractions at 180° or 240°/sec. If recordings are made during a one minute endurance test at regular intervals (e.g., every 10 sec) then a detailed fatigue curve may be determined. Muscle strength applied at high contraction rates (power) is paramount to successful performance in explosive events of short and moderate duration. It is important for an oarsman and oarswoman to exhibit high muscular power outputs at the faster, more functional speeds (180°/sec and higher) and, at the same time, perform well on the one minute power endurance test with consistent power results at each measuring interval and displaying little power drop-off during the later stages of the test. The functional power measurement for rowers is very important and it has been estimated that the strength and power measurements at 240°-300°/sec are the most applicable measurements since these are the speeds in which the power phase of the rowing technique is carried out.
135

FISA Coaching Development Programme Course - Level III
Physiological Evolution of the
Rowing Athlete: a 25-year Study Authors: Fritz Hagerman and Kumika Toma (USA) Introduction It is well known that a 2000-m competitive rowing effort requires a substantial aerobic energy contribution (75-80%). Although anaerobic energy sources are only responsible for 20-25% of the total energy for this effort, they are no less important as they are needed most at critical periods of the race: at the start and again during the sprint at the finish. Optimal energy production is dependent on several complex and interdependent physiological responses which are often described as utilization and transportation. Utilization of stored energy in skeletal muscle fibers begins with the use of high energy phosphate compounds (ATP and Phosphocreatine) followed rapidly by the metabolism of intracellular carbohydrate (glycogen), fat, and protein which, when combined with oxygen, will provide the energy to sustain exercise. Transportation is represented by a series of important processes using such functions as neurological, cardiovascular, respiratory, and hematological, all working together to deliver oxygen and nutrients to the working muscle and stimulate its contraction. Several aerobic sports and/or events are dependent on a similar energy component relationship as rowing, however, athletes in these sports and/or events are not required to generate as much muscular power as rowers and all involve individual participation. A crew is thus only as strong as its weakest member. The excessive energy demands of rowing and the emphasis on high muscular power output seem to attract several genetically gifted and hard working athletes whose skeletal muscle fiber composition and respiratory - cardiovascular delivery systems show extreme adaptations. These adaptations are represented by the development of some very unique physical and physiological qualities which have continued to evolve and improve as indicated by the comparative data that are presented in this paper. All of the comparisons represent observations of U.S. rowers over a 25-year period and include over 2000 subjects. Athlete Profile Physical Characteristics Elite rowers are tall and muscular, and tend to have very low percentages of body fat. Oarsmen competing in the open division now average 89 kg in weight and 193 cm in height while women rowers now average 76 kg in weight and 176 cm in height. Percent body fat has steadily declined for both men and women so that men now average about 8.5% while women average about 16%. Table 1 summarizes changes in body composition of U.S. men's eight-oared crews every 5 years between 1972 and 1997. As illustrated in this table rowers have become taller and more muscular over the 25-year period with percent body fat decreasing significantly during this time. Because of weight restrictions lightweight men and
136

Section 4 - Physiological Evolution of the Rowing Athlete
women tend to be smaller athletes: men average about 70 kg in weight and 177 cm in height while lightweight women average 57 kg and 172 cm respectively. As expected, both lightweight men and women have a high proportion of their body composition represented as fat-free mass: percent body fat usually ranges between 5-9% for men and 10-14% for women. There has been concern expressed by sports medicine doctors and scientists for the health and well being of lightweight rowers because of some of the potentially dangerous practices used to "cut" or "make" weight. Long term effects of these practices have not been identified but there is the possibility of severe muscle wasting and bone loss and even kidney and liver damage. Table 1: Twenty-five year comparison of physical characteristics of U.S. National eight-oared crews: 1972-1997 (mean ± SD)
Year Age (yrs) Height (cm) Weight (kg) Bodyfat (%) 23.8 189.4 87.4 12.3 1972 ±1.45 ±2.92 ±6.1 ±2.3 21.4 194.3 91.2 11.5 1977 ±2.5 ±3.0 ±4.8 ±2.0 22.8 194.3 90.2 9.3 1982 ±2.1 ±4.3 ±4.3 ±1.6 23.1 195 88.2 8.5 1987 ±3.3 ±5.5 ±3.7 ±1.2 24.2 195.8 92 8.6 1992 ±3.1 ±5.1 ±2.9 ±1.1 23.1 196.3 93.8 8.9 1997 ±3.4 ±3.0 ±2.7 ±0.7
% change between 1972 & 1997 -2.9 3.6 7.3 -27.6
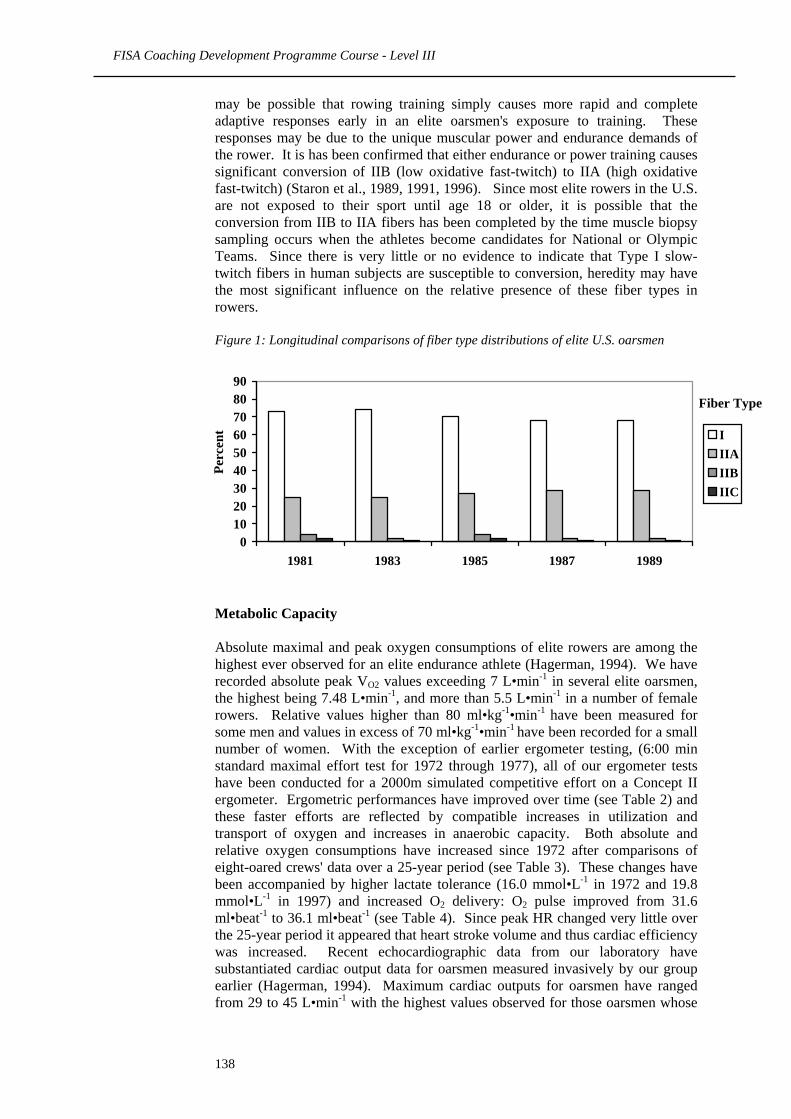
Skeletal Muscle Qualities Because of the emphasis on both muscular power and cardiorespiratory endurance it was originally hypothesized that the dominant muscle fiber in rowing muscles would be the normally larger fast IIA or Fast-Twitch-Oxidative fiber. However, to our surprise most of the fibers turned out to be of the Slow-Twitch or Type I variety (similar to a marathon runner's muscle) but unusually large in diameter. Average percentages of 70-75% for Type I fibers have been consistently observed in the vastus lateralis muscle of rowers as opposed to 20-25% Type IIA fibers and almost no Type IIB or Fast-Twitch-Glycolytic fibers represented (see Figure 1). The average representation of Type IIB fibers in rowers is somewhat misleading since most elite oarsmen do not have any of this fiber type: the average value for IIB fibers was strongly influenced by a few athletes having only a small number of these fibers. The most unique adaptive architectural response to rowing appears to be the development of unusually large Type I fibers, many having cross-sectional areas of greater than 8000 m2. It is noteworthy that results of serial biopsy data accumulated for the same 12 highly competitive oarsmen over an 8-year period have shown consistent fiber type proportions (see Figure 1). Most of these subjects were initially sampled between ages 20 - 22 years and, with no exception, displayed very similar fiber type proportions and cross-sectional areas throughout the entire test period. Despite some differences in training over the years and possible cumulative effects of training, fiber type proportions and cross-sectional areas remained stable. This is in contrast to similar studies conducted with elite cyclists who exhibited changes in fiber type proportions over time most of which favored an increase in oxidative fiber types (increase in Type IIA) (Coyle et al., 1992). It is not certain what accounts for the differences in the adaptive responses between elite rowers and cyclists, however it
137
FISA Coaching Development Programme Course - Level III
may be possible that rowing training simply causes more rapid and complete adaptive responses early in an elite oarsmen's exposure to training. These responses may be due to the unique muscular power and endurance demands of the rower. It is has been confirmed that either endurance or power training causes significant conversion of IIB (low oxidative fast-twitch) to IIA (high oxidative fast-twitch) (Staron et al., 1989, 1991, 1996). Since most elite rowers in the U.S. are not exposed to their sport until age 18 or older, it is possible that the conversion from IIB to IIA fibers has been completed by the time muscle biopsy sampling occurs when the athletes become candidates for National or Olympic Teams. Since there is very little or no evidence to indicate that Type I slow-twitch fibers in human subjects are susceptible to conversion, heredity may have the most significant influence on the relative presence of these fiber types in rowers. Figure 1: Longitudinal comparisons of fiber type distributions of elite U.S. oarsmen
Fiber Type
0102030405060708090
1981 1983 1985 1987 1989
IIIAIIBIIC
Perc
ent
Metabolic Capacity Absolute maximal and peak oxygen consumptions of elite rowers are among the highest ever observed for an elite endurance athlete (Hagerman, 1994). We have recorded absolute peak VO2 values exceeding 7 L•min-1 in several elite oarsmen, the highest being 7.48 L•min-1, and more than 5.5 L•min-1 in a number of female rowers. Relative values higher than 80 ml•kg-1•min-1 have been measured for some men and values in excess of 70 ml•kg-1•min-1 have been recorded for a small number of women. With the exception of earlier ergometer testing, (6:00 min standard maximal effort test for 1972 through 1977), all of our ergometer tests have been conducted for a 2000m simulated competitive effort on a Concept II ergometer. Ergometric performances have improved over time (see Table 2) and these faster efforts are reflected by compatible increases in utilization and transport of oxygen and increases in anaerobic capacity. Both absolute and relative oxygen consumptions have increased since 1972 after comparisons of eight-oared crews' data over a 25-year period (see Table 3). These changes have been accompanied by higher lactate tolerance (16.0 mmol•L-1 in 1972 and 19.8 mmol•L-1 in 1997) and increased O2 delivery: O2 pulse improved from 31.6 ml•beat-1 to 36.1 ml•beat-1 (see Table 4). Since peak HR changed very little over the 25-year period it appeared that heart stroke volume and thus cardiac efficiency was increased. Recent echocardiographic data from our laboratory have substantiated cardiac output data for oarsmen measured invasively by our group earlier (Hagerman, 1994). Maximum cardiac outputs for oarsmen have ranged from 29 to 45 L•min-1 with the highest values observed for those oarsmen whose
138

Section 4 - Physiological Evolution of the Rowing Athlete
heights exceeded 199 cm, weights did not exceed 90 kg, percent body fat did not exceed 9%, peak VO2 was 6.7 L•min-1 or higher and average VO2 was at least 98% of peak VO2 during the 2000 m simulated rowing effort on a Concept II ergometer and average power output for this effort was 500 w or higher. Both oxygen transportation and utilization improved over time and no doubt also contributed to improved mechanical efficiency (ME) for the modern day oarsmen (see Table 4). It is difficult to isolate a single important physical or physiological factor responsible for the improved fitness of oarsmen, however today's athletes are more muscular, stronger, possess greater endurance capacity, and row more efficiently. They have also benefited from better equipment, coaching, training, and nutrition, all of which work together to improve rowing fitness and performance. Table 2: Twenty-five year comparison of ergometric performances of U.S. National eight-oared crews: 1972-1997 (mean ± SD)
Year Rowing Time (min) Average Power (Watt) 6:00.0 386.6 1972* ±12.6 6:00.0 402.4 1977* ±13.3 6:05.1 460.1 1982 ±16.1 ±10.2 6:00.8 478.8 1987 ±13.7 ±9.6 6:03.4 465.9 1992 ±12.6 ±11.4 5:58.4 488.1 1997 ±8.0 ±10.9
% change between 1982 & 1997 -1.8 6.1
(* = 6-minute erg test: gamut ergometer) Table 3: Twenty-five year comparison of respiratory-metabolic responses of U.S. National eight-oared crews: 1972-1997 (mean ± SD)
Year peak VE (BTPS) (L/min)
peak VO2 (STPD) (L/min)
peak VO2 (STPD) (ml/kg/min)
187.6 5.87 65.5 1972 ±18.2 ±0.1 ±5.0 191.4 5.9 64.3 1977 ±11.1 ±0.3 ±1.1 212 6.0 67.1 1982 ±18.6 ±0.2 ±2.9
189.9 5.9 67.2 1987 ±9.7 ±6.3 ±8.2 200 6.31 68.6 1992 ±12.3 ±0.5 ±5.8
201.2 6.62 71.3 1997 ±20.1 ±0.4 ±6.1 % change between
1972 & 1997 7.3 12.8 8.9
Table 4: Twenty-five year comparison of transportation data (heart rate - oxygen pulse), lactate tolerance, and mechanical efficiency of U.S. National eight-oared crews: 1972-1997 (mean ± SD)
Year peak HR (L/min)
O2 pulse (ml/b)
post LA (mmol/L)
ME (%)
139

FISA Coaching Development Programme Course - Level III
186.0 31.6 16.0 18.9 1972 ±8.0 ±2.9 ±2.0 ±1.2 181.0 32.6 15.8 19.2 1977 ±7.2 ±1.9 ±2.0 ±1.1 194.0 30.9 15.6 18.8 1982 ±10.4 ±2.1 ±1.8 ±0.5 188.0 31.4 13.6 19.2 1987 ±8.6 ±2.3 ±2.1 ±0.6 189.0 33.4 17.3 19.6 1992 ±7.3 ±2.1 ±2.2 ±1.9 184.0 36.0 19.8 22.3 1997 ±10.4 ±2.7 ±2.4 ±3.2
% change between 1972 & 1997 -1.1 13.9 23.8 3.4
Performance Despite the differences in climatic and environmental conditions among regatta sites, competitive results have continued to improve on an average of about 0.5 to 1.0 second per year since the 1956 Olympic Games however, more recent results have improved at a more rapid rate (see Table 5). The average improvement in four common men's Olympic events from 1956 to 1997 was about 0.5% per year with the pair without coxswain showing the most improvement during this 41 year period. Average improvement for women in four events from 1988 to 1997 was almost 20 seconds: single sculls and pair-oared without coxswain showed the greatest improvement (see Table 5). Because there are few comparative Olympic performance data between men and women it is difficult to explain the apparent gender-related differences. When World Rowing Championship data are included as part of the comparison and performance data from other aerobic sports are added it is clear that certain anatomical (larger skeletal and cardiac muscle mass) and physiological (larger blood volume) favor the male rowers but when relative values based on body weight and fat-free mass are considered, competitive efforts for men and women are now almost equal. As indicated in Table 5 women have improved performances substantially from 1988 to 1996. For the events summarized in Table 5, the men were, on an average, almost 50 seconds faster than the women in 1988 but this difference had been reduced to 40 seconds faster by 1996, the one exception being the eight-oared event in which the men showed more improvement between 1988 and 1996. Faster 2000m times for both men and women over the years have been a result of better equipment, better and more experienced athletes, and improved training programs. It does appear that women are now improving at a faster rate than men and this can be accounted for by the attraction of better athletes and the accumulation of more experience at the 2000m distance. More recent ergometric and physiological data indicate that rowers are still evolving into better athletes, and if equipment and racing conditions keep pace with the physiological growth of the rowing athlete then the expectations of rowing performances will continue to increase. Table 5: A comparison of Olympic Games performance times (min:sec) over 2000m for four common boat classes for men and women (1997 world champion results are also included)
Men
140

Section 4 - Physiological Evolution of the Rowing Athlete
Year Single Scull Double Scull Pair-oared
without coxswain
Eight-oared with coxswain
1956 8:03 7:24 7:55 6:35 1960* 7:14 6:48 7:02 5:57
1964 8:23 7:11 7:33 6:18 1968 7:48 6:52 7:27 6:07 1972 7:10 7:02 6:53 6:09 1976 7:29 7:13 7:23 5:58 1980 7:10 6:24 6:48 5:49 1984 7:00 6:36 6:45 5:41 1988 6:50 6:21 6:37 5:46 1992 6:51 6:17 6:28 5:29 1996 6:45 6:17 6:20 5:42 1997 6:45 6:13 6:28 5:27 based
on 1956 16.1% 16.0% 18.3% 17.2%
* = racing distance short of 2000m
Women
Year Single Scull Double Scull Pair-oared
without coxswain
Eight-oared with coxswain
1976** 4:06 3:44 4:01 3:33 1980** 3:41 3:48 3:31 3:03 1984** 3:41 3:27 3:32 3:00
1988 7:47 7:01 7:28 6:15 1992 7:26 6:49 7:06 6:03 1996 7:32 6:57 7:01 6:19 1997 7:29 6:51 7:08 6:02 based
on 1988 3.8% 2.4% 4.5% 3.5%
** = racing distance 1000m References 1. Coyle EF, Sidossis LS, Horowitz JF, Beltz JD. Cycling efficiency is related to the percentage of Type I muscle fibers. Med Sci Sport Exerc 1992;24(7) :782-788. 2. Hagerman FC. Physiology and Nutrition for Rowing. In: Lamb DR, Knuttgen HG, Murray R,. eds. Perspectives in Exercise Science and Sports Medicine. Vol. 7. Physiology and Nutrition for Competitive Sport. Carmel, IN: Cooper Publishing Group. 1994:221-302. 3. Staron RS, Malicky ES, Leonardi MJ, Falkel JE, Hagerman FC, Dudley GA. Muscle hypertrophy and fast fiber type conversions in heavy resistance-trained women. Eur J Appl Physiol 1989;60:71-79. 4. Staron RS, Leonardi MJ, Karapondo DL, Malicky ES, Falkel JE, Hagerman FC, Hikida RS. Strength and skeletal muscle adaptations in heavy-resistance-trained-women after detraining and retraining. J Appl Physiol 1991;70:631-640. 5. Staron RS, Walsh SJ, Hikida RS, Hagerman FC, Gilders RM, Murray TF. Muscular adaptations in elderly men following 16-week high-intensity resistance training program. Med Sci Sports Exerc 1996;28:S115.
141