Healthy, Prosperous Lives for All
17
Chris Brown Head, WHO European Office for Investment for Health and Development Healthy, Prosperous Lives for All The WHO European Health Equity Status Report Initiative
Transcript of Healthy, Prosperous Lives for All
Chris Brown Head,
WHO European Office for Investment for Health and Development
Healthy, Prosperous Lives for All
The WHO European Health Equity Status Report Initiative

(2)

(3)
The HESRi Data 5 Essential Conditions
needed to be able to live
a healthy life
1. Health Services
2. Income Security &
Social Protection
3. Living Conditions
4. Social & Human
Capital
5. Employment and
Working Conditions
53 policies
Coverage, Investment and Impact 2005-2017
Health Status
- well-being
- mortality
- morbidity Health
Status and
Trends
Underlying
Conditions
And Trends
PolicyAction and
Trends
- Status and trends in
health inequities
- Status and trends in
underlying determinants
- Relationships between
health, determinants,
and policy actions
- More complex
analysis…

(4)
Dialogue, Consultation and Testing the work of the HESRi
April May June September October November December April’19 June ‘19 July’19
SAGE Global Task
Force
Age Friendly
Cities
Copenhagen
Regions for
Health
Annual Meeting
Gothenburg
Regional
Committee
Rome
Country
Testing
Hungary, Malta,
Italy, Slovenia,
UNK
WHO 70th Anniversary
Czech Republic,
Hungary,
Poland, Slovak Rep.
Country
Testing
Wales
Small
Countries
San Marino
High Level
EURO
Conference
Health Equity
Ljubljana
Regions for
Health
Annual Meeting
Aachen

(5)
What is holding people back from good health and a decent life?
10% Inequity in access to and quality of health care
35% Financial Insecurity ‘not being able to make ends meet
29% Poor quality housing and underdeveloped and unsafe
neighborhoods
19% Lack of trust, agency and sense of belonging + poor
access and quality of education
7% Lack of decent work and poor working conditions7%
19%
29%
35%
10%
0%
10%
20%
30%
40%
50%
60%
70%
80%
90%
100%
% of the gap explained by differences in 5 factors,controlling for age & gender (based on analysis of EQLS
2003-2016)
Decomposing the gap in health status between the richest and poorest quintiles over 36 European countries
Health Services
Income Secur ity and SocialProtection
Living Conditions
Social and Human Capital
Employment and WorkingConditions
10%
18%
21%
40%
11%
0%
10%
20%
30%
40%
50%
60%
70%
80%
90%
100%
% of the gap explained by differences in 5 factors,controlling for age & gender (based on analysis of EQLS
2003-2016)
Decomposing the gap in life satisfaction between the richest and poorest quintiles over 36 European countries
Health Services
Income Security and
Social Protection
Living Conditions
Social and Human
Capital
Employment and
Working Conditions
Decomposing the gap in health status between poorest and richest income quintiles over 36 European countries
(6)
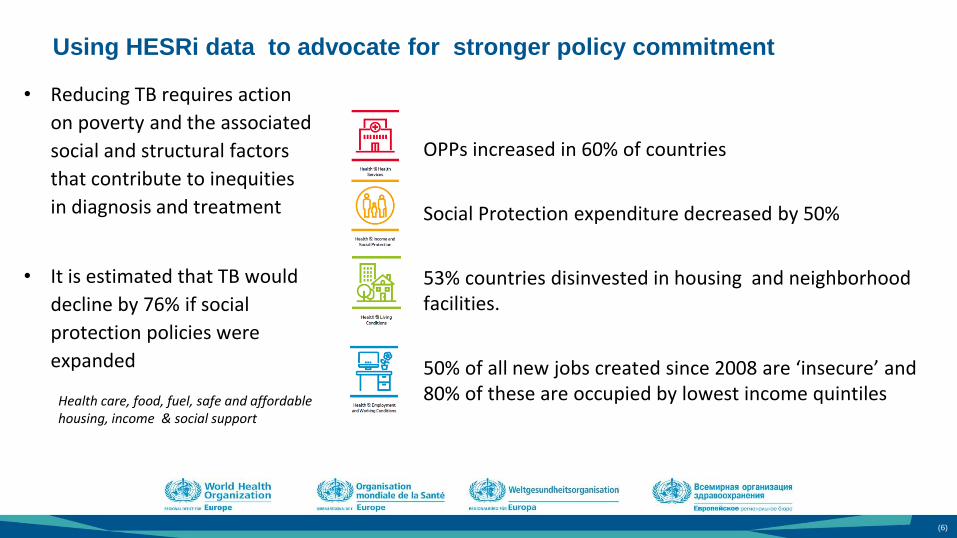
Using HESRi data to advocate for stronger policy commitment
• Reducing TB requires action
on poverty and the associated
social and structural factors
that contribute to inequities
in diagnosis and treatment
• It is estimated that TB would
decline by 76% if social
protection policies were
expanded
Health care, food, fuel, safe and affordable housing, income & social support
OPPs increased in 60% of countries
Social Protection expenditure decreased by 50%
53% countries disinvested in housing and neighborhood facilities.
50% of all new jobs created since 2008 are ‘insecure’ and 80% of these are occupied by lowest income quintiles

(7)
Using HESRi Data to support MOH in advocacy for health equity impact
of government policies
Mental Health is a top EURO Public Health Priority for all countries
▪ One European in six experience mental health problems, and this comes at a cost.
▪ Bottom 20% income quintiles 2x higher rates of mental ill health
▪ On average, mental illness costs EU countries more than 4% of GDP
▪ Direct and indirect effects costs Europe 600 billion euro
Reduction in income inequality through taxation
benefited bottom 10%
Changes to SP policy increased delay to receiving
financial support to bottom 20%
Increase in insecure employment bottom 20%
most affected
Reduced investment in community amenities &
community based organizations. Most
underdeveloped areas adversely affected.

(8)
Inequities in the quality of years of life lived in good health
▪ 1.5 x higher poor mental health
▪ 2.5 x higher poor life satisfaction
▪ 2x higher illness limiting daily life
Gap increased in + 33% of countries in last 10yrs
▪ 2 x higher poor mental health
▪ 3 x higher poor life satisfaction
▪ 2 x higher illness limiting daily life
Gap increased in 20% of countries in last 10yrs

(9)
Reducing Inequities is achievable with visible results in 4 years
Reduce by 1% point
✓ Unemployment
✓ Paying out of pocket for health care
✓ Income Inequality (Gini)
0.1 % GDP investment
✓ Social Protection Expenditure
✓ Labour Market Policies
✓ Housing & Community Amenities
Lives improved from reducing health inequities
Country Population Lives Improved 3m 10,000 lives
60m 225,000 lives 144m 540,000 lives

(10)

(11)
• A 50% reduction in gaps in life expectancy would provide monetized benefits to countries ranging from 0.3% to 4.3% of GDP
▪ Equivalent to $60bn in a country of 60m in central Europe.
Reducing Inequities is a good investment

▪ Opinion polls show having good health is the most important factor for getting ahead in life
▪ The public are concerned about growing inequities.
▪ The more unequal a society, the greater the rates of crime and civil unrest. Both haves and have-nots suffer from living in a society marked by high levels of inequality
▪ High levels of inequality skew future social outcomes and affect the democratic process, and violates our sense of fairness.
▪ In more equals societies everyone benefits even those at the top have better health and quality of life.
Reducing Inequities has strong public support !


Better health for Europe
more equitable and sustainable

Source: WHO EURO HESRi Forthcoming 2019
Average life expectancywithin countries in the WHO
European Region
Gaps in life expectancy within countries in the WHO
European Region
Women 82.0 years 2.3 – 7.4 years
Men 76.2 years 3.4 – 15.5 years

(16)
Childhood Working years Later life
Women 6 19 22
Men 5 17 22
Left unchecked, inequities in health accumulate throughout life

Solutions
▪ Invest in the essential conditions needed to be able to live a healthy life
▪ Implement progressive universal policies
▪ Incentivize growth & development that equalizes health & life chances