
HEALTH FINANCE - cbhidghs.nic.in
48
HEALTH FINANCE INDICATORS CHAPTER FOUR An overview of Public Health Expenditure including pattern of allocations made to Central/State Governments etc.
Transcript of HEALTH FINANCE - cbhidghs.nic.in

H EA LT H F I N A N C EI N D I C A T O R S
C H A P T E R F O U R
AnoverviewofPublicHealthExpenditureincludingpatternofallocationsmadetoCentral/State
Governmentsetc.


4. Health Finance Indicators Page No.
Highlights 168
ExplanatorynotesonHealthData 169
4.1 PublicExpenditureonHealth 172-1774.1.1 PublicExpenditureonHealth2015-16(ActualsinRs.Crores) 1724.1.2 TrendsinPublicExpenditureonHealth 1724.1.3 SchemewiseactualexpenditureonNRHM/NHMforvariousAnnualPlans 175
(in Rs. Crores) 4.1.4 PublicexpenditureonhealthbycomponentsacrossStates,2015-16 176
(Actuals in Rs. Crores)4.1.5 ExpenditureonHealth:PerCapita,asshareofTotalExpenditureandasshareof 177
GSDPforallState&UnionTerritories,2015-164.2 AverageExpenditureperHospitalizationCaseonHealth 179-1824.2.1 AverageMedicalandotherrelatednon-medicalexpenditureperhospitalizationcase 179
foreachquintileclassofUMPCE(inRs)4.2.2(a) AverageMedicalExpenditureandNon-MedicalExpenditureonaccountof 180
hospitalizationperhospitalizationcaseforeachState/UT,GenderandSector(Rural) (in Rs.)
4.2.2(b) AverageMedicalExpenditureandNon-MedicalExpenditureonaccountof 181 hospitalizationperhospitalizationcaseforeachState/UT,GenderandSector(Urban) (in Rs.)
4.2.3 Averagetotalmedicalexpenditureperchildbirthasinpatientoverlast365daysby 182 typeofhospitalandquintileclassofUMPCE(inRs)
4.2.4 MajorSourceofFinanceforhospitalizationexpenditureforhouseholdsindifferent 182 quintileclassesofUMPCE(percentagedistribution)
4.3 HealthCoverageandInsurance 183-1864.3.1 ExpenditureonCGHS 1834.3.2 Coverageason31stMarch2017 1844.3.3 TrendsinCoverage,IncomeandExpenditureonESIC 1844.3.4 TrendsinexpenditureonRSBY 1854.3.5 HealthInsurance(ExcludingTravel–Domestic/OverseasandPersonalAccident) 186
Policies,GrossPremiumandNumberofPersonsCovered,2016-174.4 PublicExpenditureonHealth-InternationalComparison 188-1904.4.1 CountrieswithUHCorsignificantprogresstowardsUHC 190 Annexure 192-212

168 National Health Profile 2018
Health Financing in India
Highlights
Healthfinancingsystemsarecriticalforreachinguniversalhealthcoverage.Healthfinancingleverstomovecloser to universal health coverage lie in three interrelated areas: raising funds for health; reducingfinancialbarrierstoaccessthroughprepaymentandsubsequentpoolingof funds inpreferencetodirectout-of-pocketpayments;andAllocatingorusingfundsinawaythatpromotesefficiencyandequity.Developmentsinthesekeyhealthfinancingareaswilldeterminewhetherhealthservicesexistandareavailableforeveryoneandwhetherpeoplecanaffordtousehealthserviceswhentheyneedthem.
Health Finance indicators provide an understanding of patterns of investments, expenditure, sourcesof fundingandproportionofallocationvis-à-visother totalallocations. Italsoprovidesan important tool tounderstandhealthoutcomesinrelationtotheexpenditure.
Totalpublicexpenditureonhealthfortheyear2015-16stoodatRs1.4lakhcrores.(Table4.1.1) PercapitapublicexpenditureonhealthinnominaltermshasgoneupfromRs621in2009-10toRs
1112in2015-16.(Table4.1.2) PublicexpenditureonhealthasapercentageofGDPwas1.02%in2015-16.Thereisnosignificant
changeinexpendituresince2009-10.(Table4.1.2) TheCentre-Stateshareintotalpublicexpenditureonhealthwas31:69in2015-16.(Figure4.1.1) Totalpublicexpenditureonhealth(excludingotherCentralMinistries)in2015-16wasRs140,054
crores,withMedicalandPublicHealthcomprisingthemajorshare(78.7%). TheshareofFamilyWelfarewas12.6%.(Figure4.1.2)
Urbanandruralhealthservicesconstituted71%ofthepublicexpenditureonmedicalandpublichealthin2015-16.(Figure4.1.3)
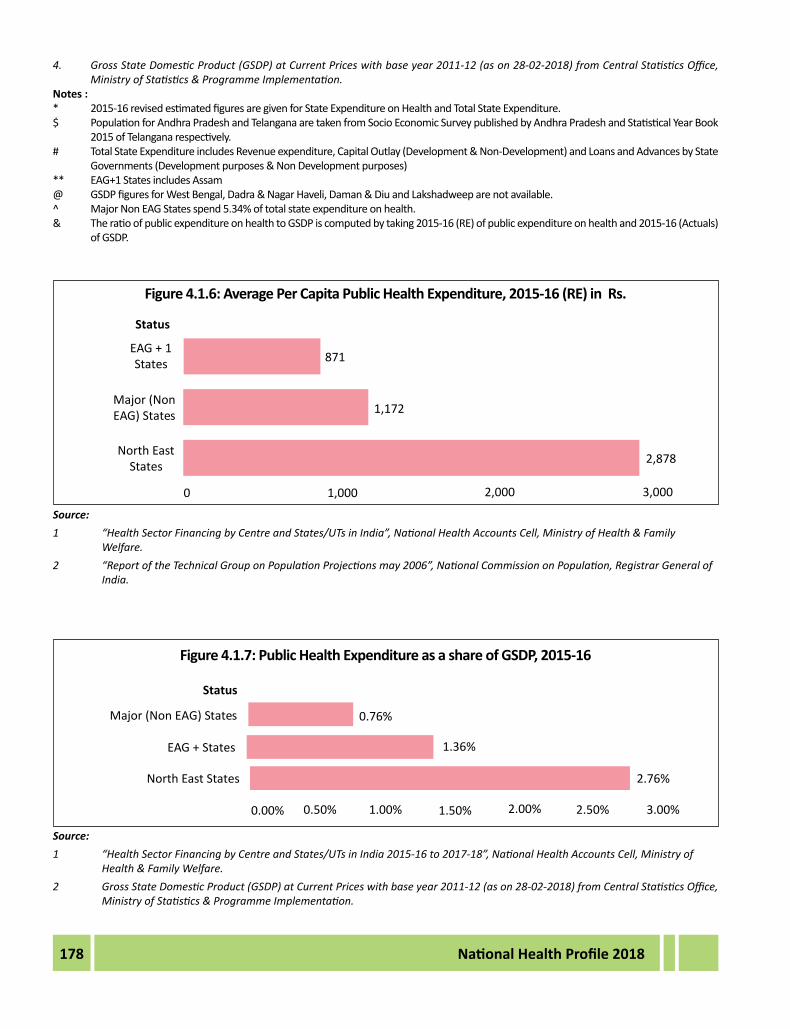
TheNorth-EasternstateshadthehighestandEAGstates(includingAssam)hadthelowestaveragepercapitapublicexpenditureonhealthin2015-16(excludingUTs).(Table4.1.5)
TheNorthEasternstateshadthehighestpublichealthexpenditureasapercentageofGSDPin2015-16(2.76%).Thevaluewas1.36%forEAG(includingAssam)and0.76%formajornon-EAGstates.(Table4.1.5)
BasedonHealth Survey (71st round) conductedbyNSSO,Averagemedical expenditure incurredduringstayathospitalfromJan2013-Jun2014wasRs.14,935forruralandRs.24,436forurbaninIndia.(Table4.2.2(a)andTable4.2.2(b))
Averagetotalmedicalexpenditureperchildbirthasinpatientoverlast365days(surveyconductedfromJantoJun2014)inapublichospitalinruralareaisRs.1,587andinurbanareaisRs.2,117.(Table4.2.3)
Around 43 crore individualswere covered under any health insurance in the year 2016-17. Thisamounts to34%of the totalpopulationof India.79%of themwerecoveredbypublic insurancecompanies.(Table4.3.5)
Overall, 80% of all persons covered with insurance fall under Government sponsored schemes.(Table4.3.5)
Public insurance companies had a higher shareof coverage andpremium for all typesof healthinsurancepolicies,exceptfamilyfloaterpoliciesincludingindividualpolicies.(Table4.3.5)
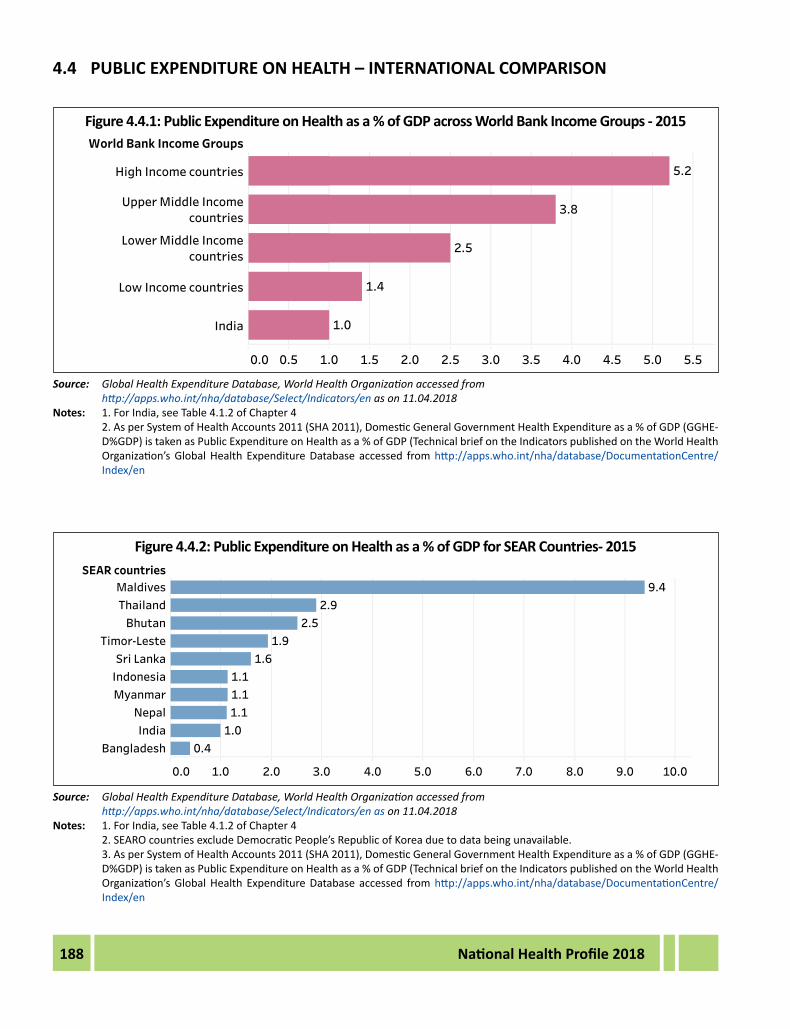
ComparedtocountriesthathaveeitherUniversalHealthCoverageormovingtowardsit,India’spercapitapublicspendingonhealthislow.(Figure4.4.3andTable4.4.1)

169National Health Profile 2018
ExplanatoryNotesonHealthData
BudgetEstimates (BE):The ‘BudgetEstimate’ foranyministryorscheme is theamountallocatedto it in thebudgetpapersforthefollowingyear.Forinstance,inthebudgetspeechinFebruary2018,theFinanceMinisterpresentedbudgetestimatesforexpendituresundervariousheadsforthe2018-19financialyearwhichrunsfromApril2018toMarch2019.
Revised Estimates (RE): Once the financial year gets underway, someministriesmay needmore funds thanwasactuallyallocatedtothemunderthebudgetestimates.Thegovernmentapproachesparliamentwithsuchsupplementaryrequests for fundsduringthecourseof thefinancialyear (in themonsoonorwintersession).Thesesupplementarydemandsarereflectedintherevisedestimatesforthecurrentyear(2016-17).Thus,alongwithbudgetestimatesfor2017-18,theFinanceMinisterpresentstherevisedestimatesfor2016-17.
Actuals:Actualexpendituresarethefinalamountsspentunderdifferentheadsandmayexceed(orfallshortof)theRevisedEstimates.Sincetheactualexpenditurecanonlybeassessedoncethefinancialyearisoverandfinalaccountshavebeenprepared,theActualexpenditurespresentedinthebudgetpapersarefortheearlierfinancialyeari.e.fortheyear2015-16.
1. PUBLICEXPENDITUREONHEALTH
ThethreemaincategoriesofpublicexpenditureonhealthareMedicalandPublicHealth,FamilyWelfareandOthers.Theseareexplainedbelow.
1.1 Medical&PublicHealth
MedicalandPublicHeathundertheDepartmentofHealthdealswithhealthcare,includingawarenesscampaigns,immunizationcampaigns,preventivemedicine,andpublichealth.Thisincludesthefollowing7categories.
1.1.1.UrbanHealthServices-Allopathywhich includesDirectionandAdministration, Employees StateInsurance Scheme, Central Government Health Scheme, Medical Stores Depots, DepartmentalDrugManufacture,SchoolHealthScheme,HospitalandDispensaries,OtherHealthSchemes,Otherexpenditure.
1.1.2.Rural Health Services- Allopathywhich includes Health Sub-centres, Subsidiary Health Centres,PrimaryHealthCentres,CommunityHealthCentres,HospitalsandDispensaries,OtherExpenditure.
1.1.3.UrbanandRuralHealthServices-OthersystemsofmedicinewhichincludesAyurveda,Homeopathy,Unani,Siddha,OtherSystems
1.1.4.Medical Education Research and Trainingwhich includes expenditure onmedical research andtraininginstitutionssuchasJ.I.P.M.E.R,LadyHardingeMedicalCollegeetc.
1.1.5.Public Health which includes Direction and Administration, Training, Prevention and Control ofdiseases,Preventionoffoodadulteration,DrugControl,ManufactureofSera/Vaccine,PublicHealthLaboratories,PublicHealthEducation,PublicHealthPublicity,OtherSystems,OtherExpenditure.
1.1.6.GeneralwhichincludesHealthStatistics&Evaluation,InternationalCo-operation,Otherexpenditure.
1.1.7.DeductRecoverieswhichincludesreceiptsbywayofrecoverieswhicharetobeadjustedagainstoverallexpenditure.

170 National Health Profile 2018
1.2FamilyWelfare
The Department of Family Welfare (FW) is responsible for aspects relating to family welfare, especially inreproductivehealth,maternalhealth,paediatrics,information,educationandcommunications;cooperationwithNGOsandinternationalaidgroups;andruralhealthservices.FamilyWelfareincludesDirectionandAdministration,Training,ResearchandEvaluation,RuralFamilyWelfareServices,UrbanFamilyWelfareServices,MaternityandChildHealth,Transport,Compensation,MassEducation,SelectedareaProgrammes(includingIndiapopulationproject),ReproductiveandChildHealthProgramme,AssistancetoPublicsectorandotherundertakings,AssistancetoLocalBodies,OtherServicesandSupplies,InternationalCo-operation,OtherExpenditure.
1.3Others
ForCentralgovernment,itincludesMedicalreimbursement/MedicalTreatmentexpenditure,Otherdepartmentsexpenditurewithinthehealthdemand,SecretariatSocialServiceExpenditure(2251),andmedicalexpenditurebyMinistry ofDefence, Labour& Employment, Railways, Science and Technology,Mines andPost. For StateGovernmentsthisdefinitionwouldexcludemedicalexpenditurebyMinistryofDefence,Labour&Employment,Railways,ScienceandTechnology,MinesandPost.
Apartfromtheabove3categoriesofpublicexpenditure,wefurtherdefinethecomponentsofNationalHealthMission,oneofthemainprogrammesofthegovernment.Itincludesthefollowing8components:
a. NRHM-RCH Flexible Pool which includes: RCH Flexible Pool, Routine Immunisation, Pulse PolioImmunisation,IodineDeficiencyDisorderControlProgramme
b. HealthSystemStrengtheningunderNRHM
c. NationalUrbanHealthMission-FlexiblePool
d. FlexiblePool forCommunicableDiseaseswhich includesNationalVectorBorneDiseaseControlProgram,National T.B.Control Programme, National LeprosyEradicationProgramme, IntegratedDiseaseSurveillanceProgramme
e. FlexiblePoolforNon-CommunicableDiseases,Injury&TraumawhichincludesNationalProgrammeforControlofBlindness,NationalMentalHealthProgramme,HealthCarefortheElderly,NationalProgrammeforPrevention&ControlofDeafness,NationalTobaccoControlProgramme,NationalOralHealthProgramme,AssistancetoStatesforCapacityBuilding,NationalProgrammeforPreventionandControlofCancer,Diabetes,CVDandStroke,OtherNewInitiativesunderNon-CommunicableDiseases.
f. MiscellaneousProgrammeswhich includes (1) ForwardLinkages toNRHMand (2)PilotProjectswhichincludesSportsMedicine,Deafness,LeptospirosisControl,ControlofHumanRabies,MedicalRehabilitation,OralHealth,Fluorosis
g. HumanResourcesforHealth
Finally,EAGorEmpoweredActionGroupofStatesreferstothe8eightstatesofBihar,Jharkhand,Rajasthan,Madhya Pradesh, Chhattisgarh,Orissa, Uttar Pradesh, Uttarakhandwhich are relatively populous resulting inchallengesinsocio-economicdevelopment.
2. AVERAGEHOUSEHOLDEXPENDITUREPERHOSPITALISATIONCASE:
ExpenditureonHospitalizationandLevelofLiving:Averageexpenditureincurredonacaseofhospitalizationbyhouseholdsbelongingtoquintileclassesofmonthlypercapitaconsumerexpenditure,widelyconsideredto
171National Health Profile 2018
reflecttheleveloflivingofahousehold,separatelyformedicalandotherexpenditureforboththesectorsaretabulatedinthissection.
Expenditureincurredperchildbirthatpublicandprivatesourceseparatelyfortheruralandurbanareasisalsotabulated.Further,thecontributionsofdifferentsourcesoffinancing,ifnotcoveredbysomehealthprotectionscheme,tomeetthetotalexpenditureonhospitalizationisalsoincludedinthissection.
3. HEALTHINSURANCE:
3.1 FamilyFloaterInsurancePolicies:FamilyFloaterisonesinglepolicythattakescareofthehospitalizationexpensesoftheentirefamily.Thepolicyhasonesinglesuminsured,whichcanbeutilisedbyany/allinsuredpersonsinanyproportionoramountsubjecttomaximumofoveralllimitofthepolicysuminsured.
3.2 GroupInsurancePolicies:Groupinsurancepoliciesarethoseinwhichasinglemasterpolicyinthenameofagroupisissuedtothemanagerofthegroup.Groups,forthispurpose,canbeemployer-employeegroupsornonemployer-employeegroupsasdefinedbyIRDA’sgroupinsuranceguidelines.(Examplesaresavingsbankaccountholdersofabankormembersofthesamesocialorculturalassociationetc.)
4. INTERNATIONALCOMPARISONOFHEALTHFINANCINGINDICATORS:
SEARO-South-EastAsiaRegionalOffice:referstotheWHOregionconsistingofthefollowing10countries:
Bhutan, Bangladesh, Democratic People’s Republic of Korea, India, Maldives, Myanmar, Nepal, Sri Lanka,Thailand,Timor-Leste.
UHCServiceCoverageIndex:Coverageofessentialhealthservices(definedastheaveragecoverageofessentialservicesbasedontracerinterventionsthatincludereproductive,maternal,newbornandchildhealth,infectiousdiseases, non-communicable diseases and service capacity and access, among the general and the mostdisadvantagedpopulation).UHCServiceCoverageIndexof80andaboveisincludedinthissection.

172 National Health Profile 2018
4.1.2:TrendsinPublicExpenditureonHealth
Year PublicExpenditureon Health
(inRs.Crores)#
Population(inCrores)$
GDP* PercapitaPublicExpenditureonHealth(inRs.)
PublicExpenditureonHealthasPercentageof
GDP(%)
2009-10 72536 117 6477827 621 1.12
2010-11 83101 118 7784115 701 1.07
2011-12 96221 120 8736039 802 1.10
2012-13 108236 122 9951344 890 1.09
2013-14 112270 123 11272764 913 1.00
2014-15 121600.23 125 12433749 973 0.98
2015-16 140054.55 126 13764037 1112 1.02
2016-17(RE) 178875.63 128 15253714 1397 1.17
2017-18(BE) 213719.58 129 16751688 1657 1.28Source: # Public expenditure on Health from “Health Sector Financing by Centre and States/UTs in India 2015-16 to 2017-18”, National Health
Accounts Cell, Ministry of Health & Family Welfare.$ “Report of the Technical Group on Population Projections May 2006”, National Commission on Population, Registrar General of
India* GDP from Central Statistics Office.
Note: GDPfiguresfrom2011-12to2015-16releasedvidepressnotedated31stJanuary,2017weresubsequentlyrevisedbyincorporatingthenewseriesof Indexof IndustrialProduction(IIP)andWholesalePrice Index(WPI)releasedon31stMay,2017areavailableatCentralStatisticsOffice,MinistryofStatistics&ProgrammeImplementation.SecondrevisedestimatesofGDParegivenin2011-12,2012-13,and2013-14.
4.1PublicExpenditureonHealth
4.1.1:PublicHealthExpenditureonHealth2015-16(ActualsinRs.Crores)
S.No. Heads 2015-16
StateBudgetincludingCentralGrants(includingTreasuryRoute) 115933.76
1 StateBudget(OwnExpenditure) 95310.95
2 CentreMOHFW 35189.49
Central Grants Through Treasury 20622.81
3601 20379.49
3602 243.31
Other(CentralGovt.Hospitals/Institutions,etc.) 14566.69
3 Other Central Ministries* 8642.18
4 UTs 911.92
5 GrandTotal(1+2+3+4) 140054.55Source: “Health Sector Financing by Centre and States/UTs in India 2015-16 to 2017-18”, National Health Accounts Cell, Ministry of Health
& Family Welfare

173National Health Profile 2018
2009-10 2010-11 2011-12 2012-13 2013-14 2014-15 2015-16 2016-17 2017-18 (RE) (BE)
64% 65% 65% 67% 66% 67% 69% 71% 63%
36% 35% 35% 33% 34% 33% 31% 29% 37%
100%
80%
60%
40%
20%
0%
Year
Centre
State
Source: “Health Sector Financing by Centre and states/UTs in India 2015-16 to 2017-18”, National Health Accounts Cell, Ministry of Health & Family Welfare
Figure4.1.2:Composition(%)ofTotalPublicExpenditureonHealthin2015-16
Source: “Health Sector Financing by Centre and states/UTs in India 2015-16 to 2017-18”, National Health Accounts Cell, Ministry of Health & Family Welfare
Notes: Forexplanations,pleaserefertoDescriptiononPage169* Others include Medical reimbursement/ Medical Treatment expenditure, other departments’ expenditure within the health
demand,SecretariatSocialServiceExpenditure(2251),andmedicalexpenditurebyMinistryofDefence,Labour&Employment,Railways,Science&technology,Mines&Post.
12.6%
8.8%
78.7%
FamilyW elfare
Medical&PublicHealth
Othe rs*
GrandTotal=140054Crores
Figure4.1.1:TrendsinCentre-Stateshare(%)inTotalPublicExpenditureonHealth

174 National Health Profile 2018
Figure4.1.4:Composition(%)ofPublicExpenditureofStatesonFamilyWelfarein2015-16
Source: “Health Sector Financing by Centre and States/UTs in India 2015-16 to 2017-18”, National Health Accounts Cell, Ministry of Health & Family Welfare.
Notes: * Miscellaneous includes8 items (Research&Evaluation,Transport,Compensation,MassEducation, SelectedAreaProgramme,
ReproductiveChildHealthProgramme,AssistancetoPublicSectorandotherUndertakings,InternationalCooperation)andDeductRecoveries.
** ThistotaldiffersfromthetotalinTable4.1.1becauseitexcludesallUTs.
GrandTotal=16713.9Crores**
6% 1%
25%
2%
12%5%9%
15%
23%
1% Training
RuralFamilyWelfareServices
UrbanFamilyWelfareServices
Maternity&ChildHealth
AssistancetoLocalBodies
OtherServices&Supplies
TribalAreaSpecialComponentPlanforSC&ScheduledCasteComponentPlan
OtherExpenditure
Figure4.1.3:CompositionofPublicExpenditureofStatesonMedical&PublicHealthin2015-16
Source: “Health Sector Financing by Centre and States/UTs in India 2015-16 to 2017-18”, National Health Accounts Cell, Ministry of Health & Family Welfare.
Notes: *Miscellaneousincludestheitems“General”and“DeductRecoveries”** ThistotaldiffersfromthetotalinTable4.1.1becauseitexcludesallUTs.
GrandTotal=95828Crores**
39%
5%25%
2%
12%
13%4%
UrbanHealthServices-Allopathy
UrbanHealthServices-OtherSystemofMedicine
Rural Health Services -Allopathy
RuralHealthServices-OtherSystemofMedicine
PublicHealth
Miscellaneous*

175National Health Profile 2018
4.1.3SchemewiseActualExpenditureonNRHM/NHMforvariousAnnualPlans(inRs.Crores)
S.No. NameofScheme 2015-16 2016-17 2017-18(RE) 2018-19(BE)A NRHM-RCHFlexiblePool 10608.23 11125.91 15941.25 15006.33B NationalUrbanHealthMission-FlexiblePool 717.49 490.74 652.05 875.00C FlexiblePoolforCommunicableDiseases 1260.17 1173.38 2648.33 1928.00D FlexiblePoolforNon-CommunicableDiseases,injury&
Trauma392.19 507.77 955.00 1004.67
E Infrastructure Maintenance 5175.05 5271.10 5517.54 5693.41F StrengtheningofStateDrugRegulatorySystem 22.00 52.35 206.00G PrimeMinister'sDevelopmentPlanforJ&K 0.00 275.00 287.93 273.71H StrengtheningofNationalProgrammeManagementof
the NHM 100.00
I ForwardLinkagestoNRHM 59.30 27.54 J PilotProjects 23.05 26.30 30.03 40.00K HumanResourcesforHealth 46.90 31.69 26.18 27.49L HumanResourcesforHealth&MedicalEducation* 0.00 4025.00 4225.00M TertiaryCare* 0.00 665.90 750.00 Total 18282.38 18951.43 30801.56 30129.61
Source: Budget NRHM/NHM Section, Ministry of Health & Family WelfareNote: *SchemestransferredtoNHM
Figure4.1.5:ApprovedOutlayforNHM,2018-19
Source: Budget NRHM/NHM Section, Ministry of Health & Family WelfareNotes: * Miscellaneous include items Strengthening of State Drug Regulatory System, Prime Minister’s Development Plan for J & K,
StrengtheningofNationalProgrammeManagementoftheNHM,ForwardLinkagestoNRHM,PilotProjects,HumanResourcesforHealthandTertiaryCare.
GrandTotal=30129.61Crores**
50%
3%6%3%
19%
14%
5%
NRHM-RCHFlexiblePool
FlexiblePoolforCommunicableDiseases
FlexiblePoolforNon-CommunicableDiseases,injury&Trauma
Infrastructure Maintenance
Miscellaneous*

176 National Health Profile 2018
4.1.4PublicexpenditureonhealthbycomponentsacrossStates,2015-16(ActualsinRs.Crores)
State/UT Medical&PublicHealth FamilyWelfare Others Grand TotalUHS RHS MERT PH Misc# Total UFWS RFWS MCH Misc# Total
Major(NonEAG)StatesAndhra Pradesh 2007 888 373 343 243 3853 0 175 48 1131 1354 140 5347Delhi 2798 6 156 293 317 3570 4 0 1 59 64 125 3759Goa 289 103 88 50 31 562 0 10 0 2 12 1 575Gujarat 3034 1213 522 1466 35 6270 108 253 324 170 855 74 7199Haryana 785 862 555 179 2 2384 3 101 7 30 141 181 2706HimachalPradesh 357 476 262 34 0 1129 10 72 0 206 288 116 1533Jammu&Kashmir 316 919 554 75 0 1863 0 17 0 43 60 31 1954Karnataka 1433 1204 1160 455 941 5193 14 0 64 559 637 186 6015Kerala 1700 706 980 728 221 4336 0 372 0 64 436 0 4772Maharashtra 3418 558 813 4567 7 9363 17 472 65 92 645 44 10052Punjab 1217 514 263 195 222 2410 11 113 0 73 197 194 2801TamilNadu 2708 923 863 489 1250 6234 75 347 1179 510 2111 180 8525Telangana 2066 495 242 261 120 3184 0 85 45 445 575 189 3948WestBengal 3910 2429 610 288 -2 7234 0 177 0 447 624 117 7976Total 26037 11297 7440 9423 3387 57585 243 2193 1732 3831 7999 1578 67162EAG+1StatesAssam 292 1727 411 180 28 2638 3 170 14 37 224 2 2864Bihar 1917 1737 474 79 0 4206 2 330 4 29 365 82 4653Chhattisgarh 743 1465 167 146 7 2528 2 162 0 17 181 45 2754Jharkhand 1466 329 202 101 0 2098 1 60 3 12 75 9 2182Madhya Pradesh 3440 871 289 398 74 5073 17 0 0 364 381 69 5523Odisha 1388 1489 358 268 10 3515 8 89 0 69 166 63 3744Rajasthan 1829 1892 746 849 0 5315 20 0 0 2422 2443 61 7818UttarPradesh 2686 4378 1486 430 6 8986 49 1039 273 3105 4465 345 13796Uttarakhand 442 632 115 167 0 1357 4 93 0 11 108 32 1496Total 14204 14520 4249 2619 125 35716 107 1943 293 6065 8408 707 44831NorthEastStatesArunachal Pradesh 165 226 5 68 26 490 2 5 0 19 25 21 536Manipur$ 469 16 486Meghalaya 234 137 4 32 155 561 0 27 8 8 44 39 644Mizoram 106 98 3 134 6 347 1 26 0 5 32 72 451Nagaland 202 107 5 127 0 441 0 0 0 24 24 0 465Sikkim 174 36 1 32 0 243 1 10 0 7 18 1 262Tripura 266 102 29 45 3 446 0 0 35 129 165 0 610Total 1147 706 46 438 190 2997 3 67 44 192 323 133 3453AllStates 41388 26523 11736 12479 3702 96297 353 4204 2069 10088 16730 2418 115446UnionTerritories(UT)Andaman&Nicobar 302 13 315Chandigarh 358 16 374Dadra&NagarHaveli 100 0 101Daman&Diu 63 1 64Lakshadweep 55 3 58Puducherry 282 41 108 25 25 480 0 4 0 3 7 0 488TotalUT's 282 41 108 25 25 1359 0 4 0 3 7 33 1400Source: “Health Sector Financing by Centre and States/UTs in India 2015-16 to 2017-18”, National Health Accounts Cell, Ministry of Health
& Family Welfare.Notes : # Misc(Miscellaneous)includesexpenditureunderMedical&PublicHealthaswellasFamilyWelfarethathaveveryinsignificantindividual
values and are inclusive of deducted recoveries.* Othersincludemedicalreimbursement/medicalTreatmentexpenditure,otherdepartments’expenditurewithinthehealthdemand.** DataforEAG+1StatesisinclusiveofAssam.$ OnlyaggregatefiguresareavailableforManipur.

177National Health Profile 2018
4.1.5Publicexpenditureonhealthbycomponentsacrossstates,2015-16(ActualsinRs.Crores)
State/UT TotalStateExpenditureon
Health (Rs.InCrores)1
TotalStateExpenditure
(Rs.InCrores)2#
HealthExpenditureasa%ofTotalState
Expenditure
Population2015-16
(inCrores)3
GSDP2015-16Current Prices (RsinCrores)4
Per Capita Health
Expenditure(Rs)
Health Expenditure
asa%ofGSDP
(1) (2) (3)=(1)/(2) (4) (5) (6)@=(1)/(4) (7)=(1)/(5)Major(NonEAG)StatesAndhra Pradesh$ 5013 106638 4.70% 4.95 609934 1013 0.82%Delhi 4183 36520 11.45% 2.10 548081 1992 0.76%Goa 729 12010 6.07% 0.20 54275 3643 1.34%Gujarat 7432 126821 5.86% 6.25 1025188 1189 0.72%Haryana 3055 85037 3.59% 2.73 485184 1119 0.63%HimachalPradesh 1894 28373 6.67% 0.71 112852 2667 1.68%Jammu&Kashmir 2925 49294 5.93% 1.24 119093 2359 2.46%Karnataka 6980 138715 5.03% 6.21 1012804 1124 0.69%Kerala 5207 88960 5.85% 3.56 557947 1463 0.93%Maharashtra 12066 237327 5.08% 11.94 2001223 1011 0.60%Punjab 3400 57963 5.87% 2.90 391543 1173 0.87%TamilNadu 8543 171349 4.99% 6.92 1161963 1235 0.74%Telangana 4626 96297 4.80% 3.50 567588 1322 0.82%WestBengal 7239 135929 5.33% 9.31 n.a 778 Major(NonEAG)States^ 5.34% 1172 0.76%EAG+1States**Assam 4992 70428 7.09% 3.23 226276 1546 2.21%Bihar 5067 128706 3.94% 10.33 381501 491 1.33%Chhattisgarh 3480 65898 5.28% 2.57 260776 1354 1.33%Jharkhand 2891 59995 4.82% 3.34 231294 866 1.25%Madhya Pradesh 5535 132647 4.17% 7.73 530443 716 1.04%Odisha 3921 81741 4.80% 4.23 330874 927 1.19%Rajasthan 9858 175589 5.61% 7.25 683758 1360 1.44%UttarPradesh 15872 312811 5.07% 21.64 1119862 733 1.42%Uttarakhand 1871 30799 6.07% 1.06 175772 1765 1.06%EAG+1States 5.05% 871 1.36%NorthEastStatesArunachal Pradesh 673 11740 5.73% 0.13 20433 5177 3.29%Manipur 536 9841 5.45% 0.26 19233 2061 2.79%Meghalaya 623 9253 6.73% 0.28 25967 2223 2.40%Mizoram 645 7731 8.34% 0.11 15339 5862 4.20%Nagaland 588 10156 5.79% 0.24 19816 2450 2.97%Sikkim 308 5431 5.66% 0.06 16954 5126 1.81%Tripura 829 12537 6.62% 0.38 34368 2183 2.41%NorthEastStates 6.30% 2878 2.76%UnionTerritories(UT)***Andaman&Nicobar 310 n.a - 0.05 5932 6201 5.23%Chandigarh 378 n.a - 0.17 28643 2224 1.32%Dadra&NagarHaveli 98 n.a - 0.04 n.a 2451 -Daman&Diu 62 n.a - 0.03 n.a 2073 -Lakshadweep 60 n.a - 0.01 n.a 6018 -Puducherry 534 6062 8.82% 0.16 25060 3340 2.13%UnionTerritories(UT) 3137 2.42%Source: 1. “Health Sector Financing by Centre and States/UTs in India 2015-16 to 2017-18”, National Health Accounts Cell, Ministry of Health
& Family Welfare.2. State Finances : A Study of Budgets, Reserve Bank of India3. “Report of the Technical Group on Population Projections may 2006”, National Commission on Population, Registrar General of India
178 National Health Profile 2018
4. Gross State Domestic Product (GSDP) at Current Prices with base year 2011-12 (as on 28-02-2018) from Central Statistics Office, Ministry of Statistics & Programme Implementation.
Notes : * 2015-16revisedestimatedfiguresaregivenforStateExpenditureonHealthandTotalStateExpenditure.$ PopulationforAndhraPradeshandTelanganaaretakenfromSocioEconomicSurveypublishedbyAndhraPradeshandStatisticalYearBook
2015ofTelanganarespectively.# TotalStateExpenditureincludesRevenueexpenditure,CapitalOutlay(Development&Non-Development)andLoansandAdvancesbyState
Governments(Developmentpurposes&NonDevelopmentpurposes)** EAG+1StatesincludesAssam@ GSDPfiguresforWestBengal,Dadra&NagarHaveli,Daman&DiuandLakshadweeparenotavailable.^ MajorNonEAGStatesspend5.34%oftotalstateexpenditureonhealth.& TheratioofpublicexpenditureonhealthtoGSDPiscomputedbytaking2015-16(RE)ofpublicexpenditureonhealthand2015-16(Actuals)
of GSDP.
Figure4.1.6:AveragePerCapitaPublicHealthExpenditure,2015-16(RE)inRs.
Source: 1 “Health Sector Financing by Centre and States/UTs in India”, National Health Accounts Cell, Ministry of Health & Family
Welfare.2 “Report of the Technical Group on Population Projections may 2006”, National Commission on Population, Registrar General of
India.
Status
EAG+1States
Major(NonEAG) States
North EastStates
871
1,172
0 2,000 3,000
2,878
Figure4.1.7:PublicHealthExpenditureasashareofGSDP,2015-16
Source: 1 “Health Sector Financing by Centre and States/UTs in India 2015-16 to 2017-18”, National Health Accounts Cell, Ministry of
Health & Family Welfare.2 Gross State Domestic Product (GSDP) at Current Prices with base year 2011-12 (as on 28-02-2018) from Central Statistics Office,
Ministry of Statistics & Programme Implementation.
Status
Major(NonEAG)States
EAG+States
North East States
0.76%
1.36%
2.76%
3.00%2.50%2.00%1.50%1.00%0.50%0.00%

179National Health Profile 2018
4.2 AverageHouseholdExpenditureperhospitalizationcase4.2.1 AverageMedicalandotherrelatednon-medicalexpenditureperhospitalizationcaseforeachquintile
classofUMPCE(inRs.)
QuintileClassofUMPCE* AverageExpenditureduringstayathospital
Medical Other Total
Rural Urban Rural Urban Rural Urban
1 10146 11199 1658 1317 11805 12516
2 11276 14533 1791 1620 13067 16153
3 10326 17926 1766 1772 12092 19697
4 13482 24776 1879 2131 15361 26907
5 21293 42675 2458 2743 23752 45418
All 14935 24436 2021 2019 16956 26455
Source: “Key Indicators of Social Consumption in India- Health, 2014, NSS 71st Round”, Ministry of Statistics & Programme ImplementationNotes:* This refers to the5quintile classesof theRural/UrbanALL-INDIAdistribution (Estimateddistribution)ofhouseholdsbyUsual
MonthlyPerCapitaExpenditure(UMPCE)

180 National Health Profile 2018
4.2.2(a)AverageMedicalExpenditureandNon-MedicalExpenditureonaccountofhospitalizationperhospitalizationcaseforeachState/UT,GenderandSector(Rural)(inRs.)
RURALState/UT avg.med.exp.duringstayat
hospitalavg.ofothermed.exp.onaccount
ofhospitalizationTotalexpenditure
Male Female Person Male Female Person Male Female Person(1) (2) (3) (4) (5) (6) (7) (8) (9) (10)
Andhra Pradesh 15683 10058 13227 2546 1717 2184 18229 11774 15411Arunachal Pradesh 5882 5468 5678 2441 2283 2363 8323 7752 8042Assam 7313 6563 6966 1738 1341 1554 9051 7905 8520Bihar 12918 10124 11432 2319 2084 2194 15237 12208 13626Chhattisgarh 10429 14030 12149 1735 2069 1895 12164 16099 14043Goa 16408 52043 30613 1343 1981 1597 17752 54024 32211Gujarat 26096 34211 29954 3035 2014 2550 29131 36225 32503Haryana 17576 10619 14298 1447 1267 1362 19023 11886 15660HimachalPradesh 23241 12645 18341 2914 2243 2604 26155 14888 20945Jammu&Kashmir 23382 15238 18860 2595 3584 3144 25977 18823 22004Jharkhand 9845 7141 8442 2694 2001 2334 12539 9142 10777Karnataka 10231 10479 10351 1753 2731 2227 11984 13210 12578Kerala 15948 12039 14091 2153 1887 2027 18101 13926 16118Madhya Pradesh 24060 10815 17642 1901 1574 1743 25961 12389 19385Maharashtra 18696 7853 13090 2528 1962 2236 21224 9816 15326Manipur 21856 18776 20475 2216 1758 2011 24072 20534 22486Meghalaya 5311 6810 6061 2859 3135 2997 8170 9945 9058Mizoram 1696 2500 2075 2171 1858 2023 3867 4358 4098Nagaland 9749 7893 8744 3085 2758 2908 12833 10651 11652Odisha 7987 3024 5628 2469 1739 2122 10456 4763 7750Punjab 12749 7920 10240 2514 2248 2376 15262 10168 12616Rajasthan 40400 17559 27718 2418 1776 2061 42817 19335 29779Sikkim 14419 11359 12855 3070 2453 2755 17489 13812 15609TamilNadu 10860 6360 8035 5183 4275 4613 16042 10636 12648Telangana 13920 9839 11842 2397 1865 2126 16317 11704 13968Tripura 13325 26939 19664 2068 1963 2019 15393 28902 21683UttarPradesh 7858 3324 5694 1915 1144 1547 9773 4468 7242Uttarakhand 22134 15765 18693 2157 1683 1901 24291 17449 20594WestBengal 8400 10171 9162 1305 1327 1314 9705 11498 10476A&NIslands 13148 9508 11327 1619 1409 1514 14766 10917 12841Chandigarh 4926 537 3373 883 1217 1001 5809 1753 4374D&NHaveli 16932 15631 16389 1695 2278 1938 18626 17909 183277Daman&Diu 5606 820 4219 637 954 729 6243 1774 4948Delhi 9633 11213 10223 1073 949 1027 10706 12162 11250Lakshadweep 13821 5100 10418 4998 3334 4349 18819 8434 14766Puducherry 10203 5636 7965 2482 1350 1928 12685 6987 9893All 17528 12295 14935 2199 1841 2021 19727 14136 16956Source: “Key Indicators of Social Consumption in India- Health, 2014, NSS 71st Round”, Ministry of Statistics & Programme Implementation

181National Health Profile 2018
4.2.2(b)AverageMedicalExpenditureandNon-MedicalExpenditureonaccountofhospitalizationperhospitalizationcaseforeachState/UT,GenderandSector(inRs.)
URBANState/UT avg.med.exp.duringstayat
hospitalavg.ofothermed.exp.onaccount
ofhospitalizationTotalexpenditure
Male Female Person Male Female Person Male Female Person(1) (2) (3) (4) (5) (6) (7) (8) (9) (10)
Andhra Pradesh 42894 16144 31242 2729 2041 2429 45623 18186 33671Arunachal Pradesh 10685 6908 8926 2008 1537 1789 12693 8445 10715Assam 31945 60152 47064 4767 5768 5304 36711 65921 52368Bihar 35363 15632 25004 4758 2055 3054 39521 17687 28058Chhattisgarh 25360 17465 22647 2544 1675 2245 27904 19139 24891Goa 39322 28501 34730 2542 2016 2319 41864 30516 37049Gujarat 26134 17606 23165 3691 2386 3237 29824 19992 26401Haryana 21954 18262 20155 1191 1047 1121 23145 19309 21276HimachalPradesh 35502 27870 32370 3325 2161 2847 38827 30030 35217Jammu&Kashmir 45243 16776 28590 3191 2130 2570 48434 18905 31160Jharkhand 17040 11592 13948 2940 1682 2226 19979 13274 16174Karnataka 14689 11946 13151 2023 1732 1860 16712 13679 15011Kerala 27592 17456 22190 2404 1668 2012 29996 19124 24202Madhya Pradesh 16931 14325 15465 1923 1442 1652 18854 15766 17117Maharashtra 30851 17516 23993 3006 1791 2381 33857 19306 26374Manipur 28378 30598 29493 1816 1255 1534 30194 31854 31028Meghalaya 10052 10380 10215 3618 3573 3595 13669 13953 13810Mizoram 16087 21376 18786 3184 2830 3004 19271 24206 21789Nagaland 11182 14945 13461 2591 4514 3756 13773 19459 17216Odisha 17116 14617 15788 2974 2438 2689 20090 17055 18477Punjab 17186 23199 19750 2945 2987 2963 20131 26186 22713Rajasthan 31793 28040 29971 2240 1760 2007 34033 29800 31978Sikkim 23458 10054 16731 2022 1213 1616 25480 11267 18346TamilNadu 11169 8942 9939 9026 3209 5813 20195 12151 15751Telangana 29093 18115 23757 2714 1935 2336 31808 20050 26092Tripura 25946 16350 20617 2541 1506 1966 28486 17856 22584UttarPradesh 13744 8887 11638 2645 1834 2294 16390 10721 13931Uttarakhand 33498 30150 31653 1990 1554 1749 35488 31704 33402WestBengal 30766 22174 25703 2875 1696 2180 33641 23869 27883A&NIslands 28462 20826 24875 1832 2986 2374 30293 23812 27249Chandigarh 15662 2284 8389 5186 1030 2927 20848 3314 11316D&NHaveli 55879 17967 35158 2529 1717 2085 58408 19684 37243Daman&Diu 9886 4956 7749 619 430 537 10505 5386 8286Delhi 8570 6105 6930 1662 377 807 10232 6482 7737Lakshadweep 7335 9859 8604 6213 3291 4744 13548 13150 13348Puducherry 18969 9176 14076 2241 1389 1815 21210 10564 15891All 28165 20754 24436 2286 1757 2019 30450 22511 26455Source: “Key Indicators of Social Consumption in India- Health, 2014, NSS 71st Round”, Ministry of Statistics & Programme Implementation
ExpenditureonInstitutionalChildbirth

182 National Health Profile 2018
4.2.4 MajorSourceofFinanceforhospitalisationexpenditureforhouseholdsindifferentquintileclassesofUMPCE(percentagedistribution)
QuintileClassofUMPCE* %ofhouseholdsreportingassourceoffinanceformeetingthemedicalexpenditurehousehold
income/savingsborrowings saleofphysical
assetscontributionfromfriends/
relatives
others all
(1) (2) (3) (4) (5) (6) (7)RURAL Public Private All Public Private All
1 65.6 26.8 1.1 5.3 0.5 1002 67.1 25.8 1.4 4.8 0.5 1003 68.1 25.3 0.6 5.1 0.5 1004 68.8 26.0 0.4 3.8 0.8 1005 68.1 23.1 0.9 6.9 0.7 100
All 67.8 24.9 0.8 5.4 0.7 100URBAN
1 68.4 21.7 0.4 6.4 2.7 100.02 71.8 21.9 0.4 4.5 1.1 100.03 74.1 20.7 0.3 3.9 0.7 100.04 74.9 16.1 0.3 6.9 1.6 100.05 80.9 13.7 0.4 3.7 1.0 100.0
All 74.9 18.2 0.4 5.0 1.3 100.0Source: “Key Indicators of Social Consumption in India- Health, 2014, NSS 71st Round”, Ministry of Statistics & Programme ImplementationNotes:* This refers to the5quintile classesof theRural/UrbanALL-INDIAdistribution (Estimateddistribution)ofhouseholdsbyUsual
MonthlyPerCapitaExpenditure(UMPCE)
4.2.3 Averagetotalmedicalexpenditureperchildbirthasinpatientoverlast365daysbytypeofhospitalandquintileclassofUMPCE(inRs.)
QuintileClassofUMPCE* AveragetotalmedicalexpenditureperchildbirthinRural Urban
typeofhospitalPublic Private All Public Private All
(1) (2) (3) (4) (5) (6) (7)1 1225 13082 3062 1484 12985 51562 1359 14239 4294 1962 14859 81613 1623 13123 4646 2389 17739 104474 1924 13085 5870 3205 22964 163985 2097 17743 10113 3443 31681 26143
All 1587 14778 5544 2117 20328 11685Source: “Key Indicators of Social Consumption in India- Health, 2014, NSS 71st Round”, Ministry of Statistics & Programme ImplementationNotes:* This refers to the5quintile classesof theRural/UrbanALL-INDIAdistribution (Estimateddistribution)ofhouseholdsbyUsual
MonthlyPerCapitaExpenditure(UMPCE)

183National Health Profile 2018
4.3 HEALTHCOVERAGEANDINSURANCE
A. Government health schemes
1. CentralGovernmentHealthScheme(CGHS)CentralGovernmentHealthScheme(CGHS)isahealthschemeforserving/retiredCentralGovernmentemployeesandtheirfamilies.
CGHS-CategoriesofBeneficiaries
CGHS has a beneficiary base of 32,47,783members comprise of serving employees, pensioners,Member ofParliament(presentandpast)andfreedomfightersandothers.
Subscriptionrates forCGHSmembership: this rangesbetweenRs50 toRs500dependingon theGradepaydrawn.
4.3.1:ExpenditureonCGHS
Year Totalexpenditure (inCroresofRs.)
No.ofbeneficiaries (inCrores)
PerCapitaExpenditure (inRs.)
2010-11 1296 0.32 4050
2011-12 1562 0.34 4594
2012-13 1691 0.36 4697
2013-14 1839 0.37 4970
2014-15 1799 0.28 6425
2015-16 1977 0.29 6817
2016-17 2238 0.31 7219Source: CGHS, Ministry of Health & Family Welfare
2. Employees’StateInsuranceScheme(ESIS)
The Employees’ State InsuranceAct, 1948 envisaged an integratedneedbased social insurance scheme thatwouldprotect the interestsofworkers incontingenciessuchas sickness,maternity, temporaryorpermanentphysicaldisablement,anddeathduetoemployment,injuryresultinginlossofwagesorearningcapacity.TheActalsoguaranteesmedicalcaretoworkersandtheirimmediatedependents.
ESISisacontributoryschemeonthepatternsofsocialhealthinsurance. TheexistingwagelimitforcoverageundertheActisRs.15,000/-permonth(w.e.f.01/05/2010).
TheschemeisbeingimplementedinalltheStatesexceptManipur,Sikkim,ArunachalPradeshandMizoram.ItisalsoimplementedinDelhiandChandigarh.
MedicalbenefitisonepartofthebenefitsunderESICwhichalsoincludesotherbenefitsforsickness,maternity,disablementetc. Fullmedicalcare isprovidedtoan insuredpersonandhisfamilymembersfromthedayheentersinsurableemployment.Thereisnoceilingonexpenditureonthetreatmentofaninsuredpersonorhisfamilymember, and treatment canbeavailedatprimary, secondaryand tertiary levels. Medical care is alsoprovidedtoretiredandpermanentlydisabledinsuredpersonsandtheirspousesonpaymentofatokenannualpremiumofRs.120/-.
Thefollowingtableindicatesthecoveragesituation.
184 National Health Profile 2018
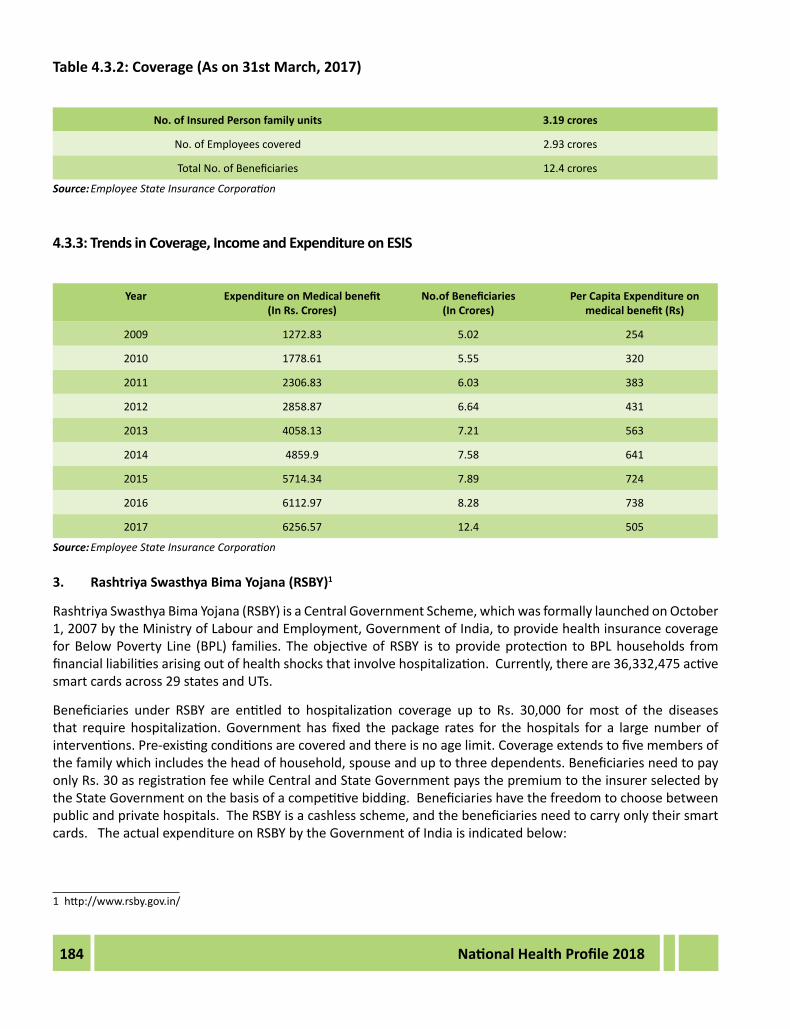
Table4.3.2:Coverage(Ason31stMarch,2017)
No.ofInsuredPersonfamilyunits 3.19crores
No.ofEmployeescovered 2.93crores
TotalNo.ofBeneficiaries 12.4crores
Source: Employee State Insurance Corporation
4.3.3:TrendsinCoverage,IncomeandExpenditureonESIS
Year ExpenditureonMedicalbenefit(InRs.Crores)
No.ofBeneficiaries (InCrores)
PerCapitaExpenditureonmedicalbenefit(Rs)
2009 1272.83 5.02 254
2010 1778.61 5.55 320
2011 2306.83 6.03 383
2012 2858.87 6.64 431
2013 4058.13 7.21 563
2014 4859.9 7.58 641
2015 5714.34 7.89 724
2016 6112.97 8.28 738
2017 6256.57 12.4 505
Source: Employee State Insurance Corporation
3. RashtriyaSwasthyaBimaYojana(RSBY)1
RashtriyaSwasthyaBimaYojana(RSBY)isaCentralGovernmentScheme,whichwasformallylaunchedonOctober1,2007bytheMinistryofLabourandEmployment,GovernmentofIndia,toprovidehealthinsurancecoverageforBelowPoverty Line (BPL) families. TheobjectiveofRSBY is toprovideprotection toBPLhouseholds fromfinancialliabilitiesarisingoutofhealthshocksthatinvolvehospitalization.Currently,thereare36,332,475activesmartcardsacross29statesandUTs.
Beneficiaries under RSBY are entitled to hospitalization coverage up to Rs. 30,000 for most of the diseasesthat require hospitalization.Government has fixed the package rates for the hospitals for a large number ofinterventions.Pre-existingconditionsarecoveredandthereisnoagelimit.Coverageextendstofivemembersofthefamilywhichincludestheheadofhousehold,spouseanduptothreedependents.BeneficiariesneedtopayonlyRs.30asregistrationfeewhileCentralandStateGovernmentpaysthepremiumtotheinsurerselectedbytheStateGovernmentonthebasisofacompetitivebidding.Beneficiarieshavethefreedomtochoosebetweenpublicandprivatehospitals.TheRSBYisacashlessscheme,andthebeneficiariesneedtocarryonlytheirsmartcards.TheactualexpenditureonRSBYbytheGovernmentofIndiaisindicatedbelow:
1http://www.rsby.gov.in/
185National Health Profile 2018
2GrantsSection,MinistryofHealth&FW3GrantsSection,MinistryofHealth&FW
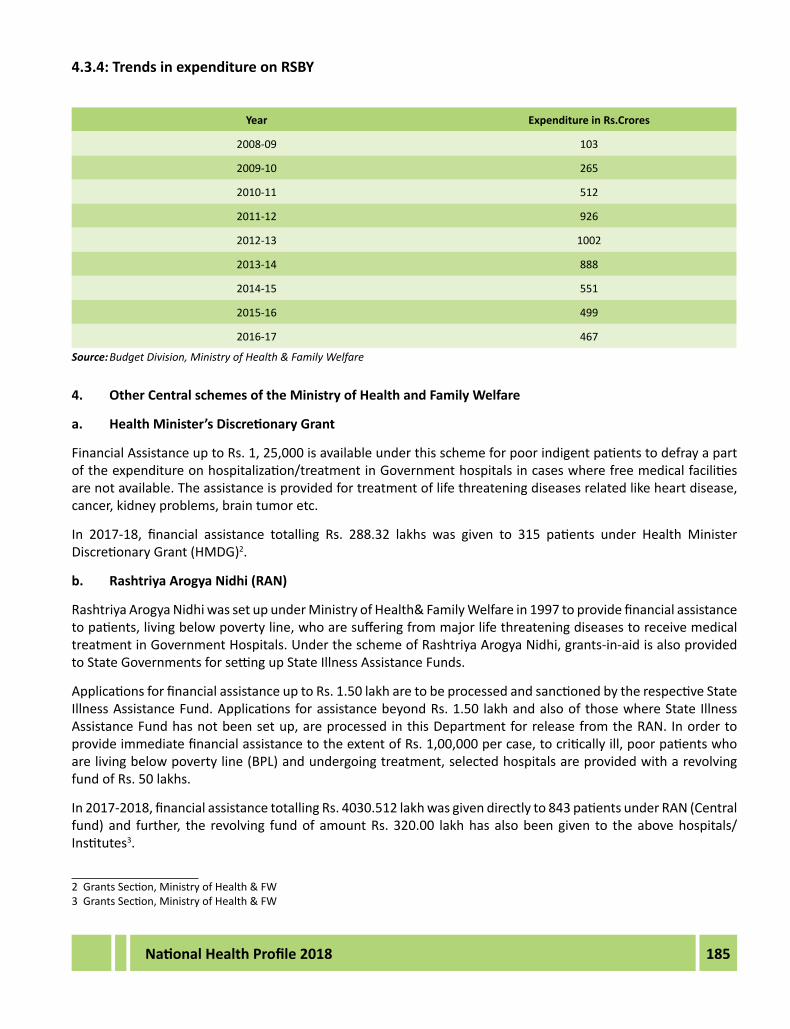
4.3.4:TrendsinexpenditureonRSBY
Year ExpenditureinRs.Crores
2008-09 103
2009-10 265
2010-11 512
2011-12 926
2012-13 1002
2013-14 888
2014-15 551
2015-16 499
2016-17 467
Source: Budget Division, Ministry of Health & Family Welfare
4. OtherCentralschemesoftheMinistryofHealthandFamilyWelfare
a. HealthMinister’sDiscretionaryGrant
FinancialAssistanceuptoRs.1,25,000isavailableunderthisschemeforpoorindigentpatientstodefrayapartoftheexpenditureonhospitalization/treatmentinGovernmenthospitalsincaseswherefreemedicalfacilitiesarenotavailable.Theassistanceisprovidedfortreatmentoflifethreateningdiseasesrelatedlikeheartdisease,cancer,kidneyproblems,braintumoretc.
In 2017-18, financial assistance totalling Rs. 288.32 lakhs was given to 315 patients under Health MinisterDiscretionaryGrant(HMDG)2.
b. RashtriyaArogyaNidhi(RAN)
RashtriyaArogyaNidhiwassetupunderMinistryofHealth&FamilyWelfarein1997toprovidefinancialassistancetopatients,livingbelowpovertyline,whoaresufferingfrommajorlifethreateningdiseasestoreceivemedicaltreatmentinGovernmentHospitals.UndertheschemeofRashtriyaArogyaNidhi,grants-in-aidisalsoprovidedtoStateGovernmentsforsettingupStateIllnessAssistanceFunds.
ApplicationsforfinancialassistanceuptoRs.1.50lakharetobeprocessedandsanctionedbytherespectiveStateIllnessAssistanceFund.ApplicationsforassistancebeyondRs.1.50 lakhandalsoofthosewhereState IllnessAssistanceFundhasnotbeensetup,areprocessed inthisDepartmentforreleasefromtheRAN. InordertoprovideimmediatefinancialassistancetotheextentofRs.1,00,000percase,tocriticallyill,poorpatientswhoarelivingbelowpovertyline(BPL)andundergoingtreatment,selectedhospitalsareprovidedwitharevolvingfundofRs.50lakhs.
In2017-2018,financialassistancetotallingRs.4030.512lakhwasgivendirectlyto843patientsunderRAN(Centralfund) and further, the revolving fundof amountRs. 320.00 lakhhasalsobeengiven to theabovehospitals/Institutes3.

186 National Health Profile 2018
c. HealthMinister’sCancerPatientFund(HMCPF)withinRashtriyaArogyaNidhi(RAN)
The“HealthMinister’sCancerPatientFund (HMCPF)within theRashtriyaArogyaNidhi (RAN)”hasalsobeensetupin2009.InordertoutilizetheHealthMinister’sCancerPatientFund,theRevolvingFundasunderRAN,hasbeenestablished in27RegionalCancerCentres (RCCs).ThefinancialassistancetoaCancerPatientuptoRs.2,00,000wouldbeprocessedbytheRCCconcerned,onwhosedisposaltherevolvingfundhasbeenplaced.Individualcases,whichrequireassistanceofmorethanRs.2.00lakhistobesenttotheMinistryforprocessing.RevolvingFundshavebeencreatedinallthe27RegionalCancerCentres(RCCs)andfundsuptoRs.50lakhswillbeplacedattheirdisposal.TheRevolvingFundswillbereplenishedonfulfilmentofconditionsregardingsubmissionofutilizationcertificateandlistofbeneficiaries.
AnamountofRs.755lakhwasreleasedtoRegionalCancerCentresfromHealthMinister’sCancerPatientFundduring2017-18.AlsoatotalfinancialassistanceofRs.110.95lakhshasbeenextendedoutofHealthMinister’sCancerPatientFund(HMCPF)to21patientsfortheyear2017-184.
5. Staterunhealthcoverageschemes
Differentstatesalsoruntheirownhealthcoverageschemes.Forexample,YeshaswiniandVajpayeeArogyasrischemesarestatesponsoredschemesrunbytheGovernmentofKarnataka.RajivArogyasriSchemeisbeingrunbythegovernmentsofAndhraPradeshandTelangana.TheGovernmentofTamilNadurunstheChiefMinister’sComprehensive Health Insurance Scheme. TheMukhyamantri Amrutam5 is being run by the government ofGujarat.Thereareotherschemesrunbymanystatesthatimpactonthehealthstatusofpeople.Theexpenditureundertakenbythestategovernmentsonsuchschemesarealreadyincludedunderthehealthexpenditureoftherespectivestates.
B. Commercialinsurancesector6
4.3.5:HealthInsurance(ExcludingTravel–Domestic/OverseasandPersonalAccident)Policies,GrossPremiumandNumberofPersonsCovered,2016-17
(No.ofPoliciesinActuals,No.ofPersonsin’000andPremiuminRs.lakh)TypeofInsurance Indicators PublicInsurance
CompaniesPrivate Insurance
CompaniesTotal
Government sponsored schemes includingRSBY
No of Policies 229 106 335No of Persons Covered 279193 55823 335016Premium 264477 44571 309048
GroupInsuranceSchemesexcludingGovtSponsoredSchemes
No of Policies 394571 55929 450500No of Persons Covered 52178 18291 70469Premium 1103503 368262 1471765
Individual Family Floater No of Policies 2972857 2126386 5099243No of Persons Covered 9400 6572 15972Premium 314692 376487 691179
Individual other than Family Floater
No of Policies 2736880 4850470 7587350No of Persons Covered 6552 9448 16000Premium 240040 327139 567179
Total No of Policies 6104537 7032891 13137428No of Persons Covered 347323 90134 437457Premium(RsLakhs) 1922712 1116459 3039171
Source: Annual Report of Insurance Regulatory and Development Authority India, 2016-17Notes: Privateinsurancecompaniesareinclusiveofstandalonehealthinsurersofprivatesector.
4GrantsSection,MinistryofHealth&FW5http://www.magujarat.com/6Thisessentiallyincludesallinsuranceboughtfromfor-profitinsurancecompaniesintheprivateandpublicsector.

187National Health Profile 2018
Source: Annual Report of Insurance Regulatory and Development Authority India, 2016-17Notes: ClaimsRatio=[(Netclaimsincurred)/(NetEarnedPremium)]*100
Source: Annual Report of Insurance Regulatory and Development Authority India, 2016-17Notes: “Cov”standsforCoverage(numberofpersonscovered)and“Pre”standsforpremium.
TypeofInsuranceCompanies
All
PrivateInsuranceCompanies
PublicInsuranceCompanies
ClaimsRatio0 50 100 150
120
67
101
Figure4.3.2:Claimsratio(%)byprovider
188 National Health Profile 2018
4.4 PUBLICEXPENDITUREONHEALTH–INTERNATIONALCOMPARISON
Figure4.4.1:PublicExpenditureonHealthasa%ofGDPacrossWorldBankIncomeGroups-2015
Figure4.4.2:PublicExpenditureonHealthasa%ofGDPforSEARCountries-2015
Source: Global Health Expenditure Database, World Health Organization accessed from http://apps.who.int/nha/database/Select/Indicators/en as on 11.04.2018
Notes: 1.ForIndia,seeTable4.1.2ofChapter4 2.AsperSystemofHealthAccounts2011(SHA2011),DomesticGeneralGovernmentHealthExpenditureasa%ofGDP(GGHE-
D%GDP)istakenasPublicExpenditureonHealthasa%ofGDP(TechnicalbriefontheIndicatorspublishedontheWorldHealthOrganization’sGlobalHealth ExpenditureDatabase accessed fromhttp://apps.who.int/nha/database/DocumentationCentre/Index/en
Source: Global Health Expenditure Database, World Health Organization accessed from http://apps.who.int/nha/database/Select/Indicators/en as on 11.04.2018
Notes: 1.ForIndia,seeTable4.1.2ofChapter4 2.SEAROcountriesexcludeDemocraticPeople’sRepublicofKoreaduetodatabeingunavailable. 3.AsperSystemofHealthAccounts2011(SHA2011),DomesticGeneralGovernmentHealthExpenditureasa%ofGDP(GGHE-
D%GDP)istakenasPublicExpenditureonHealthasa%ofGDP(TechnicalbriefontheIndicatorspublishedontheWorldHealthOrganization’sGlobalHealth ExpenditureDatabase accessed fromhttp://apps.who.int/nha/database/DocumentationCentre/Index/en

189National Health Profile 2018
Figure4.4.3:PerCapitaPublicExpenditureonHealth(inaverageexchangerateUS$) forSEAROCountries-2015
Figure4.4.4:PublicExpenditureonHealthasa%ofGDPamongCountries withsignificantUHCServiceCoverage-2015
CountrieswithsignificantUHCSeviceCoverage
Source: Global Health Expenditure Database, World Health Organization accessed from http://apps.who.int/nha/database/Select/Indicators/en as on 11.04.2018
Notes: 1.ForIndia,seeTable4.1.2ofthisreport.IndiafigureforPerCapitapublicexpenditureonHealthconvertedtoAverageexchangerateforUS$for2014-15fromRBIdatabaseavailableat
https://rbi.org.in/Scripts/PublicationsView.aspx?id=17281 2.SEAROcountriesexcludeDemocraticPeople’sRepublicofKoreaduetodatabeingunavailable. 3. Domestic General Government Health Expenditure per Capita in US$ (GGHE-D_pc_USD) is taken as Per Capita Public
ExpenditureonHealth(inaverageexchangerateUS$)
Source: 1. Global Health Expenditure Database, World Health Organization accessed from http://apps.who.int/nha/database/Select/Indicators/en as on 11.04.2018 for Public Expenditure on Health as a % of GDP.
2. http://apps.who.int/gho/data/node.imr.UHC_INDEX_REPORTED?lang=en and Universal Health Coverage Data Portal for UHC Service Coverage Index
Notes: 1.UHCServiceCoverageIndex-Coverageofessentialhealthservices(definedastheaveragecoverageofessentialservicesbasedontracerinterventionsthatincludereproductive,maternal,newbornandchildhealth,infectiousdiseases,noncommunicablediseasesandservicecapacityandaccess,amongthegeneralandthemostdisadvantagedpopulation).PublicExpenditureonHealthasa%ofGDPamongcountrieswithUHCServiceCoverageIndexof80andaboveisshowninthechart.
2.PublicExpenditureonHealthasa%ofGDPwasnotavailableforIsrael,NewZealand,AustraliaandJapanin2015.

190 National Health Profile 2018
Table4.4.1:CountrieswithUHCorsignificantprogresstowardsUHC
Country DomesticGeneralGovernmentHealthExpenditure(GGHE-D)perCapitainUS$-2015
Canada 3,315
UnitedStatesofAmerica 4,802
Austria 3,429
Belgium 3,484
Denmark 4,626
France 3,178
Iceland 3,565
Italy 2,022
Luxembourg 5,156
Netherlands 3,831
Norway 6,374
Portugal 1,140
Sweden 4,685
Switzerland 6,944
UnitedKingdom 3,500
BruneiDarussalam 763
RepublicofKorea 1,135
Singapore 1,183Source: 1. Global Health Expenditure Database, World Health Organization accessed from http://apps.who.int/nha/database/Select/
Indicators/en as on 11.04.2018 for Public Expenditure on Health as a % of GDP. 2. http://apps.who.int/gho/data/node.imr.UHC_INDEX_REPORTED?lang=en and Universal Health Coverage Data Portal for UHC
Service Coverage Index.Notes: 1.UHCServiceCoverageIndex-Coverageofessentialhealthservices(definedastheaveragecoverageofessentialservicesbased
ontracer interventionsthat includereproductive,maternal,newbornandchildhealth, infectiousdiseases,non-communicablediseases and service capacity and access, among the general and the most disadvantaged population). Domestic GeneralGovernmentHealthExpenditure(GGHE-D)perCapitainUS$amongcountrieswithUHCServiceCoverageIndexof80andaboveisshowninthetable.
2. Domestic General Government Health Expenditure (GGHE-D) per Capita in US$was not available for Israel, New Zealand,AustraliaandJapanin2015.

Annexure

192 National Health Profile 2018
4.1 FiveYearPlanOutlaysTable4.1:PatternofCentralAllocation(TotalfortheCountry&UnionMOHFW) (Rs.incrores)
SNo.
Period Total Plan Investment Outlay(AllHeadsofDevp.)ofcountry
HealthSector NationalRural
Health Mission (NRHM/NHM)
NationalAids Control Organization
(NACO)
Health Research
Total %Outlay
Health Sector
Family Welfare
AYUSH*
1 2 3 4 5 6 7 8 9 10 11
1 FirstPlan(1951-56) (Actuals) 1960.0 65.2(3.3) 0.1(0.1) 65.3 3.4
2 SecondPlan(1956-61) (Actuals) 4672.0 140.8(3.0) 5.0(0.1) 145.8 3.1
3 ThirdPlan(1961-66) (Actuals) 8576.5 225.9(2.6) 24.9(0.3) 250.8 2.9
4 AnnualPlans(1966-69) (Actuals) 6625.4 140.2(2.1) 70.4(1.1) 210.6 3.2
5 FourthPlan(1969-74) (Actuals) 15778.8 335.5(2.1) 278(1.8) 613.5 3.9
6 FifthPlan(1974-79) (Actuals) 39426.2 760.8(1.9) 491.8(1.2) 1252.6 3.1
7 AnnualPlan1979-80 (Actuals) 12176.5 223.1(1.8) 118.5(1.0) 341.6 2.8
8 SixthPlan(1980-85) (Actuals) 109291.7 2025.2(1.8)
1387(1.3) 3412.2 3.1
9 SeventhPlan(1985-90) (Actuals) 218729.6 3688.6(1.7)
3120.8(1.4)
6809.4 3.1
10 AnnualPlan(1990-91) (Actuals) 61518.1 960.9(1.6) 784.9(1.3) 1745.8 2.9
11 AnnualPlan(1991-92) (Actuals) 65855.8 1042.2(1.6)
856.6(1.3) 1898.8 2.9
12 EighthPlan(1992-97) (Outlays) 434100.0 7494.2(1.7)
6500(1.5) 108(0.02) 14102.2 3.2
13 NinthPlan(1997-02) (Outlays) 859200.0 19818.4(2.31)
15120.2(1.76)
266.35(0.03)
35204.95 4.1
14 TenthPlan(2002-07) (Outlays) 1484131.3 31020.3(2.09)
27125.0(1.83)
775(-0.05)
58920.3 4.0
15 EleventhPlan(2007-12) (Outlays) 2156571.0 136147.0***(6.31)
3988.0(0.18)
140135.0 6.5
16 TwelfthPlan(2012-17) (Outlays) 75145.3 10044.0 193405.7 11394.0 10029.0 300018.0
17 AnnualPlan(2012-13) (Outlays) 6585.0 990.0 20542.0 1700.0 660.0 30477.0
18 AnnualPlan(2013-14) (Outlays) 8166.0 1069.0 20999.0 1785.0 726.0 32745.0
19 AnnualPlan(2014-15) (Outlays) 8233.0 1069.0 21912.0 1785.0 726.0 33725.0
20 AnnualPlan(2015-16) (Outlays) 11324.5 1008.0 18295.0 1397.0 713.2 30627.5
21 AnnualPlan(2016-17) (Outlays) 14824.6 1050.0 20500.0# 1700.0 750.0 36374.6
22 AnnualPlan(2017-18) (Outlays) 17661.8 1428.7 27690.7 2000.0 1500.0 50281.2
23 AnnualPlan(2018-19) (Outlays) 18570.4 1626.4 32129.6 2100.0 1800.0 52326.4
Source: Budget Division of Department of Health, NRHM/NHM, AYUSH, NACO & Health ResearchNotes: Figuresinbracketsindicatepercentagetototalplaninvestmentoutlay.* Deptt.ISM&H(nowAYUSH)wascreatedduringthe8thPlanPeriodandw.e.f.2015-16,hasbecomeaseparateMinistry.*** Deptt.ofHealth&FamilyWelfaremergedfrom2005andRs.136,147.00crores includesRs.4496.08croresfornewlycreated
HealthResearchDepartmentcreatedduring2008-09# RSBYhasbeenincludedinNHMBudgetfrom2016-17. Planandnon-planexpenditureareincludedinhealthbudgetfrom2015-16 BudgetforNACOisnotincludedinhealthbudgetandithasshownseparatelyintable4.7

193National Health Profile 2018
Table:4.2ActualExpenditureofTenthPlan(2002-07),ApprovedOutlayforEleventhPlan(2007-12),TwelfthPlan(2012-17)andApprovedOutlayin2018-19inCentralSectorforMOHFW*
(Rs.incrores)S.No. Period Health** NRHM(NHM) FamilyWelfare AYUSH Health
Research***NACO****
I 2 3 4 5 6 7 8
1 Tenth Plan Actuals 8085.69 ***** 26126 775.00
2 EleventhPlanOutlay 41092.92 90558.00 3988.00 4496.08
(a) 2007-08(BE) 2985.00 10890.00 488.00
(b) 2007-08(Actual) 2183.71 10380.40 383.36
(c) 2008-09(BE) 3650.00 11930.00 534.00 420.00
(d) 2008-09(Actual) 3008.22 11260.18 471.13 390.18
(e) 2009-10(BE) 4450.00 13930.00 734.00 420.00
(f) 2009-10(Actual) 3261.91 13305.76 678.97 400.00
(g) 2010-11(BE) 5560.00 15440.00 800.00 500.00 1435.00
(h) 2010-11(Actual) 4666.06 14696.78 848.91 503.30 1175.47
(i) 2011-12(BE) 5720.00 17840.00 900.00 600.00 1700.00
(j) 2011-12(Actual) 4160.00 16509.45 611.47 564.50 1313.86
3 TwelfthPlanOutlay 75143.29 1913405.71 10044.00 10029.00 11394.00
(a) 2012-13(BE) 6585.00 20542.00 990.00 660.00 1700.00
(b) 2012-13(Actual) 4145.43 16762.75 580.60 460.31 1316.07
(c) 2013-14(BE) 8166.00 20999.00 1069.00 726.00 1785.00
(d) 2013-14(Actual) 4205.74 18266.92 553.50 569.62 1473.16
(e) 2014-15(BE) 8733.00 21912.00 1069.00 726.00 1785.00
(f) 2014-15(Actual) 5645.36 18039.26 463.13 590.65 1287.39
(g) 2015-16(BE) 11324.54 18295.00 1008.00 713.17 1397.00
(h) 2015-16(Actual) 12642.70 18282.38 888.86 647.82 1605.00
(i) 2016-17(BE) 16524.55 20500.00 1050.00 750.00 1700.00
(j) 2016-17(RE) 17582.52 20723.81 1027.94 850.00 1753.00
(k) 2016-17(Actual) 17074.78 19418.82 1017.97 930.80 1749.17
(l) 2017-18(BE) 17661.81 27690.70 1428.65 1500.00 2000.00
(m) 2017-18(RE) 20278.77 31272.08 1557.80 1743.39 2163.06
(n) 2018-19(BE) 20670.39 32129.61 1626.37 1800.00 2100.00Source: Budget Division of Department of Health, NRHM/NHM, AYUSH, NACO & Health ResearchNotes: BE-BudgetEstimate RE-RevisedEstimate* TheDetailsofthe10thFiveYearPlanmaykindlybeseeninNHP-2009(Page131-133)** Thefiguresshownagainst“Health”excludeDiseaseControlProgrammeswhichhavebeensubsumedunderNRHMfrom2005-06
onwards.*** AseparateNewDepartmentofHealthResearchCreatedfrom2008-09(FiguresincludetheBudgetofICMR).**** Since2012-13BudgetofNationalAidsControlOrganization(NACO)hasbeenseparatedfromtheBudgetofHealth&FW.***** NationalRuralHealthMissionwaslaunchedin2005-06andDepartmentofHealth$FWweremerged. Planandnon-planexpendituresareincludedinhealthbudgetfrom2015-16

194 National Health Profile 2018
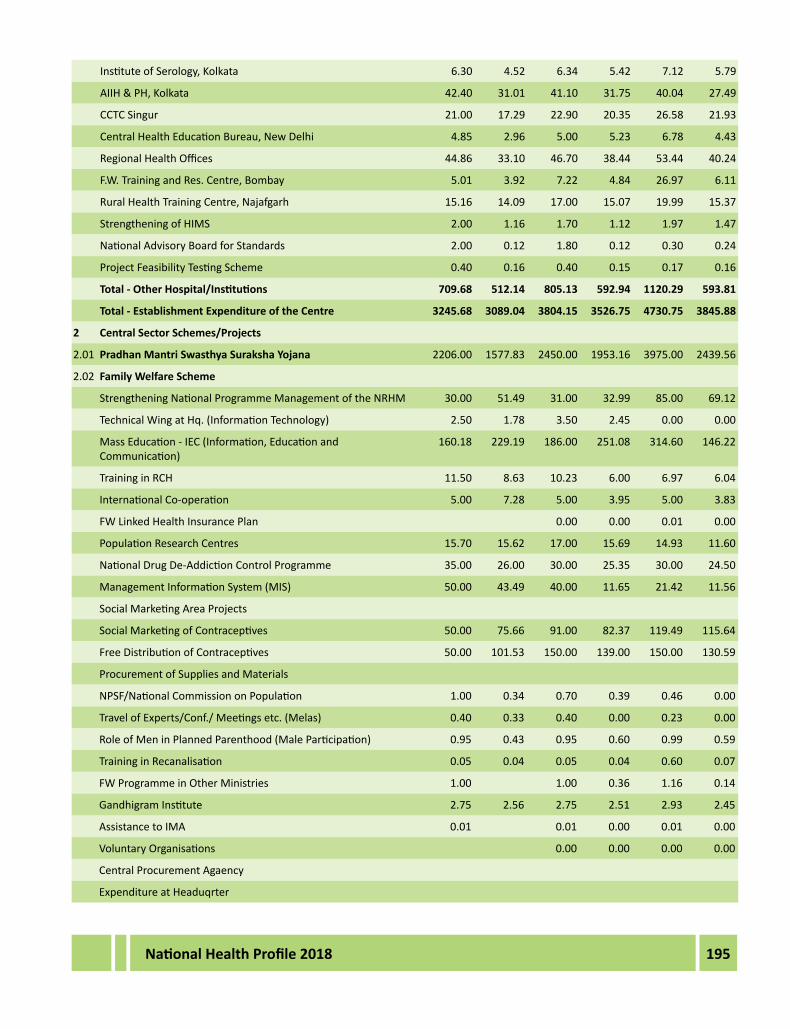
Table:4.3SchemewiseApprovedOutlay(BE)andActualExpenditureforHealthfor2015-16,2016-17and2017-18
(Rs.incrores)S.
No.Scheme/Programme/Institute 2015-16 2016-17 2017-18
BE Actuals BE Actuals BE Actuals
1 EstablishmentExpenditureoftheCentre
1.01 Secretariat-SocialServices 76.35 78.91 107.62 94.67 126.33 123.05
1.02 Direction&Admn.
Direction&Admn.(Dte.G.H.S) 47.00 38.56 47.00 45.01 60.16 48.81
Direction&Admn.(Dte.C.G.H.S) 2.15 1.33 2.40 1.46 2.79 1.95
49.15 39.89 49.40 46.47 62.95 50.76
1.03 CentralGovernmentHealthScheme 926.00 917.88 1035.00 1000.66 1246.65 1098.57
1.04 SafdarjangHospital,NewDelhi 657.00 798.57 917.00 900.84 1091.76 1011.30
VardhmanMahaveerMedicalCollege,NewDelhi 11.50 11.42 12.00 11.89 13.93 12.96
1.05 Dr.RamManoharLohiaHospital,NewDelhi 435.00 378.55 462.00 437.51 505.56 481.35
Dr.RMLPGIMER,NewDelhi 26.00 27.24 30.00 36.62 51.31 50.88
1.06 LadyHardingeMedicalCollege&Smt.SuchetaKripalaniHospital&NewDelhi
275.00 257.12 296.00 322.84 406.49 330.20
1.07 KalawatiSaranChildren'sHospital,NewDelhi 80.00 67.32 90.00 82.31 105.48 93.00
1.08 OtherHospitals/Institutions
NationalMedicalLibrary 35.05 30.90 31.10 24.24 32.49 14.91
MedicalStoresOrganization 51.73 46.78 61.00 54.70 63.82 50.75
CentralInstituteofPsychiatry,Ranchi 90.00 66.58 95.00 94.72 130.30 74.61
AllIndiaInstituteofPhysicalMedicineandRehabilitation,Mumbai
22.00 18.39 24.75 21.13 34.24 20.34
RAKCollegeofNursing,NewDelhi 10.70 8.38 10.50 9.81 41.37 39.85
LadyReadingHealthSchool 4.13 2.45 4.48 2.86 4.04 2.87
PortHealthEstt.IncludingAPHO 42.93 24.79 46.35 28.18 57.04 29.87
PortHealthOffice,JNPort,NhavaSheva 1.57 0.70 1.65 0.79 1.16 0.86
NationalTBTrainingInstitute,Bangalore 11.09 10.87 11.75 12.79 12.30 12.46
CLTRI,Chengalpattu 15.10 13.72 18.15 16.80 18.38 14.87
RLTRI,Aska 10.80 3.63 9.86 3.10 10.35 3.83
RLTRI,Raipur 5.00 4.32 6.02 5.34 6.88 3.87
RLTRI,Gauripur 6.35 3.98 6.22 4.99 6.93 4.32
N.I.C.D.,NewDelhi(MainInstitution) 48.60 34.78 56.58 41.23 55.54 44.02
FoodResearchandStandardisationLab. 11.00 4.05 12.00 0.00 0.01 0.00
Central Drugs Standard Control Org. 122.50 76.86 184.70 94.68 378.49 100.28
BCGVaccineLaboratory,Guindy,Chennai 23.15 13.60 17.50 14.78 21.07 15.08
CRI,Kasauli 54.00 39.03 57.36 40.31 62.52 37.79
195National Health Profile 2018
InstituteofSerology,Kolkata 6.30 4.52 6.34 5.42 7.12 5.79
AIIH&PH,Kolkata 42.40 31.01 41.10 31.75 40.04 27.49
CCTC Singur 21.00 17.29 22.90 20.35 26.58 21.93
CentralHealthEducationBureau,NewDelhi 4.85 2.96 5.00 5.23 6.78 4.43
RegionalHealthOffices 44.86 33.10 46.70 38.44 53.44 40.24
F.W.TrainingandRes.Centre,Bombay 5.01 3.92 7.22 4.84 26.97 6.11
RuralHealthTrainingCentre,Najafgarh 15.16 14.09 17.00 15.07 19.99 15.37
Strengthening of HIMS 2.00 1.16 1.70 1.12 1.97 1.47
NationalAdvisoryBoardforStandards 2.00 0.12 1.80 0.12 0.30 0.24
ProjectFeasibilityTestingScheme 0.40 0.16 0.40 0.15 0.17 0.16
Total-OtherHospital/Institutions 709.68 512.14 805.13 592.94 1120.29 593.81
Total-EstablishmentExpenditureoftheCentre 3245.68 3089.04 3804.15 3526.75 4730.75 3845.88
2 CentralSectorSchemes/Projects
2.01 PradhanMantriSwasthyaSurakshaYojana 2206.00 1577.83 2450.00 1953.16 3975.00 2439.56
2.02 FamilyWelfareScheme
StrengtheningNationalProgrammeManagementoftheNRHM 30.00 51.49 31.00 32.99 85.00 69.12
TechnicalWingatHq.(InformationTechnology) 2.50 1.78 3.50 2.45 0.00 0.00
MassEducation-IEC(Information,EducationandCommunication)
160.18 229.19 186.00 251.08 314.60 146.22
Training in RCH 11.50 8.63 10.23 6.00 6.97 6.04
InternationalCo-operation 5.00 7.28 5.00 3.95 5.00 3.83
FWLinkedHealthInsurancePlan 0.00 0.00 0.01 0.00
PopulationResearchCentres 15.70 15.62 17.00 15.69 14.93 11.60
NationalDrugDe-AddictionControlProgramme 35.00 26.00 30.00 25.35 30.00 24.50
ManagementInformationSystem(MIS) 50.00 43.49 40.00 11.65 21.42 11.56
SocialMarketingAreaProjects
SocialMarketingofContraceptives 50.00 75.66 91.00 82.37 119.49 115.64
FreeDistributionofContraceptives 50.00 101.53 150.00 139.00 150.00 130.59
ProcurementofSuppliesandMaterials
NPSF/NationalCommissiononPopulation 1.00 0.34 0.70 0.39 0.46 0.00
TravelofExperts/Conf./Meetingsetc.(Melas) 0.40 0.33 0.40 0.00 0.23 0.00
RoleofMeninPlannedParenthood(MaleParticipation) 0.95 0.43 0.95 0.60 0.99 0.59
TraininginRecanalisation 0.05 0.04 0.05 0.04 0.60 0.07
FWProgrammeinOtherMinistries 1.00 1.00 0.36 1.16 0.14
GandhigramInstitute 2.75 2.56 2.75 2.51 2.93 2.45
Assistance to IMA 0.01 0.01 0.00 0.01 0.00
VoluntaryOrganisations 0.00 0.00 0.00 0.00
CentralProcurementAgaency
ExpenditureatHeaduqrter

196 National Health Profile 2018
ResearchandStudyactivitiesunderRCH
TechnologyinFamilywelfare 1.50 1.00 1.50 1.00 1.16 0.00
NGO (PPP) 0.01 0.01 0.00 0.00 0.00
WHOsupportedNationalPolioSurveillanceProject(NPS) 0.00 0.00 0.00 0.00
417.55 565.37 571.10 575.43 754.96 522.35
2.03 NationalAIDSandSTDControlProgramme 1700.00 1749.16 2000.00 1723.52
2.04 Strengtheningofexistingbranches&establishmentof27branchesofNCDC
5.86 0.27 40.59 0.12
2.05 StrengtheningintersectoralcoordinationofpreventionandcontrolofZoonoticdiseases
0.75 0.14 0.33 0.07
2.06 ViralHepatitis 2.62 0.00 0.31 0.16
2.07 Anti-MicroResistance 1.58 0.81 1.16 0.70
2.08 NationalPharmacovigilanceProg. 6.00 5.75 6.00 6.00 6.97 4.22
2.09 DevelopmentofNursingServices 13.00 1.03 6.00 1.84 6.00 4.94
2.10 Health Insurance (CGEIPS) 50.00 0.01 0.00 0.01 0.00
2.11 HealthSectorDisasterPreparedness&ManagementincludingEMR(includingAvianFlu)&EmergencyMedicalServices
37.00 6.69 30.00 11.51 16.85 8.72
2.12 NationalOrganTransplantProgramme 10.00 6.35 15.00 4.09 9.00 1.52
2.13 ImpactingResearchInnovationandTechnology(Imprint)Scheme(New)
0.00 0.00 0.50 0.50
2.14 SwatchhtaActionPlan(SAP)NEW 0.00 0.00 155.00 155.00
2.15 EstablishmentandstrengtheningofNCDCBranchesandHealthInitiatives–InterSectoralCo-ordinationforpreparationandcontrolofZoonoticDiseasesandotherneglectedtropicaldiseases,surveillanceofViralHepatitis,Anti-MicrobialResistance
0.00 0.00 0.00 0.00
Total-CentralSectorSchemes/Projects 2739.55 2163.02 4788.92 4302.41 6966.68 4861.38
3 OtherCentralExpenditure,includingthoseonCPSEsandAutonomousBodies
3.01 MedicalTreatmentofCGHSPensioners(PORB) 965.00 1058.71 1085.00 1237.42 1402.79 1431.56
3.02 PurchaseofMaterialinIndiaandAbroad 273.00 225.79 295.00 291.62 310.00 0.00
Deduct Recoveries -273.00 -133.98 -295.00 -169.92 -310.00 0.00
Net 0.00 91.81 0.00 121.70 0.00 0.00
3.03 InternationalCooperation/InternationalHealth
(i)ContributiontoIRCS 0.06 0.06 0.00 0.01 0.00
(ii)ContributiontoWHO 22.00 34.83 24.00 22.68 30.00 30.01
(iii)DelegationtoInternationalConference 4.00 1.81 4.00 1.96 4.00 3.88
(IV)Int.Conf.onMed.&PublicHealth 2.60 0.83 2.60 1.09 0.50 0.26
(v)CodexTrustFund(CTF) 0.10 0.10 0.00 0.00 0.00
(vi)MembershipforInternationalOrg. 8.00 9.25 8.00 5.46 8.00 5.78
(vii)InternationalCo-operation(FW) 0.00 0.00 0.00 0.00
Total 36.76 46.72 38.76 31.19 42.51 39.93

197National Health Profile 2018
3.04 OtherMiscellaneousExpenditure
OversightCommittee 100.00 41.00 75.00 90.50 139.31 138.67
NationalCentreforDiseaseControlProgramme 50.00 70.24 28.20 26.41 57.46 35.19
PublicHealthFoundationofIndia(PHFI) 0.01 0.00 0.00 0.00 0.00
DiscretionaryGrant 2.50 2.18 3.00 2.45 3.21 2.16
HajPilgrims 6.50 6.16 7.00 4.95 4.00 4.00
Rashtriya Arogya Nidhi 31.75 31.75 36.00 28.00 42.00 31.50
AwardofPrizesinHindi 0.08 0.03 0.08 0.06 0.08 0.05
AwardofPrizestoGovt.Hospitals/InstitutionsunderKayaKalpScheme
0.00 6.00 11.60 4.50
CounsellingforUG/PGseatsinGovernmentColleges 2.07 0.09 1.37 0.55 1.47 0.00
Deduct Recoveries -2.07 -1.37 0.00 -1.47
Net 0.00 0.09 0.00 0.55 0.00
RashtriyaSwasthyaBimaYojna(RSBY) 100.00 634.46
EstablishmentofStemCellDonorRegistry(New) 0.00 0.00 3.03 0.03
Total-DeductRecovery -2.07 0.00 -1.37 0.00 -1.47 0.00
Total-Net 290.84 785.91 149.28 158.92 260.69 216.10
3.05 AutonomousBodiesandPSUs
StatutoryBodies
1 AllIndiaInstituteofMedicalSciences(AIIMS),NewDelhi 1470.00 1820.00 2043.00 2288.00 2400.00 2400.00
2 PostGraduateInstituteofMedicalEducation&Research,Chandigarh
650.00 775.00 728.55 938.08 1139.60 1077.47
3 JawaharlalInstituteofPostGraduateMedicalEducation&Research,Puducherry
440.00 598.77 874.00 859.02 1034.63 951.28
4 NationalInstituteofMentalHealth&Neuro-Sciences,Bangaluru 275.00 284.00 293.00 302.30 350.94 298.44
5 NEIGRIHMS,Shillong 200.00 178.98 300.00 245.35 200.00 114.56
6 RIMS,Imphal 250.00 252.69 269.00 269.00 190.00 190.00
7 RIPANS,Aizawl 65.00 29.00 75.00 42.05 42.00 12.93
8 LGBRIMH,Tejpur 70.00 32.13 100.00 78.69 80.00 34.75
9 OtherAutonomousBodies
LalaRamSwarupInstituteofT.B.andAlliedDiseases,NewDelhi 62.85 59.93 63.50 64.70 71.00 71.00
VallabhBhaiPatelChestInstitute,DelhiUniversity 47.60 47.60 51.00 51.00 62.38 46.78
KasturbaHealthSociety,Wardha 60.00 60.00 55.00 55.00 63.85 63.85
CancerControl(CNCI,Kolkata) 67.00 37.00 70.00 67.71 121.26 97.45
AllIndiaInstituteofSpeech&Hearing,Mysore 73.00 49.10 75.00 51.36 128.02 52.54
NIBS&QualityControl,Noida 35.00 34.60 37.00 29.62 39.42 29.30
PasteurInstituteofIndia,Conoor 45.00 36.00 54.50 50.50 70.00 65.00
NewDelhiTBCentre 3.41 3.37 3.50 3.47 4.06 4.06
Indian Red Cross Society 0.40 0.06 0.40 0.40 0.40 0.40
St.JohnsAmbulance 0.04 0.01 0.04 0.04 0.04 0.04

198 National Health Profile 2018
InstituteofHumanBehavior&AlliedSciences 0.00 0.00 0.00 0.00
NIHFW,NewDelhi 48.60 40.66 52.50 49.59 58.30 52.18
IIPS,Mumbai 27.50 19.46 28.78 21.31 32.00 25.52
Total 470.40 387.79 491.22 444.70 650.73 508.12
RegulatoryBodies
10 FoodSafety&SAI 72.00 54.88 72.00 59.61 133.58 126.44
11 IndianPharmacopeiaCommission 21.00 24.74 24.50 29.00 33.44 22.27
12 Medical Council of India 1.00 0.45 1.00 1.00 1.00 0.70
13 Dental Council of India 0.20 0.20 0.20 0.20 0.25 0.21
14 PharmacyCouncilofIndia 0.20 0.10 0.20 0.20 0.20 0.20
15 Indian Nursing Council 0.35 0.21 0.00 0.21 0.21
16 NationalAcademyofMedicalSciences 1.55 1.18 1.55 1.39 1.80 1.65
17 NationalBoardofExamination 0.01 0.01 0.00 0.01 0.00
Total-RegulatoryBodies 96.31 81.55 99.67 91.4 170.49 151.68
Total-AutonomousBodies 3986.71 4439.91 5273.44 5558.59 6258.39 5739.23
PSUs
18 HLLLifeCareLimited 60.00 56.88 60.00 0.00 0.00 0.00
Total-AutonomousBodiesandPSUs 4046.71 4496.79 5333.44 5558.59 6258.39 5739.23
Total-OtherCentralExpenditure,includingthoseonCPSEsandAutonomousBodies
5339.31 6479.94 6606.48 7107.82 7964.38 7426.82
Total 11324.54 11732.00 15199.55 14936.98 19661.81 16134.08
CentrallySponsoredScheme(CSS) 0.00
4 TransfertoState
4.1 TetiaryCareProgramme/Scheme
(1)NationalTobaccoControlProgramme 10.03 25.00 18.27 0.00
(2)NationalMentalHealthProgramme 35.42 35.00 33.95 0.00
(3)AssistanceforCapacityBuildingforTraumaCenters
(i)TraumaCenters 99.30 128.50 113.81 0.00
(ii)PreventionofBurnInjury 13.31 71.50 53.77 0.00
Total 0.00 112.61 200.00 167.58 0.00 0.00
(4)NationalProg.forPreventionandControlofCancer,Diabetes,CardiovascularDiseasesandStroke
130.00 300.00 285.92 0.00 0.00
(5)HealthCarefortheElderly 26.23 110.00 94.24 0.00 0.00
(6)NationalProg.forControlofBlindness 15.00 13.38 0.00 0.00
(7)Telemedicine 15.21 40.00 27.90 0.00 0.00
Total-TetiaryCareProgramme/Scheme 0.00 329.50 725.00 641.24 0.00 0.00
4.2 HumanResourcesforHealth&MedicalEducation 0.00
(i)Upgrd./Streng.ofNursingServices(ANM/GNM) 25.00 25.00 0.00 0.00
(ii)Strengthening/Upgrd.ofPharmacySch./Coll. 5.00 1.57 0.00 0.00

199National Health Profile 2018
(iii)Streng./CreationofParamedicalInst.(RIPS/NIPS) 0.00 0.00 0.00 0.00
(iv)DistrictHospital-UpgradationofStateGovernmentMedicalColleges (PG Seats)
10.00 20.00 0.00 0.00
(v)StrengtheningGovt.MedicalColleges(UGSeats)andCentralGovt.HealthInstitutions
50.00 110.00 155.00 0.00 0.00
(vi)EstablishingNewMedicalColleges(UpgradingDistrictHospitals)
531.20 445.00 1293.69 0.00 0.00
(vii)SettingupofStateinstitutionsofparamedicalsciencesinStatesandSettingupofCollegeofParamedicalEducation
5.00 1.30 0.00 0.00
(viii)SettingupofCollegeofpharmacyinGovt.MedicalColleges 0.00 0.00 0.00 0.00
(ix)StrengtheningofDistricthospitalsforprovidingadvancedsecondary care
0.00 0.00 0.00 0.00
(x)Innovationbasedschemes 0.00 0.00 0.00 0.00
Total-HumanResourcesforHealth 0.00 581.20 600.00 1496.56 0.00 0.00
Total-TransfertoState 0.00 910.70 1325.00 2137.80 0.00 0.00
GrandTotal-Net 11324.54 12642.70 16524.55 17074.78 19661.81 16134.08
Source: Budget (Health) Division, Ministry of Health & family WelfareNotes: BudgetforNACOhasshownseparatelyintable4.7* Schemes(4.1and4.2)havebeentransferredtoNHMBudget Schemewiseapprovedoutlayandactualexpenditureincludebothplanandnon-planexpenditure.
200 National Health Profile 2018
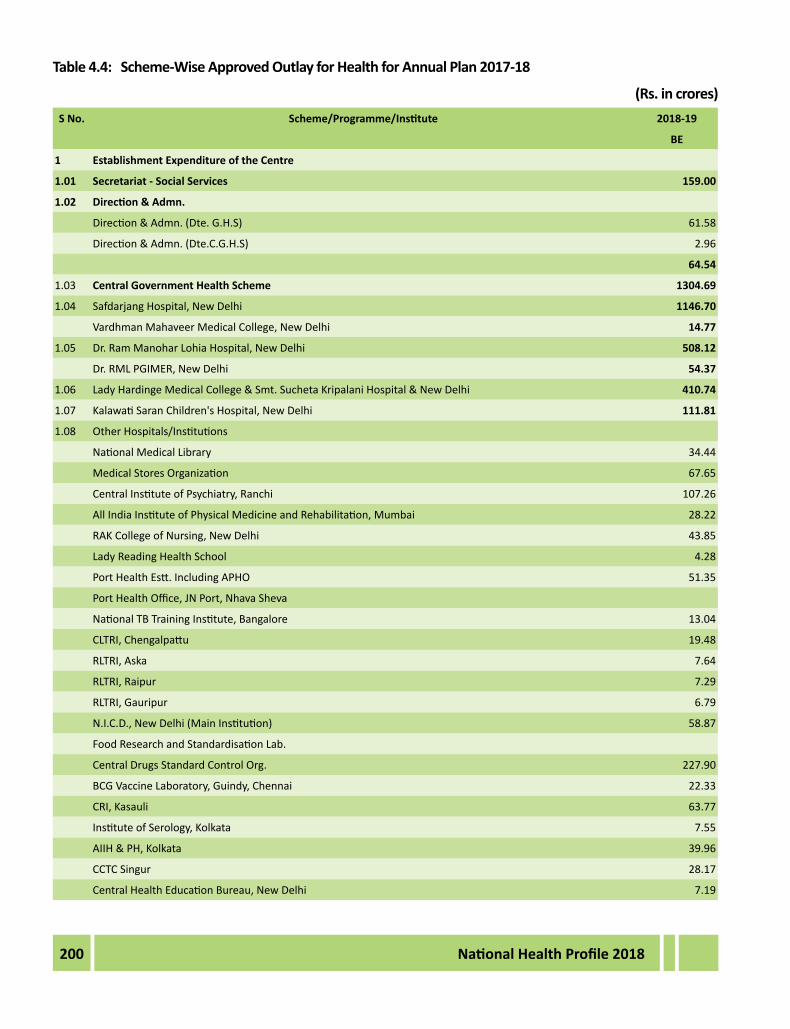
Table4.4: Scheme-WiseApprovedOutlayforHealthforAnnualPlan2017-18
(Rs.incrores)SNo. Scheme/Programme/Institute 2018-19
BE
1 EstablishmentExpenditureoftheCentre
1.01 Secretariat-SocialServices 159.00
1.02 Direction&Admn.
Direction&Admn.(Dte.G.H.S) 61.58
Direction&Admn.(Dte.C.G.H.S) 2.96
64.54
1.03 CentralGovernmentHealthScheme 1304.69
1.04 SafdarjangHospital,NewDelhi 1146.70
VardhmanMahaveerMedicalCollege,NewDelhi 14.77
1.05 Dr.RamManoharLohiaHospital,NewDelhi 508.12
Dr.RMLPGIMER,NewDelhi 54.37
1.06 LadyHardingeMedicalCollege&Smt.SuchetaKripalaniHospital&NewDelhi 410.74
1.07 KalawatiSaranChildren'sHospital,NewDelhi 111.81
1.08 OtherHospitals/Institutions
NationalMedicalLibrary 34.44
MedicalStoresOrganization 67.65
CentralInstituteofPsychiatry,Ranchi 107.26
AllIndiaInstituteofPhysicalMedicineandRehabilitation,Mumbai 28.22
RAKCollegeofNursing,NewDelhi 43.85
LadyReadingHealthSchool 4.28
PortHealthEstt.IncludingAPHO 51.35
PortHealthOffice,JNPort,NhavaSheva
NationalTBTrainingInstitute,Bangalore 13.04
CLTRI,Chengalpattu 19.48
RLTRI,Aska 7.64
RLTRI,Raipur 7.29
RLTRI,Gauripur 6.79
N.I.C.D.,NewDelhi(MainInstitution) 58.87
FoodResearchandStandardisationLab.
Central Drugs Standard Control Org. 227.90
BCGVaccineLaboratory,Guindy,Chennai 22.33
CRI,Kasauli 63.77
InstituteofSerology,Kolkata 7.55
AIIH&PH,Kolkata 39.96
CCTC Singur 28.17
CentralHealthEducationBureau,NewDelhi 7.19

201National Health Profile 2018
RegionalHealthOffices 56.65
F.W.TrainingandRes.Centre,Bombay 23.01
RuralHealthTrainingCentre,Najafgarh 21.19
Strengthening of HIMS 63.93
NationalAdvisoryBoardforStandards 0.32
ProjectFeasibilityTestingScheme 0.18
Total-EstablishmentExpenditureoftheCentre 1012.31
A Total 4787.05
2 CentralSectorSchemes/Projects
2.01 PradhanMantriSwasthyaSurakshaYojana 3825.00
2.02 FamilyWelfareScheme
StrengtheningNationalProgrammeManagmentoftheNRHM
TechnicalWingatHq.(InformationTechnology)
IEC(Information,EducationandCommunication)(renamedasSwasthaNagrikAbhiyan)SNA 353.44
Training in RCH
InternationalCo-operation
FWLinkedHealthInsurancePlan
PopulationResearchCentres 10.00
NationalDrugDe-AddictionControlProgramme
ManagementInformationSystem(MIS)renamedasHealthSurveysandResearchStudies 95.00
SocialMarketingofContraceptives 140.00
FreeDistributionofContraceptives 150.00
NPSF/NationalCommissiononPopulation 0.46
TravelofExperts/Conf./Meetingsetc.(Melas)
RoleofMeninPlannedParenthood(MaleParticipation) 1.10
TraininginRecanalisation
FWProgrammeinOtherMinistries
GandhigramInstitute
Assistance to IMA
VoluntaryOrganisations
TechnologyinFamilywelfare
NGO (PPP)
WHOSupportedNationalPolioSurvellianceProject(NPS) 20.00
770.00
2.03 NationalAIDSandSTDControlProgramme**
2.04 Strengtheningofexistingbranches&establishmentof27branchesofNCDC
2.05 StrengtheningintersectoralcoordinationofpreventionandcontrolofZoonoticdiseases
2.06 ViralHepatitis
2.07 Anti-MicroResistance
2.08 NationalPharmacovigilanceProg. 10.00

202 National Health Profile 2018
2.09 DevelopmentofNursingServices 14.00
2.1 Health Insurance (CGEIPS)
2.11 HealthSectorDisasterPreparedness&ManagementincludingEMR(includingAvianFlu)&EmergencyMedicalServices
EmergencyMedicalRelief(AvianFlu)
EmergencyMedicalServices
HealthsectorDisasterPreparedness&Response 65.00
HumanResourceDevelopmentforEmergencyMedicalServices 65.00
Total-HealthSectorDisasterPreparedness&ManagementincludingEMR(includingAvianFlu)&EmergencyMedicalServices
130.00
2.12 NationalOrganTransplantProgramme 90.65
2.13 ImpactingResearchInnovationandTechnology(Imprint)Scheme(New) 30.00
2.14 SwatchhtaActionPlan(SAP)NEW
EstablishingandstrengtheningofNCDCBranchesandHealthInitiatives-IntersectoralCoordinationforpreparationandcontrolofZoonoticDiseasesandotherneglectedtropicaldiseases,surveillanceofViralHepatitis,Anti-MicrobialResistance
100.00
B Total-CentralSectorSchemes/Projects 4969.65
3 OtherCentralExpenditure,includingthoseonCPSEsandAutonomousBodies
3.01 MedicalTreatmentofCGHSPensioners(PORB) 1558.86
3.02 PurchaseofMaterialinIndiaandAbroad 310.00
Deduct Recoveries -310.00
Net
3.03 InternationalCooperation/InternationalHealth
(i)ContributiontoIRCS 0.01
(ii)ContributiontoWHO 28.00
(iii)DelegationtoInternationalConference 4.00
(IV)Int.Conf.onMed.&PublicHealth 2.60
(v)CodexTrustFund(CTF)
(vi)MembershipforInternationalOrg. 8.00
(vii)InternationalCo-operation(FW) 13.00
55.61
3.04 OtherMiscellaneousExpenditure
OversightCommittee 18.50
NationalCentreforDiseaseControlProgramme 25.39
PublicHealthFoundationofIndia(PHFI)
DiscretionaryGrant 3.75
HajPilgrims 6.00
Rashtriya Arogya Nidhi 51.50
AwardofPrizesinHindi 0.08
AwardofPrizestoGovt.Hospitals/InstitutionsunderKayaKalpScheme 10.00
CounsellingforUG/PGseatsinGovernmentColleges 2.61
Deduct Recoveries -2.61

203National Health Profile 2018
Net
EstablishmentofStemCellDonorRegistry 3.00
Total-DeductRecovery -2.61
Total-Net 118.22
3.05 AutonomousBodiesandPSUs
StatutoryBodies
1 AllIndiaInstituteofMedicalSciences(AIIMS),NewDelhi 3018.00
2 PostGraduateInstituteofMedicalEducation&Research,Chandigarh 1207.98
3 JawaharlalInstituteofPostGraduateMedicalEducation&Research,Puducherry 1096.70
4 NationalInstituteofMentalHealth&Neuro-Sciences,Bangaluru 382.60
5 NEIGRIHMS,Shillong 212.00
6 RIMS,Imphal 201.40
7 RIPANS,Aizawl 32.00
8 LGBRIMH,Tejpur 60.00
9 OtherAutonomousBodies
LalaRamSwarupInstituteofT.B.andAlliedDiseases,NewDelhi 75.26
VallabhBhaiPatelChestInstitute,DelhiUniversity 65.50
KasturbaHealthSociety,Wardha 67.33
CancerControl(CNCI,Kolkata) 128.54
AllIndiaInstituteofSpeech&Hearing,Mysore 133.47
NIBS&QualityControl,Noida 41.79
PasteurInstituteofIndia,Conoor 74.20
NewDelhiTBCentre 4.30
Indian Red Cross Society 0.40
St.JohnsAmbulance 0.04
InstituteofHumanBehavior&AlliedSciences
NIHFW,NewDelhi 65.00
IIPS,Mumbai 33.92
Total 689.75
RegulatoryBodies
22 FoodSafety&SAI 141.60
23 IndianPharmacopeiaCommission 35.45
24 Medical Council of India 1.00
25 Dental Council of India 0.30
26 PharmacyCouncilofIndia 0.20
27 Indian Nursing Council 0.21
28 NationalAcademyofMedicalSciences 1.80
29 NationalBoardofExamination 0.01
Total-RegulatoryBodies 180.57
Total-AutonomousBodies 7081.00

204 National Health Profile 2018
PSUs
30 HLLLifeCareLimited
Total-AutonomousBodiesandPSUs 7081.00
C Total-OtherCentralExpenditure,includingthoseonCPSEsandAutonomousBodies 8813.69
Total(A+B+C) 18570.39
CentrallySponsoredScheme(CSS)
4 TransfertoState
4.1 TetiaryCareProgramme/Scheme
(1)NationalTobaccoControlProgramme 0.00
(2)NationalMentalHealthProgramme 0.00
(3)AssistanceforCapacityBuildingforTraumaCenters 0.00
(i)TraumaCenters 0.00
(ii)PreventionofBurnInjury 0.00
Total 0.00
(4)NationalProg.forPreventionandControlofCancer,Diabetes,CardiovascularDiseasesandStroke 0.00
(5)HealthCarefortheElderly 0.00
(6)NationalProg.forControlofBlindness 0.00
(7)Telemedicine 0.00
Total-TertiaryCareProgramme/Scheme 0.00
4.2 HumanResourcesforHealth&MedicalEducation
(i)Upgrd./Streng.ofNursingServices(ANM/GNM) 0.00
(ii)Strengthening/Upgrd.ofPharmacySch./Coll. 0.00
(iii)Streng./CreationofParamedicalInst.(RIPS/NIPS) 0.00
(iv)DistrictHospital-UpgradationofStateGovernmentMedicalColleges(PGSeats) 0.00
(v)StrengtheningGovt.MedicalColleges(UGSeats)andCentralGovt.HealthInstitutions 0.00
(vi)EstablishingNewMedicalColleges(UpgradingDistrictHospitals) 0.00
(vii)SettingupofStateinstitutionsofparamedicalsciencesinStatesandSettingupofCollegeofParamedicalEducation
0.00
(viii)SettingupofCollegeofpharmacyinGovt.MedicalColleges 0.00
(ix)StrengtheningofDistricthospitalsforprovidingadvancedsecondarycare 0.00
(x)Innovationbasedschemes 0.00
Total-HumanResourcesforHealth 0.00
Total-TransfertoState 0.00
GrandTotal** 18570.39
Source: Budget (Health) Division, Ministry of Health & family WelfareNotes: BudgetforRSBY,TertiaryCareandHumanResourcesforHealth&MedicaleducationaretransferredtoNHMBudget* NoallocationhasbeenmadebyMinistryofFinanceforCentrallySponsoredSchemesunderHealthSectorincludingtheTertiary
SectorofNon-CommunicableDiseaseswhicharesubmittedunderNHM.** GrandTotaldoesnotincludeNACOBudgetandthesamehasseparatelyshowninTable4.7

205National Health Profile 2018
Table4.5: Scheme-wiseApprovedOutlayforNHMforAnnualPlan2018-19
(Rs.incrores)S.No. NameoftheScheme ApprovedOutlay
for2018-19
1 2 3
A NRHM-RCHFlexiblePool 15006.33
1 RCHFlexiblePool 5253.51
2 RoutineImmunisation
3 PulsePolioImmunisation
4 IodineDeficiencyDisorderControlProgramme
5 HealthSystemStrengtheningunderNRHM** 9752.82
B NationalUrbanHealthMission-FlexiblePool 875.00
C FlexiblePoolforCommunicableDiseases 1928.00
1 NationalVectorBorneDiseaseControlProgram 1928.00
2 NationalT.B.ControlProgramme
3 NationalLeprosyEradicationProgramme
4 IntegratedDiseaseSurveillanceProgramme
D FlexiblePoolforNon-CommunicableDiseases,Injury&Trauma 1004.67
1 NationalProgrammeforControlofBlindness 1004.67
2 NationalMentalHealthProgramme
3 Health Care for the Elderly
4 NationalProgrammeforPrevention&ControlofDeafness
5 NationalTobaccoControlProgramme
6 NationalOralHealthProgramme
7 AssistancetoStatesforCapacityBuilding
8 NationalProg.forPrevandControlofCancer,Diabetes,CVDandStroke
9 OtherNewInitiativesunderNon-CommunicableDiseases
E ForwardLinkagestoNRHM 27.49
F InfrastructureMaintenance 5693.41
G StrengtheningofStateDrugRegulatorySystem 206.00
H OtherHealthSchemes 40.00
PilotProjects 40.00
(i) Sports Medicine
(ii) Deafness
(iii)LeptospirosisControl
(iv)ControlofHumanRabies
(v)MedicalRehabilitation
(vi) Oral Health
(vii)Fluorosis
I HumanResourcesforHealth*** 0
J PrimeMinister'sDevelopmentPlanforJammu&Kashmir 273.71
StrengtheningofNationalProgrammeManagementoftheNHM 100.00
K NationalHealthMission-Total 25154.61

206 National Health Profile 2018
L RashtriyaSwasthyaBhimaYojana 2000.00
M HumanResourcesforHealth&MedicalEducation*** 4225.00
Upgradation/StrengtheningofNursingServices(ANM/GNMSchools) 66.00
Strengthening/UpgradationofPharmacySchools/Colleges 5.00
Streng.Govt.Med.Colleges(UGSeats)andCentralGovt.Healthinstitutions* 794.07
EstablishingNewMedicalColleges(UpgradedDistrictHospitals)* 2887.68
SettingupofStateinst.ofparamedicalsciencesinStatesandSettingupofCollegeofParamedicalEdu.* 20.00
DistrictHospitals-UpgradationofStateGovernmentMedicalColleges-PGSeats 452.25
N TertiaryCareProgramme/Schemes*** 750.0
NationalMentalHealthProgramme 50.00
AssistanceforcapacitybuildingforTraumaCentres 150.00
NationalProgrammeforControlofCancer,Diabetes,CardiovascularDiseasesandStroke(NPCDCS) 295.00
NationalProgrammeforHealthcareforElderly 105.00
NationalProgrammeforControlofBlindness 30.00
TobaccoControlProgramme 20.00
DDAP 45.00
Telemedicine 55.00
GRANDTOTAL(K+L+M+N) 32129.61Source: Budget (NHM) Division, Ministry of Health & family WelfareNotes: * CentralSectorSchemesshiftedtoHealthSector** MissionFlexiPoolrenamed*** ShiftedfromHealthSector

207National Health Profile 2018
Table:4.6:SchemewisePlanOutlayandExpenditureforAYUSH2015-16to2018-19
(Rs.incrores)Sl.No Schemes/Programmes 2015-16 2016-17 2017-18 2018-19
BE RE AE BE RE AE BE AE(ason7.3.17)
BE
1 2 3 4 5 6 7 8 9 10 11
A CENTRALSECTORSCHEMES
1 SystemStrengthening 165.00 117.91 114.01 112.75 146.72 140.97 193.25 84.69 158.18
a) StrengtheningofDepartmentofAYUSH 37.20 19.00 18.64 4.00 3.62 3.38 30.00 25.39 66.29
1 Secretariat-DepartmentofAYUSH 22.00 17.00 17.33 25.00 22.57 38.00
2 PharmacopoeiaCommitteesofASUandstrengtheningofPharmacopoeiaCommissionofIndianMedicine(PCIM)
3.70 2.00 1.31 4.00 3.62 3.38 5.00 2.82 5.29
3 AcquisitionofOfficeBuilding 11.50 0.00 0.00 0.00 0.00 23.00
b) StatutoryInstitutions 1.45 1.55 1.55 1.50 5.27 5.20 7.99 5.84 9.60
1 GranttoCentralCouncilofIndianMedicine,New Delhi
1.25 1.00 1.00 1.25 1.25 1.25 4.14 3.93 5.10
2 GranttoCentralCouncilofHomoeopathy,New Delhi
0.20 0.55 0.55 0.25 4.02 3.95 3.85 1.91 4.50
c) Hospital & Dispensaries 94.35 58.79 58.20 59.00 100.50 100.10 104.00 19.58 32.00
1 AllIndiaInstituteofAyurveda(AIIA),NewDelhi
25.00 2.49 2.49 40.00 26.00 26.00 24.00 19.58 32.00
2 AYUSHexpansioninCGHS 1.00 1.00 0.92 1.50 1.50 1.16
3 AllIndiaInstituteofYoga 0.10 0.00 0.00 8.00 19.00 19.00 24.00 0.00
4 AllIndiaInstituteofHomeopathy 38.25 50.35 49.84 4.50 25.00 25.00 28.00 0.00
5 AllIndiaInstituteofUnaniMedicine 15.00 0.00 0.00 1.00 25.00 25.00 28.00 0.00
6 YogaTrainingforPolicePersonnel 15.00 4.95 4.95 4.00 4.00 3.94
d) StrengtheningofPharmacopeialLaboratories
8.00 5.57 4.97 6.25 5.67 4.67 11.50 5.60 11.29
1 PharmacopoeialLaboratoryofIndianMedicine,Ghaziabad
1.70 1.49 0.97 2.30 1.72 1.02 4.00 2.82 4.60
2 HomoeopathicPharmacopoeiaLaboratory,Ghaziabad
1.20 1.00 0.92 1.25 1.25 0.95 4.00 2.78 5.69
3 PublicSectorUndertaking(IMPCL,Mohan,UP)
5.00 3.08 3.08 2.70 2.70 2.70 3.00 0.00 0.50
4 HomoeopathicPharmacopoeiaCommittee 0.50 0.50
5 HomoeopathicMedicinesPharmaceuticalCo.Ltd.
0.10 0.00 0.00
e) Information,EducationandCommunication
20.00 30.00 27.70 30.00 27.00 24.66 34.00 25.45 34.00
Information,EducationandCommunication 20.00 30.00 27.70 30.00 27.00 24.66 34.00 25.45 34.00

208 National Health Profile 2018
f) AYUSHandPublicHealth 4.00 3.00 2.95 12.00 4.66 2.96 5.76 2.83 5.00
2 EducationalInstitutions 200.00 145.27 139.18 172.45 166.95 166.42 248.70 264.48 324.50
1 GrantforInstt.PostGrad.Teaching&Research,Jamnagar
7.80 6.73 6.73 8.10 8.10 8.10 31.00 26.98 34.00
2 GranttoNationalInstituteofAyurveda,Jaipur
24.00 18.88 20.65 24.00 23.50 24.00 56.00 80.00 90.00
3 GranttoRashtriyaAyurvedaVidyapeeth 12.00 8.00 8.00 10.00 5.50 5.50 9.00 6.25 8.50
4 GranttoNationalInstituteofSiddha,Tamilnadu
30.50 26.00 26.00 28.00 25.00 25.00 30.00 26.21 35.50
5 GranttoNationalInstituteofHomoeopathy,Kolkata
34.00 32.00 26.00 34.00 31.67 31.67 37.50 47.25 46.00
6 GranttoNationalInstituteofUnaniMedicine,Bangalore
23.00 21.00 21.00 23.00 21.50 21.50 25.00 49.45 36.50
7 MorarjiDesaiNationalInstituteofYoga 12.00 3.50 3.00 4.00 4.00 4.00 9.00 9.22 16.00
8 GranttoNationalInstituteofNaturopathy,Pune
5.00 12.66 12.66 6.00 25.90 25.90 26.00 5.14 24.00
9 NorthEasternInstituteofAyurveda&Homoeopathy,Shillong
14.00 1.80 1.80 9.00 7.55 7.55 10.00 7.51 18.00
10 NorthEasternInstituteofAYUSH/FolkMedicine,Passighat
6.40 1.70 1.60 6.00 7.45 7.45 10.00 2.50 10.00
11 AssistancetoaccreditedAYUSHCentresofExcellenceinnon-governmental/privatesectorengagedinAYUSHeducation/drugdevelopment&research/clinicalresearch/folkmedicineetc.
20.00 13.00 11.74 19.00 2.78 1.75 4.00 3.97 5.00
12 NationalInstituteofMedicinalPlants 0.50 0.00 0.00 0.35 0.00 0.10
13 NationalInstituteofSowaRigpa 10.70 0.00 0.00 0.50 4.00 4.00 1.00 1.00
14 IndianInstituteofAYUSHPharmaceuticalSciences
0.10 0.00 0.00 0.50 0.00 0.10
15 NationalInstituteofGeriatrics
16 NationalInstituteofMetabolicandLifestyleDiseases
17 NationalInstituteofDrugandTobaccoDe-addiction
3 Research&DevelopmentincludingMedicinal Plants
300.00 286.43 286.38 335.20 289.97 273.26 526.70 502.45 618.40
RESEARCHCOUNCILS 231.00 229.03 229.15 265.20 232.87 217.04 455.70 447.64 555.91
1 Grant to Central Council for Research in Ayurvedic Sciences
76.70 96.00 96.00 86.00 75.00 70.00 175.00 178.57 252.91
2 Grant to Central Council for Research in UnaniMedicine
66.00 42.66 43.92 66.00 64.00 57.24 123.00 115.72 130.00
3 Grant to Central Council for Research in Yoga&Naturopathy
13.00 17.05 16.85 27.00 24.00 24.00 32.00 31.50 29.00
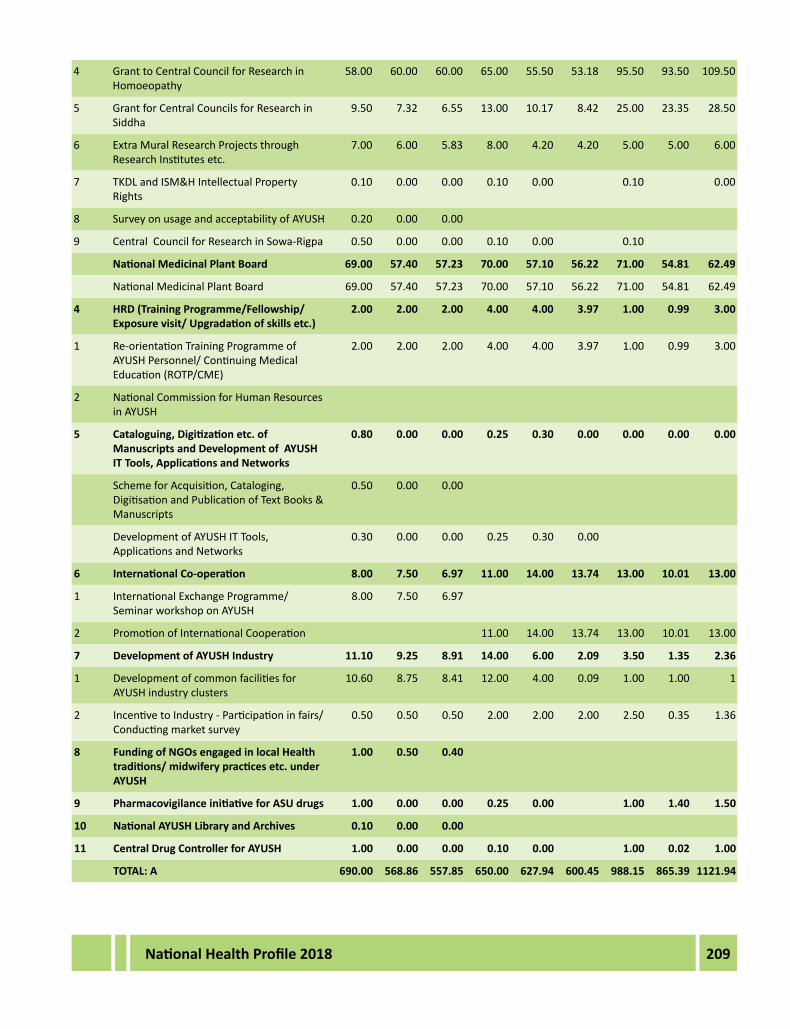
209National Health Profile 2018
4 Grant to Central Council for Research in Homoeopathy
58.00 60.00 60.00 65.00 55.50 53.18 95.50 93.50 109.50
5 Grant for Central Councils for Research in Siddha
9.50 7.32 6.55 13.00 10.17 8.42 25.00 23.35 28.50
6 ExtraMuralResearchProjectsthroughResearchInstitutesetc.
7.00 6.00 5.83 8.00 4.20 4.20 5.00 5.00 6.00
7 TKDLandISM&HIntellectualPropertyRights
0.10 0.00 0.00 0.10 0.00 0.10 0.00
8 SurveyonusageandacceptabilityofAYUSH 0.20 0.00 0.00
9 CentralCouncilforResearchinSowa-Rigpa 0.50 0.00 0.00 0.10 0.00 0.10
NationalMedicinalPlantBoard 69.00 57.40 57.23 70.00 57.10 56.22 71.00 54.81 62.49
NationalMedicinalPlantBoard 69.00 57.40 57.23 70.00 57.10 56.22 71.00 54.81 62.49
4 HRD(TrainingProgramme/Fellowship/Exposurevisit/Upgradationofskillsetc.)
2.00 2.00 2.00 4.00 4.00 3.97 1.00 0.99 3.00
1 Re-orientationTrainingProgrammeofAYUSHPersonnel/ContinuingMedicalEducation(ROTP/CME)
2.00 2.00 2.00 4.00 4.00 3.97 1.00 0.99 3.00
2 NationalCommissionforHumanResourcesinAYUSH
5 Cataloguing,Digitizationetc.ofManuscriptsandDevelopmentofAYUSHITTools,ApplicationsandNetworks
0.80 0.00 0.00 0.25 0.30 0.00 0.00 0.00 0.00
SchemeforAcquisition,Cataloging,DigitisationandPublicationofTextBooks&Manuscripts
0.50 0.00 0.00
DevelopmentofAYUSHITTools,ApplicationsandNetworks
0.30 0.00 0.00 0.25 0.30 0.00
6 InternationalCo-operation 8.00 7.50 6.97 11.00 14.00 13.74 13.00 10.01 13.00
1 InternationalExchangeProgramme/SeminarworkshoponAYUSH
8.00 7.50 6.97
2 PromotionofInternationalCooperation 11.00 14.00 13.74 13.00 10.01 13.00
7 DevelopmentofAYUSHIndustry 11.10 9.25 8.91 14.00 6.00 2.09 3.50 1.35 2.36
1 DevelopmentofcommonfacilitiesforAYUSHindustryclusters
10.60 8.75 8.41 12.00 4.00 0.09 1.00 1.00 1
2 IncentivetoIndustry-Participationinfairs/Conductingmarketsurvey
0.50 0.50 0.50 2.00 2.00 2.00 2.50 0.35 1.36
8 FundingofNGOsengagedinlocalHealthtraditions/midwiferypracticesetc.underAYUSH
1.00 0.50 0.40
9 PharmacovigilanceinitiativeforASUdrugs 1.00 0.00 0.00 0.25 0.00 1.00 1.40 1.50
10 NationalAYUSHLibraryandArchives 0.10 0.00 0.00
11 CentralDrugControllerforAYUSH 1.00 0.00 0.00 0.10 0.00 1.00 0.02 1.00
TOTAL:A 690.00 568.86 557.85 650.00 627.94 600.45 988.15 865.39 1121.94

210 National Health Profile 2018
B CENTRALLYSPONSOREDSCHEMES
1 PromotionofAYUSH 0.00 0.00 0.00 0.00 0.00 0.00 0.00 0.00 0.00
a) DevelopmentofInstitutions 0.00
b) Hospitals&Dispensaries(underNRHMincludingAYUSHflexi-pool)
c) DrugsQualityControl 0.00
d) PublicPrivatePartnershipforsettingupofspecialtyclinics/IPDs.
0.00
e) AYUSHGram 0.00
f) NationalAYUSHHealthProgram 0.00
2 NationalMissiononMedicinalPlants 0.00 0.00
NewScheme 318.00 331.14 331.01 400.00 400.00 417.52 440.50 482.26 504.43
1 NationalMissiononAYUSH(includingMission on Medicinal Plants)
NationalAYUSHMission 318.00 331.14 331.01 400.00 400.00 417.52 440.50 482.26 504.43
TOTAL:B 318.00 331.14 331.01 400.00 400.00 417.52 440.50 482.26 504.43
GrandTotal:(A+B) 1008.00 900.00 888.86 1050.00 1027.94 1017.97 1428.65 1347.65 1626.37
Source: Ministry of AYUSHNotes: BE-BudgetEstimates AE-ActualExpenditure
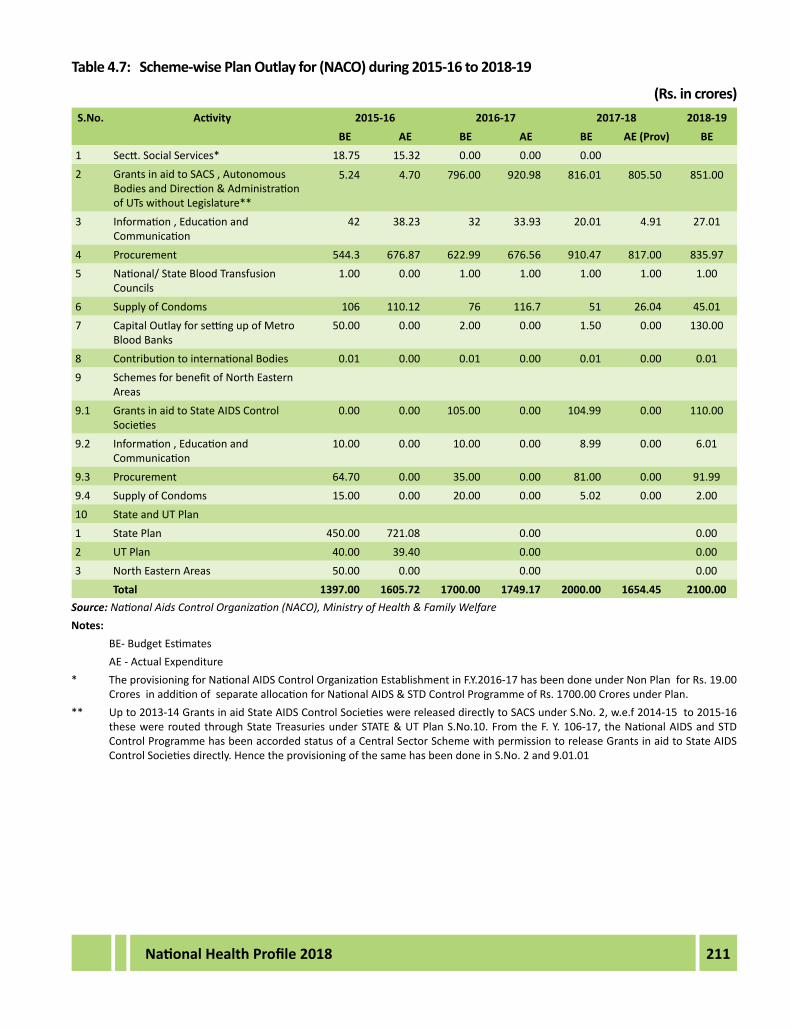
211National Health Profile 2018
Table4.7: Scheme-wisePlanOutlayfor(NACO)during2015-16to2018-19
(Rs.incrores)S.No. Activity 2015-16 2016-17 2017-18 2018-19
BE AE BE AE BE AE(Prov) BE1 Sectt.SocialServices* 18.75 15.32 0.00 0.00 0.00 2 GrantsinaidtoSACS,Autonomous
BodiesandDirection&AdministrationofUTswithoutLegislature**
5.24 4.70 796.00 920.98 816.01 805.50 851.00
3 Information,EducationandCommunication
42 38.23 32 33.93 20.01 4.91 27.01
4 Procurement 544.3 676.87 622.99 676.56 910.47 817.00 835.975 National/StateBloodTransfusion
Councils1.00 0.00 1.00 1.00 1.00 1.00 1.00
6 SupplyofCondoms 106 110.12 76 116.7 51 26.04 45.017 CapitalOutlayforsettingupofMetro
BloodBanks50.00 0.00 2.00 0.00 1.50 0.00 130.00
8 ContributiontointernationalBodies 0.01 0.00 0.01 0.00 0.01 0.00 0.019 SchemesforbenefitofNorthEastern
Areas
9.1 Grants in aid to State AIDS Control Societies
0.00 0.00 105.00 0.00 104.99 0.00 110.00
9.2 Information,EducationandCommunication
10.00 0.00 10.00 0.00 8.99 0.00 6.01
9.3 Procurement 64.70 0.00 35.00 0.00 81.00 0.00 91.999.4 SupplyofCondoms 15.00 0.00 20.00 0.00 5.02 0.00 2.0010 StateandUTPlan 1 State Plan 450.00 721.08 0.00 0.002 UTPlan 40.00 39.40 0.00 0.003 North Eastern Areas 50.00 0.00 0.00 0.00 Total 1397.00 1605.72 1700.00 1749.17 2000.00 1654.45 2100.00
Source: National Aids Control Organization (NACO), Ministry of Health & Family WelfareNotes: BE-BudgetEstimates AE-ActualExpenditure* TheprovisioningforNationalAIDSControlOrganizationEstablishmentinF.Y.2016-17hasbeendoneunderNonPlanforRs.19.00
CroresinadditionofseparateallocationforNationalAIDS&STDControlProgrammeofRs.1700.00CroresunderPlan.** Upto2013-14GrantsinaidStateAIDSControlSocietieswerereleaseddirectlytoSACSunderS.No.2,w.e.f2014-15to2015-16
thesewereroutedthroughStateTreasuriesunderSTATE&UTPlanS.No.10.FromtheF.Y.106-17,theNationalAIDSandSTDControlProgrammehasbeenaccordedstatusofaCentralSectorSchemewithpermissiontoreleaseGrantsinaidtoStateAIDSControlSocietiesdirectly.HencetheprovisioningofthesamehasbeendoneinS.No.2and9.01.01

212 National Health Profile 2018
Table:4.8 Scheme-wisePlanOutlayandExpenditureforDepartmentofHealthResearchduring2015-16to2018-19
(Rs.incrores)S.No
Schemes/Programmes
BudgetHead 2015-16 2016-17 2017-18 2018-19BE AE RE AE BE AE
(Prov)BE
1 2 3 4 5 6 7 8 9 101 Secretariat-Social
ServicesSecretariat-SocialServices 2.00 1.13 0.00 0.00 12.00 9.68 34.00
2 HumanResourceDevelopmentforHealth Research
Advanced Training in research in medicineandhealth
8.00 9.70 13.00 15.38 20.00 13.82 30.00
3 Grant-in-aidSchemeforinter-sectoralconvergence&promotionand guidance on research governance Issues.
Inter-sectoralcoordinationinMedical,BiomedicalandHealthResearch
30.50 14.00 14.25 15.99 20.00 17.95 35.00
Promotion&guidanceonresearchgovernance issues.
2.00 0.10 0.00 0.00 5.00 0.41 6.00
Matterrelatingtoscientificsocietiesandassociations,charitableandreligiousendowmentsinmedicineandhealth research
0.00 0.00 0.00 0.00 0.00 0.00 0.00
CoordinationwithGovernments/organizations
0.00 0.00 0.00 0.00 0.00 0.00 0.00
4 Managing epidemicsandnaturalcalamities
Mattersrelatingtoepidemics,naturalcalamitiesanddevelopmentoftoolstopreventoutbreaks
46.00 45.14 41.50 45.88 59.00 48.68 75.00
5 Developmentofinfrastructure forpromotionofhealth research
Promotion,coordinationanddevelopmentofbasic,appliedandclinical research
45.50 25.20 24.25 24.25 36.00 31.95 50.00
ModelRuralHealthResearchUnits 10.00 6.50 6.00 6.00 9.00 8.00 13.00
Internationalcooperationinmedicalandhealth research
Internationalcooperationinmedicaland health research
1.00 0.39 1.00 0.29 1.00 0.29 1.00
6 ICMR ICMR 568.17 545.66 610.00 793.40 1150.00 1150.00 1416.007 BhopalMemorial
Hospital&Research Centre
BMHRC 0.00 0.00 40.00 29.61 188.00 120.94 140.00
Grand Total 713.17 647.82 750.00 930.80 1500.00 1401.72 1800.00Source: Department of Health Research, Ministry of Health & Family WelfareNotes: BE-BudgetEstimate AE-ActualExpenditure


![South West Nova District Health Authoritynovascotia.ca/finance/site-finance/media/finance/Public...The South West Nova District Health Authority [“South West Health”] was formed](https://static.fdocuments.net/doc/165x107/60ca5cf14ed7256cde1255e0/south-west-nova-district-health-the-south-west-nova-district-health-authority.jpg)
