
Health Catalyst Overview Presentation August 2021 vF
34
August 2021 Overview Presentation
Transcript of Health Catalyst Overview Presentation August 2021 vF
August 2021
Overview Presentation
© 2021 Health CatalystProprietary and Confidential2
DisclaimerThis presentation and the accompanying oral presentation, if any, contain forward-looking statements. All statements other than statements of historical fact contained in this presentation, including
statements as to future results of operations and financial position, planned products and services, business strategy and plans, objectives of management for future operations of Health Catalyst, Inc. and
its subsidiaries (“Health Catalyst” or the “Company”), market size and growth opportunities, competitive position and technological and market trends, are forward-looking statements. In some cases, you
can identify forward-looking statements by terms such as “expect,” “plan,” “anticipate,” “intend,” “target,” “project,” “predicts,” “shall,” “potential,” “explore” or “continues” or the negative of these terms or
other similar words. Health Catalyst has based these forward-looking statements largely on its current expectations and assumptions and on information available as of the date of this presentation. The
Company assumes no obligation to update any forward-looking statements or any other information included in this presentation after the date of this presentation, except as required by law.
The forward-looking statements contained in this presentation and the accompanying oral presentation are subject to known and unknown risks, uncertainties, assumptions and other factors that may cause
actual results or outcomes to be materially different from any future results or outcomes expressed or implied by the forward-looking statements. These risks, uncertainties, assumptions and other factors
include, but are not limited to, those related to our business and financial performance, the impact of COVID-19 on our business and results of operations, our ability to attract and retain customers, our
ability to develop new products and services and enhance existing products and services, our ability to respond rapidly to emerging technology trends, our ability to execute on our business strategy, our
ability to compete effectively and our ability to manage growth. These risks and uncertainties may also include those described under the heading “Risk Factors” and elsewhere in the Company’s most
recent Annual Report on Form 10-K and Quarterly Report on Form 10-Q on file with the Securities and Exchange Commission (the “SEC”) and our other filings with the SEC. Moreover, we operate in a
very competitive and rapidly changing environment, and new risks may emerge from time to time. It is not possible for us to predict all risks, nor can we assess the impact of all factors on our business or
the extent to which any factor, or combination of factors, may cause actual results or outcomes to differ materially from those contained in any forward-looking statements we may make.
In addition to the Company’s GAAP financial information, this presentation includes certain non-GAAP financial measures. The non-GAAP measures have limitations as analytical tools and you should not
consider them in isolation or as a substitute for the most directly comparable financial measures prepared in accordance with GAAP. There are a number of limitations related to the use of these non-GAAP
financial measures versus their nearest GAAP equivalents. Other companies, including companies in our industry, may calculate non-GAAP financial measures differently or may use other measures to
evaluate their performance, all of which could reduce the usefulness of our non-GAAP financial measures as tools for comparison. We urge you to review the reconciliation of our non-GAAP financial
measures to the most directly comparable GAAP financial measures set forth in in the Company’s most recent Annual Report on form 10-K and Quarterly Report on Form 10-Q on file with the SEC and our
other filings with the SEC, and not to rely on any single financial measure to evaluate our business.
This presentation also contains estimates and other statistical data made by independent parties and by the Company relating to market size and growth and other industry data. These data involve a
number of assumptions and limitations, and you are cautioned not to give undue weight to such estimates. The Company has not independently verified the statistical and other industry data generated by
independent parties and contained in this presentation and, accordingly, it cannot guarantee their accuracy or completeness. In addition, projections, assumptions and estimates of its future performance
and the future performance of the markets in which it competes are necessarily subject to a high degree of uncertainty and risk due to a variety of factors. These and other factors could cause results or
outcomes to differ materially from those expressed in the estimates made by the independent parties and by Health Catalyst.
This presentation shall not constitute an offer to sell or the solicitation of an offer to buy any securities, nor shall there be any sale of any securities in any state or jurisdiction in which such offer, solicitation
or sale would be unlawful prior to registration or qualification under the securities laws of any such state or jurisdiction.
© 2021 Health CatalystProprietary and Confidential
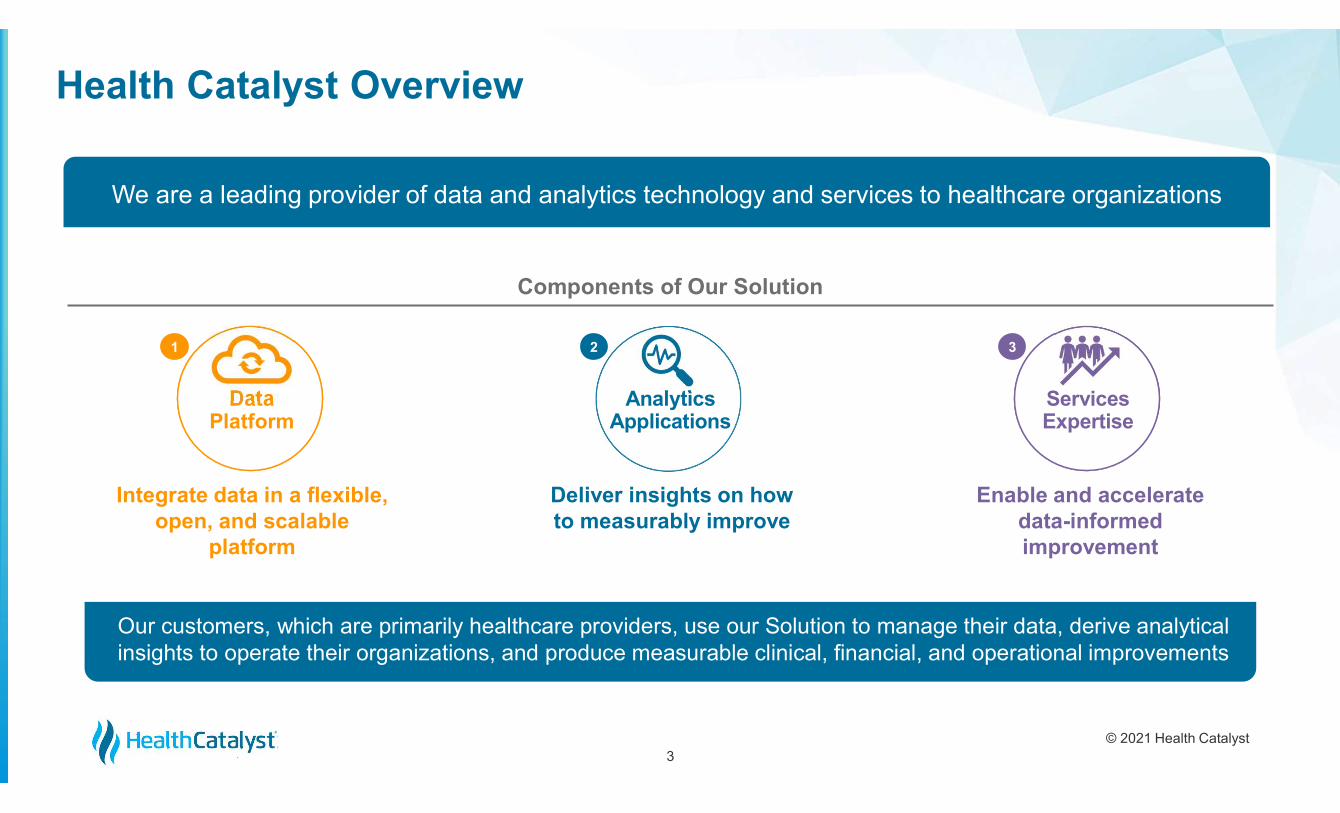
Health Catalyst Overview
Analytics Applications
Data Platform
Integrate data in a flexible, open, and scalable
platform
Deliver insights on how to measurably improve
Enable and accelerate data-informed improvement
Components of Our Solution
Services Expertise
3
1 2 3
We are a leading provider of data and analytics technology and services to healthcare organizations
Our customers, which are primarily healthcare providers, use our Solution to manage their data, derive analyticalinsights to operate their organizations, and produce measurable clinical, financial, and operational improvements
© 2021 Health CatalystProprietary and Confidential4
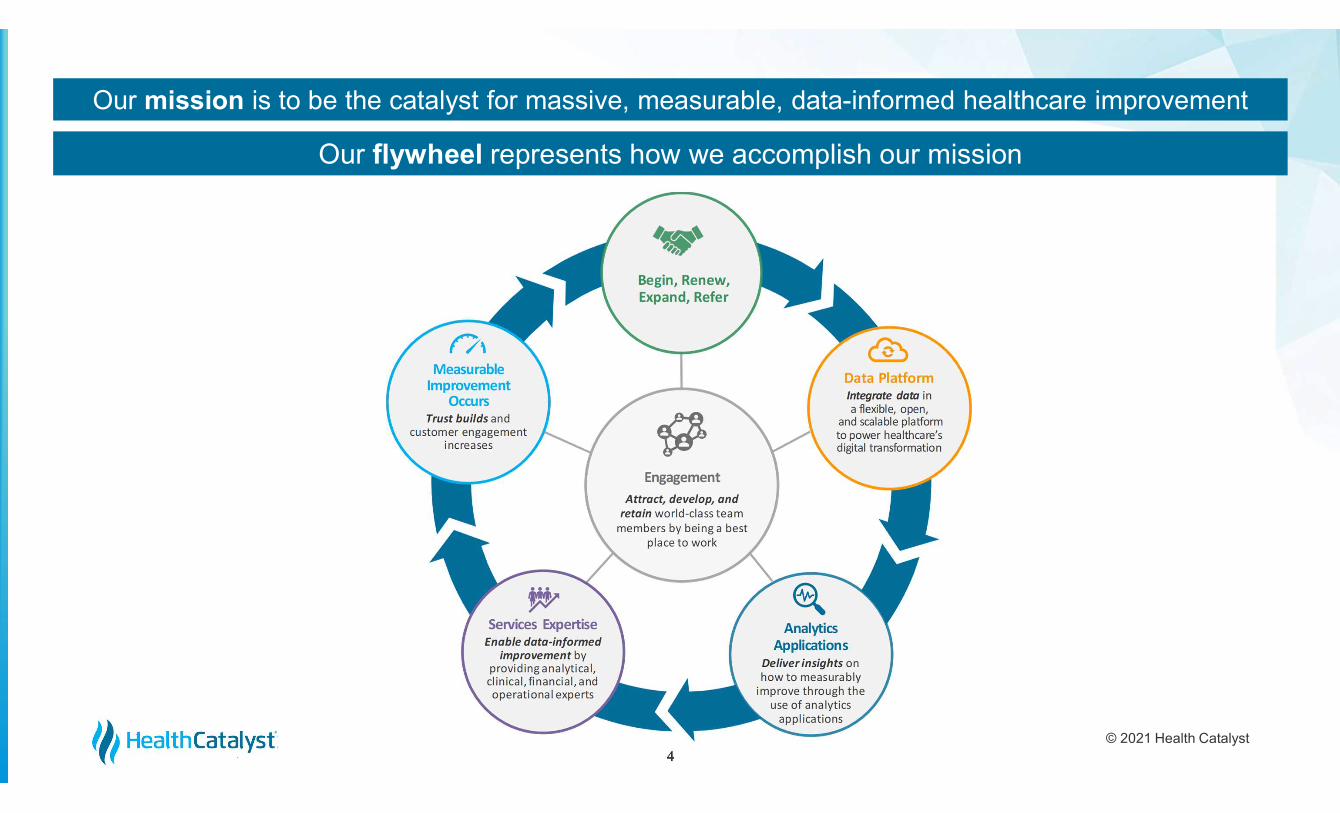
Our mission is to be the catalyst for massive, measurable, data-informed healthcare improvement
Our flywheel represents how we accomplish our mission
© 2021 Health CatalystProprietary and Confidential5
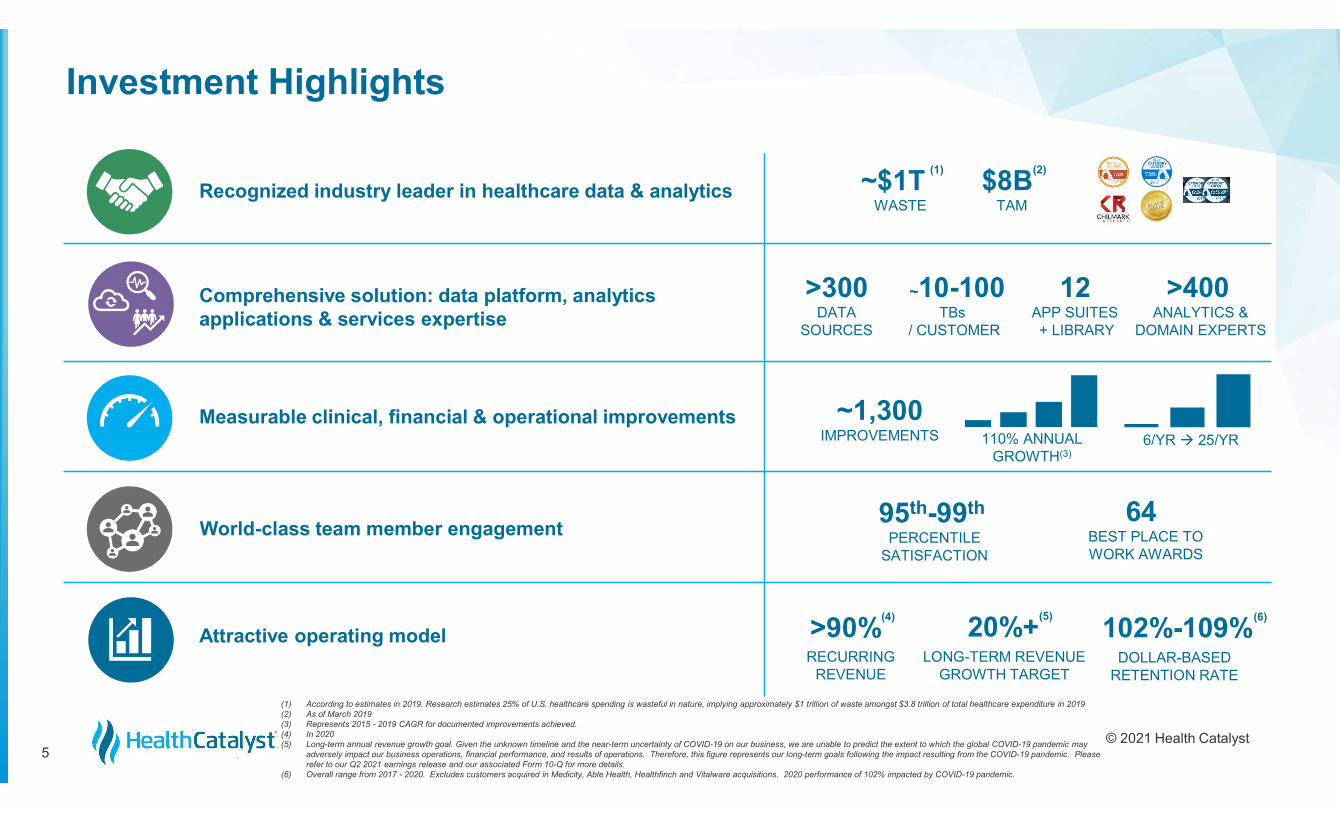
Investment Highlights
Recognized industry leader in healthcare data & analytics
Comprehensive solution: data platform, analytics applications & services expertise
Measurable clinical, financial & operational improvements
World-class team member engagement
Attractive operating model
$8B(2)
TAM~$1T
(1)
WASTE
~10-100TBs
/ CUSTOMER
>400ANALYTICS &
DOMAIN EXPERTS
~1,300IMPROVEMENTS
>90%(4)
RECURRINGREVENUE
20%+(5)
LONG-TERM REVENUEGROWTH TARGET
110% ANNUAL GROWTH(3)
6/YR 25/YR
64BEST PLACE TO WORK AWARDS
95th-99th
PERCENTILE SATISFACTION
102%-109%(6)
DOLLAR-BASED RETENTION RATE
(1) According to estimates in 2019. Research estimates 25% of U.S. healthcare spending is wasteful in nature, implying approximately $1 trillion of waste amongst $3.8 trillion of total healthcare expenditure in 2019(2) As of March 2019(3) Represents 2015 - 2019 CAGR for documented improvements achieved.(4) In 2020(5) Long-term annual revenue growth goal. Given the unknown timeline and the near-term uncertainty of COVID-19 on our business, we are unable to predict the extent to which the global COVID-19 pandemic may
adversely impact our business operations, financial performance, and results of operations. Therefore, this figure represents our long-term goals following the impact resulting from the COVID-19 pandemic. Please refer to our Q2 2021 earnings release and our associated Form 10-Q for more details.
(6) Overall range from 2017 - 2020. Excludes customers acquired in Medicity, Able Health, Healthfinch and Vitalware acquisitions. 2020 performance of 102% impacted by COVID-19 pandemic.
12APP SUITES + LIBRARY
>300DATA
SOURCES
© 2021 Health CatalystProprietary and Confidential
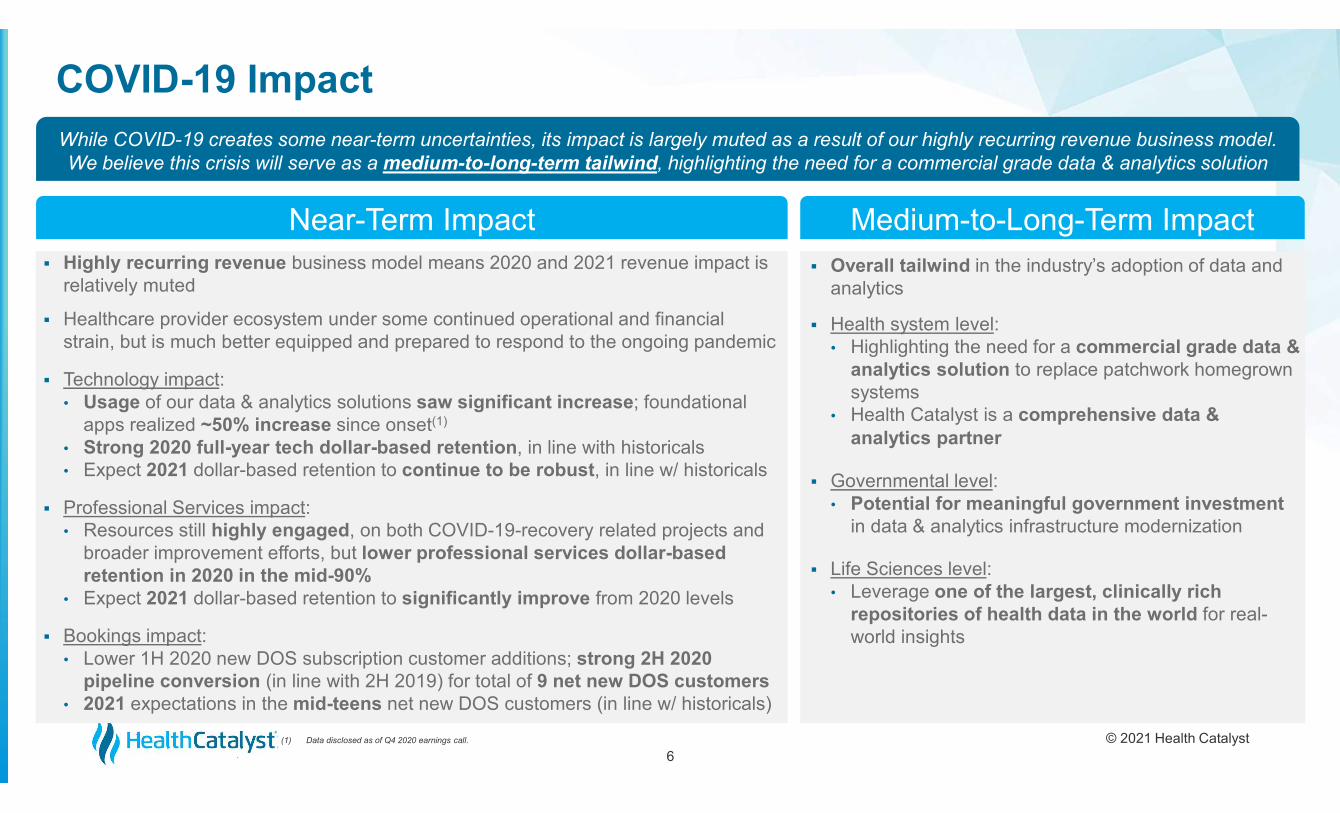
COVID-19 Impact
6
While COVID-19 creates some near-term uncertainties, its impact is largely muted as a result of our highly recurring revenue business model. We believe this crisis will serve as a medium-to-long-term tailwind, highlighting the need for a commercial grade data & analytics solution
Near-Term Impact Highly recurring revenue business model means 2020 and 2021 revenue impact is
relatively muted
Healthcare provider ecosystem under some continued operational and financial strain, but is much better equipped and prepared to respond to the ongoing pandemic
Technology impact:• Usage of our data & analytics solutions saw significant increase; foundational
apps realized ~50% increase since onset(1)
• Strong 2020 full-year tech dollar-based retention, in line with historicals• Expect 2021 dollar-based retention to continue to be robust, in line w/ historicals
Professional Services impact:• Resources still highly engaged, on both COVID-19-recovery related projects and
broader improvement efforts, but lower professional services dollar-based retention in 2020 in the mid-90%
• Expect 2021 dollar-based retention to significantly improve from 2020 levels
Bookings impact:• Lower 1H 2020 new DOS subscription customer additions; strong 2H 2020
pipeline conversion (in line with 2H 2019) for total of 9 net new DOS customers• 2021 expectations in the mid-teens net new DOS customers (in line w/ historicals)
Medium-to-Long-Term Impact Overall tailwind in the industry’s adoption of data and
analytics
Health system level:• Highlighting the need for a commercial grade data &
analytics solution to replace patchwork homegrown systems
• Health Catalyst is a comprehensive data & analytics partner
Governmental level:• Potential for meaningful government investment
in data & analytics infrastructure modernization
Life Sciences level:• Leverage one of the largest, clinically rich
repositories of health data in the world for real-world insights
(1) Data disclosed as of Q4 2020 earnings call.
© 2021 Health CatalystProprietary and Confidential
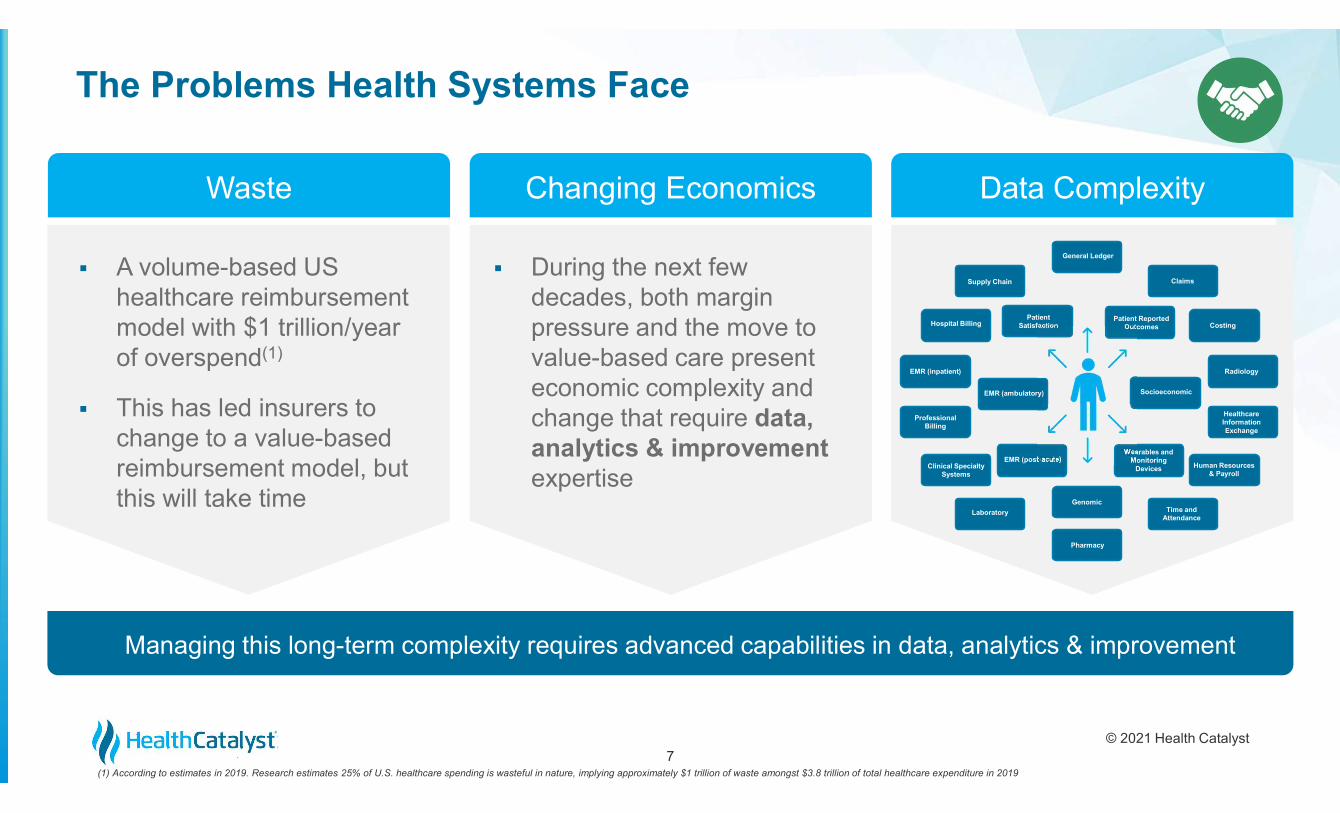
The Problems Health Systems Face
7(1) According to estimates in 2019. Research estimates 25% of U.S. healthcare spending is wasteful in nature, implying approximately $1 trillion of waste amongst $3.8 trillion of total healthcare expenditure in 2019
Waste Changing Economics Data Complexity
A volume-based US healthcare reimbursement model with $1 trillion/year of overspend(1)
This has led insurers to change to a value-based reimbursement model, but this will take time
During the next few decades, both margin pressure and the move to value-based care present economic complexity and change that require data, analytics & improvement expertise
Time andAttendance
Pharmacy
Genomic
Human Resources& Payroll
Wearables andMonitoring
Devices
Socioeconomic
HealthcareInformationExchange
Radiology
Patient ReportedOutcomes Costing
Claims
General Ledger
PatientSatisfaction
Supply Chain
Hospital Billing
EMR (inpatient)
EMR (ambulatory)
ProfessionalBilling
EMR (post-acute)Clinical Specialty
Systems
Laboratory
Managing this long-term complexity requires advanced capabilities in data, analytics & improvement
© 2021 Health CatalystProprietary and Confidential
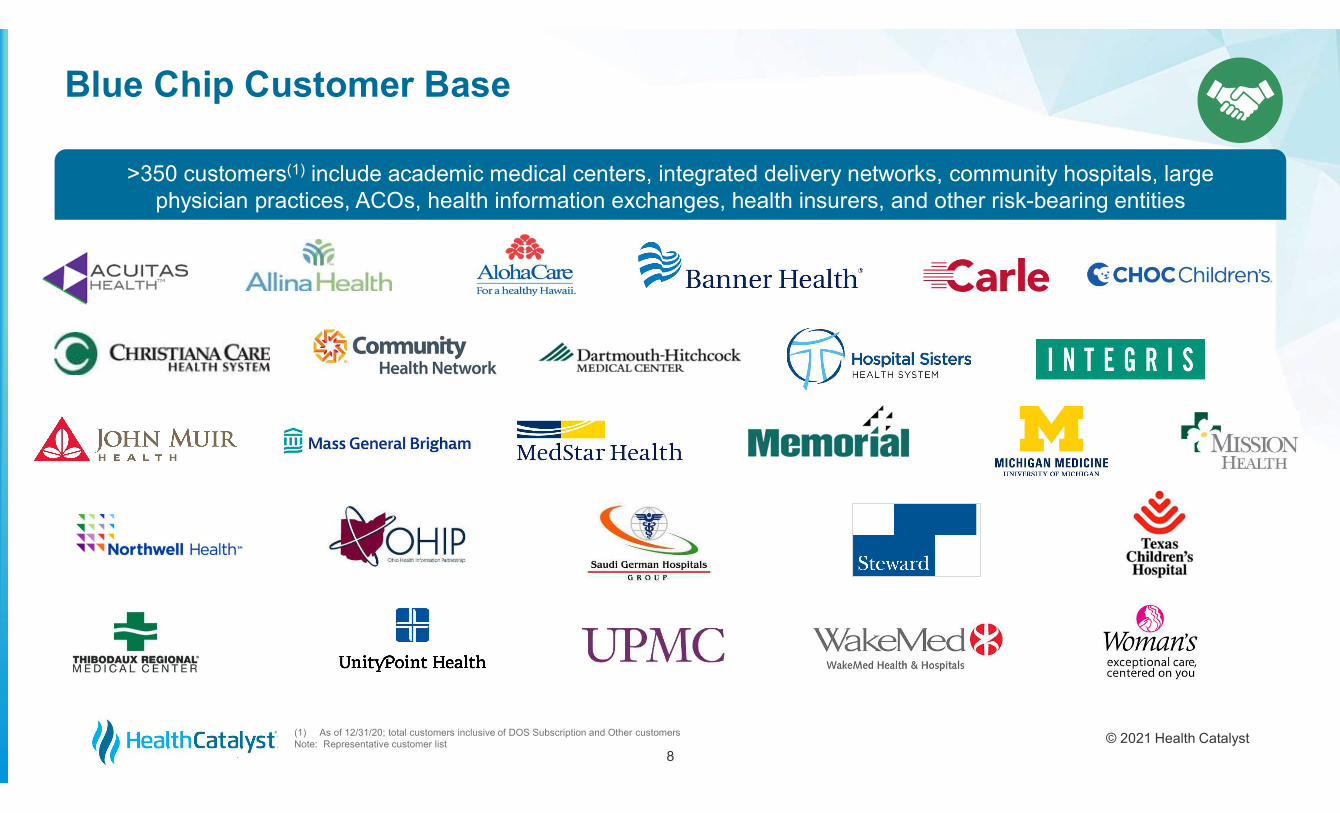
Blue Chip Customer Base
8
>350 customers(1) include academic medical centers, integrated delivery networks, community hospitals, largephysician practices, ACOs, health information exchanges, health insurers, and other risk-bearing entities
(1) As of 12/31/20; total customers inclusive of DOS Subscription and Other customersNote: Representative customer list
© 2021 Health CatalystProprietary and Confidential
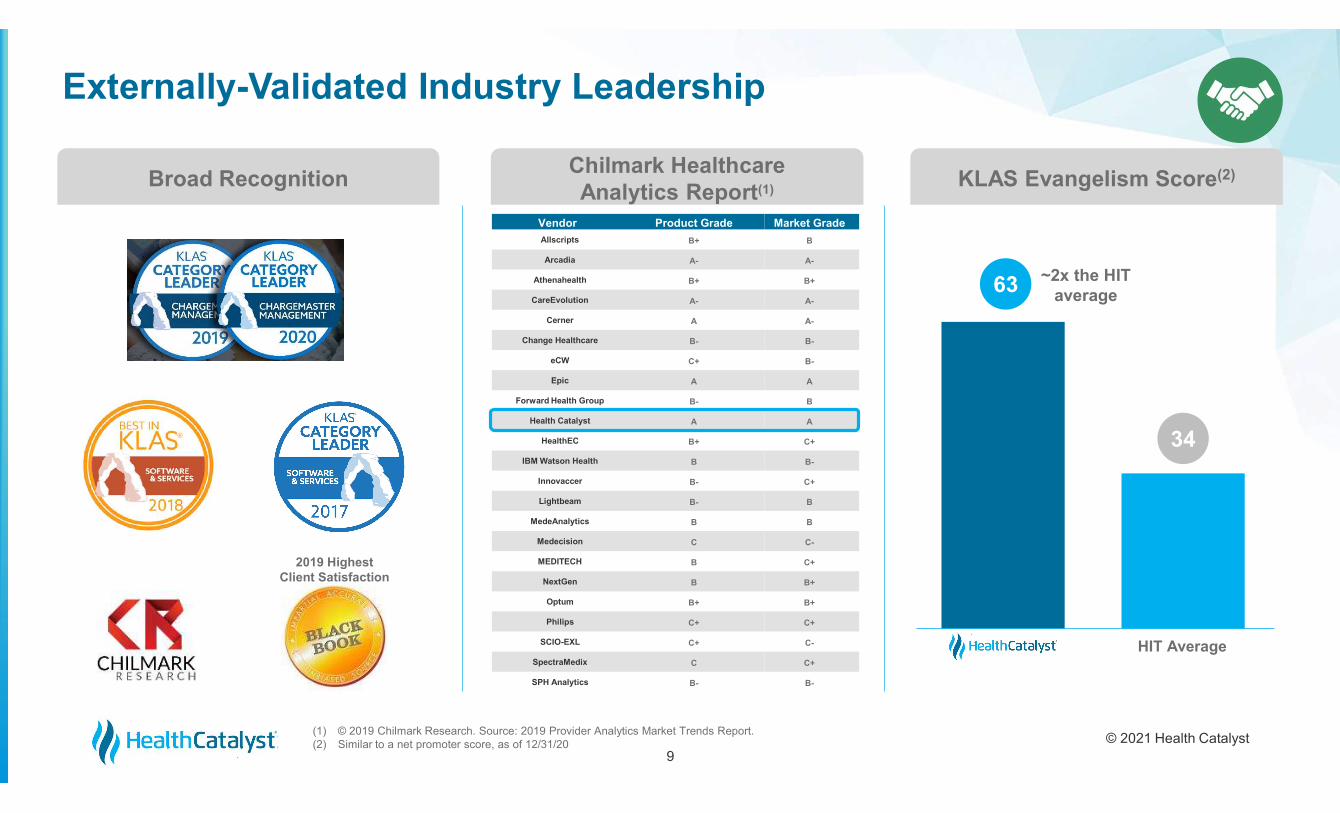
Externally-Validated Industry Leadership
Broad RecognitionChilmark HealthcareAnalytics Report(1)
9
2019 HighestClient Satisfaction
KLAS Evangelism Score(2)
HIT Average
Vendor Product Grade Market Grade
Allscripts B+ B
Arcadia A- A-
Athenahealth B+ B+
CareEvolution A- A-
Cerner A A-
Change Healthcare B- B-
eCW C+ B-
Epic A A
Forward Health Group B- B
Health Catalyst A A
HealthEC B+ C+
IBM Watson Health B B-
Innovaccer B- C+
Lightbeam B- B
MedeAnalytics B B
Medecision C C-
MEDITECH B C+
NextGen B B+
Optum B+ B+
Philips C+ C+
SCIO-EXL C+ C-
SpectraMedix C C+
SPH Analytics B- B-
~2x the HIT average
(1) © 2019 Chilmark Research. Source: 2019 Provider Analytics Market Trends Report.(2) Similar to a net promoter score, as of 12/31/20
63
34
© 2021 Health CatalystProprietary and Confidential
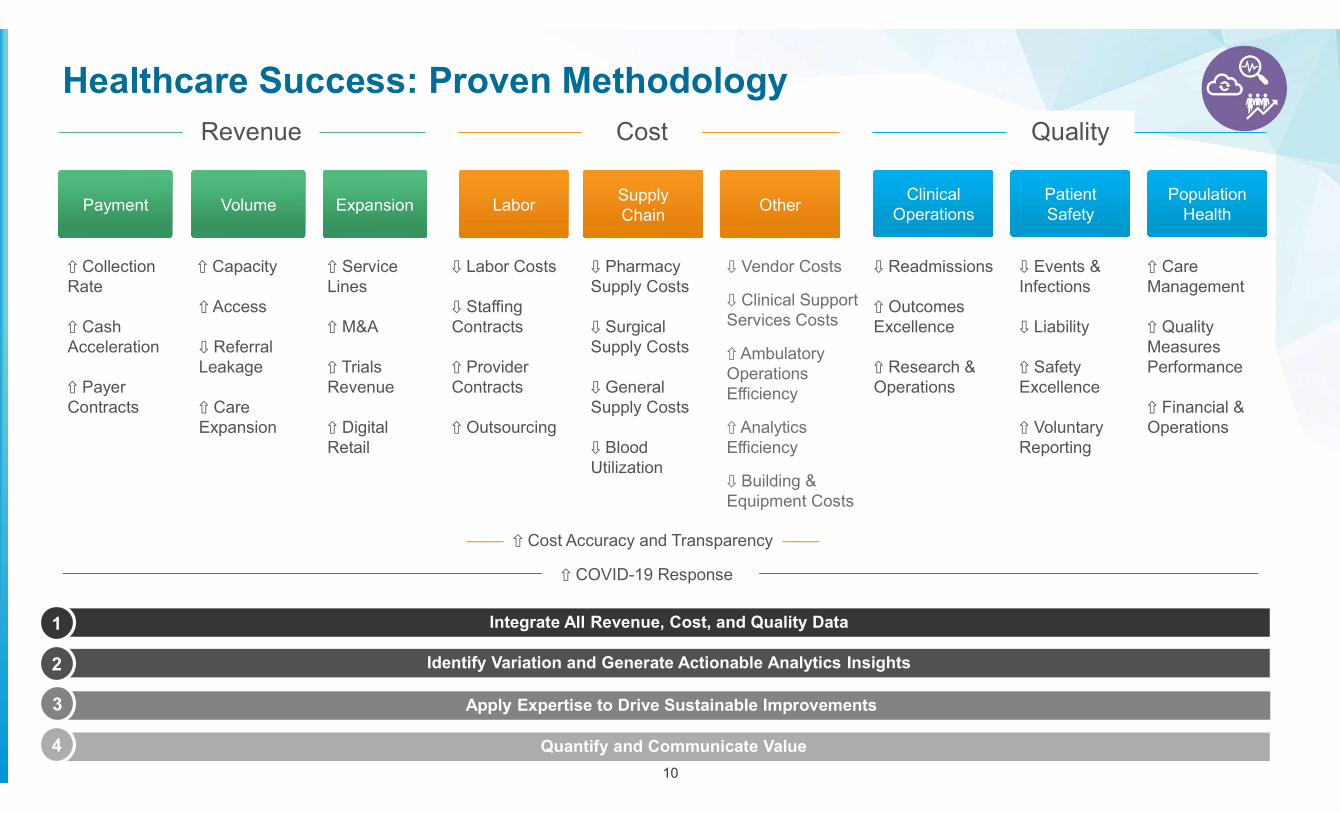
Healthcare Success: Proven Methodology
10
Identify Variation and Generate Actionable Analytics Insights2
Integrate All Revenue, Cost, and Quality Data1
Quantify and Communicate Value4
Apply Expertise to Drive Sustainable Improvements3
ExpansionVolume LaborSupply Chain
OtherPaymentPopulation
Health
Revenue Cost Quality
⇩ Pharmacy Supply Costs
⇩ Surgical Supply Costs
⇩ General Supply Costs
⇩ Blood Utilization
⇧ Capacity
⇧ Access
⇩ Referral Leakage
⇧ Care Expansion
⇧ Collection Rate
⇧ Cash Acceleration
⇧ Payer Contracts
⇧ Service Lines
⇧ M&A
⇧ Trials Revenue
⇧ Digital Retail
⇧ Care Management
⇧ Quality Measures Performance
⇧ Financial & Operations
Patient Safety
Clinical Operations
⇩ Readmissions
⇧ Outcomes Excellence
⇧ Research & Operations
⇩ Events & Infections
⇩ Liability
⇧ Safety Excellence
⇧ Voluntary Reporting
⇩ Vendor Costs
⇩ Clinical Support Services Costs
⇧ Ambulatory Operations Efficiency
⇧ Analytics Efficiency
⇩ Building & Equipment Costs
–––– ⇧ Cost Accuracy and Transparency ––––
⇩ Labor Costs
⇩ Staffing Contracts
⇧ Provider Contracts
⇧ Outsourcing
⇧ COVID-19 Response
© 2021 Health CatalystProprietary and Confidential11
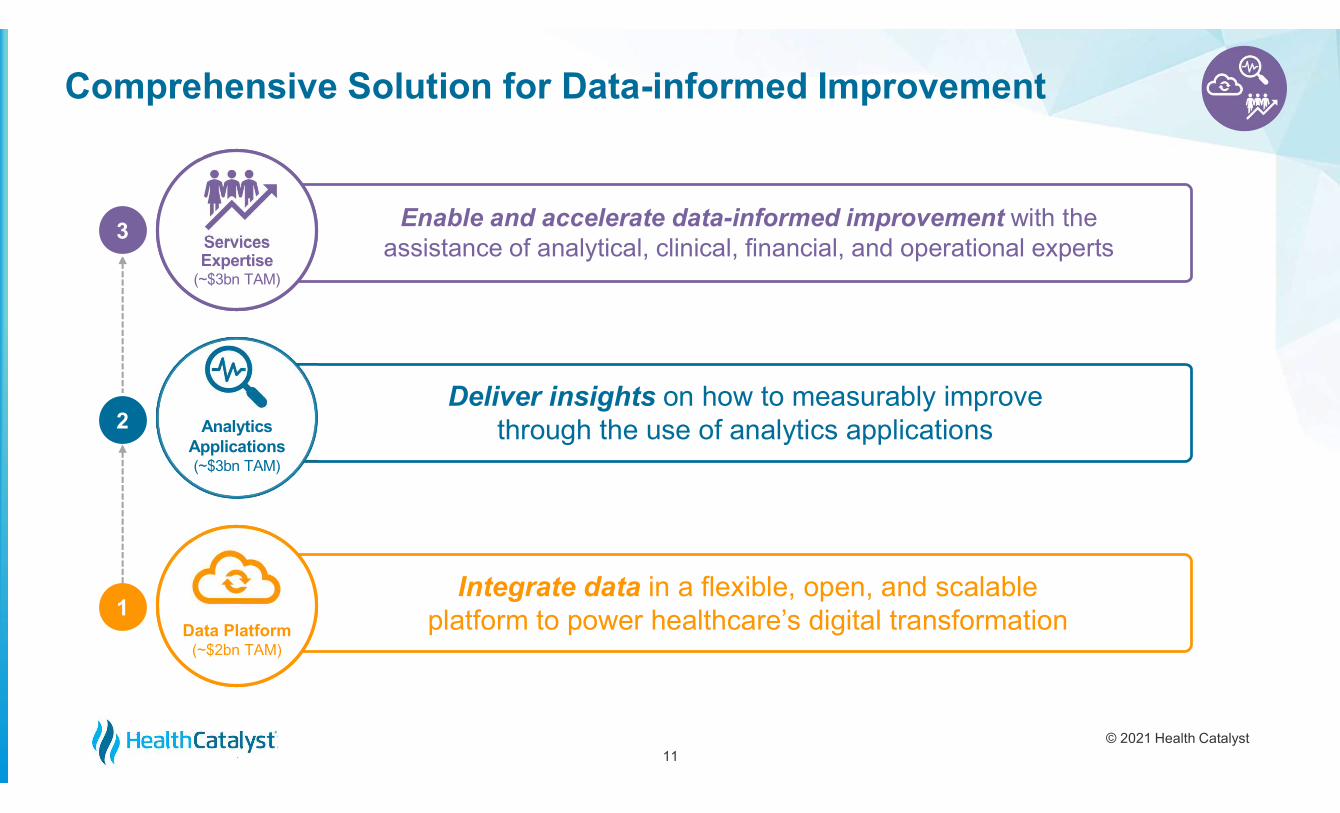
Comprehensive Solution for Data-informed Improvement
Services Expertise
(~$3bn TAM)
3 Enable and accelerate data-informed improvement with the assistance of analytical, clinical, financial, and operational experts
Analytics Applications(~$3bn TAM)
2Deliver insights on how to measurably improve
through the use of analytics applications
Data Platform(~$2bn TAM)
1Integrate data in a flexible, open, and scalable
platform to power healthcare’s digital transformation
© 2021 Health CatalystProprietary and Confidential
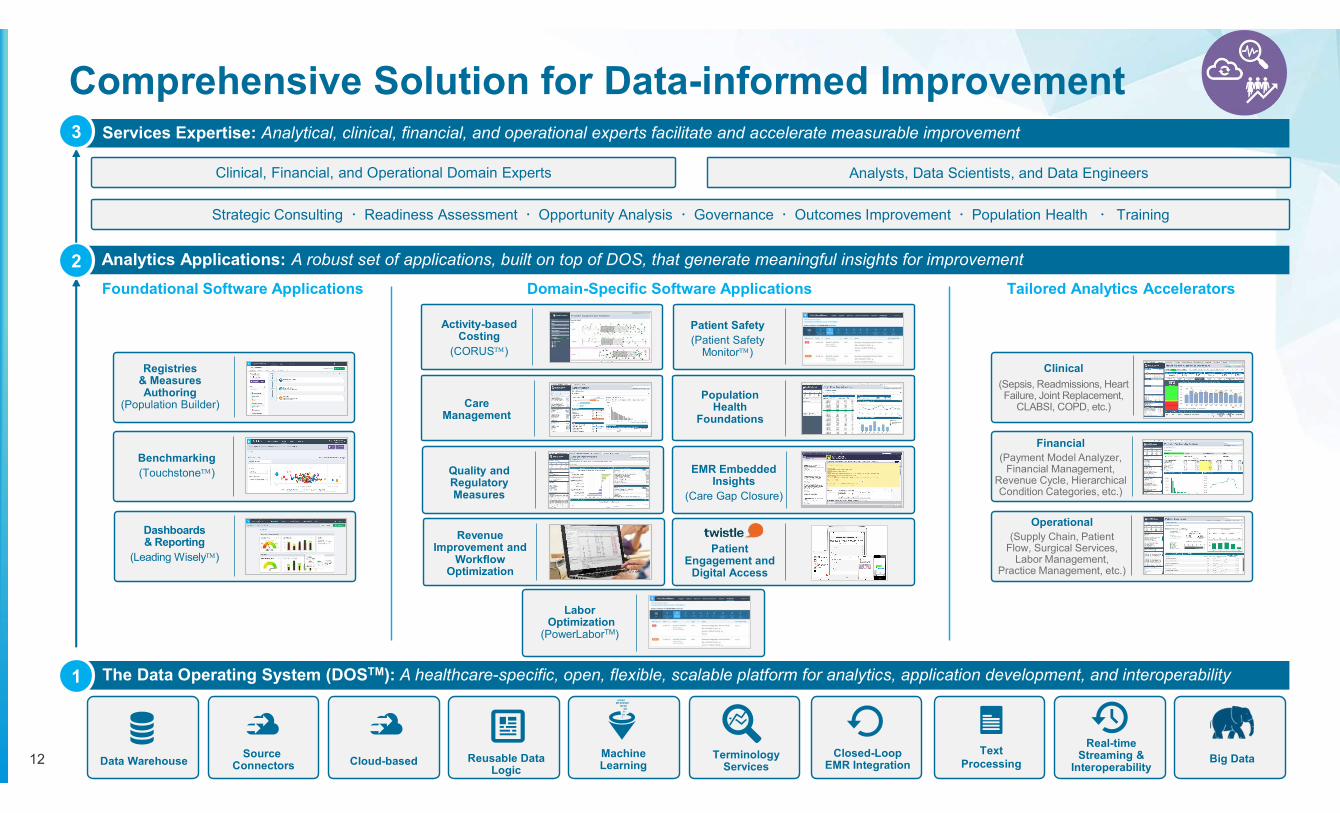
Comprehensive Solution for Data-informed Improvement
12
Analysts, Data Scientists, and Data Engineers
Analytics Applications: A robust set of applications, built on top of DOS, that generate meaningful insights for improvement
Professional Services
2
The Data Operating System (DOSTM): A healthcare-specific, open, flexible, scalable platform for analytics, application development, and interoperability1
Services Expertise: Analytical, clinical, financial, and operational experts facilitate and accelerate measurable improvement3
Clinical, Financial, and Operational Domain Experts
Strategic Consulting Readiness Assessment Opportunity Analysis Governance Outcomes Improvement Population Health Training
Activity-based Costing
(CORUS)
Patient Safety(Patient Safety
Monitor)
Foundational Software Applications Domain-Specific Software Applications Tailored Analytics Accelerators
Care Management
Benchmarking(Touchstone)
Registries & Measures Authoring
(Population Builder)
Financial(Payment Model Analyzer,
Financial Management, Revenue Cycle, Hierarchical Condition Categories, etc.)
Operational(Supply Chain, Patient
Flow, Surgical Services, Labor Management,
Practice Management, etc.)
Population Health
Foundations
Clinical
(Sepsis, Readmissions, Heart Failure, Joint Replacement,
CLABSI, COPD, etc.)
Quality and Regulatory Measures
Dashboards & Reporting
(Leading Wisely)
Terminology Services
Text Processing
Real-time Streaming &
InteroperabilityMachine Learning
Big DataClosed-Loop EMR IntegrationData Warehouse Cloud-based
Source Connectors
Reusable Data Logic
EMR Embedded Insights
(Care Gap Closure)
Revenue Improvement and
Workflow Optimization
12
Patient Engagement and
Digital Access
LaborOptimization
(PowerLaborTM)
© 2021 Health CatalystProprietary and Confidential13
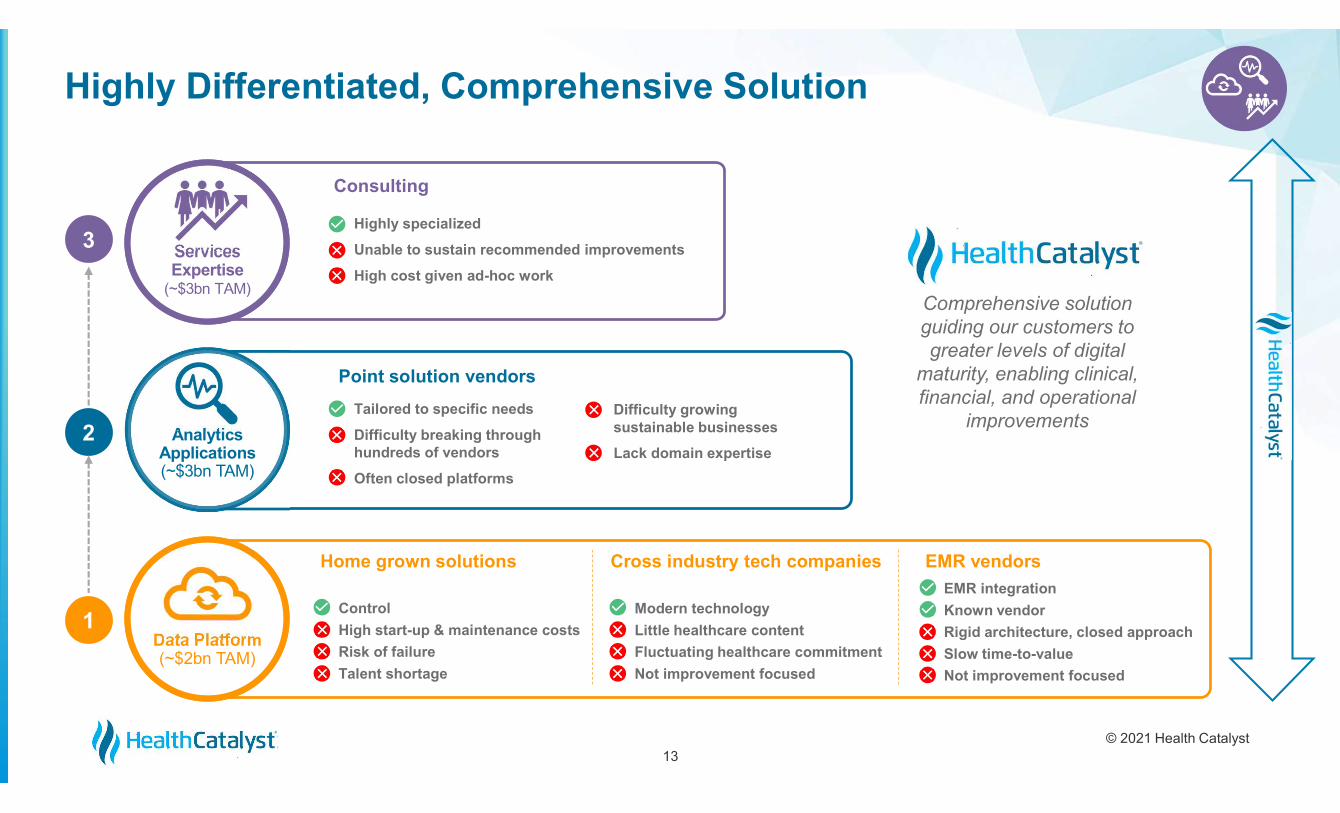
Highly Differentiated, Comprehensive Solution
Comprehensive solution guiding our customers to greater levels of digital
maturity, enabling clinical, financial, and operational
improvementsTailored to specific needs
Difficulty breaking through hundreds of vendors
Often closed platforms
2
Point solution vendors
Difficulty growing sustainable businesses
Lack domain expertiseAnalytics
Applications(~$3bn TAM)
3
Consulting
Highly specialized
Unable to sustain recommended improvements
High cost given ad-hoc work
Services Expertise
(~$3bn TAM)
1
Home grown solutions
Control
High start-up & maintenance costs
Risk of failure
Talent shortage
Cross industry tech companies EMR vendors
Modern technology
Little healthcare content
Fluctuating healthcare commitment
Not improvement focused
EMR integration
Known vendor
Rigid architecture, closed approach
Slow time-to-value
Not improvement focused
Data Platform(~$2bn TAM)
© 2021 Health CatalystProprietary and Confidential
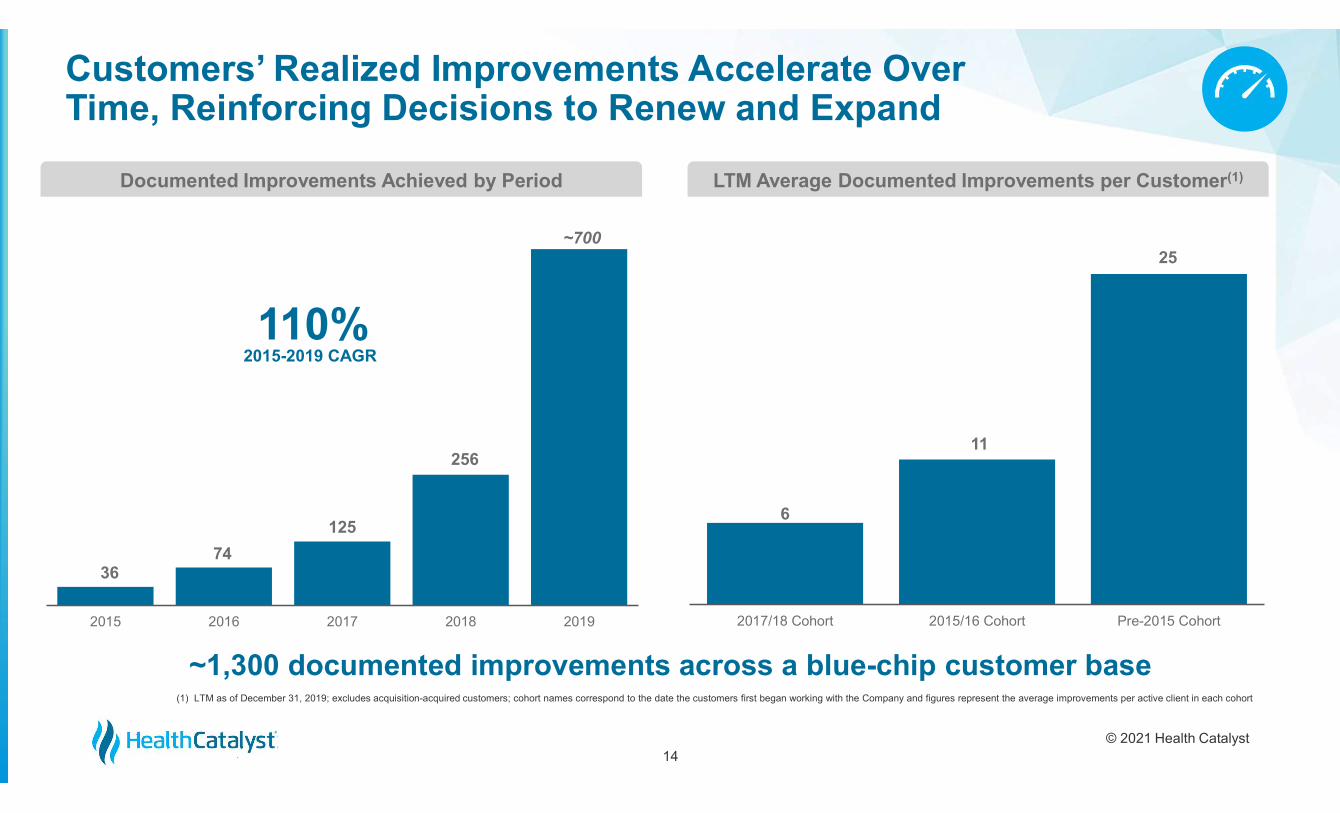
Customers’ Realized Improvements Accelerate Over Time, Reinforcing Decisions to Renew and Expand
14
(1) LTM as of December 31, 2019; excludes acquisition-acquired customers; cohort names correspond to the date the customers first began working with the Company and figures represent the average improvements per active client in each cohort
6
11
25
2017/18 Cohort 2015/16 Cohort Pre-2015 Cohort
~1,300 documented improvements across a blue-chip customer base
Documented Improvements Achieved by Period LTM Average Documented Improvements per Customer(1)
2015-2019 CAGR110%
3674
125
256
~700
2015 2016 2017 2018 2019
© 2021 Health CatalystProprietary and Confidential
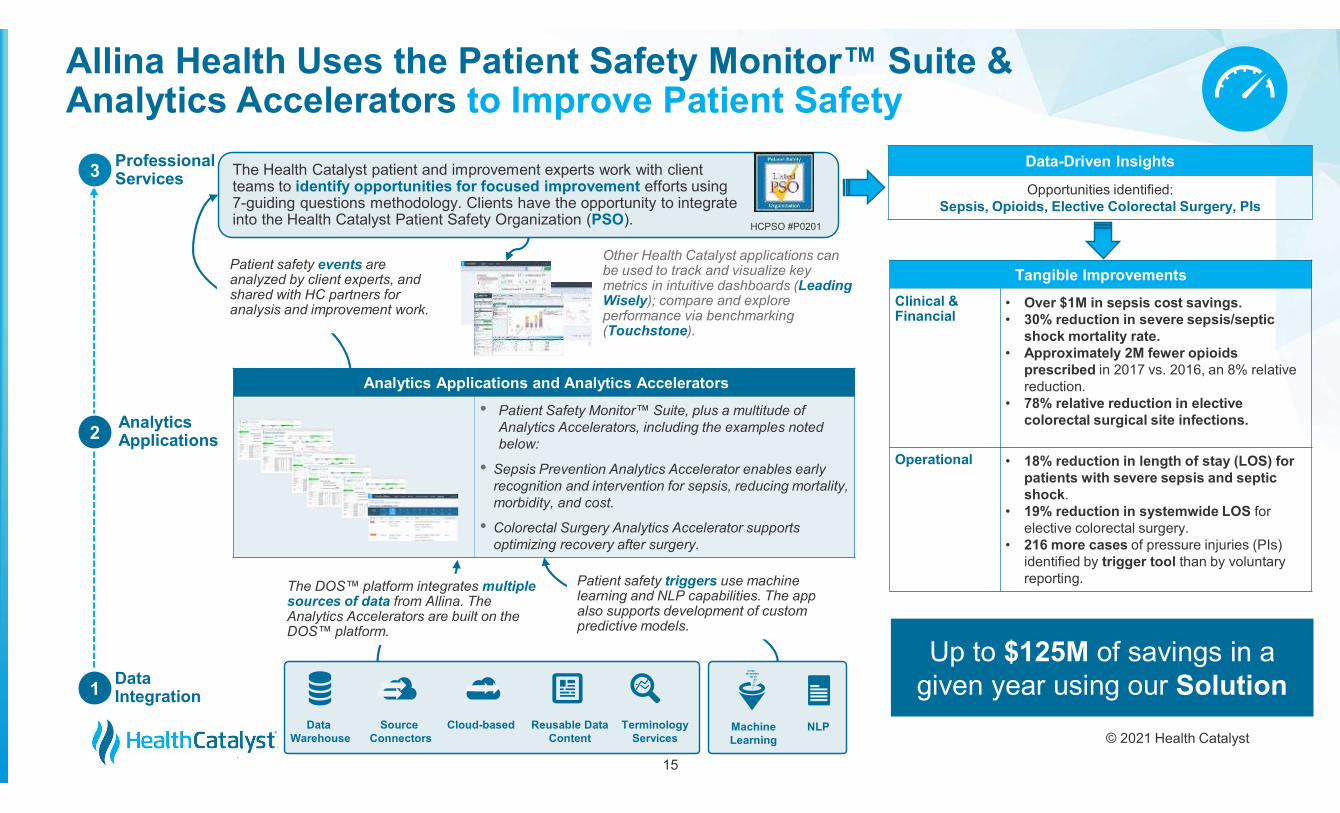
Professional Services
Analytics Applications2
Patient safety events are analyzed by client experts, andshared with HC partners for analysis and improvement work.
Data Integration
DataWarehouse
Cloud-basedSource Connectors
Reusable Data Content
Terminology Services
1
The Health Catalyst patient and improvement experts work with client teams to identify opportunities for focused improvement efforts using 7-guiding questions methodology. Clients have the opportunity to integrate into the Health Catalyst Patient Safety Organization (PSO).
3
Other Health Catalyst applications can be used to track and visualize key metrics in intuitive dashboards (Leading Wisely); compare and explore performance via benchmarking (Touchstone).
Data-Driven Insights
Opportunities identified: Sepsis, Opioids, Elective Colorectal Surgery, PIs
NLPMachine Learning
The DOS™ platform integrates multiple sources of data from Allina. The Analytics Accelerators are built on the DOS™ platform.
Patient safety triggers use machine learning and NLP capabilities. The app also supports development of custom predictive models.
HCPSO #P0201
Analytics Applications and Analytics Accelerators
• Patient Safety Monitor™ Suite, plus a multitude of Analytics Accelerators, including the examples noted below:
• Sepsis Prevention Analytics Accelerator enables early recognition and intervention for sepsis, reducing mortality, morbidity, and cost.
• Colorectal Surgery Analytics Accelerator supports optimizing recovery after surgery.
Tangible Improvements
Clinical & Financial
• Over $1M in sepsis cost savings.• 30% reduction in severe sepsis/septic
shock mortality rate.• Approximately 2M fewer opioids
prescribed in 2017 vs. 2016, an 8% relative reduction.
• 78% relative reduction in elective colorectal surgical site infections.
Operational • 18% reduction in length of stay (LOS) for patients with severe sepsis and septic shock.
• 19% reduction in systemwide LOS for elective colorectal surgery.
• 216 more cases of pressure injuries (PIs) identified by trigger tool than by voluntary reporting.
15
Allina Health Uses the Patient Safety Monitor™ Suite & Analytics Accelerators to Improve Patient Safety
Up to $125M of savings in a given year using our Solution
© 2021 Health CatalystProprietary and Confidential
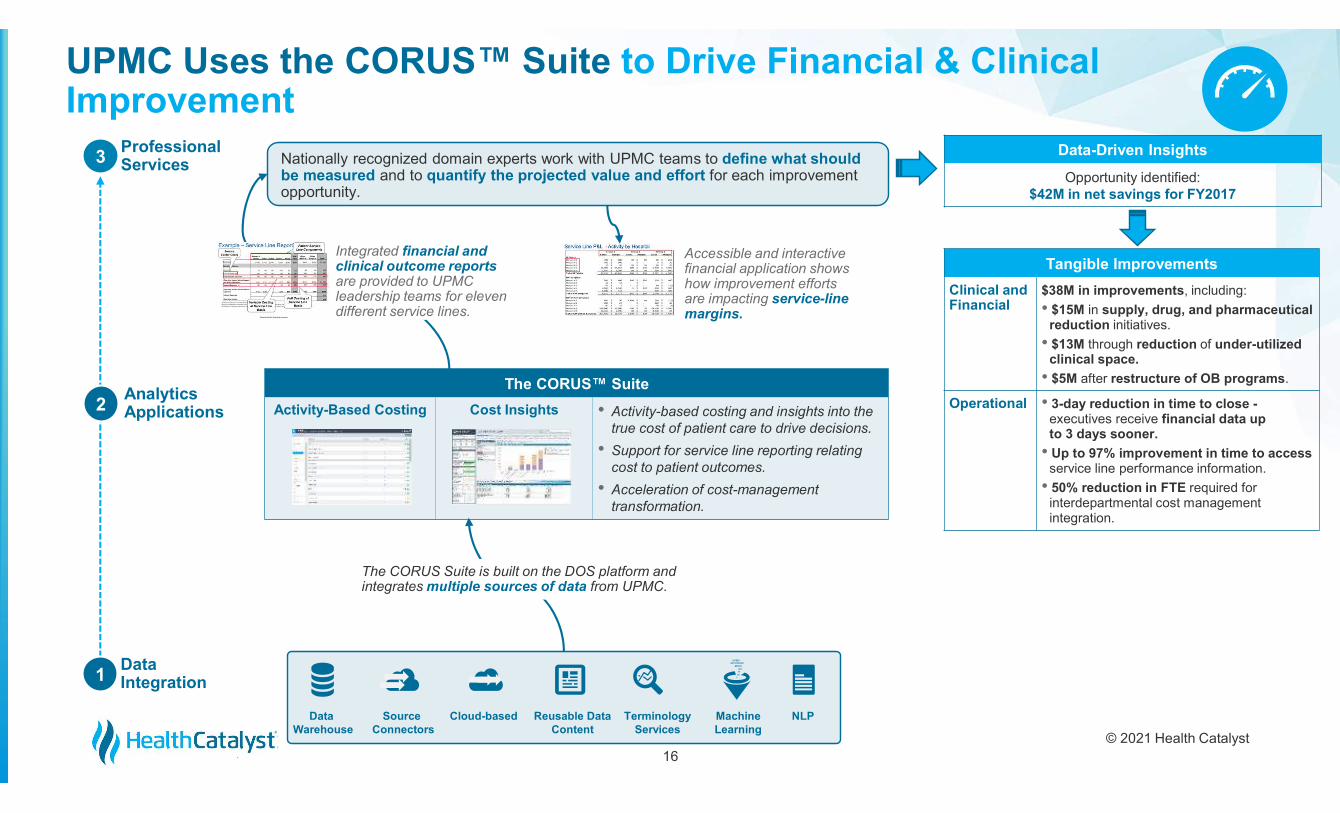
Analytics Applications2
Integrated financial and clinical outcome reports are provided to UPMC leadership teams for eleven different service lines.
Data Integration
DataWarehouse
Cloud-basedSource Connectors
Reusable Data Content
Terminology Services
1
Nationally recognized domain experts work with UPMC teams to define what should be measured and to quantify the projected value and effort for each improvement opportunity.
Professional Services3
The CORUS Suite is built on the DOS platform and integrates multiple sources of data from UPMC.
NLPMachine Learning
Accessible and interactive financial application shows how improvement efforts are impacting service-line margins.
Data-Driven Insights
Opportunity identified: $42M in net savings for FY2017
The CORUS™ Suite
Activity-Based Costing Cost Insights • Activity-based costing and insights into the true cost of patient care to drive decisions.
• Support for service line reporting relating cost to patient outcomes.
• Acceleration of cost-management transformation.
Tangible Improvements
Clinical and Financial
$38M in improvements, including:
• $15M in supply, drug, and pharmaceutical reduction initiatives.
• $13M through reduction of under-utilized clinical space.
• $5M after restructure of OB programs.
Operational • 3-day reduction in time to close -executives receive financial data up to 3 days sooner.
• Up to 97% improvement in time to access service line performance information.
• 50% reduction in FTE required for interdepartmental cost management integration.
16
UPMC Uses the CORUS™ Suite to Drive Financial & Clinical Improvement
© 2021 Health CatalystProprietary and Confidential
Data Integration
Analytics Applications
Professional Services
DataWarehouse
Cloud-basedSource Connectors
Reusable Data Content
Terminology Services
NLPMachine Learning
DOS and Analytics Accelerators
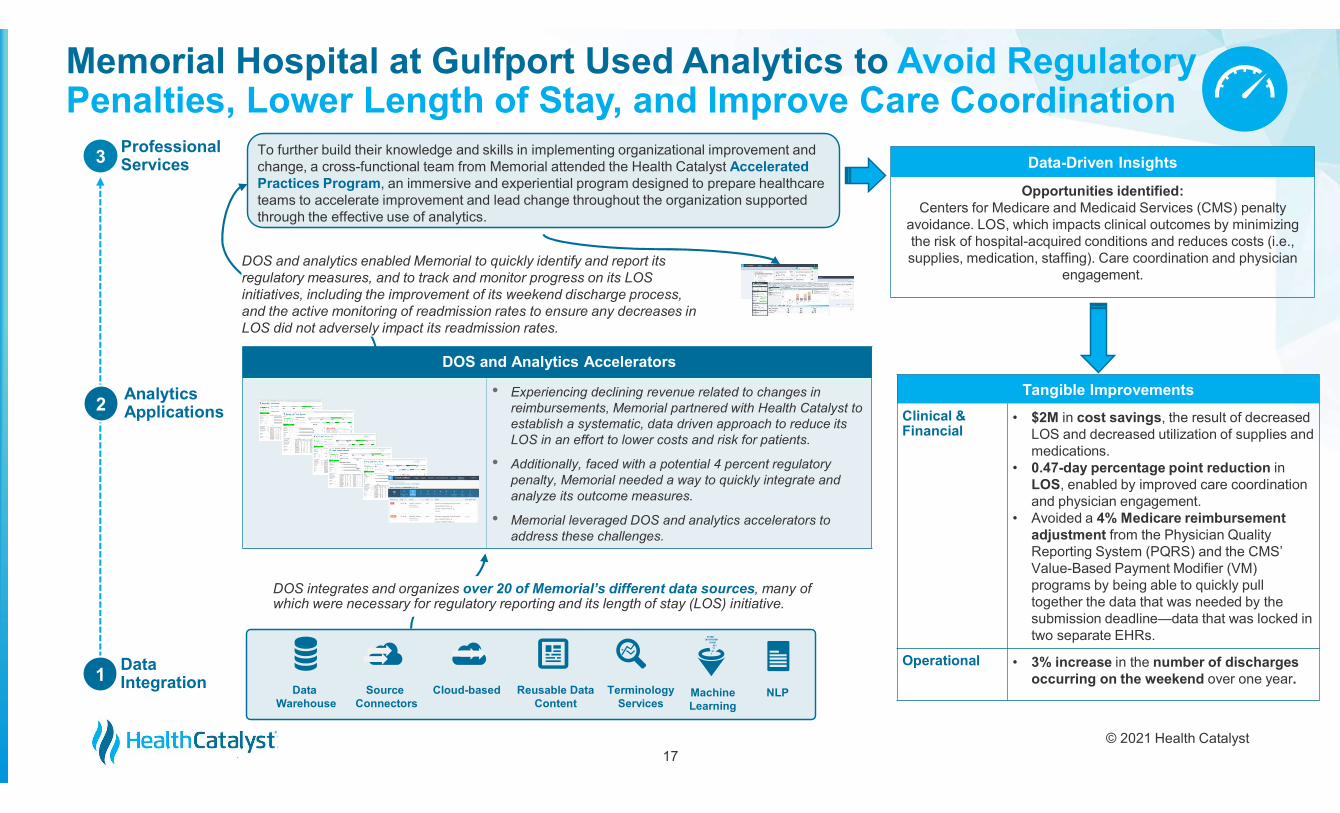
• Experiencing declining revenue related to changes in reimbursements, Memorial partnered with Health Catalyst to establish a systematic, data driven approach to reduce its LOS in an effort to lower costs and risk for patients.
• Additionally, faced with a potential 4 percent regulatory penalty, Memorial needed a way to quickly integrate and analyze its outcome measures.
• Memorial leveraged DOS and analytics accelerators to address these challenges.
To further build their knowledge and skills in implementing organizational improvement and change, a cross-functional team from Memorial attended the Health Catalyst Accelerated Practices Program, an immersive and experiential program designed to prepare healthcare teams to accelerate improvement and lead change throughout the organization supported through the effective use of analytics.
Memorial Hospital at Gulfport Used Analytics to Avoid RegulatoryPenalties, Lower Length of Stay, and Improve Care Coordination
2
1
3
17
DOS and analytics enabled Memorial to quickly identify and report its regulatory measures, and to track and monitor progress on its LOS initiatives, including the improvement of its weekend discharge process, and the active monitoring of readmission rates to ensure any decreases in LOS did not adversely impact its readmission rates.
Data-Driven Insights
Opportunities identified: Centers for Medicare and Medicaid Services (CMS) penalty
avoidance. LOS, which impacts clinical outcomes by minimizing the risk of hospital-acquired conditions and reduces costs (i.e., supplies, medication, staffing). Care coordination and physician
engagement.
Tangible Improvements
Clinical & Financial
• $2M in cost savings, the result of decreased LOS and decreased utilization of supplies and medications.
• 0.47-day percentage point reduction in LOS, enabled by improved care coordination and physician engagement.
• Avoided a 4% Medicare reimbursement adjustment from the Physician Quality Reporting System (PQRS) and the CMS’ Value-Based Payment Modifier (VM) programs by being able to quickly pull together the data that was needed by the submission deadline—data that was locked in two separate EHRs.
Operational • 3% increase in the number of discharges occurring on the weekend over one year.
DOS integrates and organizes over 20 of Memorial’s different data sources, many of which were necessary for regulatory reporting and its length of stay (LOS) initiative.
© 2021 Health CatalystProprietary and Confidential18
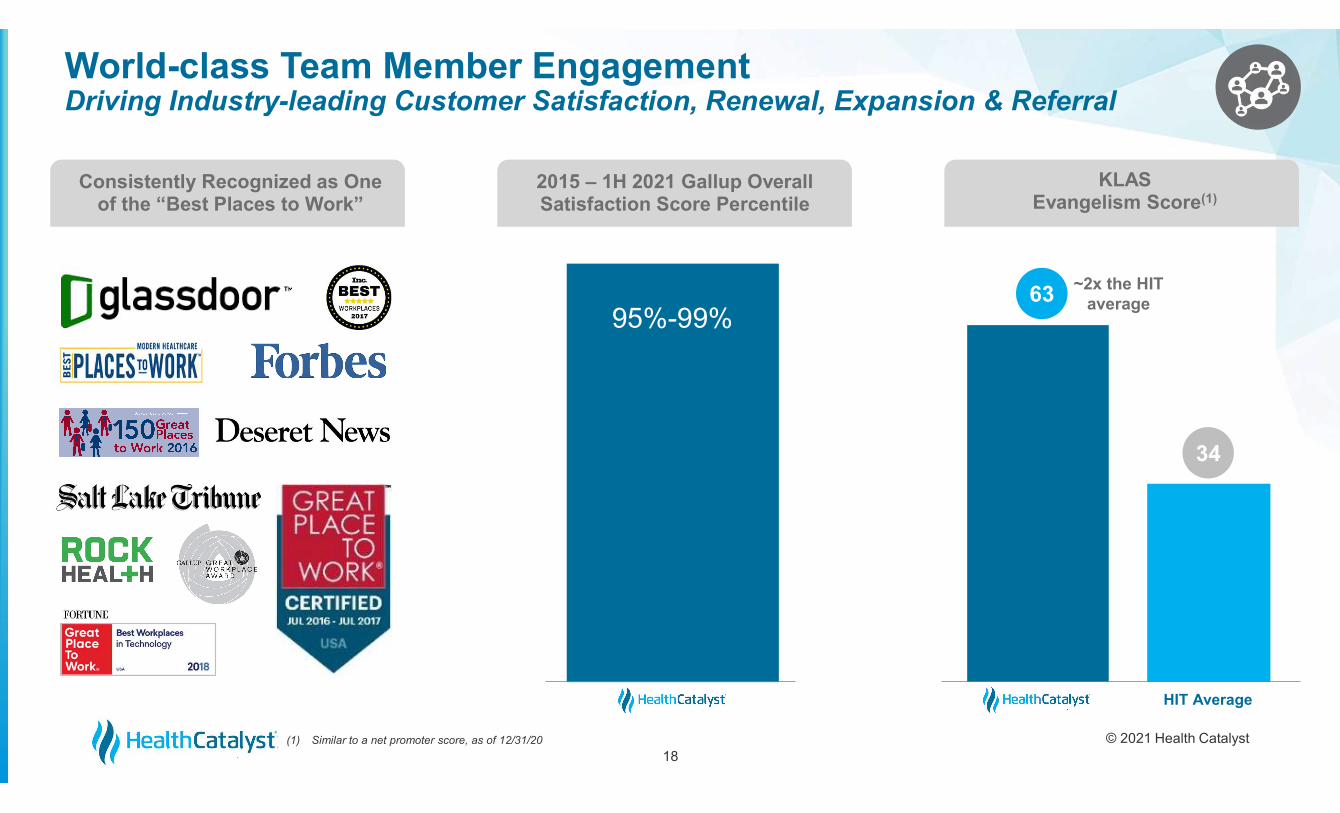
World-class Team Member Engagement Driving Industry-leading Customer Satisfaction, Renewal, Expansion & Referral
Consistently Recognized as One of the “Best Places to Work”
2015 – 1H 2021 Gallup Overall Satisfaction Score Percentile
KLASEvangelism Score(1)
(1) Similar to a net promoter score, as of 12/31/20
HIT Average
95%-99%~2x the HIT
average63
34
© 2021 Health CatalystProprietary and Confidential
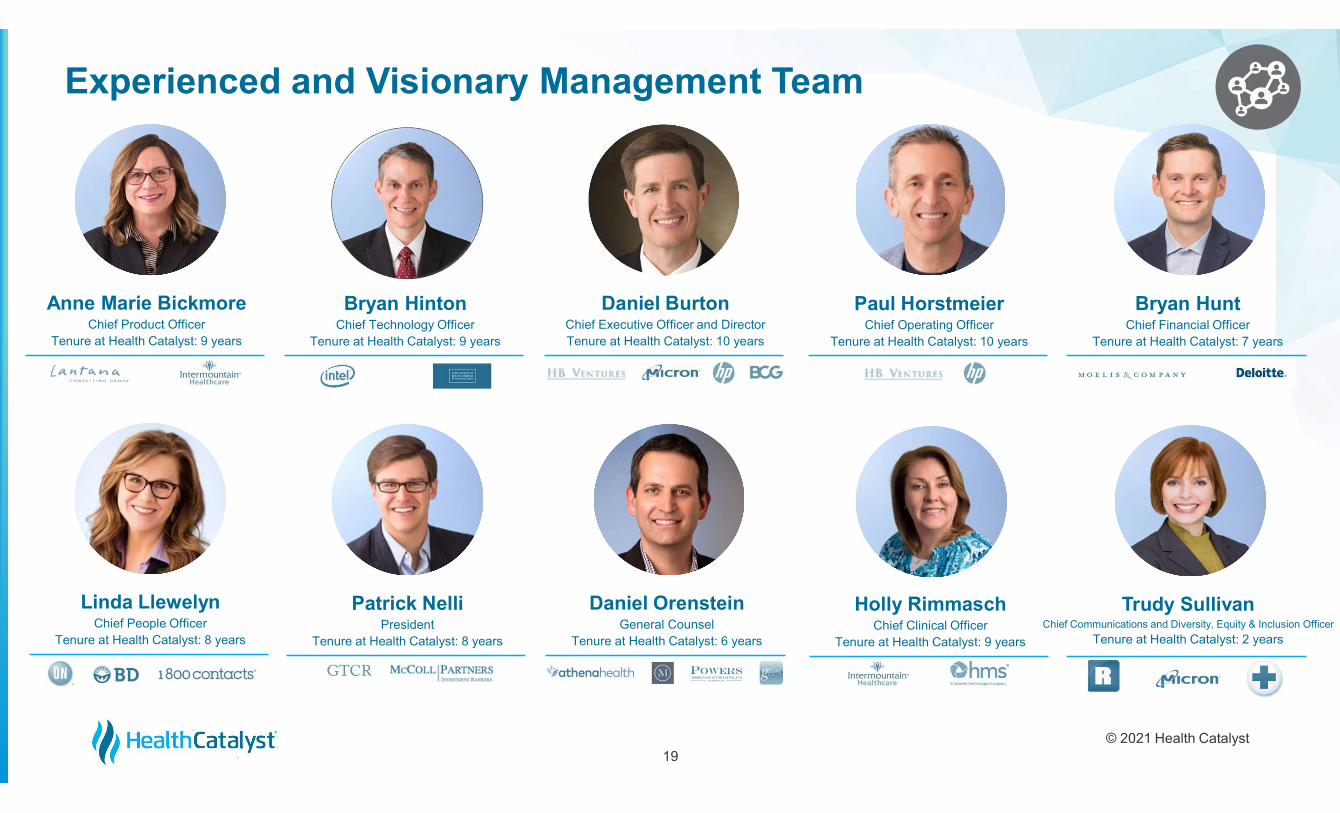
Experienced and Visionary Management Team
19
Daniel BurtonChief Executive Officer and DirectorTenure at Health Catalyst: 10 years
Anne Marie BickmoreChief Product Officer
Tenure at Health Catalyst: 9 years
Bryan HintonChief Technology Officer
Tenure at Health Catalyst: 9 years
Paul HorstmeierChief Operating Officer
Tenure at Health Catalyst: 10 years
Bryan HuntChief Financial Officer
Tenure at Health Catalyst: 7 years
Linda LlewelynChief People Officer
Tenure at Health Catalyst: 8 years
Patrick NelliPresident
Tenure at Health Catalyst: 8 years
Daniel OrensteinGeneral Counsel
Tenure at Health Catalyst: 6 years
Holly RimmaschChief Clinical Officer
Tenure at Health Catalyst: 9 years
Trudy SullivanChief Communications and Diversity, Equity & Inclusion Officer
Tenure at Health Catalyst: 2 years
© 2021 Health CatalystProprietary and Confidential
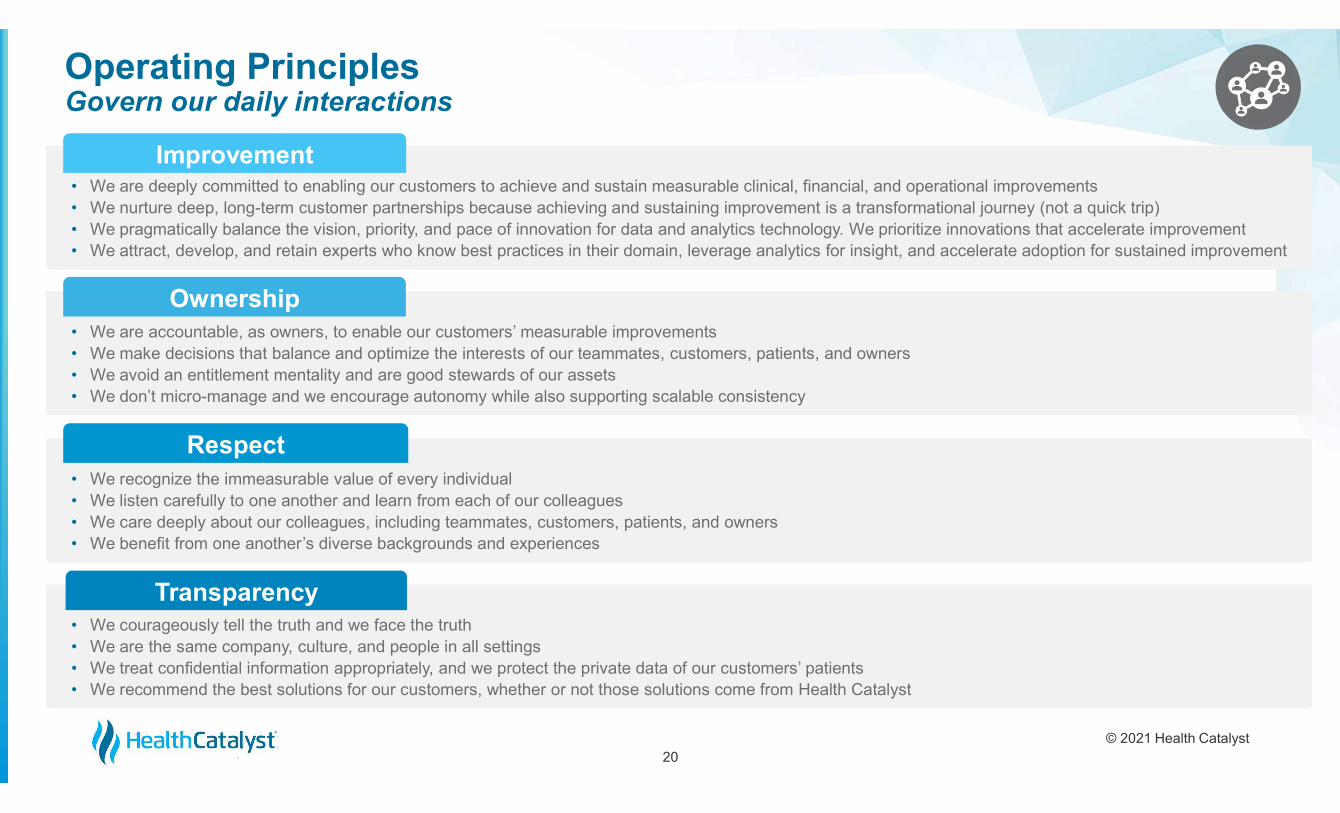
• We recognize the immeasurable value of every individual• We listen carefully to one another and learn from each of our colleagues• We care deeply about our colleagues, including teammates, customers, patients, and owners• We benefit from one another’s diverse backgrounds and experiences
Improvement• We are deeply committed to enabling our customers to achieve and sustain measurable clinical, financial, and operational improvements• We nurture deep, long-term customer partnerships because achieving and sustaining improvement is a transformational journey (not a quick trip)• We pragmatically balance the vision, priority, and pace of innovation for data and analytics technology. We prioritize innovations that accelerate improvement• We attract, develop, and retain experts who know best practices in their domain, leverage analytics for insight, and accelerate adoption for sustained improvement
• We are accountable, as owners, to enable our customers’ measurable improvements• We make decisions that balance and optimize the interests of our teammates, customers, patients, and owners• We avoid an entitlement mentality and are good stewards of our assets• We don’t micro-manage and we encourage autonomy while also supporting scalable consistency
Ownership
Respect
• We courageously tell the truth and we face the truth• We are the same company, culture, and people in all settings• We treat confidential information appropriately, and we protect the private data of our customers’ patients• We recommend the best solutions for our customers, whether or not those solutions come from Health Catalyst
Transparency
Operating PrinciplesGovern our daily interactions
20
© 2021 Health CatalystProprietary and Confidential
World-ClassHard Working
HumbleContinuous Learner
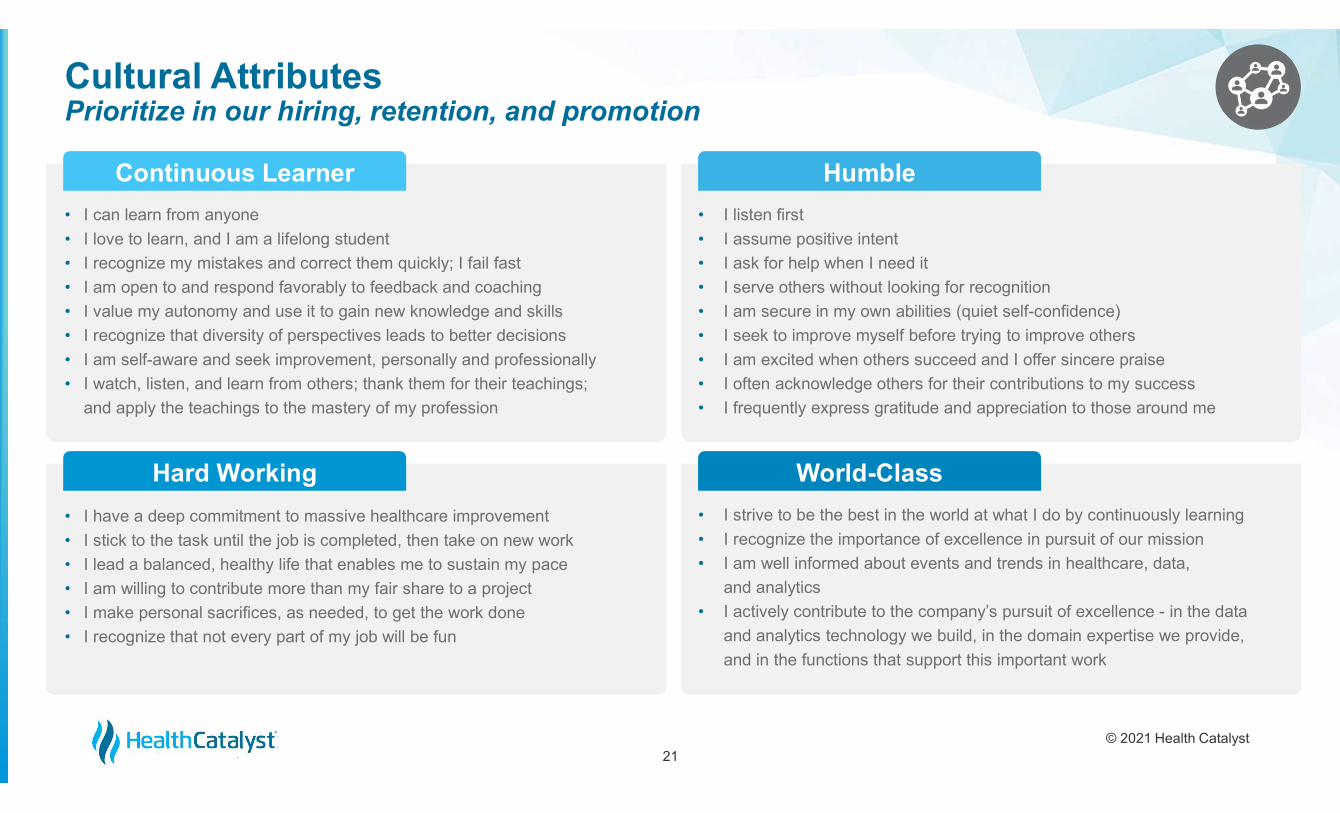
Cultural AttributesPrioritize in our hiring, retention, and promotion
• I can learn from anyone
• I love to learn, and I am a lifelong student
• I recognize my mistakes and correct them quickly; I fail fast
• I am open to and respond favorably to feedback and coaching
• I value my autonomy and use it to gain new knowledge and skills
• I recognize that diversity of perspectives leads to better decisions
• I am self-aware and seek improvement, personally and professionally
• I watch, listen, and learn from others; thank them for their teachings;
and apply the teachings to the mastery of my profession
• I listen first
• I assume positive intent
• I ask for help when I need it
• I serve others without looking for recognition
• I am secure in my own abilities (quiet self-confidence)
• I seek to improve myself before trying to improve others
• I am excited when others succeed and I offer sincere praise
• I often acknowledge others for their contributions to my success
• I frequently express gratitude and appreciation to those around me
21
• I strive to be the best in the world at what I do by continuously learning
• I recognize the importance of excellence in pursuit of our mission
• I am well informed about events and trends in healthcare, data,
and analytics
• I actively contribute to the company’s pursuit of excellence - in the data
and analytics technology we build, in the domain expertise we provide,
and in the functions that support this important work
• I have a deep commitment to massive healthcare improvement
• I stick to the task until the job is completed, then take on new work
• I lead a balanced, healthy life that enables me to sustain my pace
• I am willing to contribute more than my fair share to a project
• I make personal sacrifices, as needed, to get the work done
• I recognize that not every part of my job will be fun
© 2021 Health CatalystProprietary and Confidential22
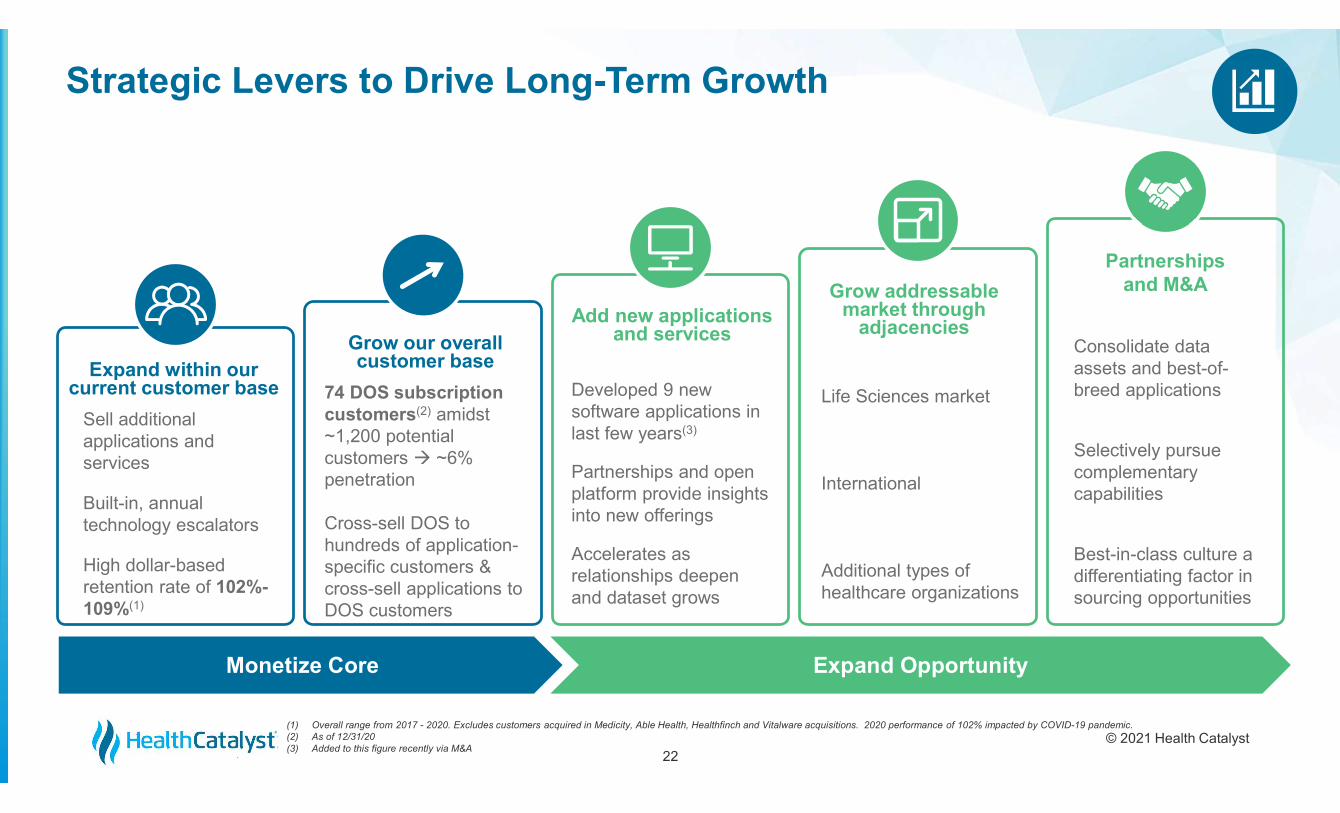
Strategic Levers to Drive Long-Term Growth
Grow our overallcustomer base
74 DOS subscription customers(2) amidst ~1,200 potential customers ~6% penetration
Cross-sell DOS to hundreds of application-specific customers & cross-sell applications to DOS customers
Add new applicationsand services
Developed 9 new software applications in last few years(3)
Partnerships and open platform provide insights into new offerings
Accelerates as relationships deepen and dataset grows
Grow addressable market through
adjacencies
Life Sciences market
International
Additional types of healthcare organizations
Partnershipsand M&A
Consolidate data assets and best-of-breed applications
Selectively pursue complementary capabilities
Best-in-class culture a differentiating factor in sourcing opportunities
Sell additional applications and services
Built-in, annual technology escalators
High dollar-based retention rate of 102%-109%(1)
Expand within ourcurrent customer base
Monetize Core Expand Opportunity
(1) Overall range from 2017 - 2020. Excludes customers acquired in Medicity, Able Health, Healthfinch and Vitalware acquisitions. 2020 performance of 102% impacted by COVID-19 pandemic.(2) As of 12/31/20(3) Added to this figure recently via M&A
© 2021 Health CatalystProprietary and Confidential
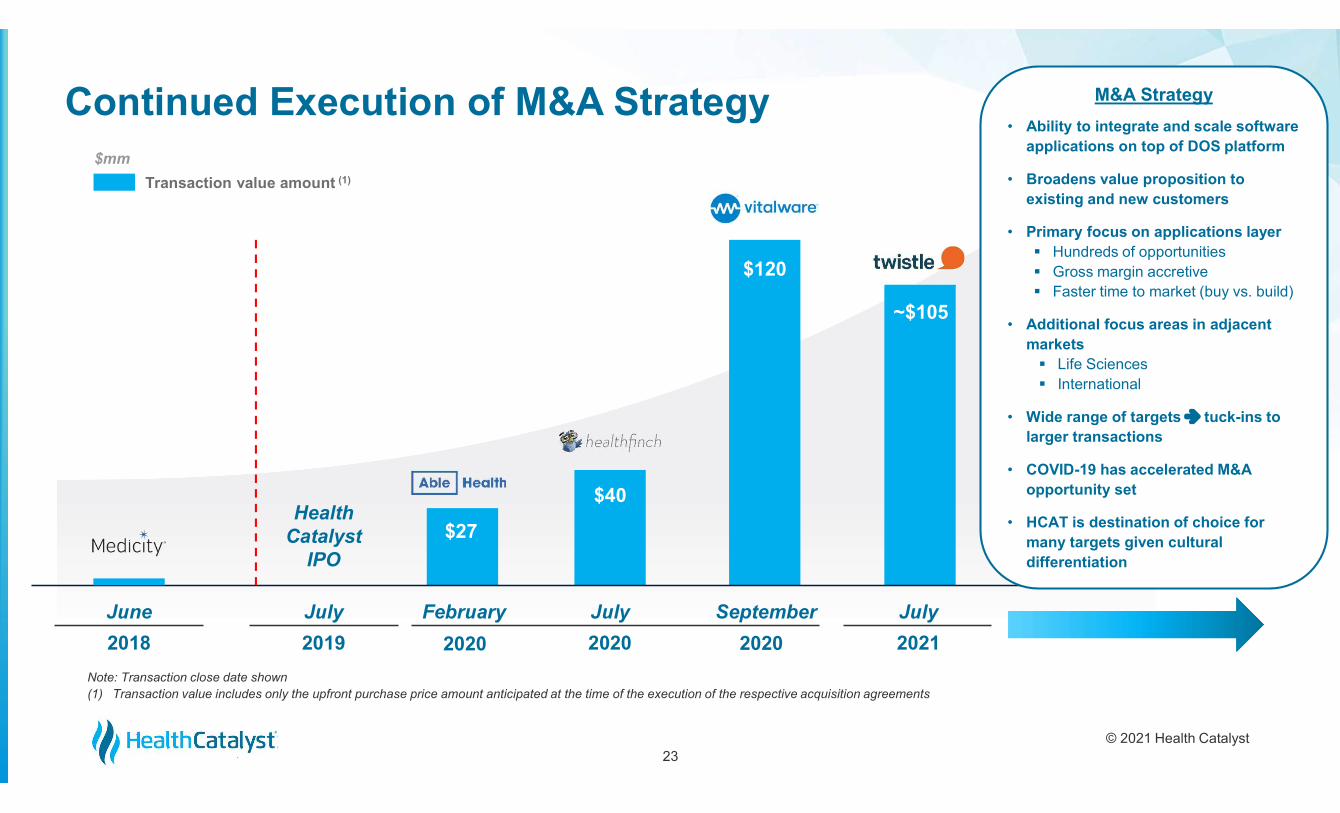
Continued Execution of M&A Strategy
23
Transaction value amount (1)
Note: Transaction close date shown(1) Transaction value includes only the upfront purchase price amount anticipated at the time of the execution of the respective acquisition agreements
$mm
2019 2020 20212018
Health Catalyst
IPO
$27
$40
$120
~$105
M&A Strategy
• Ability to integrate and scale software applications on top of DOS platform
• Broadens value proposition to existing and new customers
• Primary focus on applications layer Hundreds of opportunities Gross margin accretive Faster time to market (buy vs. build)
• Additional focus areas in adjacent markets Life Sciences International
• Wide range of targets tuck-ins to larger transactions
• COVID-19 has accelerated M&A opportunity set
• HCAT is destination of choice for many targets given cultural differentiation
July February July September JulyJune
20202020
© 2021 Health CatalystProprietary and Confidential24
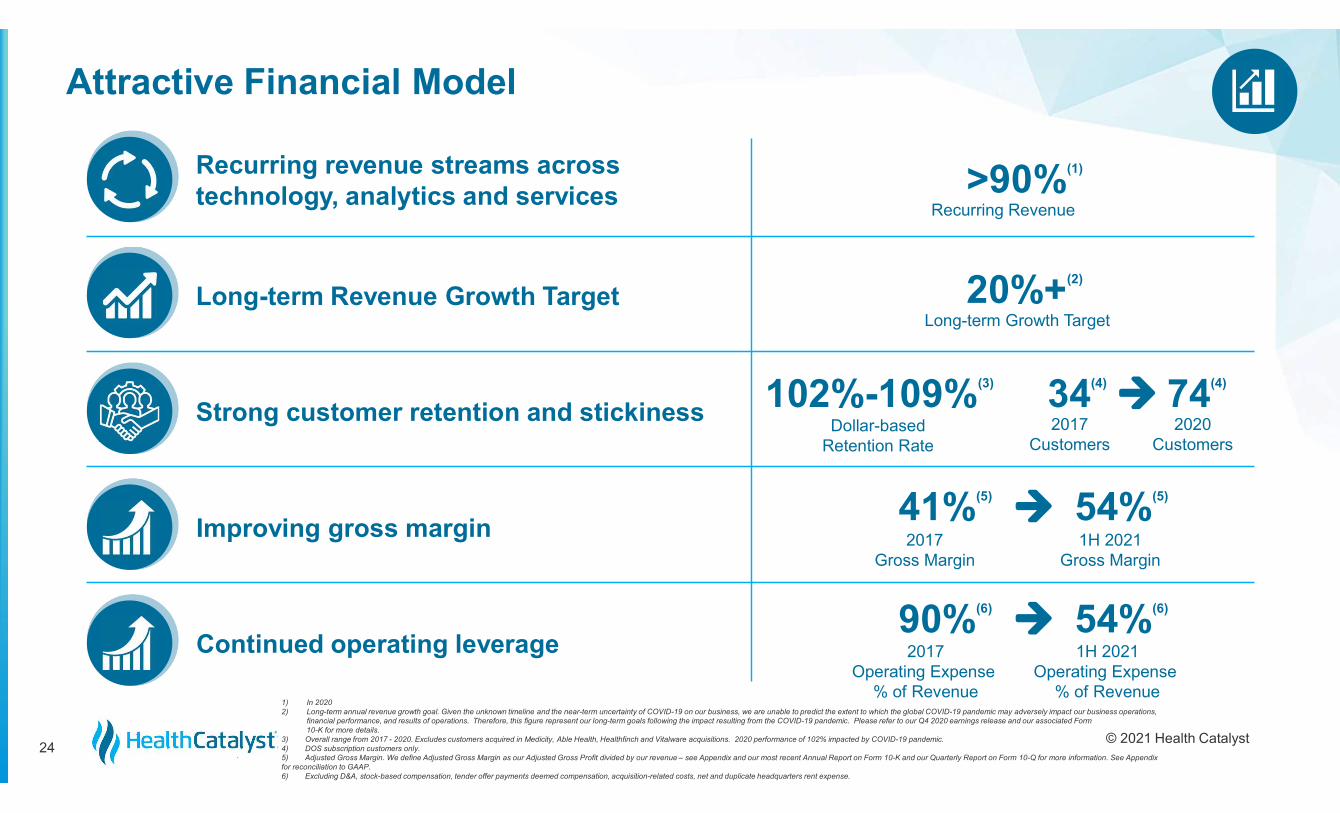
Attractive Financial Model
Long-term Revenue Growth Target
Improving gross margin
>90%(1)
Recurring Revenue
20%+(2)
Long-term Growth Target
102%-109%(3)
Dollar-basedRetention Rate
Strong customer retention and stickiness
Recurring revenue streams across technology, analytics and services
34(4) 74(4)
2017Customers
2020Customers
1) In 20202) Long-term annual revenue growth goal. Given the unknown timeline and the near-term uncertainty of COVID-19 on our business, we are unable to predict the extent to which the global COVID-19 pandemic may adversely impact our business operations,
financial performance, and results of operations. Therefore, this figure represent our long-term goals following the impact resulting from the COVID-19 pandemic. Please refer to our Q4 2020 earnings release and our associated Form 10-K for more details.
3) Overall range from 2017 - 2020. Excludes customers acquired in Medicity, Able Health, Healthfinch and Vitalware acquisitions. 2020 performance of 102% impacted by COVID-19 pandemic.4) DOS subscription customers only.5) Adjusted Gross Margin. We define Adjusted Gross Margin as our Adjusted Gross Profit divided by our revenue – see Appendix and our most recent Annual Report on Form 10-K and our Quarterly Report on Form 10-Q for more information. See Appendix for reconciliation to GAAP.6) Excluding D&A, stock-based compensation, tender offer payments deemed compensation, acquisition-related costs, net and duplicate headquarters rent expense.
41%(5) 54%(5)
2017Gross Margin
1H 2021Gross Margin
Continued operating leverage90%(6) 54%(6)
2017Operating Expense
% of Revenue
1H 2021Operating Expense
% of Revenue
© 2021 Health CatalystProprietary and Confidential
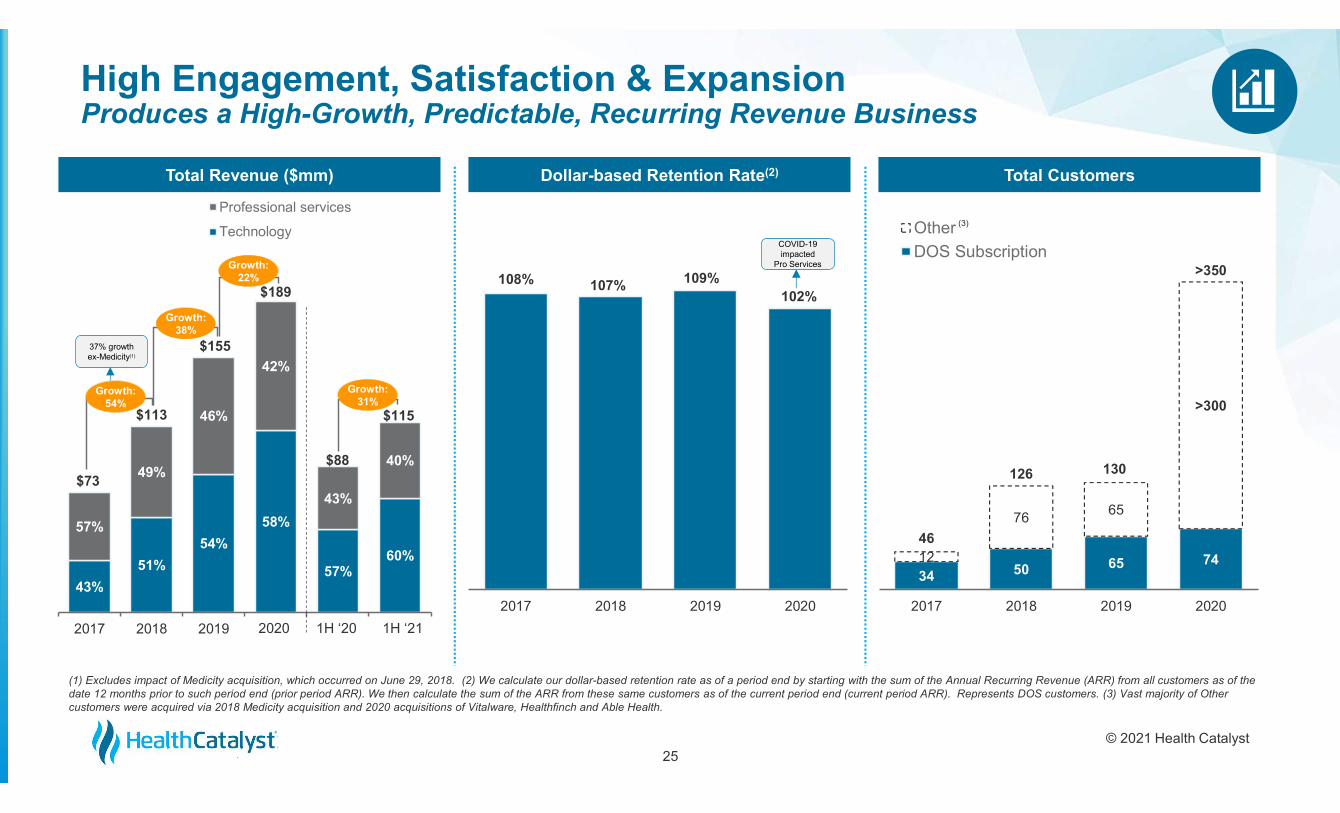
Total Revenue ($mm)
25
Dollar-based Retention Rate(2)
(1) Excludes impact of Medicity acquisition, which occurred on June 29, 2018. (2) We calculate our dollar-based retention rate as of a period end by starting with the sum of the Annual Recurring Revenue (ARR) from all customers as of the date 12 months prior to such period end (prior period ARR). We then calculate the sum of the ARR from these same customers as of the current period end (current period ARR). Represents DOS customers. (3) Vast majority of Other customers were acquired via 2018 Medicity acquisition and 2020 acquisitions of Vitalware, Healthfinch and Able Health.
High Engagement, Satisfaction & Expansion Produces a High-Growth, Predictable, Recurring Revenue Business
Total Customers
108% 107% 109%102%
2017 2018 2019 2020
$73
$113
$155
43%
51%
54%
58%
57%60%
57%
49%
46%
42%
43%
40%
2017 2018 2019
Professional services
Technology
Growth: 54%
46
126 130
>350
34 50 65 7412
76 65
>300
2017 2018 2019 2020
Other
DOS Subscription
Growth: 38%
Growth: 22%
(3)
37% growth ex-Medicity(1)
$189
2020
COVID-19 impacted
Pro Services
1H ‘20 1H ‘21
Growth: 31%
$88
$115
© 2021 Health CatalystProprietary and Confidential
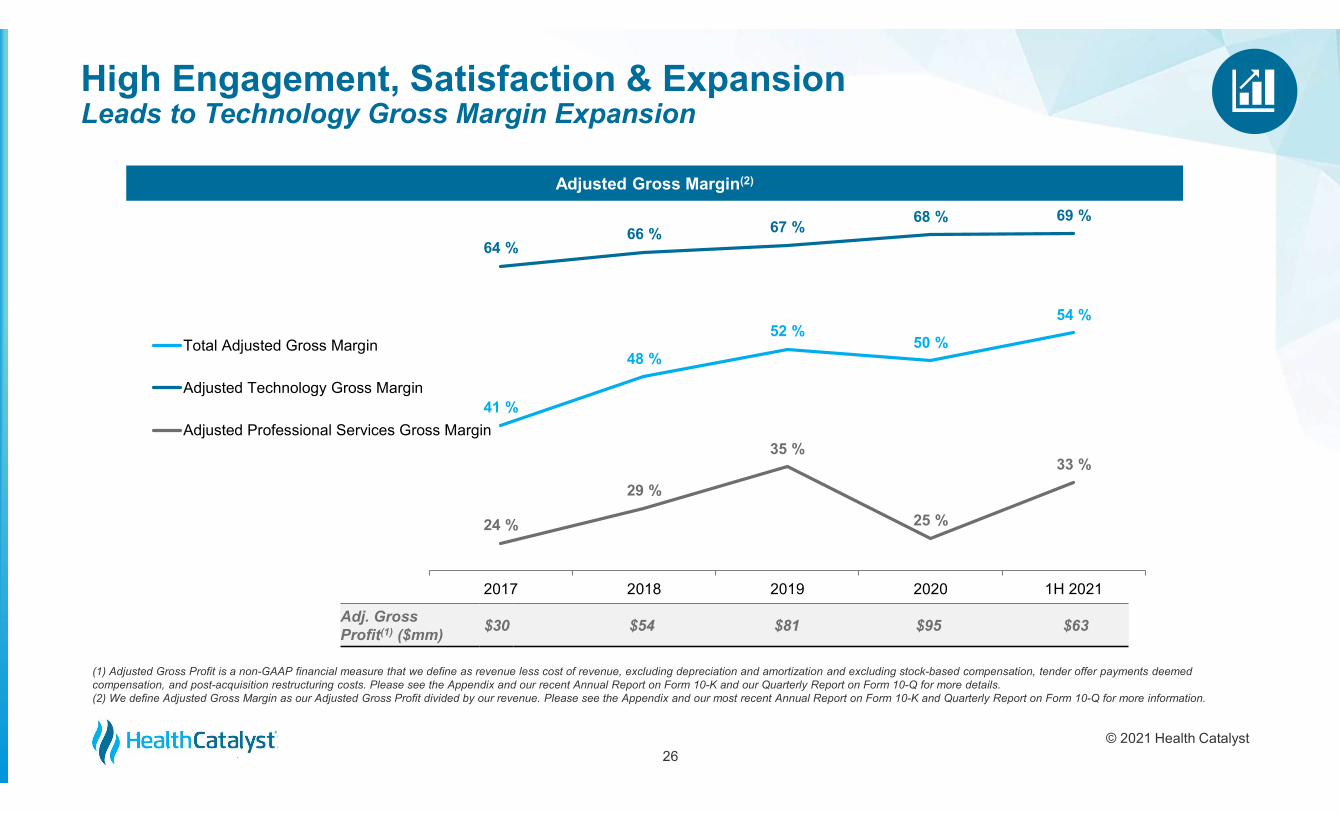
Adj. GrossProfit(1) ($mm)
$30 $54 $81 $95 $63
41 %
48 %
52 %50 %
54 %
64 %66 % 67 %
68 % 69 %
24 %
29 %
35 %
25 %
33 %
2017 2018 2019 2020 1H 2021
Total Adjusted Gross Margin
Adjusted Technology Gross Margin
Adjusted Professional Services Gross Margin
26
(1) Adjusted Gross Profit is a non-GAAP financial measure that we define as revenue less cost of revenue, excluding depreciation and amortization and excluding stock-based compensation, tender offer payments deemed compensation, and post-acquisition restructuring costs. Please see the Appendix and our recent Annual Report on Form 10-K and our Quarterly Report on Form 10-Q for more details. (2) We define Adjusted Gross Margin as our Adjusted Gross Profit divided by our revenue. Please see the Appendix and our most recent Annual Report on Form 10-K and Quarterly Report on Form 10-Q for more information.
High Engagement, Satisfaction & Expansion Leads to Technology Gross Margin Expansion
Adjusted Gross Margin(2)
© 2021 Health CatalystProprietary and Confidential
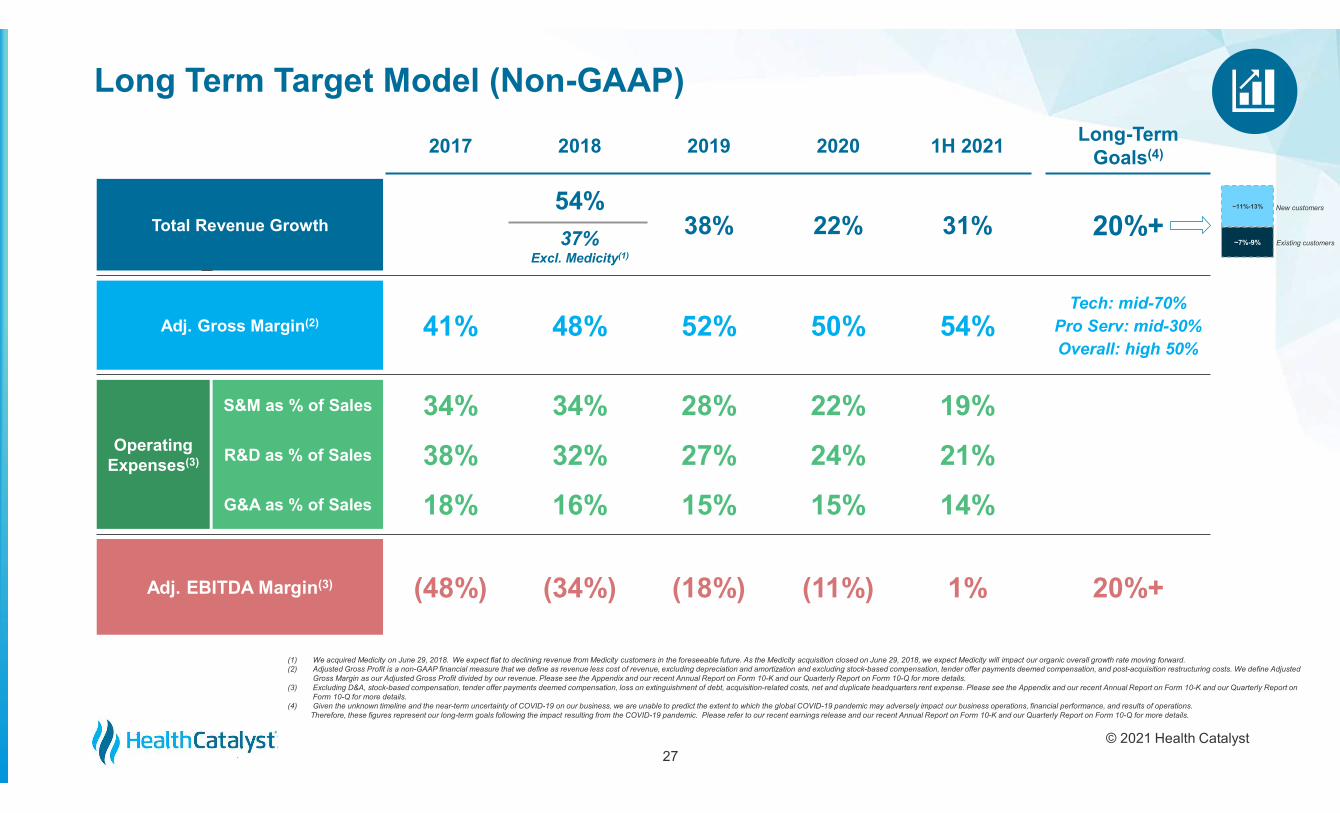
2017 2018 2019 2020 1H 2021Long-Term
Goals(4)
Total Revenue Growth54%
38% 22% 31% 20%+37%Excl. Medicity(1)
Adj. Gross Margin(2) 41% 48% 52% 50% 54%Tech: mid-70%
Pro Serv: mid-30%Overall: high 50%
OperatingExpenses(3)
S&M as % of Sales 34% 34% 28% 22% 19%
R&D as % of Sales 38% 32% 27% 24% 21%
G&A as % of Sales 18% 16% 15% 15% 14%
Adj. EBITDA Margin(3) (48%) (34%) (18%) (11%) 1% 20%+
27
Long Term Target Model (Non-GAAP)
(1) We acquired Medicity on June 29, 2018. We expect flat to declining revenue from Medicity customers in the foreseeable future. As the Medicity acquisition closed on June 29, 2018, we expect Medicity will impact our organic overall growth rate moving forward. (2) Adjusted Gross Profit is a non-GAAP financial measure that we define as revenue less cost of revenue, excluding depreciation and amortization and excluding stock-based compensation, tender offer payments deemed compensation, and post-acquisition restructuring costs. We define Adjusted
Gross Margin as our Adjusted Gross Profit divided by our revenue. Please see the Appendix and our recent Annual Report on Form 10-K and our Quarterly Report on Form 10-Q for more details. (3) Excluding D&A, stock-based compensation, tender offer payments deemed compensation, loss on extinguishment of debt, acquisition-related costs, net and duplicate headquarters rent expense. Please see the Appendix and our recent Annual Report on Form 10-K and our Quarterly Report on
Form 10-Q for more details. (4) Given the unknown timeline and the near-term uncertainty of COVID-19 on our business, we are unable to predict the extent to which the global COVID-19 pandemic may adversely impact our business operations, financial performance, and results of operations.
Therefore, these figures represent our long-term goals following the impact resulting from the COVID-19 pandemic. Please refer to our recent earnings release and our recent Annual Report on Form 10-K and our Quarterly Report on Form 10-Q for more details.
~7%-9%
~11%-13%
Existing customers
New customers

© 2021 Health CatalystProprietary and Confidential
Appendix
© 2021 Health CatalystProprietary and Confidential
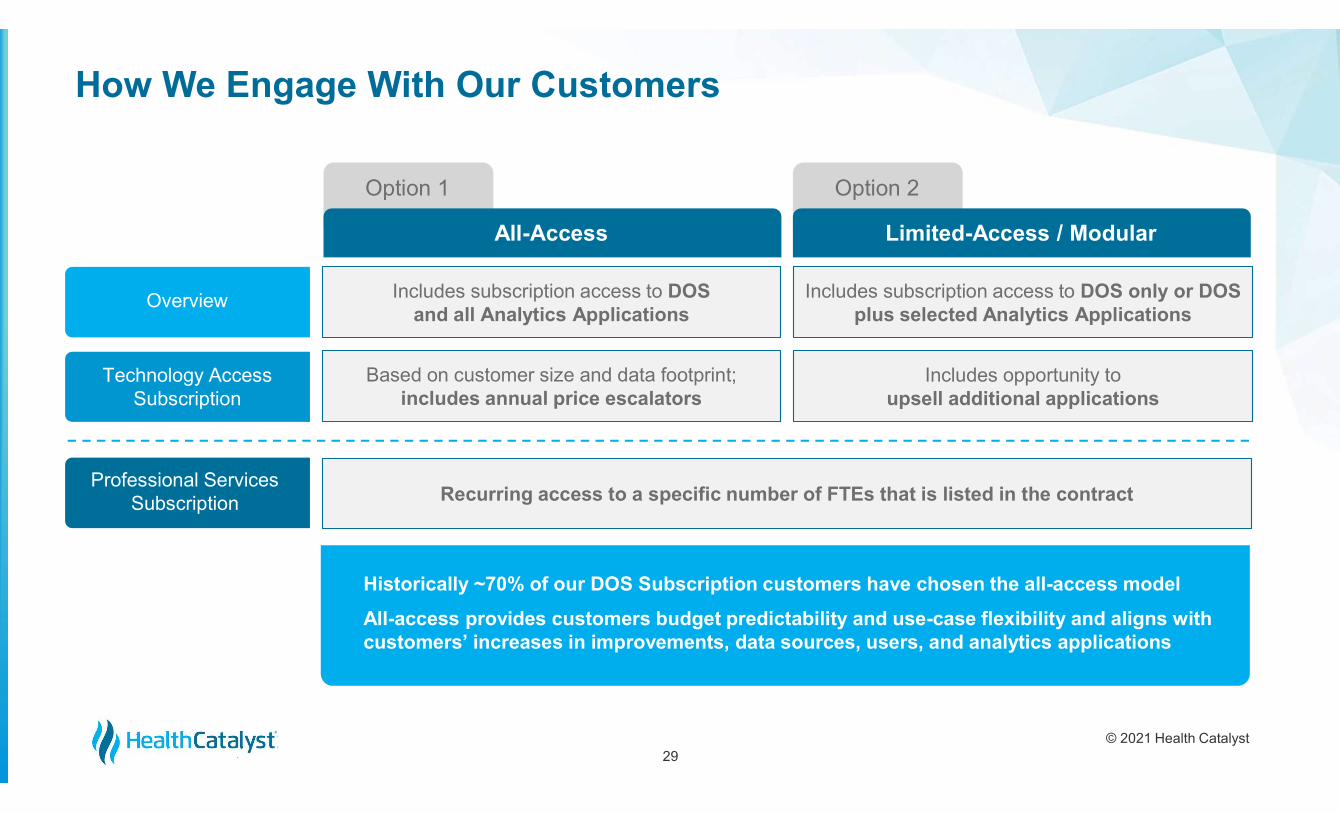
How We Engage With Our Customers
29
All-Access
Option 1
Includes subscription access to DOS and all Analytics Applications
Based on customer size and data footprint; includes annual price escalators
Includes opportunity to upsell additional applications
Includes subscription access to DOS only or DOS plus selected Analytics Applications
Recurring access to a specific number of FTEs that is listed in the contract
Overview
Technology Access Subscription
Professional ServicesSubscription
Limited-Access / Modular
Option 2
Historically ~70% of our DOS Subscription customers have chosen the all-access model
All-access provides customers budget predictability and use-case flexibility and aligns with customers’ increases in improvements, data sources, users, and analytics applications
© 2021 Health CatalystProprietary and Confidential
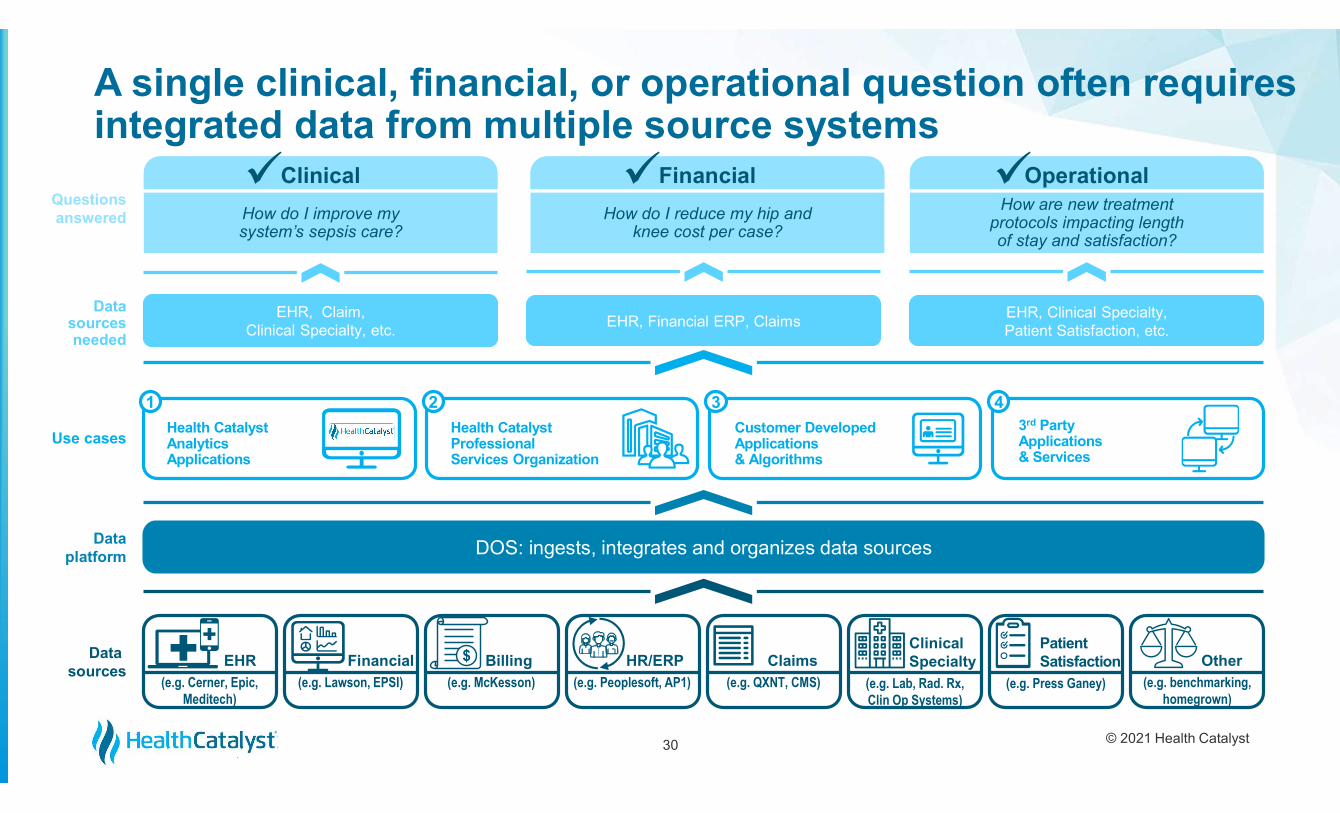
A single clinical, financial, or operational question often requires integrated data from multiple source systems
30
DOS: ingests, integrates and organizes data sourcesData platform
Data platform
Data sources
Data sources
Use casesUse cases
FinancialFinancial OperationalOperational
How do I reduce my hip andknee cost per case?
How are new treatment protocols impacting length of stay and satisfaction?
ClinicalClinical
How do I improve mysystem’s sepsis care?
Questions answered
Questions answered
Data sources needed
Data sources needed
EHR, Claim, Clinical Specialty, etc.
EHR, Financial ERP, ClaimsEHR, Clinical Specialty, Patient Satisfaction, etc.
EHR(e.g. Cerner, Epic,
Meditech)
Financial(e.g. Lawson, EPSI)
Billing(e.g. McKesson)
HR/ERP(e.g. Peoplesoft, AP1)
Claims(e.g. QXNT, CMS)
Clinical Specialty
(e.g. Lab, Rad. Rx, Clin Op Systems)
Patient Satisfaction
(e.g. Press Ganey)
Other(e.g. benchmarking,
homegrown)
$
Health Catalyst AnalyticsApplications
Health Catalyst ProfessionalServices Organization
Customer DevelopedApplications & Algorithms
3rd Party Applications & Services
1 3 42
© 2021 Health CatalystProprietary and Confidential
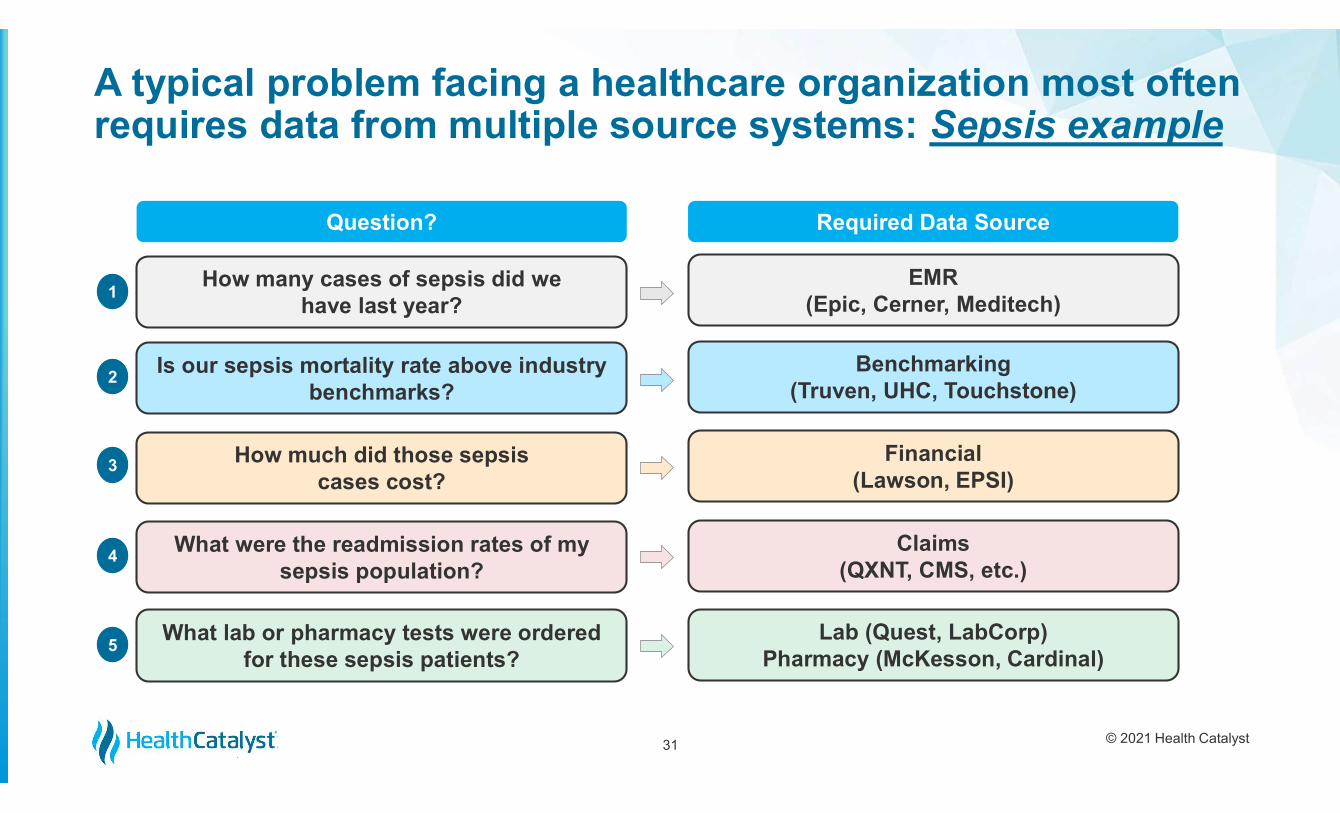
A typical problem facing a healthcare organization most often requires data from multiple source systems: Sepsis example
31
Question?
EMR (Epic, Cerner, Meditech)
How many cases of sepsis did we have last year?
Benchmarking (Truven, UHC, Touchstone)
Is our sepsis mortality rate above industry benchmarks?
Financial (Lawson, EPSI)
How much did those sepsis cases cost?
What were the readmission rates of my sepsis population?
Claims (QXNT, CMS, etc.)
What lab or pharmacy tests were ordered for these sepsis patients?
Lab (Quest, LabCorp)Pharmacy (McKesson, Cardinal)
1
2
3
4
5
Required Data Source
© 2021 Health CatalystProprietary and Confidential
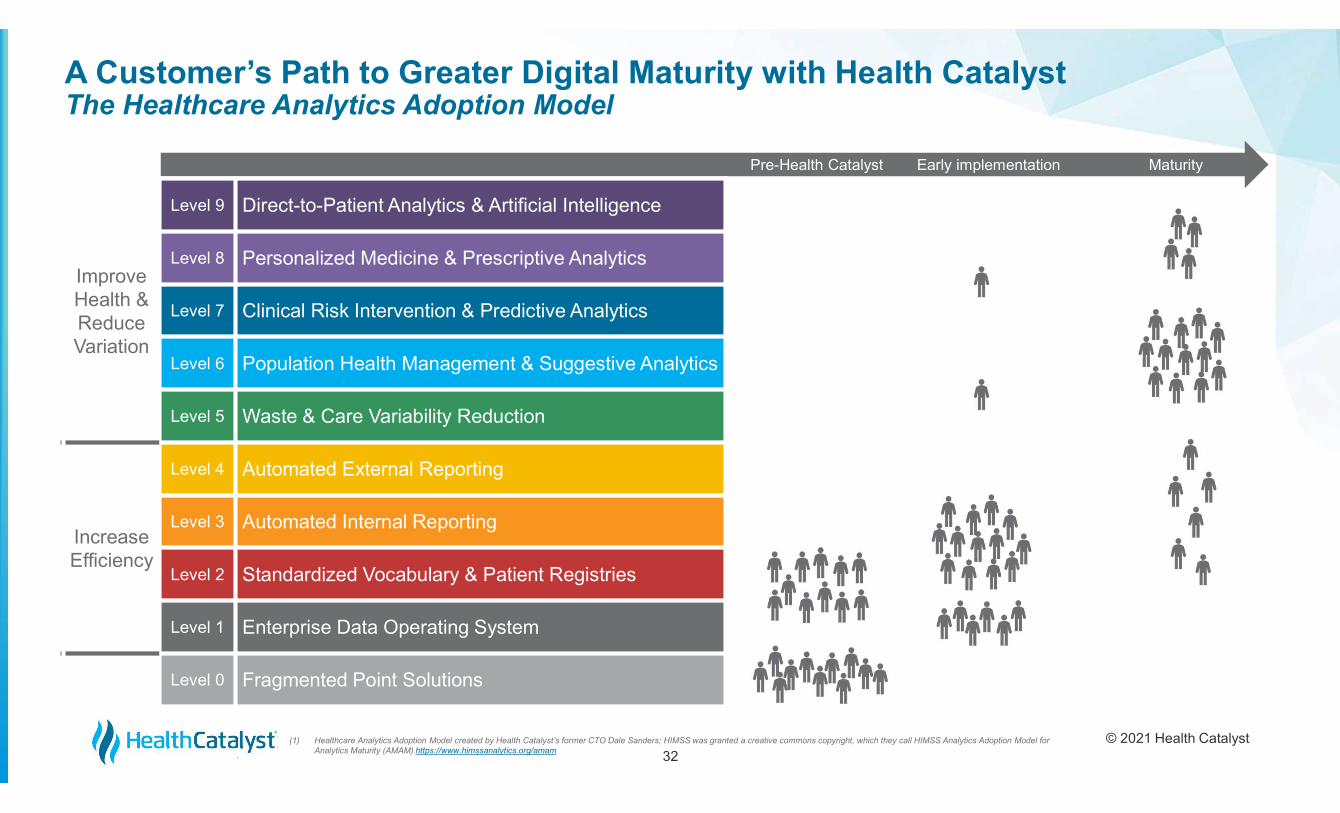
Pre-Health Catalyst Early implementation Maturity
Improve Health & Reduce Variation
Level 9 Direct-to-Patient Analytics & Artificial Intelligence
Level 8 Personalized Medicine & Prescriptive Analytics
Level 7 Clinical Risk Intervention & Predictive Analytics
Level 6 Population Health Management & Suggestive Analytics
Level 5 Waste & Care Variability Reduction
Increase Efficiency
Level 4 Automated External Reporting
Level 3 Automated Internal Reporting
Level 2 Standardized Vocabulary & Patient Registries
Level 1 Enterprise Data Operating System
Level 0 Fragmented Point Solutions
A Customer’s Path to Greater Digital Maturity with Health CatalystThe Healthcare Analytics Adoption Model
(1) Healthcare Analytics Adoption Model created by Health Catalyst’s former CTO Dale Sanders; HIMSS was granted a creative commons copyright, which they call HIMSS Analytics Adoption Model for Analytics Maturity (AMAM) https://www.himssanalytics.org/amam 32
© 2021 Health CatalystProprietary and Confidential
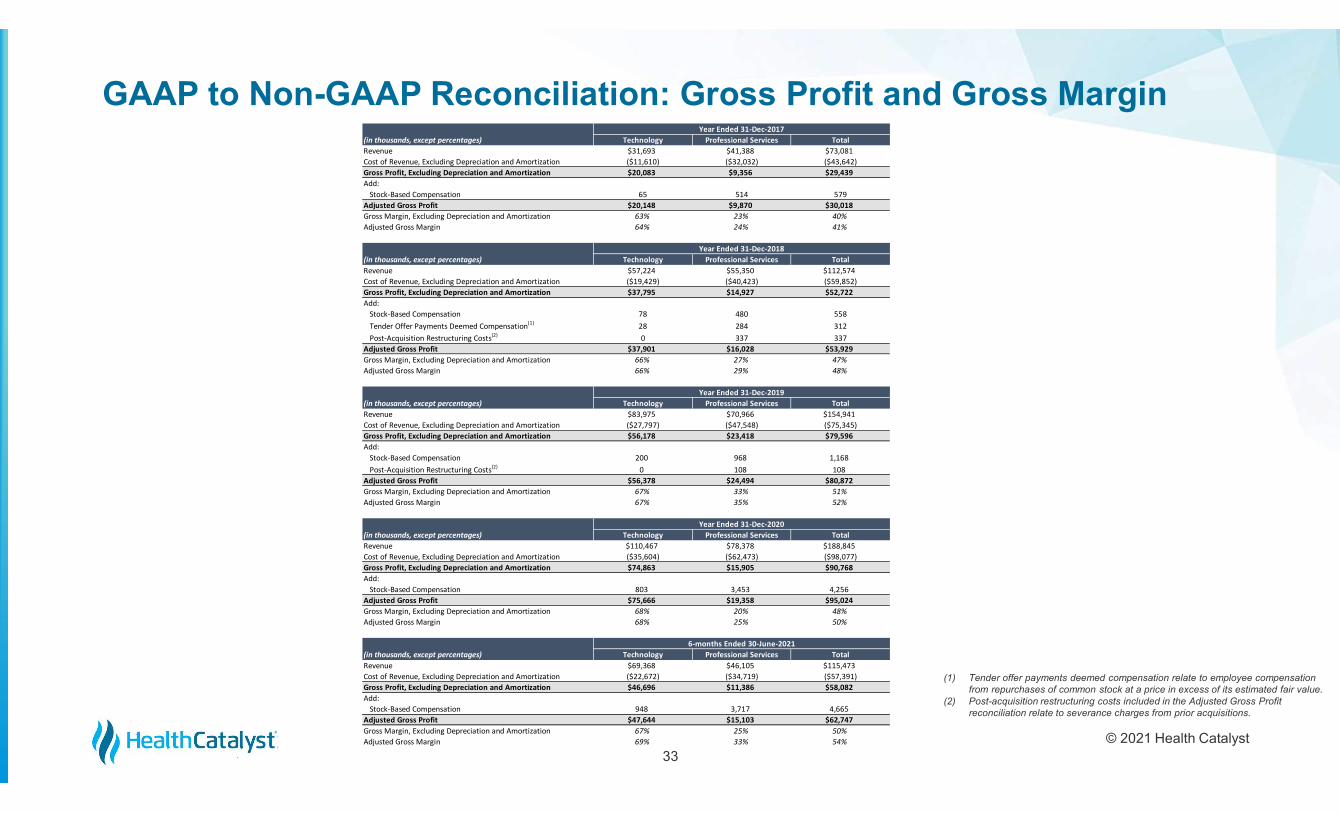
GAAP to Non-GAAP Reconciliation: Gross Profit and Gross Margin
33
(1) Tender offer payments deemed compensation relate to employee compensation from repurchases of common stock at a price in excess of its estimated fair value.
(2) Post-acquisition restructuring costs included in the Adjusted Gross Profit reconciliation relate to severance charges from prior acquisitions.
Year Ended 31-Dec-2017(in thousands, except percentages) Technology Professional Services TotalRevenue $31,693 $41,388 $73,081Cost of Revenue, Excluding Depreciation and Amortization ($11,610) ($32,032) ($43,642)Gross Profit, Excluding Depreciation and Amortization $20,083 $9,356 $29,439Add:
Stock-Based Compensation 65 514 579Adjusted Gross Profit $20,148 $9,870 $30,018Gross Margin, Excluding Depreciation and Amortization 63% 23% 40%Adjusted Gross Margin 64% 24% 41%
Year Ended 31-Dec-2018(in thousands, except percentages) Technology Professional Services TotalRevenue $57,224 $55,350 $112,574Cost of Revenue, Excluding Depreciation and Amortization ($19,429) ($40,423) ($59,852)Gross Profit, Excluding Depreciation and Amortization $37,795 $14,927 $52,722Add:
Stock-Based Compensation 78 480 558Tender Offer Payments Deemed Compensation(1) 28 284 312Post-Acquisition Restructuring Costs(2) 0 337 337
Adjusted Gross Profit $37,901 $16,028 $53,929Gross Margin, Excluding Depreciation and Amortization 66% 27% 47%Adjusted Gross Margin 66% 29% 48%
Year Ended 31-Dec-2019(in thousands, except percentages) Technology Professional Services TotalRevenue $83,975 $70,966 $154,941Cost of Revenue, Excluding Depreciation and Amortization ($27,797) ($47,548) ($75,345)Gross Profit, Excluding Depreciation and Amortization $56,178 $23,418 $79,596Add:
Stock-Based Compensation 200 968 1,168Post-Acquisition Restructuring Costs(2) 0 108 108
Adjusted Gross Profit $56,378 $24,494 $80,872Gross Margin, Excluding Depreciation and Amortization 67% 33% 51%Adjusted Gross Margin 67% 35% 52%
Year Ended 31-Dec-2020(in thousands, except percentages) Technology Professional Services TotalRevenue $110,467 $78,378 $188,845Cost of Revenue, Excluding Depreciation and Amortization ($35,604) ($62,473) ($98,077)Gross Profit, Excluding Depreciation and Amortization $74,863 $15,905 $90,768Add:
Stock-Based Compensation 803 3,453 4,256Adjusted Gross Profit $75,666 $19,358 $95,024Gross Margin, Excluding Depreciation and Amortization 68% 20% 48%Adjusted Gross Margin 68% 25% 50%
6-months Ended 30-June-2021(in thousands, except percentages) Technology Professional Services TotalRevenue $69,368 $46,105 $115,473Cost of Revenue, Excluding Depreciation and Amortization ($22,672) ($34,719) ($57,391)Gross Profit, Excluding Depreciation and Amortization $46,696 $11,386 $58,082Add:
Stock-Based Compensation 948 3,717 4,665Adjusted Gross Profit $47,644 $15,103 $62,747Gross Margin, Excluding Depreciation and Amortization 67% 25% 50%Adjusted Gross Margin 69% 33% 54%
© 2021 Health CatalystProprietary and Confidential
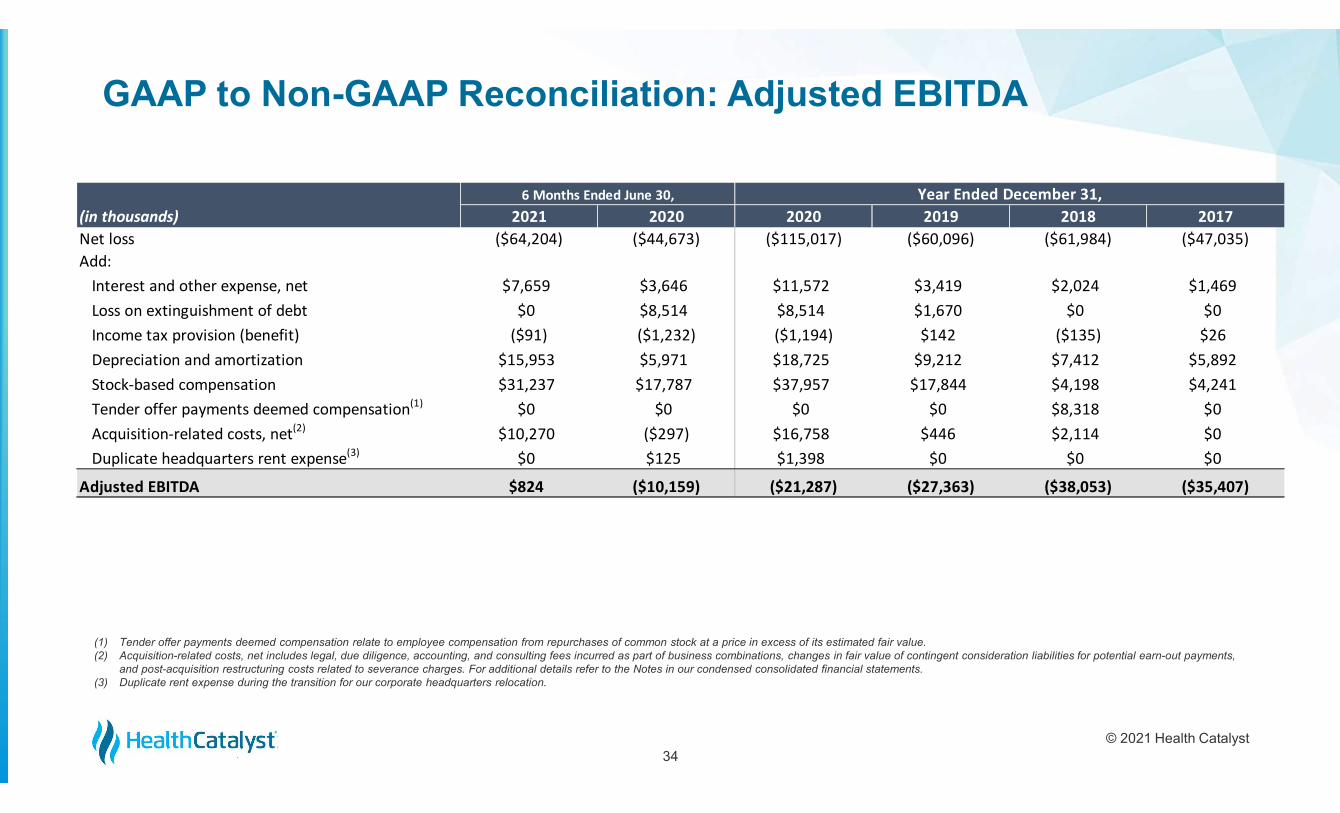
GAAP to Non-GAAP Reconciliation: Adjusted EBITDA
34
(1) Tender offer payments deemed compensation relate to employee compensation from repurchases of common stock at a price in excess of its estimated fair value.(2) Acquisition-related costs, net includes legal, due diligence, accounting, and consulting fees incurred as part of business combinations, changes in fair value of contingent consideration liabilities for potential earn-out payments,
and post-acquisition restructuring costs related to severance charges. For additional details refer to the Notes in our condensed consolidated financial statements.(3) Duplicate rent expense during the transition for our corporate headquarters relocation.
6 Months Ended June 30, Year Ended December 31,(in thousands) 2021 2020 2020 2019 2018 2017Net loss ($64,204) ($44,673) ($115,017) ($60,096) ($61,984) ($47,035)Add:
Interest and other expense, net $7,659 $3,646 $11,572 $3,419 $2,024 $1,469Loss on extinguishment of debt $0 $8,514 $8,514 $1,670 $0 $0Income tax provision (benefit) ($91) ($1,232) ($1,194) $142 ($135) $26Depreciation and amortization $15,953 $5,971 $18,725 $9,212 $7,412 $5,892Stock-based compensation $31,237 $17,787 $37,957 $17,844 $4,198 $4,241Tender offer payments deemed compensation(1) $0 $0 $0 $0 $8,318 $0Acquisition-related costs, net(2) $10,270 ($297) $16,758 $446 $2,114 $0Duplicate headquarters rent expense(3) $0 $125 $1,398 $0 $0 $0
Adjusted EBITDA $824 ($10,159) ($21,287) ($27,363) ($38,053) ($35,407)


![ekuo vf/kdkj laj{k.k vf/kfu;e] 1993ncwapps.nic.in/acts/TheProtectionofHumanRightsAct1993_HINDI.pdf · jk"Vªh; ekuo vf/kdkj vk;ksx ekuo vf/kdkj laj{k.k vf/kfu;e] 1993 [ekuo vf/kdkj](https://static.fdocuments.net/doc/165x107/5f57417f9630ce1ff451265e/ekuo-vfkdkj-lajkk-vfkfue-jkvh-ekuo-vfkdkj-vkksx-ekuo-vfkdkj-lajkk.jpg)
