Health Care Promotion / Wellness Initiatives Review Health... · Health Care Promotion / Wellness...
8
October 2015 Health Care Promotion / Wellness Initiatives Review This material is PRIVILEGED AND CONFIDENTIAL. Any disclosure, copying, distribution, or action taken in reliance on the contents of this document is prohibited. 1
Transcript of Health Care Promotion / Wellness Initiatives Review Health... · Health Care Promotion / Wellness...

October 2015
Health Care Promotion /
Wellness Initiatives
Review
This material is PRIVILEGED AND CONFIDENTIAL.
Any disclosure, copying, distribution, or action taken in reliance on the contents of this document is prohibited.
1

Covered Lives Overview
2
Age Range HSC Count HSC % MC Count MC % Total %
<18 1,853 25% 977 21% 2,830 24%
18 - 24 937 13% 561 12% 1,498 12%
25 - 34 1,151 16% 425 9% 1,576 13%
35 - 44 1,084 14% 654 14% 1,738 14%
45 - 54 1,127 15% 837 18% 1,964 16%
55 - 64 959 13% 908 19% 1,867 16%
65 Plus 214 3% 314 7% 528 4%
Total 7,325 100% 4,676 100% 12,001 100%
Gender HSC Count HSC % MC Count MC % Total %
Female 3,885 53% 2,404 51% 6,289 52%
Male 3,440 47% 2,272 49% 5,712 48%
Total 7,325 100% 4,676 100% 12,001 100%
Key Take-Aways:
• 4,363 Employees Covered / 7,317 Dependents Covered • Worth noting: 18% of eligible employees are not enrolled in any UT Health Care Benefit Plans • 1/4 of covered lives are under 18 (more frequent routine office/lab visits) • 1/5 of covered lives are over 54 (potential for more chronic conditions) • Healthier ages tend to be 18 – 34 which is 25% of UT’s covered lives

High Cost Drivers
Specialty Drugs 10%
Wellness & Symptom Visits 18%
Non Specialty
Drugs 25%
Musculo-skeletal & Circulatory
47%
Employee Costs
3
Top Items Include…
Specialty Drugs • Multiple Sclerosis • Rheumatoid Arthritis • HIV
Wellness & Symptom Visits • Office Visits • Specialist Visits • Diagnostic Visits/Labs
Non Specialty Drugs • Diabetes • Asthma • GI Disorders
Musculoskeletal & Circulatory • Back • Neck • Joints • Ligaments • Heart • Blood • Vessels
Large HSC population
1% of users drive 20% of costs
Large <18 yrs. of age “covered lives” population
Large HSC population
Large >54 yrs. of age “covered lives” population
4
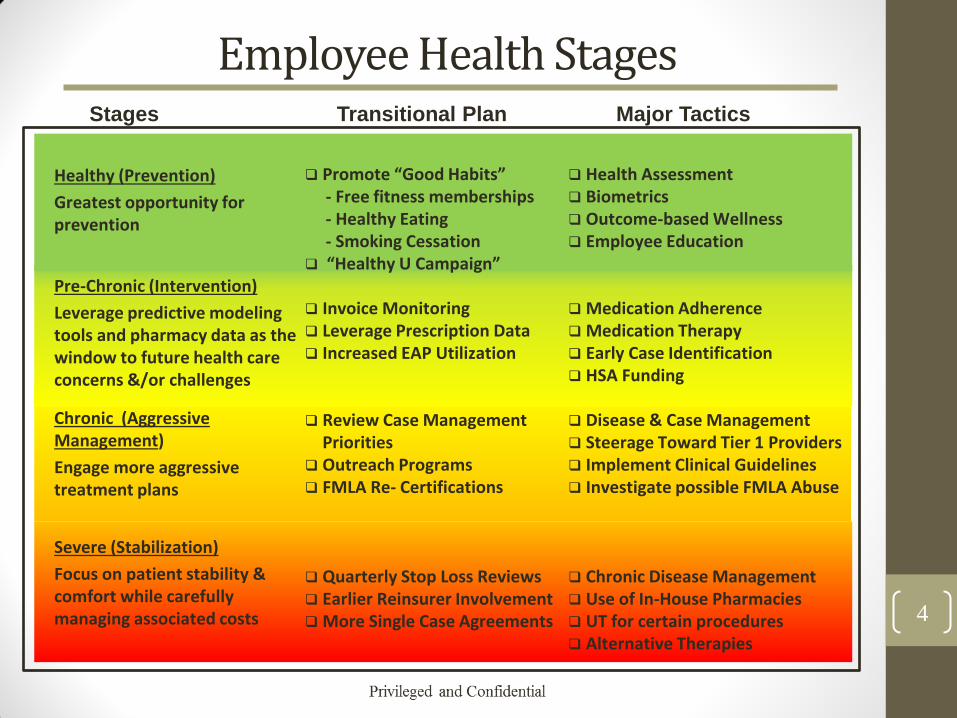
Employee Health Stages Stages Major Tactics
Healthy (Prevention)
Greatest opportunity for prevention
Pre-Chronic (Intervention)
Leverage predictive modeling tools and pharmacy data as the window to future health care concerns &/or challenges
Chronic (Aggressive Management)
Engage more aggressive treatment plans
Severe (Stabilization)
Focus on patient stability & comfort while carefully managing associated costs
Health Assessment Biometrics Outcome-based Wellness Employee Education Medication Adherence Medication Therapy Early Case Identification HSA Funding
Disease & Case Management Steerage Toward Tier 1 Providers Implement Clinical Guidelines Investigate possible FMLA Abuse
Chronic Disease Management Use of In-House Pharmacies UT for certain procedures Alternative Therapies
Promote “Good Habits” - Free fitness memberships - Healthy Eating - Smoking Cessation “Healthy U Campaign”
Invoice Monitoring Leverage Prescription Data Increased EAP Utilization
Review Case Management
Priorities Outreach Programs FMLA Re- Certifications Quarterly Stop Loss Reviews Earlier Reinsurer Involvement More Single Case Agreements
Transitional Plan

5
Healthy Pre-Chronic Chronic Severe
Employees with poor physical fitness cost $500 more than the average employee.
Employees with unknown health status cost $1,400 more than the average employee.
Employees with uncontrolled chronic conditions cost $3,300 more than the average employee.
Employees with serious illness cost $19,000 more than the average employee.
Free memberships at Morse and Rec Centers.
Complete health assessments and biometric screenings.
Medication adherence, therapy and case management.
Aggressive disease management.
Baseline: Employee Health Check Categories
$ $$ $$$ $$$$

25 Cost-Management Best Practices
6
√
√ √
√
√
√ √
√ - Currently used by UT

7
Health Assessment & Risk Evaluation
Wellness Program Offerings
Biometric Data Physician Exam/Self-Reported Data
Onsite Screenings Offsite Lab Screening
Health Assessment • Online • Mobile • Paper
Wellness Platform • Content focused on employee health stages • Wellness monitoring • Healthy Outcome Contests • Monitor participation • “Healthy U Campaign”
Health Management • Programs linked to top cost drivers • Case & disease mgmt. • Outcome-based goals • EAP integration
Health Coaching • Lifestyle management • Behavior modification • Promote “Good Habits” • Adherence Monitoring • Medication Therapy Management
Program Support • Communications • Program design • Data analysis • Predictive modeling • Reporting
Health Care Tools Improved Employee Wellbeing
Wellness Strategy
Employee Health Baseline

Lastly…
8