HbA1c target: how low should we go? Angelo Avogaro ... · More SAEs 10.5% vs 3.5% w/ hypoglycemia...
31
13th Meeting of the Mediterranean Group for the Study of Diabetes Satellite Symposium: Diamicron MR 60 mg “Protect the kidney to save the heart“ HbA1c target: how low should we go? Angelo Avogaro. University of Padova. Italy
Transcript of HbA1c target: how low should we go? Angelo Avogaro ... · More SAEs 10.5% vs 3.5% w/ hypoglycemia...
13th Meeting of the Mediterranean Group for the Study of Diabetes
Satellite Symposium: Diamicron MR 60 mg “Protect the
kidney to save the heart“
HbA1c target: how low should we go?
Angelo Avogaro. University of Padova. Italy

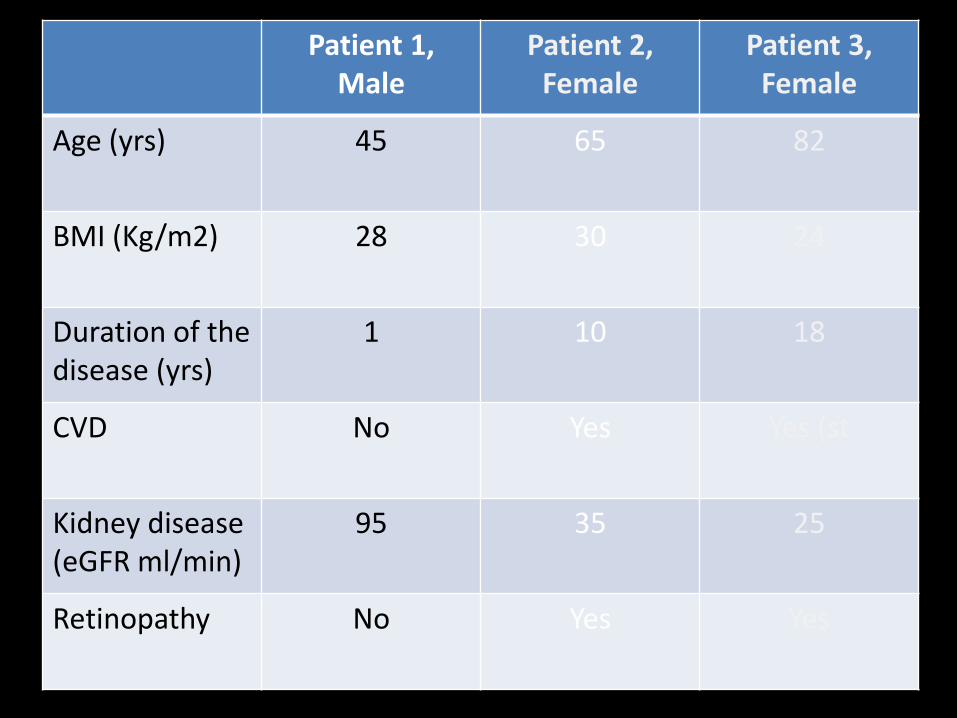
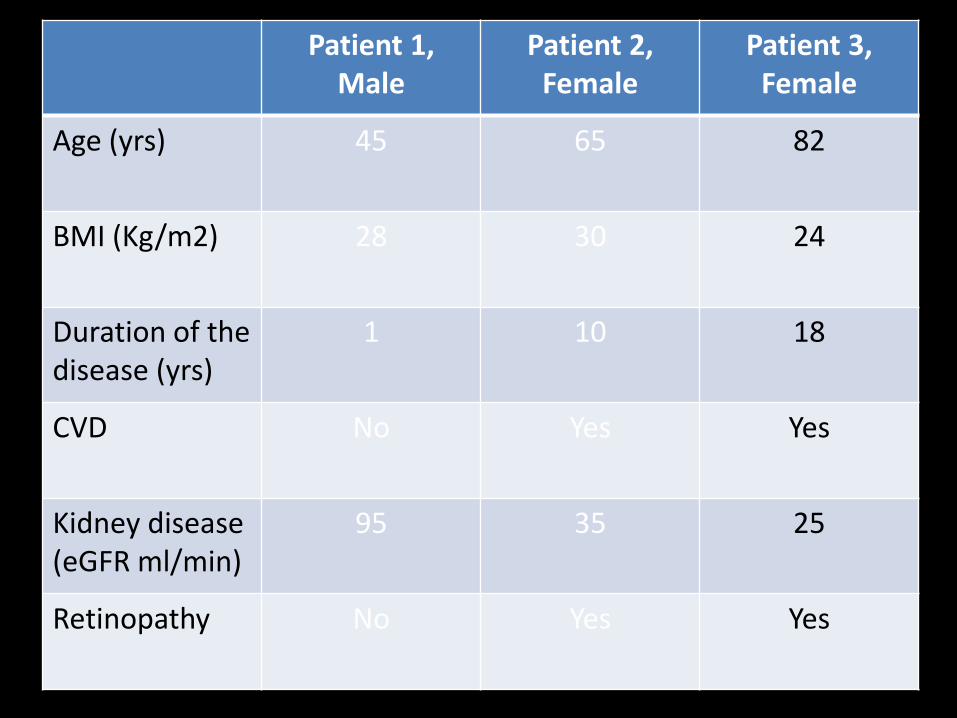
Patient 1, Male
Patient 2, Female
Patient 3, Female
Age (yrs) 45 65 82
BMI (Kg/m2) 28 30 24
Duration of the disease (yrs)
1 10 18
CVD No Yes Yes
Kidney disease (eGFR ml/min)
95 35 25
Retinopathy No Yes Yes
Patient 1, Male
Patient 2, Female
Patient 3, Female
Age (yrs) 45 65 82
BMI (Kg/m2) 28 30 24
Duration of the disease (yrs)
1 10 18
CVD No Yes Yes (st
Kidney disease (eGFR ml/min)
95 35 25
Retinopathy No Yes Yes
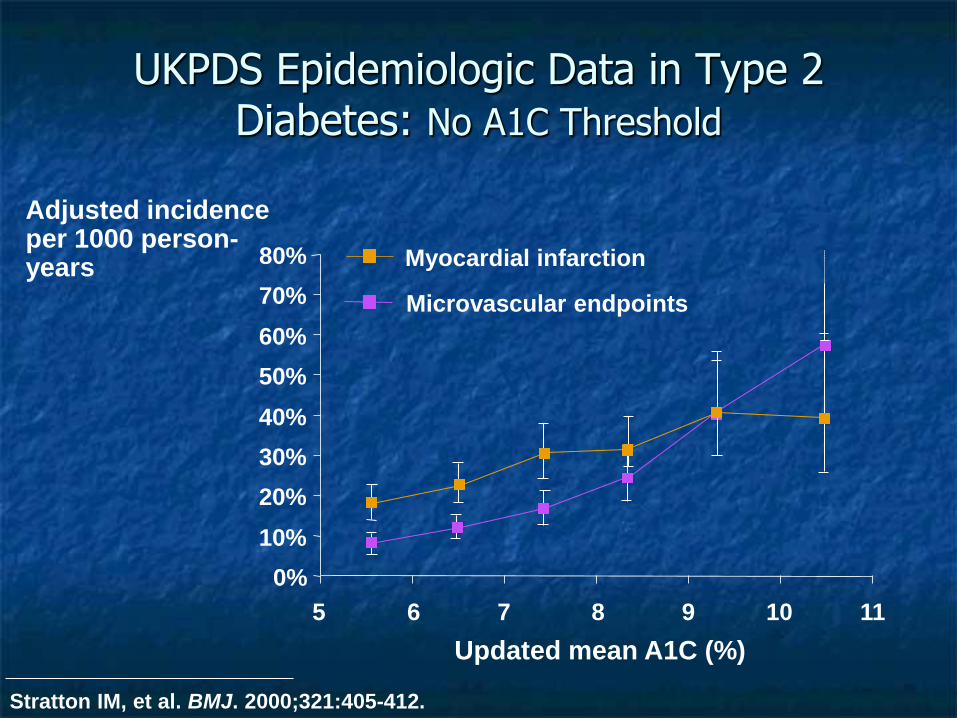
UKPDS Epidemiologic Data in Type 2 Diabetes: No A1C Threshold
0%
10%
20%
30%
40%
50%
60%
70%
80%
5 6 7 8 9 10 11
Adjusted incidence per 1000 person-years Myocardial infarction
Microvascular endpoints
Updated mean A1C (%)
Stratton IM, et al. BMJ. 2000;321:405-412.
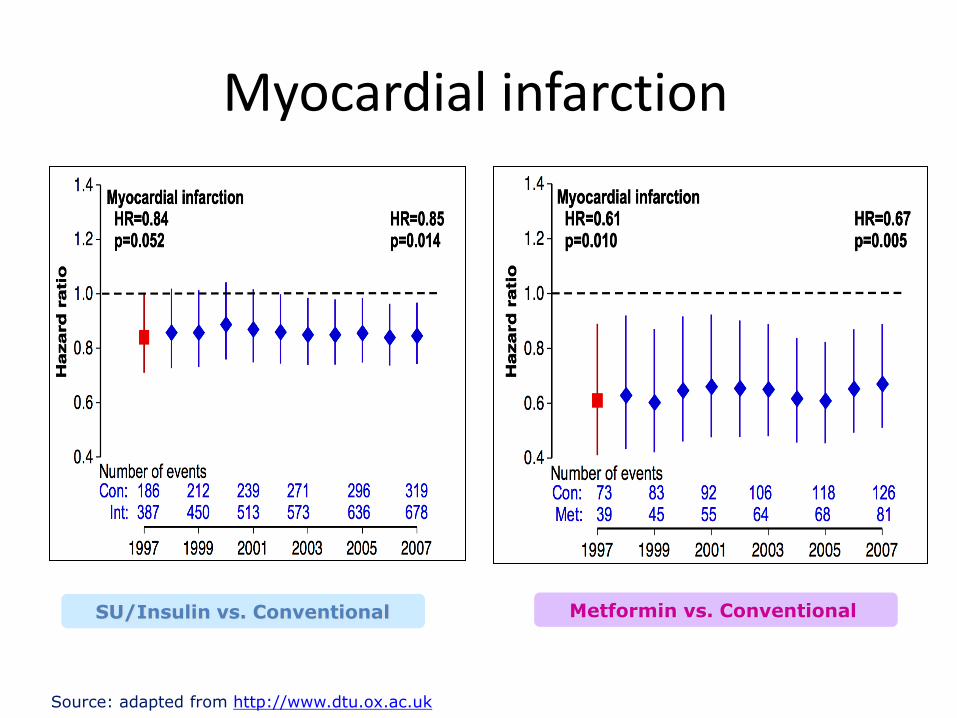
Myocardial infarction
Source: adapted from http://www.dtu.ox.ac.uk
SU/Insulin vs. Conventional Metformin vs. Conventional
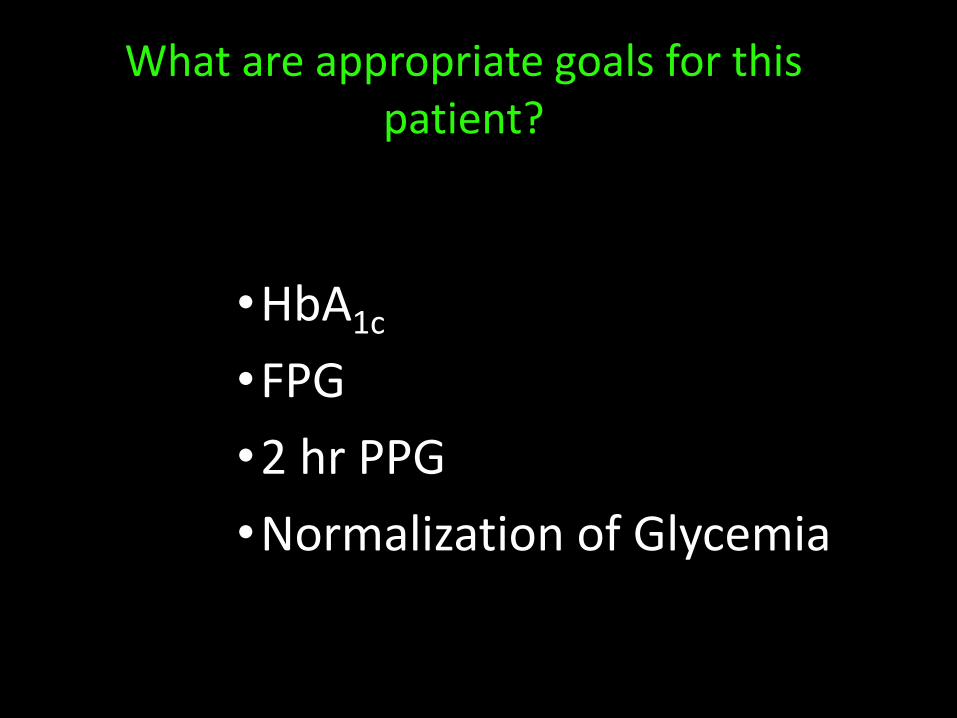
What are appropriate goals for this patient?
•HbA1c
•FPG
•2 hr PPG
•Normalization of Glycemia

PPG Contributes more to HbA1c at low HbA1c values
Monnier L, Lapinski H, Colette C. Contributions of fasting and postprandial plasma glucose increments
to the overall diurnal hyperglycaemia of type 2 diabetic patients. Diabetes Care 2003;26.
Co
ntr
ibu
tio
n (
%)
(<7.3) (7.3-8.4) (9.5-9.2) (9.3-10.2) (>10.2)
HbA1c quintiles
0
20
40
60
80
1 2 3 4 5
Postprandial
Fasting Hyperglycemia

Hyperglycemia is a continuous risk factor for CVD...
Therefore normality should be the goal if it can be safely achieved

ADA: “...for patients in general is an A1C<7%....for the individual patient is an A1C as close to normal (<6.0%) as
possible without significant hypoglycemia..”
ADA, Diabetes Care 29:S4-S42, 2006. CDA, Can J Diabetes 27:S1-S151, 2003
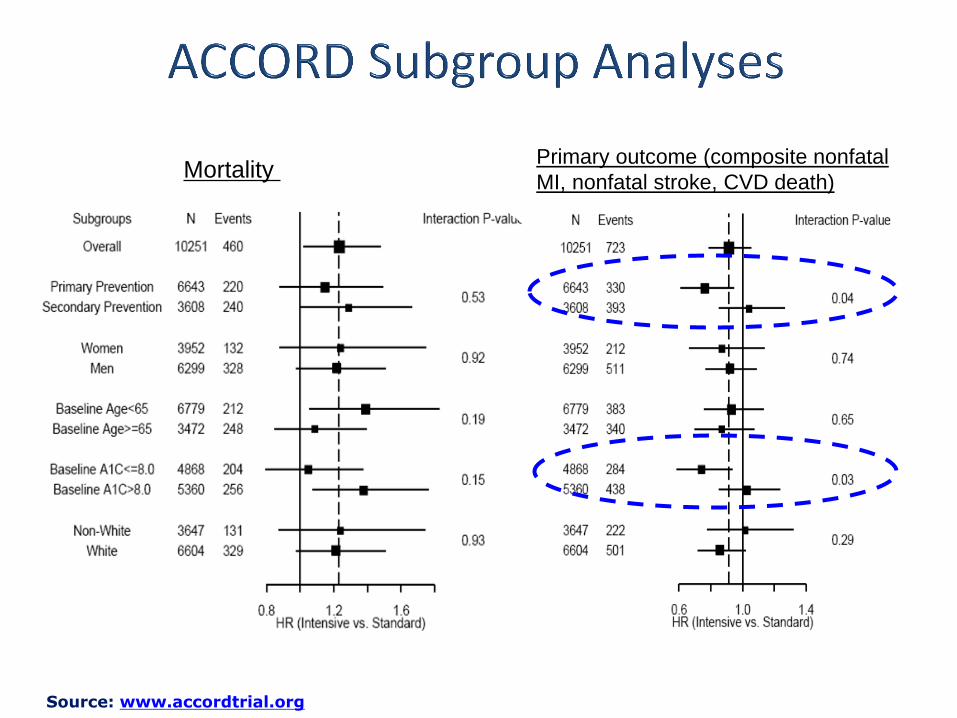
Mortality Primary outcome (composite nonfatal
MI, nonfatal stroke, CVD death)
Source: www.accordtrial.org

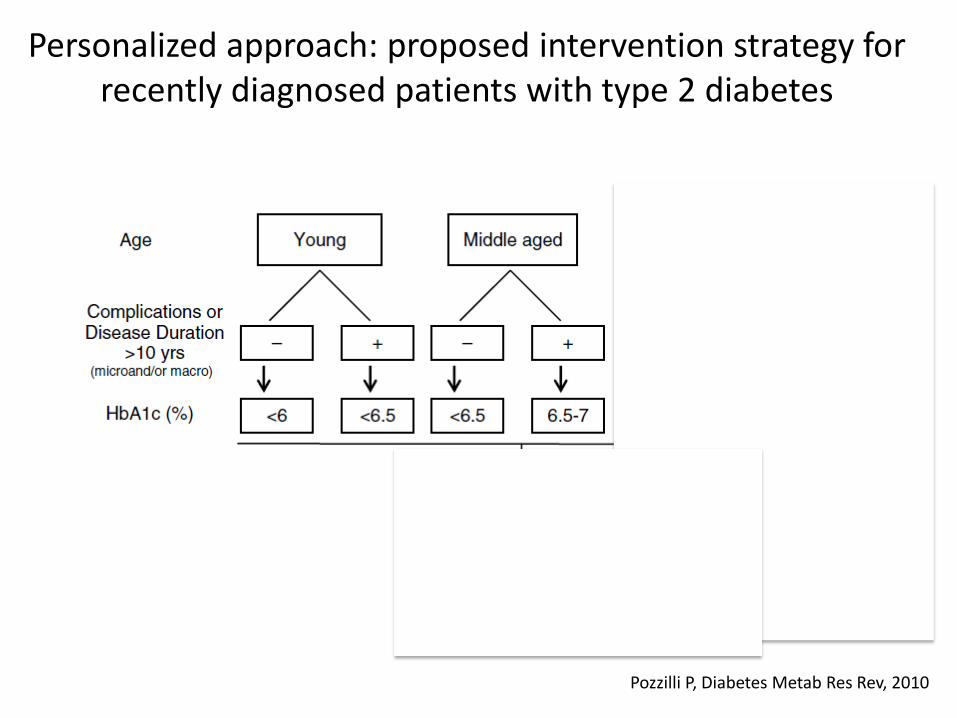
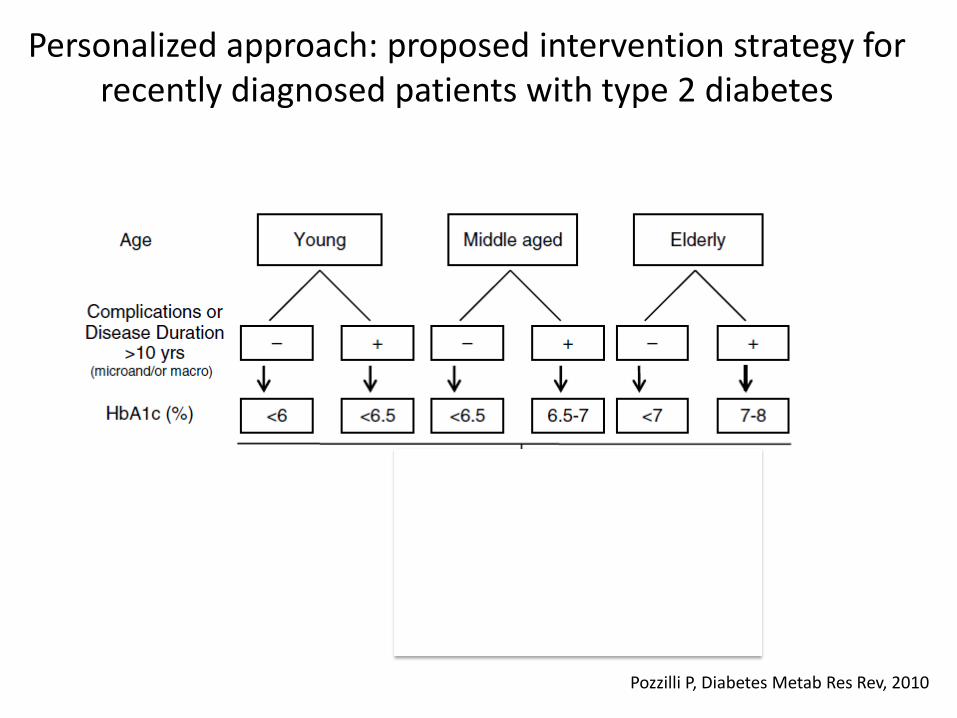
Pozzilli P, Diabetes Metab Res Rev, 2010
9%
Personalized approach: proposed intervention strategy for recently diagnosed patients with type 2 diabetes

Patient 1, Male
Patient 2, Female
Patient 3, Female
Age (yrs) 45 65 82
BMI (Kg/m2) 28 30 24
Duration of the disease (yrs)
1 10 18
CVD No Yes Yes
Kidney disease (eGFR ml/min)
95 35 25
Retinopathy No Yes Yes
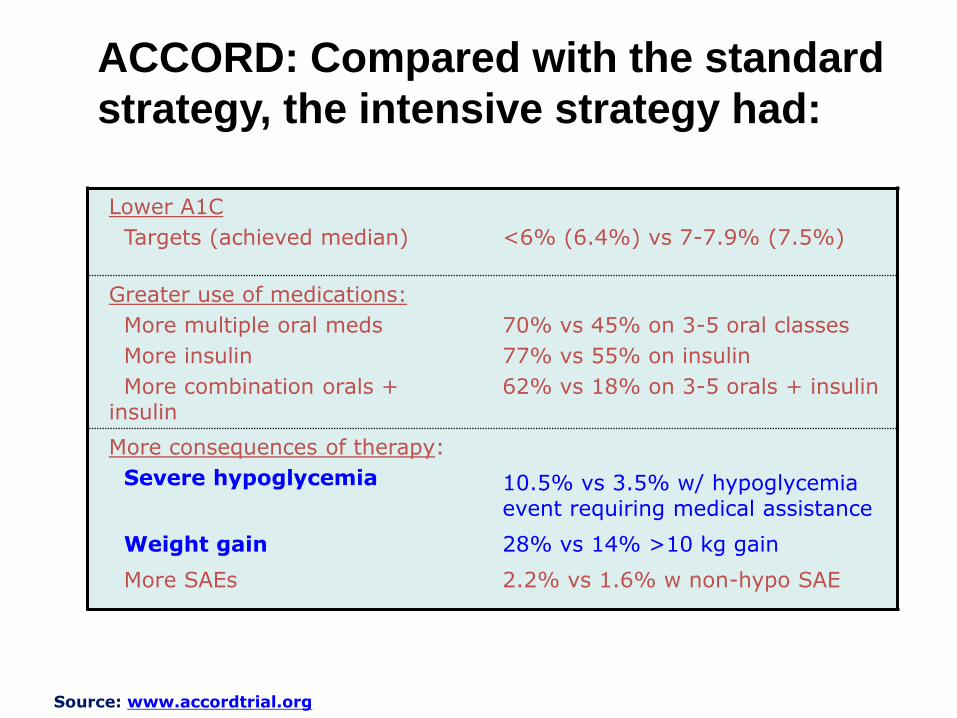
Lower A1C
Targets (achieved median)
<6% (6.4%) vs 7-7.9% (7.5%)
Greater use of medications:
More multiple oral meds
More insulin
More combination orals + insulin
70% vs 45% on 3-5 oral classes
77% vs 55% on insulin
62% vs 18% on 3-5 orals + insulin
More consequences of therapy:
Severe hypoglycemia
Weight gain
More SAEs
10.5% vs 3.5% w/ hypoglycemia event requiring medical assistance
28% vs 14% >10 kg gain
2.2% vs 1.6% w non-hypo SAE
ACCORD: Compared with the standard
strategy, the intensive strategy had:
Source: www.accordtrial.org

Association of hypoglycemia and cardiac ischemia. A study based upon continuous glucose monitoring
and EKG monitoring (Desouza et al; Diabetes Care 26: 1485, 2003)
Total episodes Episodes with
cardiac pain
Episodes with
EKG
abnormalities
Hypoglycemia 54 10 6
Asymptomatic 28 - 2
Symptomatic 26 10 4
Normoglycemia - 0 0
Hyperglycemia 59 1 0
Glucose
increase >100
mg in 1 h
50 9 2
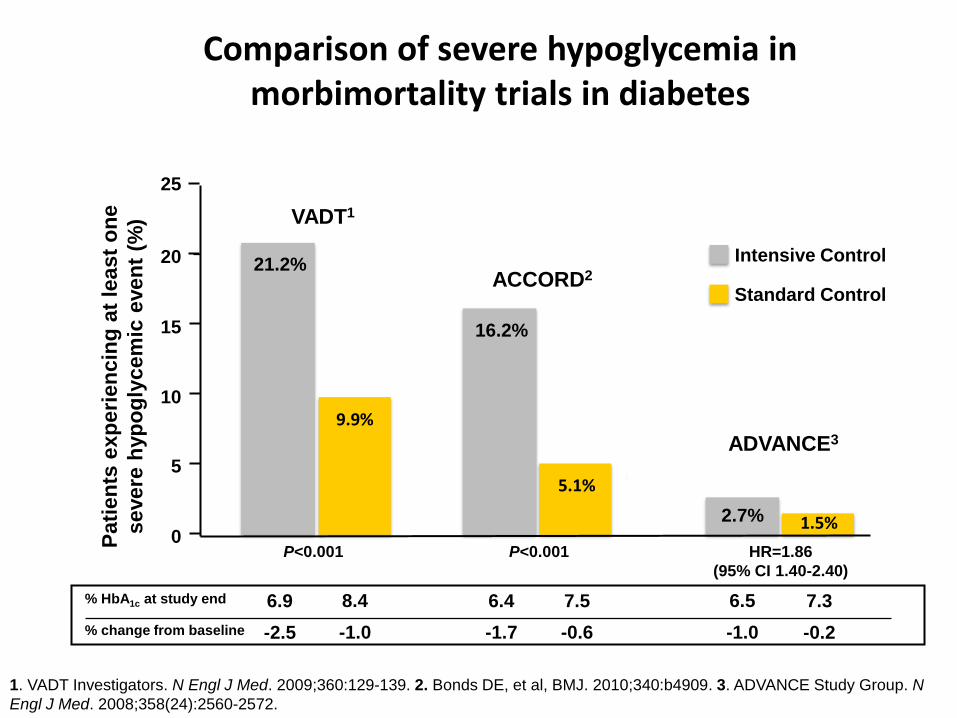
ACCORD2
ADVANCE3
Intensive Control
Standard Control
Pati
en
ts e
xp
eri
en
cin
g a
t le
ast
on
e
severe
hyp
og
lycem
ic e
ven
t (%
)
0
5
10
15
20
25
VADT1
2.7% 1.5%
16.2%
5.1%
21.2%
9.9%
P<0.001 P<0.001 HR=1.86
(95% CI 1.40-2.40)
Comparison of severe hypoglycemia in morbimortality trials in diabetes
% HbA1c at study end 7.3 6.4 6.9
% change from baseline -0.2 -1.7 -2.5
8.4
-1.0
7.5
-0.6
6.5
-1.0
1. VADT Investigators. N Engl J Med. 2009;360:129-139. 2. Bonds DE, et al, BMJ. 2010;340:b4909. 3. ADVANCE Study Group. N
Engl J Med. 2008;358(24):2560-2572.

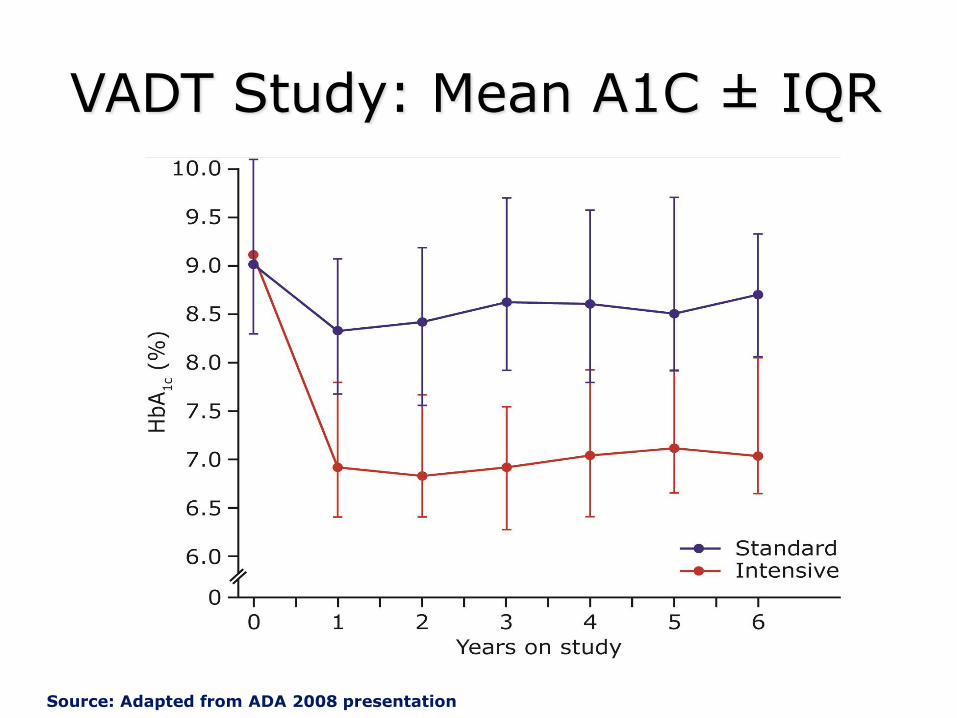
VADT Study: Mean A1C ± IQR
Source: Adapted from ADA 2008 presentation

CV Death
Standard Intensive
29 36
Sudden Death
Standard Intensive
4 11
Source: Adapted from ADA 2008 presentation

Predictors of Cardiovascular Death
VADT
Prior Event
HbA1c
HDL
Age
3.116 (1.744, 5567)
1.213 (1.038,1.417)
0.699 (0.536, 0.910)
2.090 (1.518, 2877)
Hypoglycemia 4.042 (1.449,11.276) 0.01
<0.01
0.02
0.01
<0.01
12 0 2 4 6 8 10
P Value
Hazard Ratio
(HR lower CL,
HR upper CL)
Pozzilli P, Diabetes Metab Res Rev, 2010
9%
Personalized approach: proposed intervention strategy for recently diagnosed patients with type 2 diabetes
Patient 1, Male
Patient 2, Female
Patient 3, Female
Age (yrs) 45 65 82
BMI (Kg/m2) 28 30 24
Duration of the disease (yrs)
1 10 18
CVD No Yes Yes
Kidney disease (eGFR ml/min)
95 35 25
Retinopathy No Yes Yes
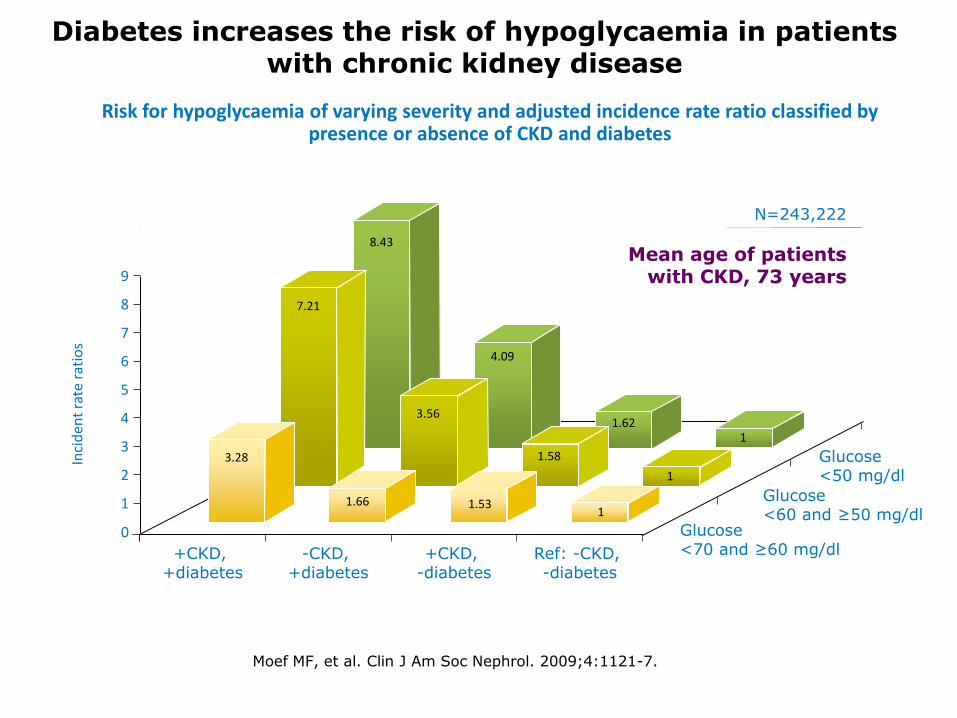
Diabetes increases the risk of hypoglycaemia in patients with chronic kidney disease
Risk for hypoglycaemia of varying severity and adjusted incidence rate ratio classified by presence or absence of CKD and diabetes
Moef MF, et al. Clin J Am Soc Nephrol. 2009;4:1121-7.
Inci
den
t ra
te r
atio
s
+CKD, +diabetes
-CKD, +diabetes
Ref: -CKD, -diabetes
Glucose <70 and ≥60 mg/dl
Glucose <60 and ≥50 mg/dl
Glucose <50 mg/dl
9
0
N=243,222
Mean age of patients with CKD, 73 years
8
7
6
5
4
3
2
1
+CKD, -diabetes
3.28
7.21
8.43
1.66 1.53 1
1
1
1.58
1.62
4.09
3.56
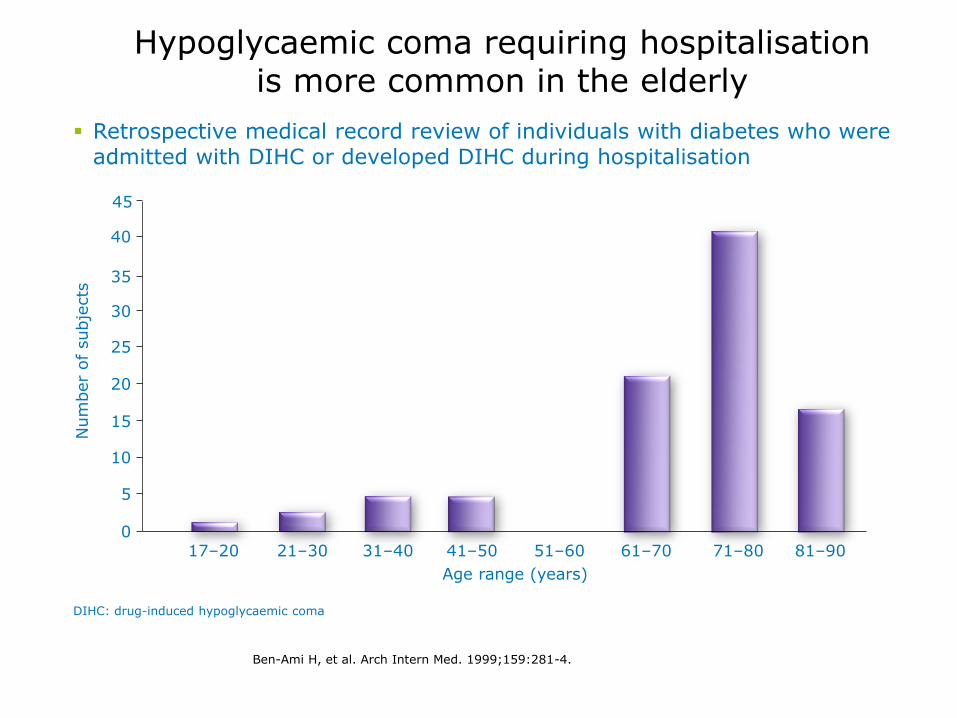
DIHC: drug-induced hypoglycaemic coma
17–20
Age range (years)
Num
ber
of
subje
cts
30
35
40
20
15
0
25
10
5
21–30 31–40 41–50 51–60 61–70 71–80 81–90
45
Hypoglycaemic coma requiring hospitalisation is more common in the elderly
Ben-Ami H, et al. Arch Intern Med. 1999;159:281-4.
Retrospective medical record review of individuals with diabetes who were admitted with DIHC or developed DIHC during hospitalisation
24
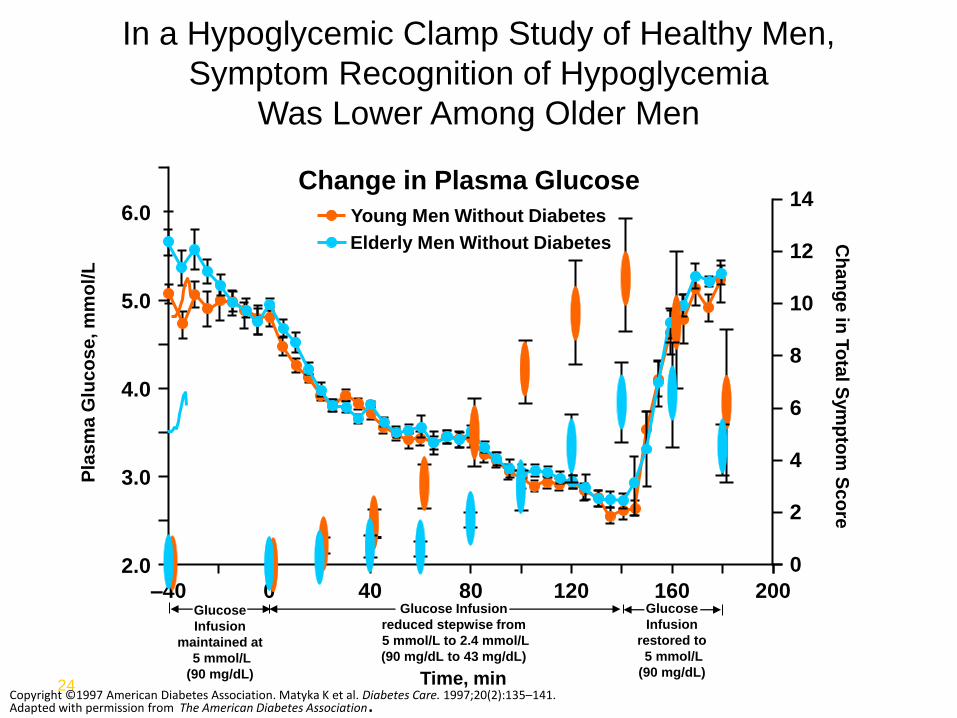
In a Hypoglycemic Clamp Study of Healthy Men,
Symptom Recognition of Hypoglycemia
Was Lower Among Older Men
Change in Plasma Glucose
200
Time, min
–40
2.0
3.0
4.0
5.0
6.0
0 40 80 120 160
Young Men Without Diabetes
Elderly Men Without Diabetes Ch
an
ge
in T
ota
l Sym
pto
m S
co
re
0
14
12
10
8
6
4
2
Pla
sm
a G
luc
os
e, m
mo
l/L
Glucose
Infusion
maintained at
5 mmol/L
(90 mg/dL)
Glucose Infusion
reduced stepwise from
5 mmol/L to 2.4 mmol/L
(90 mg/dL to 43 mg/dL)
Glucose
Infusion
restored to
5 mmol/L
(90 mg/dL)
Copyright ©1997 American Diabetes Association. Matyka K et al. Diabetes Care. 1997;20(2):135–141. Adapted with permission from The American Diabetes Association.

Reducing average glycaemia without reducing variability may be dangerous
• Reduction in average glycaemia without reducing glucose variability is indicated by downward shift of the glucose profile from the upper panel to the lower panel
• This results in increased occurrence and severity of hypoglycaemic episodes
Kovatchev et al. J Diabetes Sci Technol 2009;3:1058–65
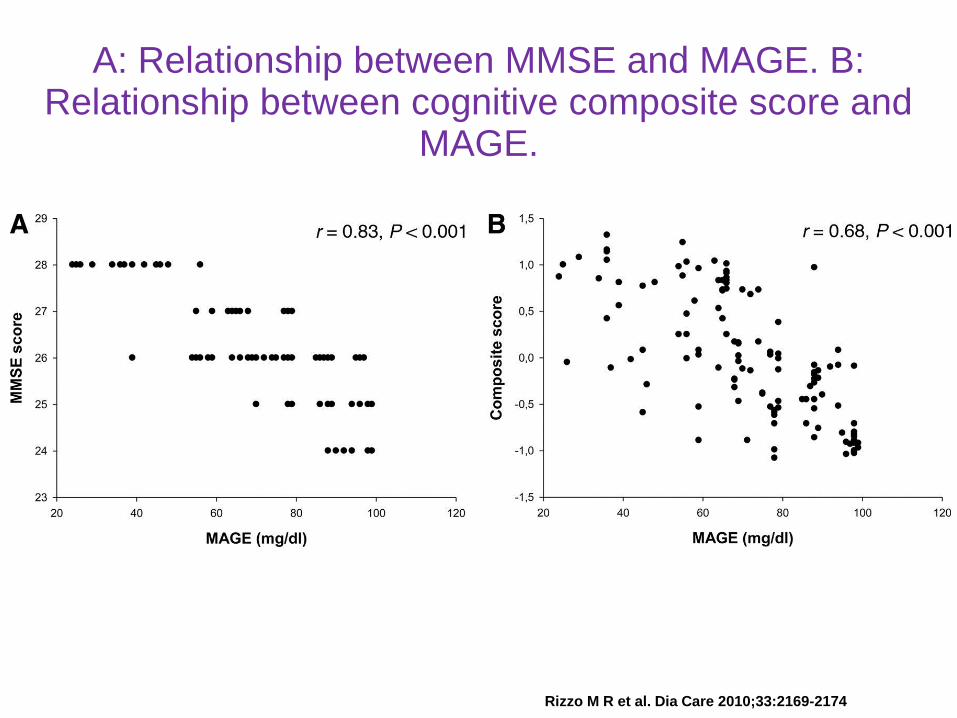
A: Relationship between MMSE and MAGE. B: Relationship between cognitive composite score and
MAGE.
Rizzo M R et al. Dia Care 2010;33:2169-2174

Hypoglycemia due to glibenclamide was associated
with higher prevalence of coma and longer duration
than hypoglycemia due to insulin.
Glibenclamide use was also associated with a longer
hospital stay.
Pozzilli P, Diabetes Metab Res Rev, 2010
9%
Personalized approach: proposed intervention strategy for recently diagnosed patients with type 2 diabetes