HB 1322 Department of Legislative Services Maryland...
13
HB 1322 Department of Legislative Services Maryland General Assembly 2017 Session FISCAL AND POLICY NOTE First Reader House Bill 1322 (Delegate Beidle, et al.) Environment and Transportation and Appropriations Local Infrastructure Fast Track for Maryland Act This bill alters the distribution of funds in the Gasoline and Motor Vehicle Revenue Account (GMVRA) over seven years beginning in fiscal 2018 and establishes a minimum distribution to municipalities from fiscal 2018 through 2023. The bill authorizes the Office of Legislative Audits (OLA) to audit local governments to ensure highway user revenues are used for an authorized purpose. The Maryland Department of Transportation (MDOT) may not disburse highway user revenues to a jurisdiction for 12 months if the jurisdiction has used its revenues for an unauthorized purpose or has not submitted a related annual report; any undisbursed funds revert to the Transportation Trust Fund (TTF). Finally, the bill requires the Department of Budget and Management (DBM), by December 31, 2017, to submit a report regarding local infrastructure to the General Assembly. The bill takes effect July 1, 2017. Fiscal Summary State Effect: TTF revenues available to MDOT decrease by an estimated $98.7 million in FY 2018, $146.8 million in FY 2019, $194.7 million in FY 2020, $245.3 million in FY 2021, and $296.2 million in FY 2022. Combined with a reduction in bond issuances and corresponding debt service savings, TTF revenues available to MDOT decrease by approximately $1.9 billion over the five-year period. The effect is greater in future fiscal years as the bill continues to reduce MDOTs share of GMVRA revenues through FY 2024. General fund expenditures likely increase significantly for DBM to complete the required report, and completion of the report may not be possible in the timeframe established by the bill. Other agencies can provide input on the report using existing resources. OLA can implement the bill with existing resources, as discussed below.
Transcript of HB 1322 Department of Legislative Services Maryland...
HB 1322
Department of Legislative Services Maryland General Assembly
2017 Session
FISCAL AND POLICY NOTE
First Reader
House Bill 1322 (Delegate Beidle, et al.)
Environment and Transportation and
Appropriations
Local Infrastructure Fast Track for Maryland Act
This bill alters the distribution of funds in the Gasoline and Motor Vehicle Revenue
Account (GMVRA) over seven years beginning in fiscal 2018 and establishes a minimum
distribution to municipalities from fiscal 2018 through 2023. The bill authorizes the Office
of Legislative Audits (OLA) to audit local governments to ensure highway user revenues
are used for an authorized purpose. The Maryland Department of Transportation (MDOT)
may not disburse highway user revenues to a jurisdiction for 12 months if the jurisdiction
has used its revenues for an unauthorized purpose or has not submitted a related annual
report; any undisbursed funds revert to the Transportation Trust Fund (TTF). Finally, the
bill requires the Department of Budget and Management (DBM), by December 31, 2017,
to submit a report regarding local infrastructure to the General Assembly.
The bill takes effect July 1, 2017.
Fiscal Summary
State Effect: TTF revenues available to MDOT decrease by an estimated $98.7 million in
FY 2018, $146.8 million in FY 2019, $194.7 million in FY 2020, $245.3 million in
FY 2021, and $296.2 million in FY 2022. Combined with a reduction in bond issuances
and corresponding debt service savings, TTF revenues available to MDOT decrease by
approximately $1.9 billion over the five-year period. The effect is greater in future fiscal
years as the bill continues to reduce MDOTs share of GMVRA revenues through FY 2024.
General fund expenditures likely increase significantly for DBM to complete the required
report, and completion of the report may not be possible in the timeframe established by
the bill. Other agencies can provide input on the report using existing resources. OLA can
implement the bill with existing resources, as discussed below.

HB 1322/ Page 2
Local Effect: The bill alters the distribution of GMVRA revenues, thereby increasing
local highway user revenues by an estimated $98.7 million in FY 2018, $146.8 million in
FY 2019, $194.7 million in FY 2020, $245.3 million in FY 2021, and $296.2 million in
FY 2022. To the extent that local highway user revenues are withheld and revert to TTF,
revenues decrease; however, any such impact is speculative and not assumed in this
analysis. Local governments can provide input to DBM using existing resources. Small Business Effect: None.
Analysis
Bill Summary:
Distribution of Highway User Revenues
Exhibit 1 summarizes the bill’s proposed distribution of highway user revenues in
fiscal 2018 through 2025. Additional distributions to municipalities must be made from
MDOT’s share of GMVRA revenues from fiscal 2018 through 2023, if necessary, to ensure
that the total distributions, including any capital transportation grants, are at least
$26.4 million each fiscal year.
Exhibit 1
Proposed Highway User Revenue Distribution
Fiscal 2018-2025
($ in Millions)
FY 2018 FY 2019 FY 2020 FY 2021
MDOT 85.0% 82.5% 80.0% 77.5%
Baltimore City 8.3% 8.7% 9.2% 9.7%
Counties 5.1% 7.1% 9.0% 10.9%
Municipalities 1.6% 1.7% 1.8% 1.9%
FY 2022 FY 2023 FY 2024 FY 2025
MDOT 75.0% 72.5% 70.0% 70.0%
Baltimore City 10.2% 11.1% 12.1% 12.1%
Counties 12.7% 14.1% 15.4% 15.4%
Municipalities 2.1% 2.3% 2.5% 2.5%
MDOT: Maryland Department of Transportation
Source: Department of Legislative Services

HB 1322/ Page 3
Audits Related to the Use of Highway User Revenues
OLA is expressly authorized to audit any officer or unit of a county or municipality that
received a distribution of highway user revenues in the preceding fiscal year. An audit
must ensure that the local government is using highway user revenues for the purposes
authorized by State law. OLA must be given access to inspect the records, including those
that are confidential, of any officer or unit of a county or municipality.
Department of Budget and Management Local Infrastructure Report
The report required of DBM must include information on the current functional capability,
maintenance level, potential obsolescence, and need for expansion of multiple modes of
infrastructure and identify current and potential sources of revenue that are, or could be,
targeted to address unmet needs for each mode of infrastructure detailed in the report. The
report must include, at a minimum, information regarding each of the following modes of
infrastructure: (1) water and wastewater delivery and retrieval systems; (2) wastewater
treatment facilities; (3) 9-1-1 emergency number response systems; (4) public safety radio
systems; (5) high-speed broadband access; (6) bridges and other transportation arteries;
(7) evacuation resources; (8) school facility maintenance needs; and (9) any other area of
critical infrastructure DBM determines appropriate for a similar evaluation. For each mode
of infrastructure, DBM must seek input from related and specifies entities.
Current Law: TTF is a nonlapsing special fund that provides funding for transportation.
It consists of tax and fee revenues, operating revenues, bond proceeds, and fund transfers.
MDOT issues bonds backed by TTF revenues and invests the TTF fund balance to generate
investment income. The Maryland Transit Administration, Motor Vehicle Administration,
Maryland Port Administration, and Maryland Aviation Administration generate operating
revenues that cover a portion of their operating expenditures. After meeting debt service
requirements, MDOT may use funds in TTF for any lawful purpose related to the exercise
of its rights, powers, duties, and obligations.
Debt Service Requirements and Practices
State law and agency debt practices limit Consolidated Transportation Bond (CTB)
issuances with three criteria: a debt outstanding limit and two coverage tests. The debt
outstanding limit is set in statute at $4.5 billion. The two coverage tests are established in
the department’s bond resolutions and require that annual net income and pledged taxes
from the prior year each equal at least 2.0 times the maximum level of future debt service
payments on all CTBs outstanding and to be issued. The department has adopted a
management practice that requires minimum coverages of 2.5 times maximum future debt
service. The net income coverage test is the ratio of all the prior year’s income (excluding
federal capital, bond proceeds, and third-party reimbursements) minus prior year operating

HB 1322/ Page 4
expenses, debt service payments, deductions for nontransportation agencies, and local
transportation aid to maximum future annual debt service and typically is the limiting
coverage ratio. The pledged taxes coverage test measures annual net revenues from vehicle
excise, motor fuel, rental car sales, and corporate income taxes (excluding refunds and all
statutory deductions) as a ratio of maximum future annual debt service.
If either of these coverage ratios fall below the 2.0 times level, the department is prohibited
under its bond covenants from issuing additional debt until the ratios are once again at the
minimum 2.0 times level.
Highway User Revenues – Distributions and Authorized Purposes
TTF’s GMVRA revenue (commonly known as highway user revenue) must be distributed
to MDOT and local jurisdictions as follows:
90.4% to MDOT;
7.7% to Baltimore City;
1.5% to counties; and
0.4% to municipalities.
A local government entity may only use its share of highway user revenues for authorized
purposes related to transportation infrastructure construction and maintenance. By
January 1 of each year, Baltimore City, each county, and each municipality that received
highway user revenues in the preceding fiscal year must submit a report to the State
Highway Administration (SHA) that shows the actual costs of the preceding fiscal year,
shows the current year budget, accurately identifies costs for specific and authorized
projects, shows funds diverted from the local general fund to pay for authorized projects,
and lists authorized projects that have been delayed due to lack of funding. SHA may not
make a disbursement of highway user revenues to any jurisdiction that has not submitted
this report.
Office of Legislative Audits
Generally, OLA must conduct a fiscal/compliance audit of each unit of the State
government (except for units of the Legislative Branch) at an interval ranging from three
to four years, unless the Legislative Auditor determines, on a case-by-case basis, that more
frequent audits are required. Each agency or program may be audited separately or as part
of a larger organizational unit of State government. OLA has the authority to conduct a
separate investigation of an act or allegation of fraud, waste, or abuse in the obligation,
expenditure, receipt, or use of State resources. OLA also may audit any county officer or
unit that collects State taxes.

HB 1322/ Page 5
Background: For more information regarding transportation aid to local governments and
highway user revenues, please see the Appendix – Highway User Revenues.
To restore highway user revenues to local governments, the Consolidated Transportation
Program (CTP) for fiscal 2017 through 2022 has set aside $100 million in fiscal 2019,
$148 million in fiscal 2020, $198 million in fiscal 2021, and $248 million in fiscal 2022,
for a total of $694 million. The CTP also sets aside $53 million in fiscal 2018; however,
these funds are being distributed to local governments as capital transportation grants, of
which $27.4 million goes to counties, $5.5 million goes to Baltimore City, and
$20.1 million goes to municipalities. Budget bill language specifies that the grants be
distributed to the counties and municipalities using the highway user formula.
State Fiscal Effect:
Maryland Department of Transportation – Highway User Revenues
Altering the distribution formula in the manner required by the bill decreases TTF revenues
available to MDOT by an estimated $98.7 million in fiscal 2018, $146.8 million in
fiscal 2019, $194.7 million in fiscal 2020, $245.3 million in fiscal 2021, and $296.2 million
in fiscal 2022, totaling $981.7 million over the five-year period. Additional distributions
to municipalities due to the minimum distribution established by the bill are not anticipated
to be necessary in any fiscal year, as discussed below in the Local Fiscal Effect section of
this fiscal and policy note.
Additionally, the TTF revenue loss limits MDOT’s ability to issue CTBs in support of its
capital program. MDOT advises that, after taking into account a reduction in bond
issuances to meet its bond coverage ratios, the $981.7 million reduction in highway user
revenues requires it to reduce its capital budget by nearly $1.6 billion. This estimate is
based on MDOT’s current projected revenues and does not take into account any debt
service savings. MDOT advises that this effect may be partially offset because it has
reserved about $747.0 million in revenues over the next five fiscal years for the restoration
of local highway user revenues pending gubernatorial or legislative action.
The Department of Legislative Services (DLS) estimates that the $981.7 million reduction
in highway user revenues available to MDOT over the five-year period requires MDOT to
reduce its bond issuances by approximately $1.1 billion, resulting in an initial reduction of
$2.1 billion in revenues available to MDOT. As MDOT issues less debt under the bill, it
experiences a corresponding reduction in debt service payments. When debt service
savings of $185.0 million are taken into account, the net decrease in MDOT’s capital
budget is $1.9 billion. This estimate reflects MDOT’s reserved $747.0 million for the
restoration of highway user revenues through the capital program because the Governor’s

HB 1322/ Page 6
current proposal is to distribute those revenues through MDOT’s capital budget as capital
transportation grants.
To the extent that a local government does not use its share of the revenues for an
authorized purpose or does not submit its required annual report in future fiscal years, TTF
revenues increase as the local government’s share of highway user revenues reverts to TTF.
However, whether and to what extent this occurs cannot be predicted and is, therefore, not
assumed in this analysis.
Office of Legislative Audits – Audits Relating to the Use of Local Highway User Revenues
OLA advises that, because the bill does not mandate an audit of the counties and
municipalities that receive highway user revenues, it plans to examine the issue during its
periodic fiscal compliance audits of MDOT and SHA. At that point, OLA will determine
whether to investigate specific local governments based on (1) the professional judgment
of the auditor; (2) the amount of revenues in question; and (3) the potential for misuse or
abuse of the revenues. Any subsequent audit needed as a result of OLA’s findings can
likely be handled using existing budgeted resources.
Department of Budget and Management – Local Infrastructure Study
General fund expenditures likely increase significantly for DBM to complete the
infrastructure report required by the bill. DBM does not have the specialization necessary
to examine the many technical aspects of the modes of infrastructure specified by the bill.
Therefore, it likely needs to contract with multiple specialists to assist in the analysis
needed to complete the required report. To reduce costs, and as required by the bill, DBM
plans to request assistance from other State agencies. However, the bill only requires
specified State agencies to provide input to DBM. Thus, it is unclear to what extent other
agencies assist DBM. Accordingly, a reliable estimate of the increase in costs for DBM
cannot be made at this time. DBM advises, however, that costs could exceed $1 million.
DBM also advises, and DLS concurs, that despite the deadline established by the bill to
complete the required report, the actual completion of the report is likely to take
significantly longer than six months. Including information on the current functional
capability, maintenance level, potential obsolescence, and need for expansion of the
specified modes of infrastructure, as required by the bill, involves significant and
time-consuming investigations and collaboration with affected entities. DBM advises that
the completion of the required report could take as long as two years.
Local Fiscal Effect: Altering the GMVRA distribution formula increases local
jurisdictions’ highway user revenues by an estimated $98.7 million in fiscal 2018,
$146.8 million in fiscal 2019, $194.7 million in fiscal 2020, $245.3 million in fiscal 2021,

HB 1322/ Page 7
and $296.2 million in fiscal 2022. The distribution of the increase between Baltimore City,
counties, and municipalities is shown in Exhibit 2. Additional distributions to
municipalities are not necessary because the projected distribution exceeds the bill’s
$26.4 million required minimum distribution in each fiscal year. Specifically,
municipalities are projected to receive $29.3 million in fiscal 2018, $31.6 million in
fiscal 2019, $33.7 million in fiscal 2020, $36.1 million in fiscal 2021, and $40.4 million in
fiscal 2022.
Exhibit 2
Projected Increase in Local Distribution of Highway User Revenues
Fiscal 2018-2022
($ in Millions)
FY 2018 FY 2019 FY 2020 FY 2021 FY 2022
Baltimore City $11.0 $18.6 $28.1 $38.0 $48.1
Counties 65.8 104.0 140.4 178.7 215.4
Municipalities 21.9 24.1 26.2 28.5 32.7
Total $98.7 $146.8 $194.7 $245.3 $296.2
Note: Totals may not sum due to rounding.
Source: Department of Legislative Services
Exhibit 3 shows the increase in highway user revenues distributed to localities and the
total amount of highway user revenues distributed to localities from fiscal 2018 through
2022 under the bill (by county). (The total highway user revenues in this exhibit do not
reflect the fiscal 2018 capital transportation grants for counties, municipalities, and
Baltimore City.)
As noted above, to the extent that a local government does not use its share of the revenues
for an authorized purpose or does not submit its required annual report in future fiscal
years, local revenues decrease as the local government’s share of revenues revert to TTF.
However, whether and to what extent this occurs cannot be predicted, and is, therefore, not
assumed in this analysis.
It is assumed that local government entities are able to provide input to DBM regarding the
local infrastructure report with existing local resources.

HB 1322/ Page 8
Exhibit 3
Local Government Increase and Total – Highway User Revenues
Fiscal 2018-2022
($ in Millions)
FY 2018 FY 2019 FY 2020 FY 2021 FY 2022
Increase Total Increase Total Increase Total Increase Total Increase Total
Allegany $2.2 $3.0 $3.0 $3.8 $3.7 $4.6 $4.5 $5.3 $5.3 $6.2
Anne Arundel 7.9 11.1 12.1 15.3 16.0 19.3 20.2 23.5 24.3 27.7
Baltimore City 11.0 151.7 18.6 161.6 28.1 172.2 38.0 184.4 48.1 196.2
Baltimore 9.9 14.0 15.7 19.9 21.1 25.4 26.9 31.2 32.4 36.8
Calvert 1.8 2.5 2.7 3.4 3.6 4.3 4.5 5.2 5.4 6.2
Caroline 1.3 1.9 1.9 2.5 2.5 3.0 3.1 3.6 3.7 4.2
Carroll 4.0 5.5 5.6 7.2 7.3 8.8 8.9 10.6 10.7 12.3
Cecil 2.2 3.0 3.1 4.0 4.1 4.9 5.0 5.9 6.0 6.9
Charles 2.7 3.7 4.0 5.1 5.3 6.4 6.7 7.8 8.1 9.2
Dorchester 1.5 2.1 2.2 2.8 2.8 3.4 3.5 4.1 4.2 4.8
Frederick 5.7 7.8 7.8 10.0 9.8 12.0 12.0 14.2 14.2 16.5
Garrett 1.6 2.3 2.4 3.1 3.1 3.8 3.9 4.6 4.7 5.4
Harford 4.4 6.2 6.5 8.2 8.4 10.2 10.5 12.3 12.5 14.4
Howard 3.8 5.4 6.0 7.6 8.1 9.8 10.4 12.0 12.5 14.2
Kent 0.8 1.1 1.1 1.4 1.4 1.7 1.8 2.1 2.1 2.4
Montgomery 12.4 17.3 17.9 22.9 23.2 28.1 28.7 33.8 34.3 39.5
Prince George’s 11.7 16.1 16.3 20.8 20.7 25.3 25.3 30.0 30.2 34.9
Queen Anne’s 1.4 2.0 2.2 2.8 2.9 3.5 3.6 4.2 4.4 5.0
St. Mary’s 2.0 2.8 3.1 3.9 4.1 5.0 5.2 6.1 6.3 7.2
Somerset 0.8 1.2 1.2 1.6 1.6 2.0 2.0 2.4 2.4 2.8
Talbot 1.4 1.9 1.9 2.5 2.4 3.0 2.9 3.5 3.5 4.0
Washington 3.5 4.8 4.9 6.2 6.2 7.5 7.5 8.9 9.0 10.4
Wicomico 2.8 3.8 3.8 4.9 4.8 5.9 5.8 6.9 6.9 8.0
Worcester 1.9 2.7 2.7 3.5 3.5 4.2 4.3 5.0 5.1 5.9
Total $98.7 $274.2 $146.8 $325.1 $194.7 $374.4 $245.3 $427.8 $296.2 $480.9
Notes: Totals may not sum due to rounding.
Estimate assumes that highway road miles and vehicle registrations in fiscal 2018 remain constant through fiscal 2022.
Source: Department of Legislative Services

HB 1322/ Page 9
Additional Information
Prior Introductions: None.
Cross File: SB 586 (Senator King, et al.) - Budget and Taxation.
Information Source(s): Maryland Department of Transportation; Department of Budget
and Management; Maryland Association of Counties; Maryland Municipal League;
Baltimore City; Montgomery County; Maryland Department of the Environment;
Maryland Institute for Emergency Medical Services Systems; Department of Public Safety
and Correctional Services; Public School Construction Program; Department of
Legislative Services
Fiscal Note History: First Reader - March 6, 2017
md/mcr
Analysis by: Richard L. Duncan Direct Inquiries to:
(410) 946-5510
(301) 970-5510

HB 1322/ Page 10
Appendix – Highway User Revenues
Transportation Aid to Local Governments
In fiscal 2017, local governments received $177.4 million in State aid from highway user
revenues and $25.0 million for special transportation grants. Exhibit 1 shows the amount
of State aid for local transportation programs in each county, including municipalities and
Baltimore City, in fiscal 2017.
Highway User Revenues – Generally
Since the early 1900s, the State has shared motor vehicle-related revenues with the counties
and Baltimore City. Initially these revenues consisted of vehicle registration fees. In 1927,
when the gasoline tax increased from $0.02 to $0.04 per gallon, the State began sharing
these taxes with local governments. In 1968, the General Assembly approved legislation
that established a formula for apportioning the county and municipal shares of highway
user revenues. The legislation also initiated the sharing of motor vehicle titling taxes with
the subdivisions. Legislation enacted in 1970 created the Maryland Department of
Transportation (MDOT) and a consolidated Transportation Trust Fund (TTF). As provided
by that legislation, the State shares with the counties, Baltimore City, and municipalities
those revenues credited to the Gasoline and Motor Vehicle Revenue Account in TTF, more
commonly referred to as “highway user revenues.” Currently, the revenues dedicated to
the account include all or some portion of the motor vehicle fuel tax, vehicle titling tax,
vehicle registration fees, short-term vehicle rental tax, and State corporate income tax.

HB 1322/ Page 11
Exhibit 1
Transportation Aid Programs
Fiscal 2017
County
Highway User
Revenues
County
Grants
Municipal
Grants
Elderly/
Disabled Paratransit
Per Capita
Aid
Per Capita
Rank
Allegany $846,247 $68,992 $946,170 $141,544 - $28 8
Anne Arundel 3,281,132 427,654 815,824 245,966 $434,969 9 21
Baltimore City 142,300,081 2,000,000 - 379,335 - 233 1
Baltimore 4,179,019 603,016 - 395,836 - 6 24
Calvert 731,936 91,983 242,833 127,003 76,099 14 16
Caroline 537,372 58,112 346,075 120,217 13,333 33 6
Carroll 1,566,587 163,549 1,113,337 151,029 - 18 14
Cecil 866,118 94,409 544,504 134,073 - 16 15
Charles 1,086,188 139,396 308,803 137,609 - 11 19
Dorchester 600,433 64,322 397,539 122,724 50,000 38 3
Frederick 2,182,072 197,292 2,094,250 159,159 - 19 12
Garrett 655,843 77,295 308,881 119,664 - 39 2
Harford 1,761,565 201,844 932,354 170,371 - 12 17
Howard 1,605,565 231,677 - 162,520 430,000 8 23
Kent 307,200 33,022 201,383 120,217 13,333 34 4
Montgomery 4,937,050 539,991 3,070,971 379,107 - 9 22
Prince George’s 4,487,929 430,215 3,871,992 332,819 450,000 11 20
Queen Anne’s 586,661 77,181 133,094 122,064 - 19 13
St. Mary’s 821,725 113,820 84,636 131,054 135,000 12 18
Somerset 337,151 40,729 141,077 117,447 - 25 9
Talbot 537,984 47,317 539,925 120,217 13,334 34 5
Washington 1,365,307 128,092 1,227,574 146,917 - 19 11
Wicomico 1,073,152 95,128 1,063,820 134,508 - 23 10
Worcester 758,771 74,964 614,960 134,508 110,000 33 7
Total $177,413,088 $6,000,000 $19,000,002 $4,305,908 $1,726,068 $35
Note: Highway User Revenues column includes municipal aid.
Source: Department of Legislative Services
HB 1322/ Page 12
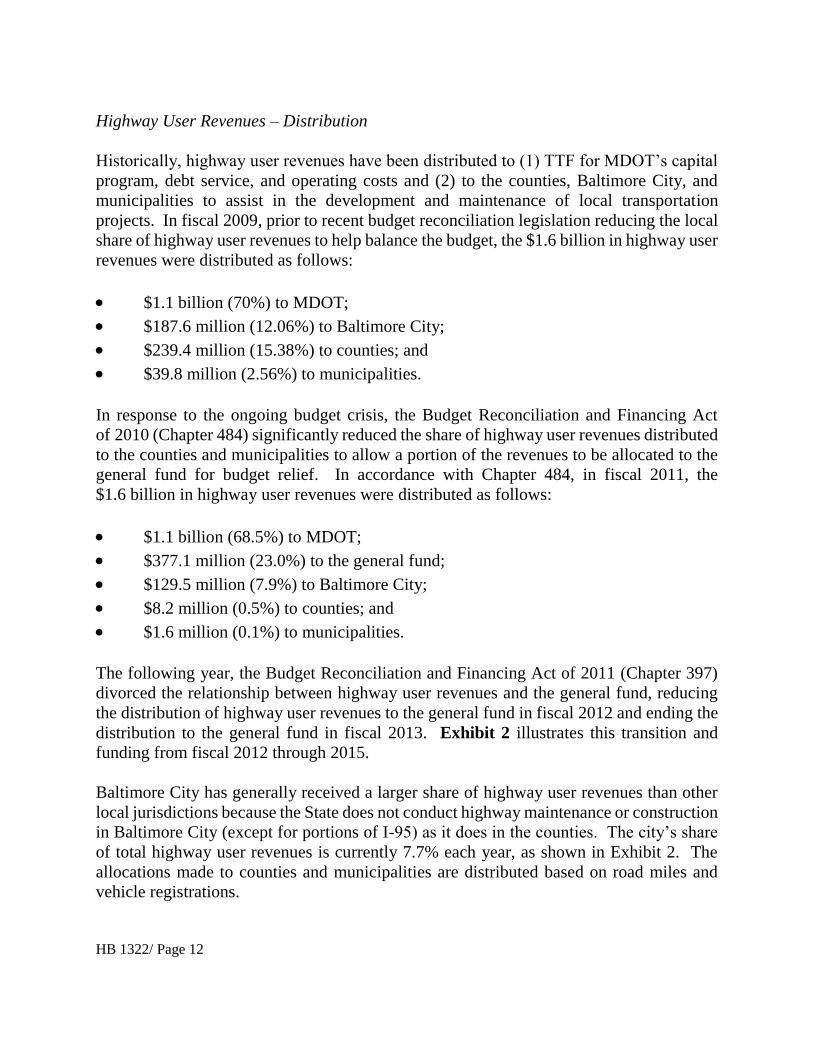
Highway User Revenues – Distribution
Historically, highway user revenues have been distributed to (1) TTF for MDOT’s capital
program, debt service, and operating costs and (2) to the counties, Baltimore City, and
municipalities to assist in the development and maintenance of local transportation
projects. In fiscal 2009, prior to recent budget reconciliation legislation reducing the local
share of highway user revenues to help balance the budget, the $1.6 billion in highway user
revenues were distributed as follows:
$1.1 billion (70%) to MDOT;
$187.6 million (12.06%) to Baltimore City;
$239.4 million (15.38%) to counties; and
$39.8 million (2.56%) to municipalities.
In response to the ongoing budget crisis, the Budget Reconciliation and Financing Act
of 2010 (Chapter 484) significantly reduced the share of highway user revenues distributed
to the counties and municipalities to allow a portion of the revenues to be allocated to the
general fund for budget relief. In accordance with Chapter 484, in fiscal 2011, the
$1.6 billion in highway user revenues were distributed as follows:
$1.1 billion (68.5%) to MDOT;
$377.1 million (23.0%) to the general fund;
$129.5 million (7.9%) to Baltimore City;
$8.2 million (0.5%) to counties; and
$1.6 million (0.1%) to municipalities.
The following year, the Budget Reconciliation and Financing Act of 2011 (Chapter 397)
divorced the relationship between highway user revenues and the general fund, reducing
the distribution of highway user revenues to the general fund in fiscal 2012 and ending the
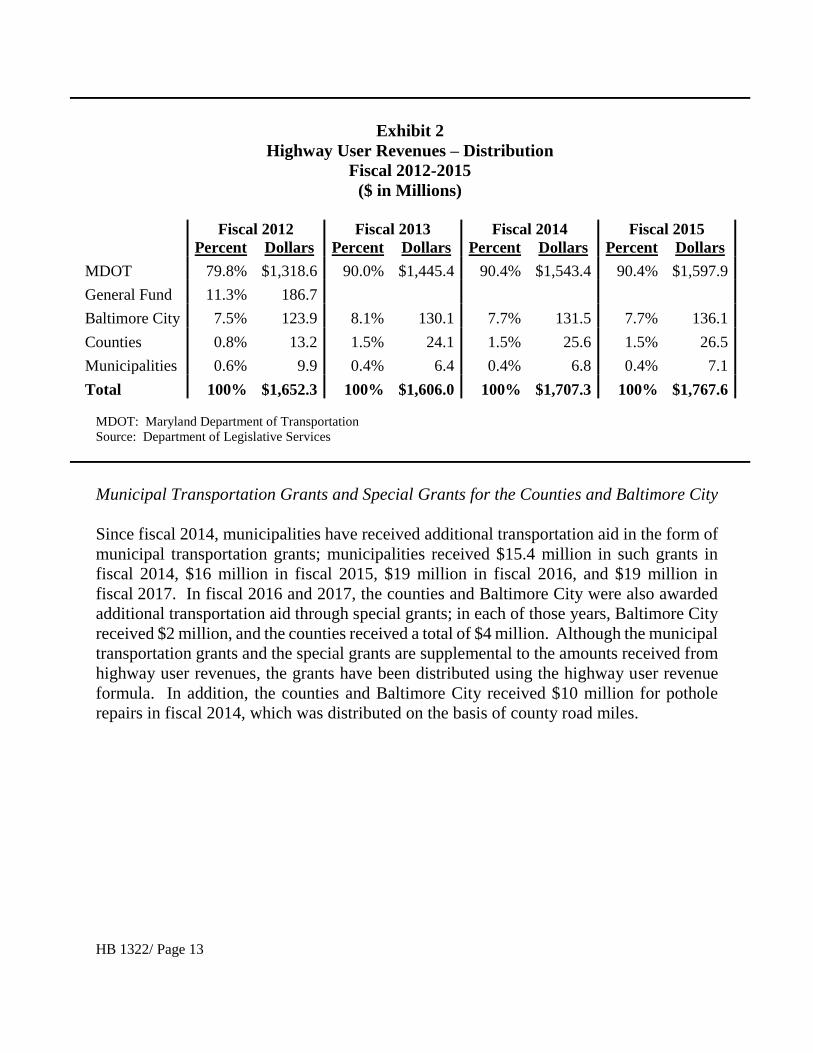
distribution to the general fund in fiscal 2013. Exhibit 2 illustrates this transition and
funding from fiscal 2012 through 2015.
Baltimore City has generally received a larger share of highway user revenues than other
local jurisdictions because the State does not conduct highway maintenance or construction
in Baltimore City (except for portions of I-95) as it does in the counties. The city’s share
of total highway user revenues is currently 7.7% each year, as shown in Exhibit 2. The
allocations made to counties and municipalities are distributed based on road miles and
vehicle registrations.
HB 1322/ Page 13
Exhibit 2
Highway User Revenues – Distribution
Fiscal 2012-2015
($ in Millions)
Fiscal 2012 Fiscal 2013 Fiscal 2014 Fiscal 2015
Percent Dollars Percent Dollars Percent Dollars Percent Dollars
MDOT 79.8% $1,318.6 90.0% $1,445.4 90.4% $1,543.4 90.4% $1,597.9
General Fund 11.3% 186.7
Baltimore City 7.5% 123.9 8.1% 130.1 7.7% 131.5 7.7% 136.1
Counties 0.8% 13.2 1.5% 24.1 1.5% 25.6 1.5% 26.5
Municipalities 0.6% 9.9 0.4% 6.4 0.4% 6.8 0.4% 7.1
Total 100% $1,652.3 100% $1,606.0 100% $1,707.3 100% $1,767.6
MDOT: Maryland Department of Transportation
Source: Department of Legislative Services
Municipal Transportation Grants and Special Grants for the Counties and Baltimore City
Since fiscal 2014, municipalities have received additional transportation aid in the form of
municipal transportation grants; municipalities received $15.4 million in such grants in
fiscal 2014, $16 million in fiscal 2015, $19 million in fiscal 2016, and $19 million in
fiscal 2017. In fiscal 2016 and 2017, the counties and Baltimore City were also awarded
additional transportation aid through special grants; in each of those years, Baltimore City
received $2 million, and the counties received a total of $4 million. Although the municipal
transportation grants and the special grants are supplemental to the amounts received from
highway user revenues, the grants have been distributed using the highway user revenue
formula. In addition, the counties and Baltimore City received $10 million for pothole
repairs in fiscal 2014, which was distributed on the basis of county road miles.