
HAZARD AND SAFETY EVALUATION OF GASIFIER ...1039263/...i Dept. of Energy Technology Div. of Heat and...
81
HAZARD AND SAFETY EVALUATION OF GASIFIER INSTALLATIONS IN UGANDA Hillary Kasedde 840920-A293 Submitted in partial fulfillment of the requirements for the award of the degree of Master of Science in Mechanical Engineering with a specialization in Sustainable Energy Engineering MSc Thesis Report 2009 Department of Energy Technology Division of Heat and Power Technology Royal Institute of Technology Stockholm, Sweden
-
Upload
vuonghuong -
Category
Documents
-
view
215 -
download
2
Transcript of HAZARD AND SAFETY EVALUATION OF GASIFIER ...1039263/...i Dept. of Energy Technology Div. of Heat and...

HAZARD AND SAFETY EVALUATION OF GASIFIER
INSTALLATIONS IN UGANDA
Hillary Kasedde
840920-A293
Submitted in partial fulfillment of the requirements for the award of the degree of Master of Science in Mechanical Engineering with a specialization in
Sustainable Energy Engineering
MSc Thesis Report
2009
Department of Energy Technology
Division of Heat and Power Technology
Royal Institute of Technology
Stockholm, Sweden

i
Dept. of Energy Technology Div. of Heat and Power Technology
Title: Hazard and Safety Evaluation of Gasifier installations in Uganda
Author: Hillary Kasedde Report nr: 1 Project: Master of Science Final Thesis Pages: Drawings: Supervisor at KTH: Date: Appendices: 5 Overall responsible at KTH: Torsten Fransson
Approved at KTH by: Torsten Fransson Signature: Overall responsible at industry: Arineitwe Ndemere Joseph
Approved by industrial partners: Adam Sebbit Signature:
ABSTRACT
Biomass gasification is a sustainable thermal-chemical conversion technology that can be energy efficient and environmentally friendly hence bearing a great potential for sustainable development in Uganda. However, due to a number of reasons such as lack of awareness, knowledge and judgment of the hazards and safety risks associated with the technology, its large scale commercialization has not been achieved. To address the above problem, a study was conducted to evaluate the hazards and safety aspects at three different biomass gasification installations in Uganda. They include installations at Muzizi Tea estate, Kyambogo University and Makerere University. Basing on system evaluation, hazard identification and subsequent risk assessment, it was found out that the toxic hazards such as pollutants CO and PM leakages pose great health risks to personnel within the plants. In addition, fire, environmental and explosion hazards pose similar threats. It was observed that the concentration of CO within the installations was above the Threshold Limit Value (TLV) of 50ppm for a normal working day which was also reported for the PM limits. Average CO concentrations of 126ppm, 85ppm, 64ppm were found at Kyambogo, Muzizi and Makerere plants respectively. Mean PM concentrations of 200µg/m3, 540µg/m3, 64µg/m3 were measured at Muzizi, Kyambogo and Makerere installations, respectively. The average engine exhaust CO emissions from Muzizi and Kyambogo plants were found to be at 2900ppm and 1730ppm, respectively, which were within the acceptable limits. It was also discovered that there is limited knowledge from the stakeholders concerning the Health, Safety and Environmental (HSE) aspects of gasification technology. There was limited or no documentation concerning description of safety systems and safety engineering concepts, plant technical description, gaseous, liquid and solid emissions of the plants under consideration. For this reason additional preventive and mitigation measures have been proposed to minimize the frequency, exposure and effects of the identified hazardous events at the installations. It has also been recommended that the proposed measures for risk reduction be implemented at the installations in order to ensure reduction in the risks posed by the hazards. Furthermore, existing international HSE standards and limits should be emphasized by stakeholders to promote future commercialization of biomass gasification technology in Uganda.

ii
ACKNOWLEDGEMENTS
To all those who have given me help and encouragement throughout the accomplishment of this Thesis project.
Firstly, I wish to express my sincere gratitude to all the staff of the Department of Energy Technology in particular the Division of Heat and Power Technology at KTH who have made it possible for me to acquire all the technical knowledge and skills used in accomplishing this work. Furthermore, I wish to extend my appreciation to the Department of Mechanical Engineering, Makerere University which has provided me with all the necessary logistical needs as a DSEE student in Uganda.
Secondly, I would like to thank the DSEE Program Director, Assoc. Prof Andrew Martin and the DSEE coordinators Eng. Dr Adam Sebbit and Assoc. Prof Mackay Okure who have tirelessly worked to ensure that this thesis is done successfully. Special thanks go to my supervisor/PhD student, Mr. Joseph Ndemere Arineitwe and Prof. Bjorn Kjellström for their assistance and guidance which has made my work a success.
Thirdly, I am grateful to the management of James Finlay Tea Estate Muzizi, Kyambogo University and Ministry of Energy and Mineral Development of Uganda for the assistance they gave me in allowing me to conduct my experiments at their gasifier installations.
I am also thankful to all members of my family most especially my mum for her prayers, morale and support you have given me during my studies. I admit that I will always love you!
Heartfelt thanks go to my fellow DSEE classmates in Uganda. I am greatly thankful, only that words cannot express my feelings.

iii
TABLE OF CONTENTS
ABSTRACT ......................................................................................................................... i ACKNOWLEDGEMENTS .................................................................................................. ii NOMENCLATURE ........................................................................................................... vii CHAPTER ONE: INTRODUCTION .................................................................................... 1
1.0 Background ........................................................................................................... 1 1.1 Problem Statement ............................................................................................... 1 1.2 Objectives ............................................................................................................. 2 1.3 Scope .................................................................................................................... 2 1.4 Justification of the study ........................................................................................ 2
CHAPTER TWO: LITERATURE REVIEW ......................................................................... 3 2.0 Introduction ........................................................................................................... 3 2.1 Health, Safety and Environment in biomass gasification ....................................... 3 2.2 Environmental Aspects of gasification operations ................................................. 4 2.3 Hazards of Gasifier Operation ............................................................................... 6 2.4 Hazard and Risk management in gasification ....................................................... 9 2.5 Process Steps in hazard or risk management ....................................................... 9 2.6 Summary of the risk assessment process ........................................................... 11
CHAPTER THREE: METHODOLOGY ............................................................................. 12 3.1 Identification of installations ................................................................................ 12 3.2 Data collection and analysis methods ................................................................. 12
3.2.1 Interviews, observations and checklist ......................................................... 12 3.2.2 Experiments and measurement procedures ................................................. 13 3.2.3 CO measurements ....................................................................................... 13 3.2.4 PM measurements ....................................................................................... 13 3.2.5 Gas engine stack emissions ......................................................................... 14 3.2.6 Hot surface temperatures ............................................................................. 14
3.3 Risk assessment ................................................................................................. 14 3.3.1 Risk assessment procedure ............................................................................. 15
3.3.2 Calculating degree of risk ............................................................................. 15 CHAPTER FOUR: RESULTS AND DISCUSSIONS ........................................................ 17
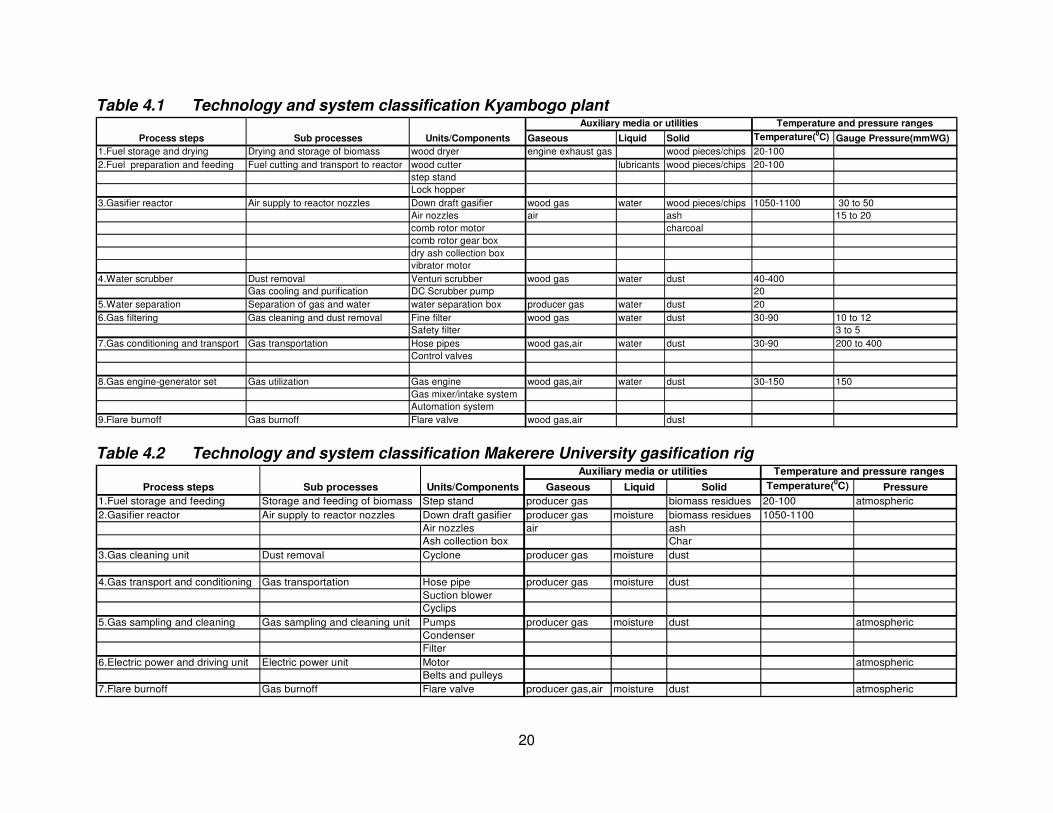
4.1 Technology description of the installations .......................................................... 17 4.1.1 Muzizi Tea estate gasification plant .............................................................. 17 4.1.2 Kyambogo gasification installation ................................................................ 18 4.1.3 Makerere University gasification rig .............................................................. 18
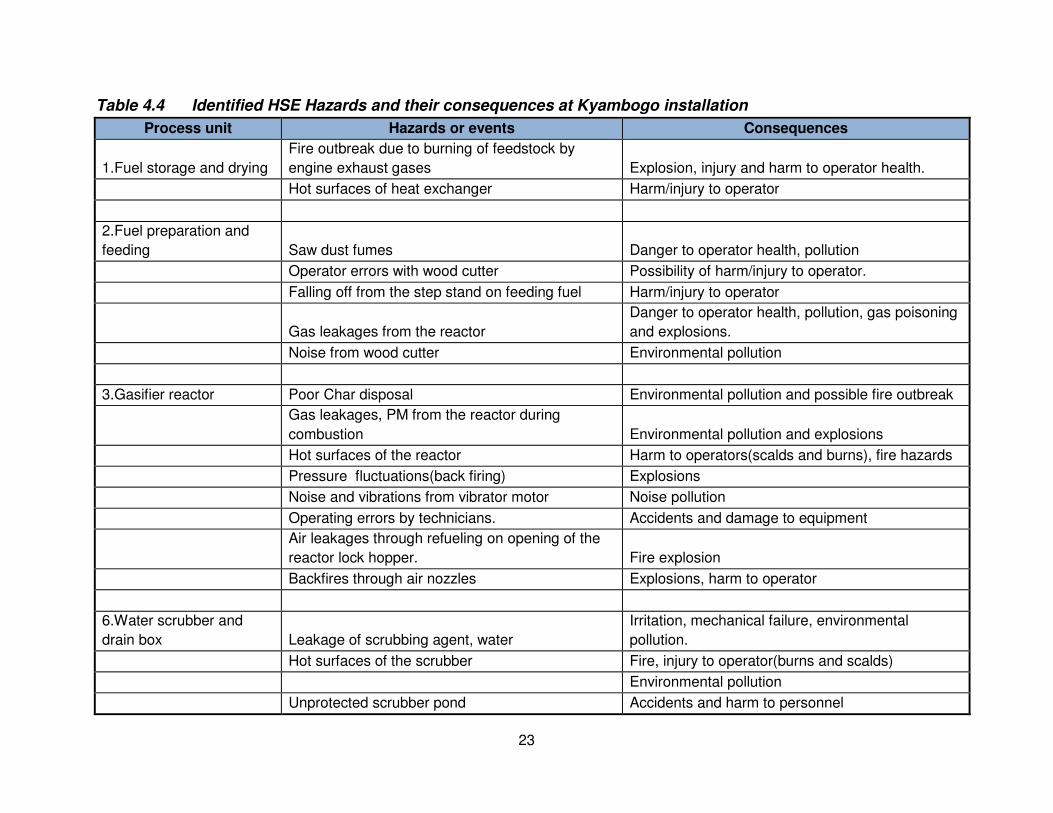
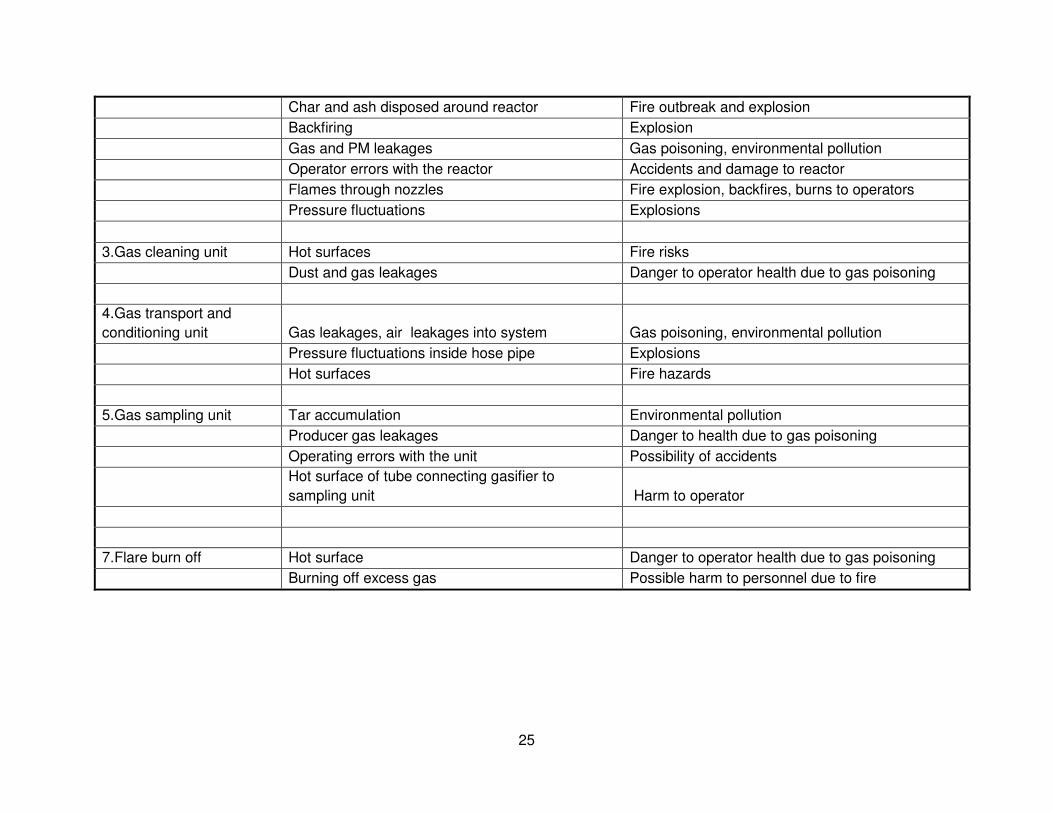
4.2 HSE Hazards identification ................................................................................. 21 4.2.1 Hazards identified at the gasifier installations ............................................... 21
4.4 Review of existing hazard control measures at the installations ......................... 26 4.4.1 Muzizi Tea estate installation ........................................................................ 26 4.4.2 Kyambogo University installation .................................................................. 27 4.4.3 Faculty of Technology rig .............................................................................. 27
4.5 Review of available documentation at the installations ....................................... 28 4.6 Environmental Health hazards assessment ........................................................ 29
4.6.1 CO exposure within Muzizi plant .................................................................. 29 4.6.2 Engine stack emissions at Muzizi plant ........................................................ 31 4.6.3 Particulate Matter exposure inside Muzizi plant ............................................ 33

iv
4.6.4 CO exposure inside Kyambogo installation .................................................. 35 4.6.5 Engine stack emissions from Kyambogo installation .................................... 36 4.6.7 PM concentration inside the Kyambogo installation ..................................... 37 4.6.8 CO exposure at Makerere University gasifier ............................................... 38 4.6.9 PM concentration measured at the Makerere installation ............................. 39
4.7 Explosion hazards ............................................................................................... 39 4.8 Investigation of fire hazards ................................................................................ 40
4.9 Water pollution ................................................................................................. 41 4.10 Safety Risk Assessment of the installations ........................................................ 42
4.10.1 Risk model .................................................................................................... 42 4.10.2 Frequency Rating Table ................................................................................... 42
4.10.3 Consequence rating Table ............................................................................ 42 4.10.4 Risk category ................................................................................................ 43 4.10.5 Hazard Rating Number ................................................................................. 43 4.10.6 Description of risk levels ............................................................................... 44
4.11 Risk Assessment results ..................................................................................... 44 4.11.2 Risk assessment of Kyambogo gasifier plant ............................................... 46
4.12 Summary of Risk Assessment Results ............................................................... 50 4.13 Comparison of HSE practices at the installations ................................................ 51
CHAPTER FIVE: CONCLUSION AND RECOMMENDATIONS ....................................... 52 5.0 Conclusion .............................................................................................................. 52 5.1 Recommendations .............................................................................................. 52
5.1.1 Muzizi gasifier installation ............................................................................. 53 5.1.2 Makerere University gasifier rig .................................................................... 54 5.1.3 Kyambogo Gasifier installation ..................................................................... 54 5.1.4 Stakeholders and Government ..................................................................... 54
REFERENCES ................................................................................................................. 56 APPENDICES .................................................................................................................. 59
APPENDIX A: LAYOUT OF THE GASIFIER INSTALLATIONS ................................... 59 APPENDIX B: EXPERIMENTAL RESULTS ................................................................. 62 APPENDIX C: GASIFIER PLANT DESCRIPTION QUESTIONNAIRE ......................... 66 APPENDIX D: HAZARD IDENTIFICATION FORM ...................................................... 69 APPENDIX E: SAMPLING SITES INSIDE THE INSTALLATIONS .............................. 70

v
LIST OF FIGURES
Figure 3.1 Procedures for risk assessment ................................................................... 11 Figure 4.0 CO Concentration recorded within the Machine hall at Muzizi plant ............. 30 Figure 4.1 Stack emissions of producer gas engine at Muzizi plant for first monitoring period on 19/05/2009 from 8.45pm to 9.30pm. ................................................................ 31 Figure 4.2 Stack emissions of producer gas engine at Muzizi plant for second monitoring period on 20/05/2009 from 3.25pm to 4.15pm. ............................................... 31 Figure 4.3 Stack emissions of producer gas engine at Muzizi plant for third monitoring period on 20/05/2009 from 7.00pm to 8.00pm. ................................................................ 32 Figure 4.4 Air sampling for PM concentration in the fuel preparation area at Muzizi on 20/05/2009………………………………………………………………………………………..33 Figure 4.5 Air sampling for PM concentration inside Muzizi machine hall housing the reactor and engine-generator set on 20/05/2009 ............................................................. 34 Figure 4.6 CO concentration levels recorded inside Muzizi plant at the engine-generator and reactor side respectively. ..…………………………………………………………………35 Figure 4.7 Stack emissions of gasifier engine at Kyambogo plant for third monitoring period on 18/06/2009 from 10.00 to 10.45am .................................................................. 36 Figure 4.8 Stack emissions of gasifier engine at Kyambogo plant for third monitoring period on 18/06/2009 from 11.00 to 11.55am .................................................................. 36 Figure 4.9 Air sampling for PM concentration inside the Kyambogo plant building housing the reactor and engine-generator set on 18/06/2009 .......................................... 37 Figure 4.10 CO concentration levels inside Faculty of Technology installation. ........... 38 Figure 4.11 Air sampling for PM concentration inside the Faculty of Technology gasifier installation on the 18/06/2009 .......................................................................................... 39 Figure 4.12 Average recorded operating temperature and pressure over Muzizi plant 40 Figure 4.13 Surface temperatures of the reactor and cyclone at Muzizi plant. ............. 41 Figure 4.14 Risk quantification and evaluation matrix .................................................. 43 Figure A1 Flow diagram of Muzizi Tea estate Power plant ........................................... 59 Figure A2 Flow diagram of Kyambogo University gasifier plant .................................... 60 Figure A3 Flow diagram of Faculty of Technology, Makerere university Gasifier rig ..... 61 Figure E1 Fuel preparation area inside Muzizi installation. ........................................... 70 Figure E2 Inside the machine hall with the reactor and gas filter line at Muzizi plant. ... 70 Figure E3 Engine-generator side inside machine hall at Muzizi plant. .......................... 71 Figure E4 Reactor with manometers inside kyambogo plant ....................................... 71 Figure E5 Engine generator set inside Kyambogo plant ............................................... 72 Figure E6 Scrubber pond at Kyambogo plant ............................................................... 72 Figure E7 Reactor and wooden step stand at Faculty of Technology rig ...................... 73 Figure E8 Agricultural residues inside installation at Makerere .................................... 73
vi
LIST OF TABLES
Table 2.0 Environmental Aspects of Gasifier systems [Bridgewater et al., 1998] ............... 4 Table 2.1 Health effects of concentration of CO in the atmosphere [Fierro et Al, 2001] ..... 8 Table 4.0 Technology and system classification Muzizi Tea estate plant......................... 19 Table 4.1 Technology and system classification Kyambogo plant ................................... 20 Table 4.2 Technology and system classification Makerere University gasification rig ...... 20 Table 4.3 Identified HSE Hazards and their consequences at Muzizi installation ............ 21 Table 4.4 Identified HSE Hazards and their consequences at Kyambogo installation ..... 23 Table 4.5 Identified HSE Hazards and their consequences at Makerere University rig ... 24 Table 4.6 Hazard likelihood ranking ................................................................................. 42 Table 4.7 Hazard consequence/severity rating [IEE, 2008] .............................................. 43 Table 4.8 Hazard rating and interpretation ....................................................................... 43 Table 4.9 Risk Rating Analysis results Muzizi Tea estate plant ....................................... 44 Table 4.10 Summary of the unacceptable hazardous events at Muzizi............................ 46 Table 4.11 Risk Rating Analysis results Kyambogo University plant ................................ 46 Table 4.12 Summary of the unacceptable hazardous events at Kyambogo ..................... 48 Table 4.13 Risk Rating Analysis results Makerere University installation......................... 48 Table 4.14 Unacceptable hazardous events at Makerere University rig ........................... 49 Table B1 Measured CO concentration (ppm) in the Muzizi installation ............................ 62 Table B2 Engine stack emissions monitoring period one at Muzizi Tea estate plant ....... 62 Table B3 Engine stack emissions monitoring period one at Muzizi Tea estate plant ....... 62 Table B4 Engine stack emissions monitoring period three at Muzizi tea estate plant ...... 63 Table B5 Gasifier/reactor operating temperatures and pressures over Muzizi Tea estate plant……………………… ................................................................................................. 63 Table B6 Operating Temperatures of Cyclone at Muzizi Tea estate plant ....................... 63 Table B7 Measured CO concentration in the Kyambogo plant machine hall .................... 64 Table B8 Engine stack emissions over the course of the first test at Kyambogo plant ..... 64 Table B9 Engine stack emissions over the course of the second test at Kyambogo plant……………………. .................................................................................................... 65 Table B10 Measured CO concentration at Faculty of Technology gasifier ....................... 65

vii
NOMENCLATURE
ALARP As Low as Reasonably Practical ATTAR Advanced Technology Teaching and Research CO Carbon monoxide COHb Carboxyhaemoglobin CO2 Carbon dioxide DC Direct Current FAO Food and Agricultural Organization HAZID Hazard Identification HFO Heavy Fuel Oil HSE Health, Safety and Environment IAP Indoor Air Pollution IEA International Energy Agency IEC International Electro technical Commission IEE Intelligent Energy Europe kW Kilowatts LEL Lower Explosion Limit MEMD Ministry of Energy and Mineral Development mg/Nm3 milligrams per normal cubic meter NAAQS National Ambient Air Quality Standards NOx Nitrous Oxide OHS Occupational Health and Safety O2 Oxygen PM Particulate Matter PPE Personal Protective Equipment ppm parts per million STT Safe Touch Temperatures SOx Sulphur Oxide TLV Threshold Limit Value UEL Upper Explosion Limit µg/m3 micrograms per cubic meter UHC Unburned Hydrocarbons WHO World Health Organization

1
CHAPTER ONE: INTRODUCTION
1.0 Background
Gasification is a promising thermal-conversion conversion technology with a potential for the development and enhancement of future sustainable energy systems in Uganda. Such energy systems can be efficient, safe in design as well as environmentally friendly thus leading to the increased share of renewable energy for heating, electricity, transport fuels and other applications. Currently, there are few biomass gasifier installations in Uganda. The installations are at Makerere University, Muzizi Tea estate, Ankole Tea estate, Forestry College Nabyeya, Kyambogo University and Kings College Budo. This local development of biomass utilization in these areas has the potential to promote economic development as well as conservation of the natural environment, a one step towards meeting the global energy agenda of ensuring sustainability. Today, the possibility for the large scale commercialization of biomass gasification in Uganda exists though its large scale introduction is hampered by various reasons. Among these, leading gasification experts have recognized Health, Safety and Environmental (HSE) issues as a major obstacle in the development of the technology globally and Uganda at large [IEE, 2008]. Furthermore, awareness on the HSE issues associated with the technology has become a barrier because several key stakeholders for its implementation are not much familiar with it and cannot judge the associated HSE risks. Biomass gasification plants produce solid, liquid and gaseous wastes, which, if not adequately controlled, could lead to detrimental impacts on the environment. There are no environmental hazards caused by ashes since they can be safely disposed. However ashes could lead to potential fire hazards when they are disposed when the gasifier unit has not cooled down. Gaseous emissions from producer gas engines are considered acceptable compared to engines running on conventional fuels such as gasoline and diesel [Turare, 1998]. Liquid effluent and condensate from producer gas cleaning can be highly toxic and untreated disposal of such effluent can lead to serious environmental effects [IEA Bioenergy, 2005]. On the health and safety issues, operation of biomass gasifiers may result in toxic gaseous emissions (i.e carbon monoxide), fire and explosion hazards and toxic liquid effluent. With regard to the numerous hazards and health and safety risks at the gasifier installations, there was need for an investigation into the HSE issues in order to establish procedures meant to assess and improve the operation, safety and reliability of the targeted biomass gasification plants in Uganda.
1.1 Problem Statement
The development of the biomass gasification technology in Uganda is being hindered by numerous factors ranging from technical to non-technical. Among these, is lack of

2
knowledge and understanding of the potential health, safety and environmental risks and aspects associated with the construction, operation and maintenance of the biomass gasifiers. In addition, documentation regarding the HSE aspects of the technology in Uganda is also unavailable. This situation has been brought about by the lack of awareness and judgment of the potential hazards arising as a result of these plants. Examples of these hazards are: explosions, fires, toxic gas (such as carbon monoxide), liquid leakages and operator’s failures which pose a big threat to not only the environment but to the human beings operating the gasification plants. Furthermore, there is limited knowledge on how to assess the HSE risks associated with the plants and measures on how to minimize them. Therefore, an evaluation of the HSE issues associated with the gasification plants through conduction of a risk assessment would help in devising appropriate measures aimed at reducing the risks from such hazardous events at the installations under consideration. 1.2 Objectives The main objective of the study was to conduct a hazard and safety evaluation of biomass gasification installations in Uganda. The specific objectives of the research were to:
• Establish the technological description and classification of the installations. • Identify the potential hazards associated with the gasifier installations (HAZID). • Perform a systematic risk analysis and assessment at the installations. • Propose measures aimed at minimizing risks at the gasification plants.
1.3 Scope
The study was limited to the evaluation of the operational hazards and safety risks at the Makerere University, Muzizi Tea estate, and Kyambogo University gasifier installations. 1.4 Justification of the study
Several benefits will be realized in that it will raise awareness levels of communities, operators of gasifiers and public authorities on the HSE issues associated with the operation of the plants. In addition, the environmental impacts of gasifier installations such as accident hazards, waste waters among others will be assessed in a bid to promote good environmental practices at the installations. Further more, the occupational health and safety aspects that are always neglected will be assessed thereby establishing procedures meant to mitigate and prevent risks in gasifier plants in Uganda.

3
CHAPTER TWO: LITERATURE REVIEW
2.0 Introduction Gasification is a thermal-chemical process which converts biomass materials into gaseous component. The result of gasification is the producer gas, containing carbon monoxide, hydrogen, methane and some other inert gases. Mixed with air, the producer gas can be used in gasoline or diesel engines with little modifications. The technology has existed for over the last 100 years, and was a very important technology for various stationary applications in the early decades of the 20th century [Rambush, 1923]. Furthermore, the technology was important for mobile applications as well as during World War 2 with almost a million vehicles being operated by gasifiers [Knoef, 2005]. In the last 20 years, there has been renewed interest world wide with many instances of substantial demonstration and commercial scale plants [Turare, 1998]. In particular, the last few years have seen a major resurgence of interest in biomass gasification processes mostly due to environmental and political pressures required of CO2 mitigation measures. Very few processes have yet proved economically viable, although the technology has progressed steadily. There is sufficient expertise and knowledge now available to have a high level of confidence in modern gasification processes. The recent interest for environmental reasons has caused many organizations that have the resources to thoroughly develop and market suitable technologies that meet these environmental requirements. The result has been consolidation of interest at an industrial level and substantial speculative investment in these technologies of the future [Turare, 1998]. 2.1 Health, Safety and Environment in biomass gasification Gasification plant operation results in a number of occupational health and safety hazards unless adequate and effective preventive measures are emphasized continuously during the operation of the plant. A biomass gasification system is comprised of:
• Fuel storage, handling and feeding system; • The gasifier reactor, gas cooling and cleaning equipment; • Utilization of the gas.
Since Biomass itself is almost sulfur free, the gasification process will not produce any SOx emissions [Chang, 2009]. However, fuels such as diesel and HFO contain a considerable amount of sulfur. HFO could have as much as 4% sulfur and therefore requires special additional treatment to neutralize these emissions. Similarly gasification of biomass produces very low concentrations of NOx emissions and therefore leads to low emissions in the combustion engines. However, some of the nitrogen may appear in forms that easily react to NOx during combustion. Each part of the gasification plant creates specific occupational, health and safety hazards [Chang, 2009].

4
The Table 2.0 below gives an overview of the major environmental aspects and hazards associated with the operation of the biomass gasification plant. Table 2.0 Environmental Aspects of Gasifier systems [Bridgewater et al., 1998]
Process activity Fuel preparation
Feeding system
Gasifier reactor Gas cleaning
Gas utilization
Environmental concerns
Dust
Noise
Odour
Waste water
Tar
Fly ash
exhaust gases
Hazards
Fire
Dust explosion
Mechanical hazard
Gas poisoning
Skin burns
Gas explosion
2.2 Environmental Aspects of gasification operations
2.2.1 Dust Dust is generated during feedstock or fuel preparation, storage and handling; feeding and fly ash removal by particulate collection equipment. Solid materials handling is a source of airborne particles, especially when the solids are dry and friable. Dust generation creates several problems such as:
• Airborne or entrained dust from explosive mixtures with air in which a primary explosion can render the dust airborne causing secondary explosions which can be devastating;
• Dust inhalation is a potential source of lung damage; • Eye and skin irritation may occur; • Layers of combustible dust could cause smells, or smoulder and ignite;
5
• Dust settlement on all exposed horizontal surfaces lead to safety problems for personnel in routine operations, as well as increased maintenance and aesthetic detraction;
• Increased friction and wear of mechanical equipment caused by dust deposition increases costs and reduces reliability which in turn increases the potential of accidents.
Preventive measures include:
• Minimization of solids handling and avoidance of rough handling to minimize attrition of fuel particles and suspension of dust;
• Complete enclosure of all solids handling, particularly conveying equipment at the discharge points;
• Installation of suction hoods and gas cleaning equipment to control dust sources, for example mills and screens;
• Maintenance of an under-pressure in enclosed environments to prevent the spreading of dust into adjacent premises by use of a suitable gas cleaning equipment.
From an occupational health viewpoint, dust particles may be classified by [Bridgewater et al., 1998]:
• Size whereby particles larger than 0.005 mm are arrested by wet hairs while those smaller than 0.0002 mm do not settle in the lungs and are breathed out.
• Shape and composition where by some materials are known to cause lung damage for example asbestos and silica. However these are not a concern for the particles formed from biomass.
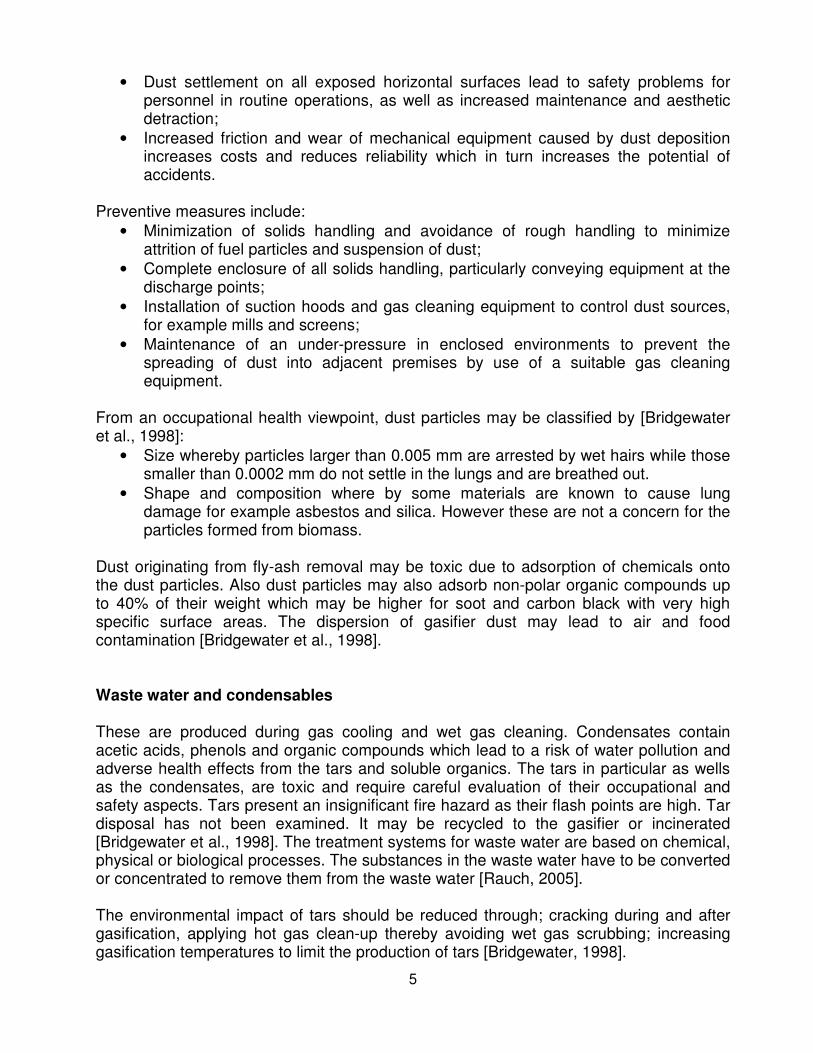
Dust originating from fly-ash removal may be toxic due to adsorption of chemicals onto the dust particles. Also dust particles may also adsorb non-polar organic compounds up to 40% of their weight which may be higher for soot and carbon black with very high specific surface areas. The dispersion of gasifier dust may lead to air and food contamination [Bridgewater et al., 1998]. Waste water and condensables These are produced during gas cooling and wet gas cleaning. Condensates contain acetic acids, phenols and organic compounds which lead to a risk of water pollution and adverse health effects from the tars and soluble organics. The tars in particular as wells as the condensates, are toxic and require careful evaluation of their occupational and safety aspects. Tars present an insignificant fire hazard as their flash points are high. Tar disposal has not been examined. It may be recycled to the gasifier or incinerated [Bridgewater et al., 1998]. The treatment systems for waste water are based on chemical, physical or biological processes. The substances in the waste water have to be converted or concentrated to remove them from the waste water [Rauch, 2005]. The environmental impact of tars should be reduced through; cracking during and after gasification, applying hot gas clean-up thereby avoiding wet gas scrubbing; increasing gasification temperatures to limit the production of tars [Bridgewater, 1998].

6
Fly ash and char There is a risk of fire that dictates that fly ash and char should be stored moist. Disposal of this wetted mixture presents its own environmental problems. The solids need to be separated from the water in a water treatment facility. Extracted water will be contaminated and may require further treatment before discharge. Odour problems Odours may arise because of:
• The degradation of organic matter(for example in refuse or sewage gasification); • The occurrence of even minute gas leaks; • The handling and storage of tar, wastewater, fly ash and other by-products.
Wood tar has a strong, characteristic and persistent odour, even in minute concentrations. When sulphur or nitrogen containing feedstock are used, the producer gas also contains odorous gases such as Hydrogen Sulphide. The tar and wastewater may be contaminated by even more strongly smelling organic sulphur and nitrogen compounds although this is unlikely to be a problem with biomass derived products due to very low levels of sulphur and nitrogen [Bridgewater et al., 1998]. Noise Noise is produced whenever a mechanical part or an engine or motor is in operation. Particular plant areas where noise levels are likely to be significant are:
• Reception storage and handling equipment; • Fuel preparation; • The feeding system; • The compressors; • The gas turbine or engine.
The effects on humans of prolonged exposure to noise are well documented. Adequate measures must be taken to minimize noise for example by use of sound and absorbent materials between supports and acoustic enclosure. Operators are also required to be provided with ear protection plugs. 2.3 Hazards of Gasifier Operation
A hazard is a source of potential harm to people or a situation with potential to cause injury or loss to plant, property or equipment. Hazard identification is the process of identifying all situations or events that could give rise to injury, illness or damage to plant and property [La Trobe University, 2001]. There are a number of hazards within operation of gasifiers.

7
Combustible gases and vapours A flammable gas is combustible only within a certain range of concentrations; bounded by the LEL and the UEL which differs from gas to gas based on the volume content. For example for methane, for example for methane, the LEL and UEL in air are 5.0% and 15.0% by volume respectively [Knoef, 2005]. Below the LEL, the mixture is too lean to sustain combustion. Above the UEL, the reaction stops because of a deficiency in oxygen. In both cases the generation of heat becomes too slow to give rise to the characteristic acceleration rates, which marks the start of an explosion. The range between the LEL and UEL values depend on the reactivity of the flammable compound or mixture. Combustible dusts Combustible solids such as wood, flour and coal dust when as very small particles can also form explosive mixtures with air within certain concentration limits. These boundaries usually range from a LEL of 20 to 50g/m3 and a UEL of 2 to 6g/m3 [Knoef, 2005]. Fire risks The main fire risks in gasifier systems are associated with:
• Fuel storage; • Combustible dusts formed in fuel preparation; • Fuel drying(in forced draft conditions a fire is likely to expand quickly); • Ignition procedure especially for the moving bed gasifiers; • Hot surfaces( gasifier, cyclone and pipes); • Disposal of solids such as ashes and char; • The product gas.
There are also the usual risks associated with any construction involving a thermal unit. Local rules and guidelines should be followed with construction and materials selection of buildings. Adequate means for fire-fighting should be provided and the gasifier operators should be well acquainted with their existence, location and operating instructions. Such fires can be avoided with proper procedures and proper layout of the plant. Carbon monoxide poisoning Carbon monoxide is a major constituent of producer gas and is by far the most common cause of gas poisoning. It is particularly noxious due to the absence of colour or smell. The accepted TLV is 50ppm CO (0.005 vol.%) although concentrations and exposure are closely linked [Reed et al., 1998]. There is extensive documentation available on effects, treatment and controls that are laid down by the relevant statutory authorities. Since carbon monoxide is an odourless, colourless gas, it may be detected through instrumentation and personal detectors are necessary when working in confined spaces. There are no indications that CO causes cancer [KjellstrÖm, 1981].

8
All operating personnel should be aware of the hazards presented by the gas and need to be careful while handling the gas [Turare, 1998]. The best way of avoiding risk of carbon monoxide poisoning is to build the gas generator in the open with the minimum of containment and with adequate ventilation particularly where gases may collect [Reed et al., 1988]. Table 2.1 shows the adverse health effects associated with exposure to ambient and indoor concentrations of CO in relation to concentration of COHb in the blood. Table 2.1 Health effects of concentration of CO in the atmosphere [Fierro et Al.,
2001]
CO in atmosphere(ppm)
COHb in blood(%) Signs and Symptoms
10 2 Asymptomatic
70 10
No appreciable effect, except shortness of breath on vigorous exertion; possible tightness across the forehead; dilation of cutaneous blood vessels.
120 20 Shortness of breath on moderate exertion; occasional headache with throbbing in temples.
220 30 Decide headache; irritable; easily fatigued; judgment disturbed; possible dizziness; dimness of vision.
350-520 40-50 Headache, confusion; collapse; fainting on exertion
800-1220 60-70 Unconsciousness; intermittent convulsion; respiratory failure, death if exposure is long continued.
1950 80 Rapidly fatal Particulate Matter health effects Unlike carbon monoxide, particulates generally do not have immediately recognizable health effects. Therefore, particulate exposure does not need to be monitored instantaneously, and average values can be used to assess the health effects [Andreatta et al., 2006]. Short-term exposure increases risks of respiratory death in infants, affects the rate of lung development, aggravates asthma and cause respiratory symptoms such as cough and bronchitis in children. Long-term exposure results in a reduction in life expectancy hence greater effect to public health than the short-term effects [WHO, 2005]. Other hazards Other hazards include skin burns, mechanical hazards, and electrical hazards. Some of the surfaces of the gasifier, the cyclones, the gas lines, the gas lines, the engine and its exhaust may get hot during operation and thus create a hazard to personnel for skin burns. For permanent stationary installations such surfaces should be insulated to protect the operators and also to reduce heat losses.
9
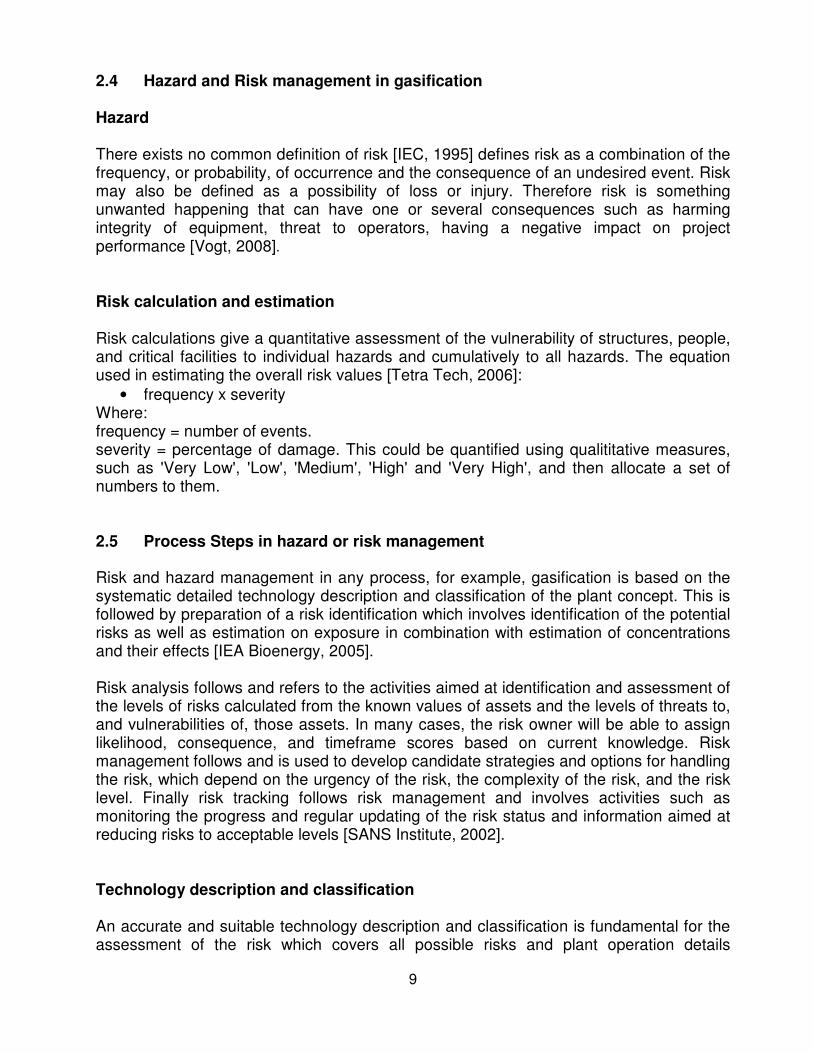
2.4 Hazard and Risk management in gasification Hazard There exists no common definition of risk [IEC, 1995] defines risk as a combination of the frequency, or probability, of occurrence and the consequence of an undesired event. Risk may also be defined as a possibility of loss or injury. Therefore risk is something unwanted happening that can have one or several consequences such as harming integrity of equipment, threat to operators, having a negative impact on project performance [Vogt, 2008]. Risk calculation and estimation Risk calculations give a quantitative assessment of the vulnerability of structures, people, and critical facilities to individual hazards and cumulatively to all hazards. The equation used in estimating the overall risk values [Tetra Tech, 2006]:
• frequency x severity Where: frequency = number of events. severity = percentage of damage. This could be quantified using qualititative measures, such as 'Very Low', 'Low', 'Medium', 'High' and 'Very High', and then allocate a set of numbers to them. 2.5 Process Steps in hazard or risk management
Risk and hazard management in any process, for example, gasification is based on the systematic detailed technology description and classification of the plant concept. This is followed by preparation of a risk identification which involves identification of the potential risks as well as estimation on exposure in combination with estimation of concentrations and their effects [IEA Bioenergy, 2005]. Risk analysis follows and refers to the activities aimed at identification and assessment of the levels of risks calculated from the known values of assets and the levels of threats to, and vulnerabilities of, those assets. In many cases, the risk owner will be able to assign likelihood, consequence, and timeframe scores based on current knowledge. Risk management follows and is used to develop candidate strategies and options for handling the risk, which depend on the urgency of the risk, the complexity of the risk, and the risk level. Finally risk tracking follows risk management and involves activities such as monitoring the progress and regular updating of the risk status and information aimed at reducing risks to acceptable levels [SANS Institute, 2002]. Technology description and classification An accurate and suitable technology description and classification is fundamental for the assessment of the risk which covers all possible risks and plant operation details

10
[Timmerer et al., 2007]. To ensure detailed analysis of risks and dangers in gasification plants, the process chain has to be subdivided into different plant sections and all the interfaces between process sections have to be defined to ensure a complete and overall analysis and assessment of the risks and their consequences [IEE, 2008]. Hazard or risk identification Hazard identification is designed to identify all situations where people may possibly be exposed to injury, illness and disease [ATTAR, 2004]. It is essential for hazard identification to be carried out whether there is any potential for injury, illness or disease. Employees should familiarize themselves with the potential hazards and any eliminating or minimizing requirements. Hazards in a gasification process could be classified as physical, chemical, ergonomic, biological or psychological. Hazards can be identified through [La Trobe University, 2001]:
• Direct report from employees and plant incident report form. • Health and safety committees. • Hazard identification checklists such as manual handling risk identification plant,
planned OHS inspections, and workstation. • Consultants report. • Material safety data sheets.
Risk Characterization Risk and hazard identification follows and involves establishing the variety of risks and risk consequences which occur along the gasifier plant sections [Timmerer et al., 2005]. Hence, a differentiation into the risks and their consequences is done which provides a clear overview on the discussion, implementation and documentation of safety measures at any gasifier installation. Risk Assessment-minimization Risk assessment is a systematic process for describing and qualifying the risks associated with hazardous substances, action or events.” [Covello et al., 1999]. The risk assessment and minimization follows based on the information obtained from the risk identification process. Here, results from the existing risks with valued effects are analyzed in detail which allows making decisions on whether a present risk is acceptable or not and to ask for requirements which are necessary for eliminating dangers from different effects from risks. The assessment has to be carried out in the context of dependencies in the field of the used technology and their risk regarding health, safety and environment. Hence the aim of the risk assessment is to get knowledge about effects on human life, environment and damages to the plant site. Precautions have to be included within the risk assessment in a separate loop in order to take care of the interactions and influences from the added design features and safety components in the further development of the plants safety
11
concept. Secondary risks have to be considered due to the difficult boundary conditions of the biomass gasification process. The technical application of biomass gasification risk assessment requires lots of information from the plant, plant concept and the different modes. These modes have to be prepared before starting the risk assessment. During the risk assessment procedure in biomass gasification plants, the following has to be considered [IEE, 2008].
• Description and classification of the used technology; • Definition of a pool of certainties and possible risks in operation of gasification
plants; • Risk characterization and identification, analyses and combination of risks and risk
consequence with regard to used technology; • Tabulated analysis of possible risks/possible reasons; • Upgrading/up dating of the systematic.
The risk reduction measures or decisions help in reduction of severity and frequency of the potential hazardous event-consequences combinations. These countermeasures are classified into:
• Risk elimination measures; • Risk mitigation measures; • Risk acceptance and transfer.
Risk elimination measures aim at setting procedures that completely eliminate a previously identified risk. Risk elimination can be achieved through a series of planned steps over a period of time designed to gradually reduce, or mitigate, the risk or hazard to a point where it is eventually eliminated. Risk mitigation is achieved in the same way as risk elimination; in this case, instead of completely eliminating the hazard, decisions are made to implement applied selected countermeasures that reduce the risk to a safe and acceptable level by either reducing its likelihood, or lowering the consequence of the risk if it were to exist [SANS Institute, 2002].
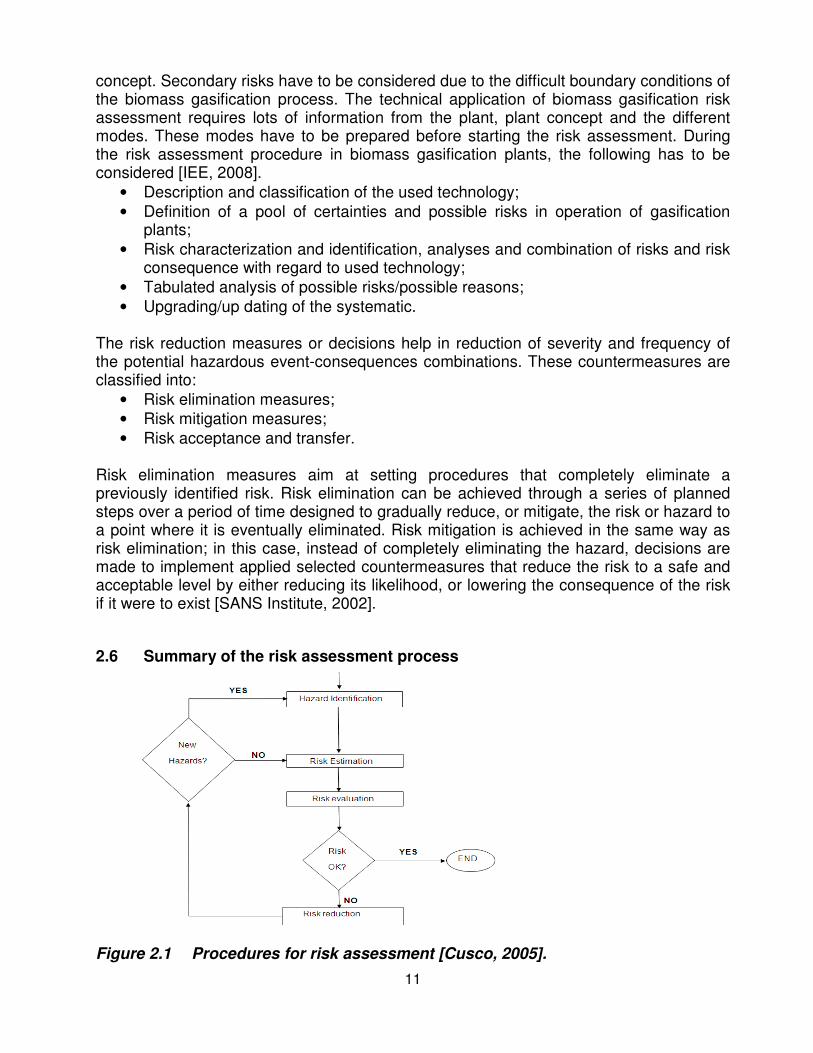
2.6 Summary of the risk assessment process
Figure 2.1 Procedures for risk assessment [Cusco, 2005].

12
CHAPTER THREE: METHODOLOGY 3.0 Introduction This chapter discusses the several methods and procedures that were used in order to accomplish the study. These methods of approach are described in details below.
3.1 Identification of installations
This involved selection of the gasification plants that were to be used in the evaluation of the different health, safety and environmental hazards. The sites selected for the research involved; Muzizi Tea estate, Kyambogo University, Makerere University gasifier installations. The installations were selected based on the fact that they were the only existing ones in operation in Uganda at the time of the study. 3.2 Data collection and analysis methods
Relevant data both primary and secondary from the different gasifier installations under consideration was collected and analyzed using Microsoft Excel 2007. The data collection techniques are discussed below. 3.2.1 Interviews, observations and checklist
Interviews were carried out with the engineers, technicians and managers at the installations. They involved several questions that were selected and structured in line with the objectives of the research. They were meant to obtain and validate information regarding the operating experiences gained so far with the installations. A questionnaire was designed in order to attain information regarding the technological description and classification of the gasifier plants. This classification involved division of the process chain at each installation into different sections where operating modes and parameters were to be defined. This information was used as a basis for the identification, assessment and evaluation of the hazards and their related risks within the plants. Observations were made during the site visits to the installations. They involved detailed visualization and inspection of the operations of the plants upon which the existing HSE control measures and practices were identified.
Checklists were used in identifying the possible hazardous events and their consequences within the different biomass gasification plants. Furthermore, international policies and standards, operation manuals were reviewed. The information was used in the preparation of the risk assessment process of the respective installations.

13
3.2.2 Experiments and measurement procedures
Environmental monitoring through experiments was conducted in order to identify and estimate the concentration and exposure of the different environmental, fire, explosion and toxic hazards such as pollutants, temperatures, and gases within the installations. The probable pollutants that were investigated involved; CO, PM, gas engine stack emissions. Hot surface temperatures and pressures were also monitored. 3.2.3 CO measurements Measurements of CO concentration were conducted within the 3 gasifier installations. For Muzizi and Kyambogo installations, 2 sampling positions at the gasifier and engine-generator set were selected in relation to each installation configuration. The decision to take CO measurements near the reactor and at the engine-generator was based on the fact that these positions are close to the control panels where personnel sit while controlling the operations of the plant. At the Makerere gasifier, CO measurements were taken at one sampling position only close to the reactor. Real time values of CO concentration within the installations were conducted by means of a portable Testo Der CO monitor (317-3) with a range of 0 - 2000ppm and a total accuracy of ±10 ppm. The CO concentration measurements were recorded in two sessions per day for Muzizi and Kyambogo installations and one session per day for the Makerere gasifier. The monitor was switched on before taking readings. Using a timer, recordings of the indoor CO concentration were taken after every 5 minutes. The CO monitor was calibrated before each of the measurements. Each sampling had a mean duration of 66 minutes. 3.2.4 PM measurements Real time values of PM concentration were taken within each of the gasifier installations. At the Muzizi gasifier, two sampling positions were selected; one in the fuel preparation area and the other inside the machine hall near the cyclone for conducting the measurements. The reason for selecting these positions was that in the fuel preparation section, billeting and saw dust preparation take place there hence presence of particulates. The position near the cyclone was chosen to investigate any leakages of dust from the gas cleaning process. At Kyambogo and Makerere installations, PM measurements were taken at one sampling position inside the machine hall next to the reactors. An IAP meter having both a CO and a PM sensor was used to continuously monitor and record the PM concentration inside the installations. The meter detects PM in a given environment and its data is recorded in a memory card which is later downloaded onto a computer in form of an Excel spreadsheet for further analysis. The meter had specifications of a range of 0 - 50000µg/m3 with a resolution of 50µg/m3.

14
The IAP meter was calibrated by sampling ambient air within a clean environment before taking it to the area under investigation. The meter was placed in the sampling site and the switch turned on to start the monitoring process. 4 samplings in total were done at the installations and each had a mean duration of 1 hour.
3.2.5 Gas engine stack emissions The gas engine emissions including CO2, CO and UHC were measured at Muzizi and Kyambogo installations respectively. The real time values of these emissions were taken from the exhaust stack of the engines. No engine stack measurements were taken at Makerere University installation due to absence of a producer gas engine. A Kane, multi-gas analyzer capable of monitoring and recording CO2, CO, NOx, SOx and O2 from the gas engine was used for this purpose. The analyzer has a probe which can be inserted and clipped onto the engine exhaust while taking readings. The gas engine exhaust stack emissions were monitored continuously during 3 test periods in a day each with a mean duration of 1 hour at Muzizi installation. At Kyambogo, continuous monitoring was done in 2 sessions of the day with a mean duration of 1 hour. Using the gas analyzer, the probe was inserted into the exhaust of the gas engine and the emissions were read and recorded by percentage and ppm in time intervals of 7 and 10 minutes for the three sessions of the day. The mean sampling distance of the gas engine stack emissions was a distance of 1 meter in order to avoid putting in danger the safety of the monitor’s safety. 3.2.6 Hot surface temperatures Hot surface equipment within the plants principally the reactor and cyclone were chosen for the purpose of monitoring hot surface temperatures. A non contact Raytek (Raynger 3i) Optical pyrometer laser beam was used for this purpose. The pyrometer has characteristics namely: a range of -30 to 1200oC with an accuracy of 8-14µ,spectral response of 8 - 14 microns, distance to spot size of 25:1 to 180:1 and an emissivity of 0.10 - 1.0 digitally adjustable. The optical pyrometer was pointed at the surface whose temperature was to be measured. This was followed by pulling a trigger which directed a laser beam onto the surface thereby indicating the hot surface temperature. 3.3 Risk assessment HSE risk assessment was done in order to identify, describe and qualify the risks associated with hazardous substances and events within the installations. The Health and Environment risk assessment involved quantifying the concentration of toxic substances, solid, liquid and gaseous emissions while evaluating their effects on humans and the

15
environment with reference to the international standards. Safety risk assessment was to investigate the degree of risk posed by the hazardous events within the installations.
3.3.1 Risk assessment procedure
Each installation’s gasification process was fully described while establishing its sub processes and units/components. Here the operating modes and behavior were established.
A list of the different occupational HSE hazards based on the gasification processes was developed. The hazard identification process was limited to events that could happen during the regular operation of the gasifier plants. This was done by use of a HAZID form, a checklist having all the possible hazardous events in biomass gasification plants and through team-based ‘brainstorming’ activity accompanied by interviews with the technical personnel involved with the operation of the installations. Other hazards were identified through literature review, past incidents occurring within the plants and close monitoring by visual inspections within the plants. Experiments were also done in order to investigate the possible existence of toxic hazards within the plants through continuous sampling techniques. The impacts of the identified hazardous events were also determined through past events, brain storming activity, checklists and visual inspection of the processes where judgment was done.
Also, the details of the existing control measures and documentation meant to minimize any potential risks caused by the health and safety hazards within each installation were investigated. These measures were identified based on relevant documentation, visual inspection of the work place, internal work procedures and instructions. These included; physical controls/barriers, Training, Working instructions, procedures and policies put in place and Personal Protective Equipment. This information was used in assigning the degree of risk posed by each identified hazard. 3.3.2 Calculating degree of risk
The calculation of degree of risk was done by assigning numerical values for the frequency and severity of each identified hazardous event. For the frequency of each hazardous event, ranges and notations were established based on a given category. This was also done for severity. The numerical values were assigned based on the findings from the hazard identification process against predetermined standards for practices and the existing hazard control measures within the plants. The degree of risk was therefore determined by a model through multiplying the frequency with the severity in order to reach a comparative score which would give the level of risk. Using a risk matrix, the different risk scores were then categorized into three classes such as Acceptable, ALARP and Unacceptable. At this stage, knowledge about the hazardous events that posed a great risk to the existence of the plants was obtained.

16
Additional mitigation and preventive measures for the hazardous events falling within the Unacceptable range of the risk matrix were suggested for each plant. These measures were determined after evaluating the existing hazard and safety precautions in place.
The conduction of the safety risk assessment and reduction process was done using Microsoft Excel 2007.

17
CHAPTER FOUR: RESULTS AND DISCUSSIONS 4.1 Technology description of the installations
4.1.1 Muzizi Tea estate gasification plant The flow scheme of the plant is shown in Figure A1, Appendix A. It consists of a machine hall enclosed in a shed of about 10m x 20m with the reactor (down draft type 400kW thermal output), gas cleaning and conditioning system, an engine - generator set and control panels, an adjacent building for fuel storage and fuel preparation and a combined spray pond and sludge pond where the scrubber water is cooled and contaminants in the water allowed to settle at the bottom. The fuel wood from the eucalyptus forest is dried in a shade and later cut into billets of 100mm x 80mm size. The fuel moisture content is kept between 15-20% by weight while the fuel flow is 210 kg/hr. The reactor has eight air nozzles and the fuel (wood billets) is fed automatically in batches to the reactor through a hopper which has a double door assembly. The producer gas from the reactor proceeds to the cyclone for de-dusting where it proceeds to the venturi scrubber for further purifying. A series of four filters with two parallel lines namely a coarse filter(CF), two fine filters(FF1 and FF2) and safety filter(SF) are used to fully clean the gas before it is fed into the engine for utilization for electrical power production. There exists a condenser, control valves and a blower just after the safety filter which help in the conditioning and directing the gas to the engine generator set. The engine is a 12 cylinder spark ignition engine in V- arrangement, with a displaced volume 28 litres and a compression ratio believed to be 8.5:1. It is equipped with two Holset turbochargers, one for each side and two intercoolers. The operating speed is 1500 rpm. The generator is rated for 440 kVA at 415 V. There is an energy recovery system where the exhaust gas from the engine is used to provide heat for the dryers through a radiator. U-tube manometers are used to monitor the pressure differences over gasifier nozzles, across gasifier and across the different filters. Temperatures of cooling water and in the gas before and after the intercooler are measured. Sampling ports for gas analysis are available at the cyclone at the safety filter (SF) and in the exhaust pipe. All operating parameters are recorded each 30 minutes on standardized daily log-book sheets by the four personnel who operate and control the power plant. The gasifier system is started by a generator set delivering about 30kW to run auxiliary components of the system such as pumps, blower, fuel wood feeding system and the control units. The start up time of the system is about 7 minutes when cold but sometimes less when there is hot material in the reactor. Table 4.0 shows the process and system description of the plant including the sub-systems and components.

18
4.1.2 Kyambogo gasification installation A schematic diagram of the gasifier system is as shown in Figure A2, Appendix A. Biomass (wood pieces or chips) is fed manually in batches through a pneumatic single feed door assembly and stored in the hopper. Air enters through the air nozzles. The reactor has a charcoal bed for reduction of partial combustion products there by allowing producer gas passes through the annulus area of the reactor from the upper portion of the perforated sheet. The gas outlet is connected with the downstream systems such as the venturi scrubber, water junction box, fine filter, safety filter, flare with valve and gas control valve. The gas from the gasifier is scrubbed and cooled in the scrubber with re-circulating cooling water from, the cooling pond by the help of a scrubber pump. The gas is separated from water in the water junction box before it is introduced in the fine and safety filters which ensure proper cleaning of the gas. The cool and clean gas and air are then sucked into the engine through a gas train consisting of piping and valves arrangement. A 12V battery is used to start the gasifier which is then used to provide auxiliaries power to the DC scrubber pump to start the whole system. A battery operated electric starter is used to starts the engine on gas mode. A governor-linked control butterfly valve is used to vary the gas quantity as per the electrical load on the generator ensuring that the frequency is within the accepted limits. The engine-gasifier control panel provides for the switching and indicates the safety of operation. The installation also has an electric driven biomass cutter with an engine hot exhaust based wood pieces drying arrangement. The plant is operated by two personnel. It is used for experimental purposes but also generates electricity to light up the buildings within the University. Table 4.1 shows the detailed technological and system description of the installation including the process units, functions and components. 4.1.3 Makerere University gasification rig The flow diagram of the gasifier system is shown in Figure A3, Appendix A. The reactor has air 7 nozzles and the biomass is fed in batches to the reactor manually by the help of a wooden step stand. The gasifier bottom has a ceramic liner inside a metal casing which is not the case with the top. It also holds charcoal for reduction of partial combustion products to generate the producer gas. The gas produced in the reactor proceeds to the gas cleaning unit which is made up of a cyclone responsible for the removal of dust particles. The clean gas then proceeds downstream of the system through a hose pipe to the suction blower and gas sampling units. By help of a valve, a small portion of the gas is taken to the gas chromatograph machine through a condenser for analysis purposes.

19
Using the suction blower, the rest of the gas is flared to the atmosphere followed by burning it. The system is started by placing a required amount of char over the grate followed by biomass fuel. The suction blower is then turned on followed by introduction of fire into the reactor by using of a lighter to start up the system. The rig is operated by 3 technicians and is meant for experimental and research purposes. Table 4.2 shows the detailed technological and system description of the installation. Table 4.0 Technology and system classification Muzizi Tea estate plant
Gaseous Liquid Solid Temperature(0C) Gauge Pressure(mmWG)
1.Fuel storage and drying Dry storage of biomass Shade fuel wood logs 20-100
2.Fuel preparation and feeding Fuel billeting Billeting machine lubricants fuel wood billets 20-100Fuel transport to reactor Elevator Sawdust
Lock hopperAutomation system
3.Gasifier reactor Air supply to reactor nozzles Down draft gasifier wood gas water fuel wood billets 20-1000 80 to 140Air nozzles air ash 12 to 35Automation system char
4.Cyclone Gas cleaning and dust removal Cyclone wood gas dust 20-600
5.Water scrubber Dust removal Venturi scrubber wood gas water dust 20-600Gas cooling and purification
6.Gas filtering Gas cleaning and dust removal Coarse filter wood gas water dust 30-90 5 to 50Fine filter 1 and 2 30 to 80Safety filter 3 to 40motors
7.Gas conditioning and transport Dehumidification Gas blower wood gas,air water dust 30-90 200 to 400Gas transportation Moisture trap
Valve battery to direct gasControl valvesThrottle valve
8.Gas engine Gas utilization Gas engine wood gas,air dust 30-150 150Gas mixer/intake systemintercoolersturbochargerAutomation system
9.Flare burnoff Gas burnoff Flare valve wood gas,air dust
Auxiliary media or utilities Temperature and pressure ranges
Process steps Sub processes Units/Components
20
Table 4.1 Technology and system classification Kyambogo plant
Gaseous Liquid Solid Temperature(0C) Gauge Pressure(mmWG)
1.Fuel storage and drying Drying and storage of biomass wood dryer engine exhaust gas wood pieces/chips 20-1002.Fuel preparation and feeding Fuel cutting and transport to reactor wood cutter lubricants wood pieces/chips 20-100
step standLock hopper
3.Gasifier reactor Air supply to reactor nozzles Down draft gasifier wood gas water wood pieces/chips 1050-1100 30 to 50Air nozzles air ash 15 to 20comb rotor motor charcoalcomb rotor gear boxdry ash collection boxvibrator motor
4.Water scrubber Dust removal Venturi scrubber wood gas water dust 40-400Gas cooling and purification DC Scrubber pump 20
5.Water separation Separation of gas and water water separation box producer gas water dust 206.Gas filtering Gas cleaning and dust removal Fine filter wood gas water dust 30-90 10 to 12
Safety filter 3 to 57.Gas conditioning and transport Gas transportation Hose pipes wood gas,air water dust 30-90 200 to 400
Control valves
8.Gas engine-generator set Gas utilization Gas engine wood gas,air water dust 30-150 150Gas mixer/intake systemAutomation system
9.Flare burnoff Gas burnoff Flare valve wood gas,air dust
Process steps Sub processes Units/Components
Auxiliary media or utilities Temperature and pressure ranges
Table 4.2 Technology and system classification Makerere University gasification rig
Gaseous Liquid Solid Temperature(0C) Pressure
1.Fuel storage and feeding Storage and feeding of biomass Step stand producer gas biomass residues 20-100 atmospheric2.Gasifier reactor Air supply to reactor nozzles Down draft gasifier producer gas moisture biomass residues 1050-1100
Air nozzles air ashAsh collection box Char
3.Gas cleaning unit Dust removal Cyclone producer gas moisture dust
4.Gas transport and conditioning Gas transportation Hose pipe producer gas moisture dustSuction blowerCyclips
5.Gas sampling and cleaning Gas sampling and cleaning unit Pumps producer gas moisture dust atmosphericCondenserFilter
6.Electric power and driving unit Electric power unit Motor atmosphericBelts and pulleys
7.Flare burnoff Gas burnoff Flare valve producer gas,air moisture dust atmospheric
Process steps Sub processes Units/Components
Auxiliary media or utilities Temperature and pressure ranges

21
4.2 HSE Hazards identification The hazards identification process focused on the investigation of the total gasification processes, sub processes and components for the existing and possible uncertainties. The identified hazardous events were limited to regular plant operation. 4.2.1 Hazards identified at the gasifier installations
Several hazards were identified at the three gasifier installations. The findings are shown in tables 4.3, 4.4 and 4.5 for the gasifiers at Muzizi, Kyambogo and Makerere respectively. Table 4.3 Identified HSE Hazards and their consequences at Muzizi installation
Process unit Possible hazardous events or risks Consequences
1.Fuel storage and drying Fire outbreak due to burning of feedstock Explosion, injury to operator.
2.Fuel preparation and feeding Particulate matter exposure Danger to operator health, pollution Frequent failure of automated fuel feeding system Exposure to CO and PM from manual feeding.
3.Gasifier reactor Poor charcoal and ash disposal Fire outbreak, environmental pollution.
Leakages and air penetration during fuel feeding Explosions, CO and PM exposure, Environmental pollution.
Hot surfaces of the reactor Harm to operators (scalds and burns), Fire hazards.
Gas coatings on doors of the reactor and lock hopper
Unbalancing of the lock hopper hence air leakage into system leading to explosion.
Pressure buildups Potential explosions. Operator errors with the reactor Accidents and damage to equipment. Flames through the gasifier reactor nozzles. Explosion hence harm to operator.

22
4.Cyclone and gas cooling Hot surfaces Harm to operators(scalds and burns),Fire hazards Leakage of dust Environmental Pollution. 6.Water scrubber Leakage of scrubbing agent( water leakage) Irritation, environmental pollution Hot surfaces of the scrubber Fire, injury to operator(burns and scalds) Poor disposal of sludge from the scrubber pond Environmental pollution 5.Dedusting(filtering) Saw dust fumes Danger to operator health, pollution
Operator errors(failure to meet instructions) Leakage of gas hence pollution and harm to operator health.
7.Gas conditioning and transport Gas leakages, air leakages into system
Explosions, exposure to CO and PM, Environmental pollution.
8.Gas engine and generator High noise levels due to vibrations Noise pollution Harmful emissions from gas engine stack Danger to operator health, pollution Hot surfaces Harm to operators (scalds and burns). Gas leakages Gas poisoning Operator errors Accidents
Flames from engine exhaust stack Harm to operators(scalds and burns),Fire explosion
9.Flare burn off Burning off excess gas Fire outbreak hence harm to operators(scalds and burns), explosions
Hot surfaces Harm to operators (scalds and burns), Fire hazards.
23
Table 4.4 Identified HSE Hazards and their consequences at Kyambogo installation
Process unit Hazards or events Consequences
1.Fuel storage and drying Fire outbreak due to burning of feedstock by engine exhaust gases Explosion, injury and harm to operator health.
Hot surfaces of heat exchanger Harm/injury to operator
2.Fuel preparation and feeding Saw dust fumes Danger to operator health, pollution
Operator errors with wood cutter Possibility of harm/injury to operator.
Falling off from the step stand on feeding fuel Harm/injury to operator
Gas leakages from the reactor Danger to operator health, pollution, gas poisoning and explosions.
Noise from wood cutter Environmental pollution
3.Gasifier reactor Poor Char disposal Environmental pollution and possible fire outbreak
Gas leakages, PM from the reactor during combustion Environmental pollution and explosions
Hot surfaces of the reactor Harm to operators(scalds and burns), fire hazards
Pressure fluctuations(back firing) Explosions
Noise and vibrations from vibrator motor Noise pollution
Operating errors by technicians. Accidents and damage to equipment
Air leakages through refueling on opening of the reactor lock hopper. Fire explosion
Backfires through air nozzles Explosions, harm to operator
6.Water scrubber and drain box Leakage of scrubbing agent, water
Irritation, mechanical failure, environmental pollution.
Hot surfaces of the scrubber Fire, injury to operator(burns and scalds)
Environmental pollution
Unprotected scrubber pond Accidents and harm to personnel

24
5.Dedusting(filtering) Saw dust fumes Danger to operator health, pollution
Operator errors (failure to meet instructions) Accidents, Gas leakages
7.Gas conditioning and transport Gas leakages, air leakages into system
Danger to operator health, pollution, gas poisoning and explosions.
8.Gas engine and generator High noise levels and vibrations Noise pollution
Harmful emissions from wood gas engine stack Danger to operator health, pollution, dust explosion
Hot surfaces at the engine Harm to operators(scalds and burns), fire hazards
Operating errors by technicians Accidents Flames from engine exhaust stack Harm to operators, fire explosion
9.Flare burnoff Hot surfaces Harm to operator, possible fire outbreak
Poor flare burnoff installation Fire outbreak inside machine hall when burning off excess gas
Table 4.5 Identified HSE Hazards and their consequences at Makerere University rig
Process unit Hazards or events Consequences
1.Fuel storage and feeding Falling off from the step stand on refueling. Harm/injury to operator
Exposure to pyrolytic gases and fuel particulates due to leakages when refuelling Danger to operator health, pollution, gas poisoning
Air penetration into reactor on refuelling Fire explosion Possible fire outbreak due to burning of residues Harm/injury to operator
2.Gasifier reactor Hot surfaces of reactor Harm/burns to operator, risk of fires
25
Char and ash disposed around reactor Fire outbreak and explosion Backfiring Explosion Gas and PM leakages Gas poisoning, environmental pollution Operator errors with the reactor Accidents and damage to reactor Flames through nozzles Fire explosion, backfires, burns to operators Pressure fluctuations Explosions 3.Gas cleaning unit Hot surfaces Fire risks Dust and gas leakages Danger to operator health due to gas poisoning 4.Gas transport and conditioning unit Gas leakages, air leakages into system Gas poisoning, environmental pollution Pressure fluctuations inside hose pipe Explosions Hot surfaces Fire hazards 5.Gas sampling unit Tar accumulation Environmental pollution Producer gas leakages Danger to health due to gas poisoning Operating errors with the unit Possibility of accidents
Hot surface of tube connecting gasifier to sampling unit Harm to operator
7.Flare burn off Hot surface Danger to operator health due to gas poisoning Burning off excess gas Possible harm to personnel due to fire
26
4.4 Review of existing hazard control measures at the installations
4.4.1 Muzizi Tea estate installation
• The cyclone whose average surface temperature was reported at 242oC is enclosed or guarded inside a wire mesh to prevent any direct contact to its surface by working personnel or any other individuals.
• The scrubber pond used for storage and recirculation of water for the venturi scrubber is protected with a wire mesh and a roof on top to prevent any individuals falling inside and to avoid any foreign material such as leaves penetrating inside for they could pose a great risk of blocking the pump.
• The structure housing the gasifier and the engine-generator set is well ventilated and aerated, having enough space for flexible movement of operating personnel.
• High temperature insulation on the pipe surface of the energy recovery system is in place to prevent any potential harm and injury to any individual exposed to them.
• The fuel is fed automatically into the reactor which implies that the personnel need not go nearer the charging lids or the hopper hence protecting them from exposure to harmful toxic gases. In addition, the engine is also well automated with sensors for the valves.
• All machines in the facility with moving parts such as the billeting machine, motors are well guarded in order to reduce any risks of harm to personnel.
• It was reported that training of the personnel mainly the Factory Engineer concerning the safe operation and maintenance of the gasifier by the skilled and experienced trainers was done in India after installation of the plant.
• Procedures regarding the start up, operation and shut down of the gasifier reactor, engine generator set and the auxiliary devices were observed to be written down clearly on black boards placed within the building. These act as a check list for the proper operation of the equipment.
• The ranges of the reactor and engine operating parameters such as temperatures, pressure drops, voltages, frequencies, power factor are also displayed in the building.
• As a policy, no individual is allowed to stay within the vicinity of the reactor when it is running. Individuals are supposed to stay out the machine hall while the gasifier is running.
• Maintenance of equipment is regularly done. This involves replacement of auxiliary devices on both the reactor and engine such as valves, speed governors, regulators, changing of filter media among others. In addition, leak testing of the system is also done during maintenance.
• There are separate buildings for storage, drying, preparation of fuel and saw dust which reduces the risk of fires at the facility.
• Pressure indicators such as manometers are also placed at each equipment for continuous monitoring of the pressure drop inside the system. These were observed at the reactor, the nozzles, the filters and the engine side.

27
• Daily log sheets are used to closely monitor the variation in the operating parameters of both the gasifier and engine-generator for every 30 minutes during the course of operation of the plant.
• Personnel operating the plant and any individuals visiting have to wear protective equipment such as overalls.
• In the fuel preparation unit, personnel are provided with gloves, nose and ear protection to protect them from possible saw dust particles and the noise from the machines.
• CO monitors and noise meters were acquired by the plant though were not present inside the plant at the time of the study. This was attributed to neglect by personnel and absence of strict rules and procedure regarding usage of personal protective equipment.
4.4.2 Kyambogo University installation
• The blade of the wood cutter is well protected thus reducing the risks of causing potential harm.
• Pressure indicators are present at the reactor, filters and generator for continuous monitoring the pressure drop as the system is running.
• Excess producer gas is burned off at the flare. • There is a control panel used for continuous monitoring of the operation of the
engine-generator set. • It was reported that training of the personnel mainly the technicians was to be
done. • CO monitors are available though not used all the time inside the plant.
4.4.3 Faculty of Technology rig
• Moving parts of the suction blower are well guarded to prevent any potential harm or injury to personnel.
• The building housing the gasifier and its components is well ventilated which allows entry and recycling of fresh air.
• Routine maintenance of the rig is done after every one runs. This is mostly done especially when running the rig with rice and bagasse residues.
• All the system components and units are checked for their proper functioning before carrying out any experimental runs.
• The excess gas produced from the system is always burned at the flare. • Protective equipment is always worn by personnel while running the gasifier. • As a policy, every time the rig is running, there is always a minimum of 3
personnel operating the rig. This reduces on the risk that could be posed as a result of individuals working alone with the gasifier.
• Training was done for one of the technicians operating the rig. This was done by experienced personnel from Sweden.

28
4.5 Review of available documentation at the installations To ensure that the gasifier installations visited met the international standards, there was need to investigate the existence of the relevant information needed for their safe operation and existence. This documentation is discussed below. 4.5.1 Plant location and the principle set up At Muzizi and Kyambogo gasification plants, there was presence of the site plans showing the gasification plant, construction of the building in which the whole system is housed and the technical specification of the main parts of the power system. This information was not available at the Makerere University rig. 4.5.2 Principal technical description and presentation Information regarding the machinery installation plans, relevant machines and schemes for the parts were available at Muzizi Tea estate and Kyambogo plants unlike at Makerere University rig. However, details of stores and plants for gases, fire places and types of used parts for sewage treatment were not available at any of the installations. 4.5.3 Technical plant and concept of operation This is information regarding the standard, start-up, shut-down and emergency operation of the installations. From the observations, findings showed that at Muzizi Tea estate and Kyambogo plants, partial information regarding the flow sheet of the installations was present. This information was absent at the Makerere University rig. The flow sheet showed the kind of fuel used which was mainly wood for Muzizi and Kyambogo, media used in the operation of the system mainly during gas cooling, cleaning and any lubrication, producer gas data, the existence of valves and safety devices, residues from the processes, arrangement of sampling points and information regarding electricity and heat supply. This information was not available at the Makerere University rig. 4.5.4 Technical description of the gasification plant It was observed that there was no complete technical description of the plants. For example there was no clear information on the number of personnel supposed to operate the plants, measures for protection against accidents since there had not been any risk assessment process done before the installation of the plants, storage of residues and wastes and waste management concepts. On the other hand, information

29
on storage of fuels, instruction manuals were only available at Muzizi and Kyambogo plants and absent at Makerere University. 4.5.5 Safety system and safety engineering concepts Since no risk assessment had been done before or at the time of installation of the plants, there was no detailed information regarding the proper measures for protection of employees from explosions, fire protection among other HSE hazards. 4.5.6 Plant gaseous, liquid and solid emissions At all the gasifier installations visited, information about the expected acoustic and noise emission levels from the equipment and relevant measures for reduction of these emissions and vibrations were not present. Furthermore, data on the expected atmospheric gaseous emissions of the plants such as engine exhaust emissions by type, concentration and mass flow, exhaust gas treatment concepts and measures for minimization of engine gaseous pollutants, conduction of periodic emission measurements during the test phase and regular plant operation was not available and there were no future plans of conducting such measurements. For the residues and wastes from the installations, data concerning the expected mass, concentration and composition of waste waters, ash, dust and sludge form the gas cooling and cleaning was not available. In addition, there were no arrangements for estimating the concentration and composition of residues and wastes from the gasification plants. Furthermore, explanation on the procedures for proper handling, treatment and storage and recovery or disposal was not present at the installations too. 4.6 Environmental Health hazards assessment An evaluation of the potential health risks to personnel and the environment from exposure to toxic substances such as CO, PM, producer gas engine emissions from the gasification processes was investigated. Emissions such as NOx and SOx were not monitored. This was based on the fact that biomass is sulfur free and gasification processes result in very low concentrations of NOx emissions [Chang, 2009]. 4.6.1 CO exposure within Muzizi plant
The results of the 63 minute CO concentration within the Muzizi plant machine hall are tabulated in Table B1 Appendix B and shown in the Figure 4.0.

30
Figure 4.0 CO Concentration recorded within the machine hall at Muzizi plant
Based on the above results, it was observed that near the gasifier reactor, the CO concentration ranged from 38ppm to a maximum of 150ppm and was above the short term exposure TLV of 50ppm. During the monitoring period, only 1 out of the 10 observations was below this limit. On average the concentration above the TLV was about 94ppm for about 56 minutes. At the engine side, the concentration ranged from 9ppm to a maximum of 40ppm. This implied that for the entire monitoring process at this position, the CO concentration was below the recommended short term exposure TLV. This was based on the fact that the engine exhaust is well vented out of the building and at the area where the engine-generator set is located is well ventilated. Therefore, it was observed that the concentration of CO at the engine side was lower than that at the reactor side and is within the acceptable limits which allow a normal TLV of 50ppm for an 8 hour working day unlike for the gasifier side which was slightly above the standards. The concentration of CO around the gasifier was attributed to possible leakages during the automatic fuel feeding process which requires opening of the door door assembly of the reactor hopper. For a 12 hour working day for the four personnel who operate the gasifier, a CO concentration of 94ppm exposes them to risks of headache and dizziness. At the engine side, there was no significant health risk connected to inhalation of CO from the system. Long-term exposure to such levels of CO concentration observed at the reactor exposes personnel to health risks such as reduction in alertness, perception, performance of fine motor tasks.

31
4.6.2 Engine stack emissions at Muzizi plant
The engine stack emissions of were monitored continuously through three sessions of the day. The results were tabulated as shown in Tables B2, B3, B4, Appendix B as well as in Figures 4.1, 4.2 and 4.3.
Figure 4.1 Stack emissions from an engine at Muzizi plant for first monitoring period on 19/05/2009 from 8.45pm to 9.30pm
Figure 4.2 Stack emissions from an engine at Muzizi plant for second monitoring period on 20/05/2009 from 3.25pm to 4.15pm.

32
Figure 4.3 Stack emissions from an engine at Muzizi plant for third monitoring period on 20/05/2009 from 7.00pm to 8.00pm. Since CO is the main gas generated during the gasification process, its existence in the stack emissions would be expected as observed from the three monitoring periods which is mainly attributed due to engine slip. For the three monitoring periods, the CO emissions ranged between 2000ppm to 4500ppm which implies that the average percentage composition of CO in the exhaust gas stack of the wood gas engine was approximately 29% corresponding to 2900ppm. This value was above the normal 2000ppm which is considered not to be harmful to the environment [IEA Bioenergy, 2005]. Furthermore, based on the CO international emission limits which range between (650mg/Nm3-3000mg/Nm3) this value was above the recommended international average limits for countries and were observed not to be harmful to the environment [IEA Bioenergy, 2005]. Also, the CO concentration result is not a measure of PAH emissions which further justifies how the producer gas engines are less dangerous to the environment. In addition, these exhaust emissions such as CO, UHC, CO2 were inherently lower than emissions from gasoline engines which justifies the sustainability of the gasification technology [Turare, 1998]. It was observed that there was hardly any UHC in the exhaust emissions of the engine. This is explained by the relative absence of hydrocarbons in the producer gas. On the existence of CO2 and O2 emissions (See Tables B2, B3 and B4, Appendix B) it was observed that parallel to the amount of emissions in the gas engine exhaust stack, there was a fluctuation in the amount of Oxygen. In the first monitoring period, the transient drop in the CO2 and O2 levels were not typical of the engine unit when it was operating normally. The drop in the O2 levels was due to starvation of air in the gas engine. In the

33
second and third monitoring periods, the levels of O2 and CO2 stabilized since there was absence of transient drops indicating system stability. The effects of CO2 emissions from the gas engine were not observed to be so significant to the environment in such a way that there exist plantations of eucalyptus around the gasifier installation. These eucalyptus trees act as carbon sinks by absorbing the CO2 from the engine exhaust stack thereby keeping the amount of CO2 the same in the atmosphere. 4.6.3 Particulate Matter exposure inside Muzizi plant
The concentration of PM inside the installation, both in fuel preparation and gasifier sections, was recorded. The results are presented in Figures 4.4 and 4.5.
Figure 4.4 PM concentration in the fuel preparation area

34
Figure 4.5 PM concentration at the gasifier/engine section At the fuel preparation section, the average particulate matter concentration measured was about 200µg/m3 except the period between 12 to 16 minutes where there was a peak concentration of about 800µg/m3 and between 33 to 36 minutes, where there was a drop in the concentration levels to 0 µg/m3. This drop was due to a stoppage in the process of fuel billeting and saw dust preparation for 3 minutes. The highest PM concentration within this section was recorded at 800µg/m3. At the gasifier/engine section near the cyclone, the highest PM concentration was recorded at 1100µg/m3 which lasted for a period of about 4 minutes. In general however, the average concentration of PM at the gasifier/engine section was much lower than that in the fuel preparation section. Particulate matter concentration in the fuel preparation area as shown in Figure 4.4 was explained by the fact that the continuous process of producing wood billets was accompanied by saw dust being exposed within the area hence the presence of continuous peak levels. The existence of dust particles in the machine hall was due to probable leakages in the cyclone which is used to filter the gas before it is led to the scrubbing unit for further cleaning. Furthermore, the transient peaks shown in Figure 4.5 were also a result of fuel feeding into the reactor which involved automatic opening of the lock hopper doors hence exposure to dust particulates within the machine hall. Based on the NAAQs standards, the significance of these concentrations was that the air quality in the machine hall was moderate while that in the fuel preparation area was unhealthy hence could pose serious long-term health risks such as cough, difficulty in breathing, increase in symptoms of respiratory disease to personnel operating in this section[Fierro, 2000].

35
4.6.4 CO exposure inside Kyambogo installation The results of the 50 minute CO concentration within the installation were tabulated in Table B5, Appendix B and shown in the Figure 4.6.
Figure 4.6 CO concentration levels at the engine and reactor. From the above results, CO concentration near the reactor ranged from 21 to 201ppm respectively. Based on the short term TLV of 50ppm, 6 out of the 10 observations were above this limit with an average of about 100ppm. On the other hand, at the engine -generator set side, the concentration ranged from 56 to 320ppm where all the observations were above the short term exposure TLV limit. From this, it was observed that the CO concentration at the gasifier side was lower than that at the engine-generator set side. This was explained by the fact that the exhaust stack of the gas engine was within the same building as the reactor at the time of the installation and testing. Furthermore, the machine hall housing the reactor and engine generator set was not well ventilated. Based on the clinical symptoms of CO exposure, this average CO concentration of 176ppm in the building would pose threats of slight headache and dizziness to personnel in the short term. However, considering the long-term effects of CO exposure, these concentration levels pose health threats of loss of memory, increased irritability, impulsiveness, mood changes, verbal aggression, learning disabilities, mental deterioration and instability while walking to personnel.

36
4.6.5 Engine stack emissions from Kyambogo installation
The exhaust stack emissions of the gas engine were monitored for two sessions of the day. The results were tabulated in Tables B6 and B7, Appendix B and shown in Figures 4.7 and 4.8.
Figure 4.7 Stack emissions of gasifier engine at Kyambogo plant for first monitoring period from 10.00 to 10.45am
Figure 4.8 Stack emissions of gasifier engine at Kyambogo plant for second monitoring period from 11.00 to 11.55am

37
Based on the results above, the average concentration levels of CO, UHC were high in the first monitoring period than in the second monitoring period. The existence of a higher UHC concentration in the first period was explained by the non stable state of the gas engine due to poor combustion process at the time of installation. In the second monitoring period, the UHC concentration levels dropped implying a stable burning condition in the engine. The average CO levels for both the test periods were below the recommended international standard limits for CO emissions for engines running on producer gas which is estimated at 2000ppm. On the other hand, the peaks for the emissions in both the monitoring periods were transient which draws a conclusion that the system had not stabilized. 4.6.7 PM concentration inside the Kyambogo installation
The concentration of PM inside the reactor and engine building was monitored continuously for a period of one hour and the results are shown in the Figure 4.9.
Figure 4.9 PM concentration inside the Kyambogo plant
The results indicated a peak and low PM concentration of 9797 and 0µg/m3 respectively. The peak concentration value which lasted for about 3 minutes can be explained by the existence of dust particles leaking in the building due to the absence of a cyclone. The absence of the cyclone is based on the design of the plant which did not incorporate it. Manual addition of fresh biomass feedstock also led to increment in the level of particulate matter within the installation which was also justified by the transient peak in the PM concentration graph.

38
Except the time during refueling of the reactor, the average concentration was recorded at about 500µg/m3. The significance of this value based on the NAAQS standards is that it was highly hazardous to human life and continuous exposure would expose personnel to long-term health risks related to the respiratory system [Fierro, 2000]. 4.6.8 CO exposure at Makerere University gasifier
The experimental results of the 85 minute CO concentration within the installation are tabulated in Table B8 Appendix B and shown in the Figure 4.10.
Figure 4.10 CO concentration levels recorded at Makerere gasifier.
From above, it was observed that the real time concentration of CO within the installation ranged from a low of 0ppm to a high of 64ppm at the same sampling location around the reactor. The peak CO concentration of 64ppm occurred at the time when the process was starting where the flame was unstable at the flare. Furthermore, this was the only observation recorded to be above the acceptable short term exposure TLV. However, another peak which existed at about 42ppm for about 10 minutes was due to leakages due to refueling of the reactor though was observed to be below the exposure standards. The reason for the low concentration of CO within the installation at the time is based on the fact that the gasifier is housed in a well ventilated environment. The average CO concentration except during the peaks was about 10ppm for about 70 minutes. From the acceptable CO TLV of 50ppm for an 8 hour working day, this mean value of CO concentration was considerably very low and thus had no significant health effects to personnel within or around the installation.

39
4.6.9 PM concentration measured at the Makerere installation
Real time values of the concentration of PM inside the plant were measured continuously for a period of 112 minutes as presented in the Figure 4.11.
Figure 4.11 PM concentration at Makerere gasifier installation The PM concentration levels at Makerere gasifier ranged from levels of 0µg/m3 to a maximum of 2880µg/m3. The transient peaks shown between 50 to 60 minutes occurred during the refueling of the reactor with fresh agricultural residues where the lid had to be removed manually hence exposure to dust within the gasifier building. Except during the time of refueling, the average particle concentration of about 120 µg/m3 was recorded. Based on the NAAQ standards, this PM concentration value does not pose significant effects on personnel. 4.7 Explosion hazards Temperatures and pressures at the Muzizi installation were at time intervals monitored at different sections during the gasifier operation. The average values are shown in Figure 4.12.
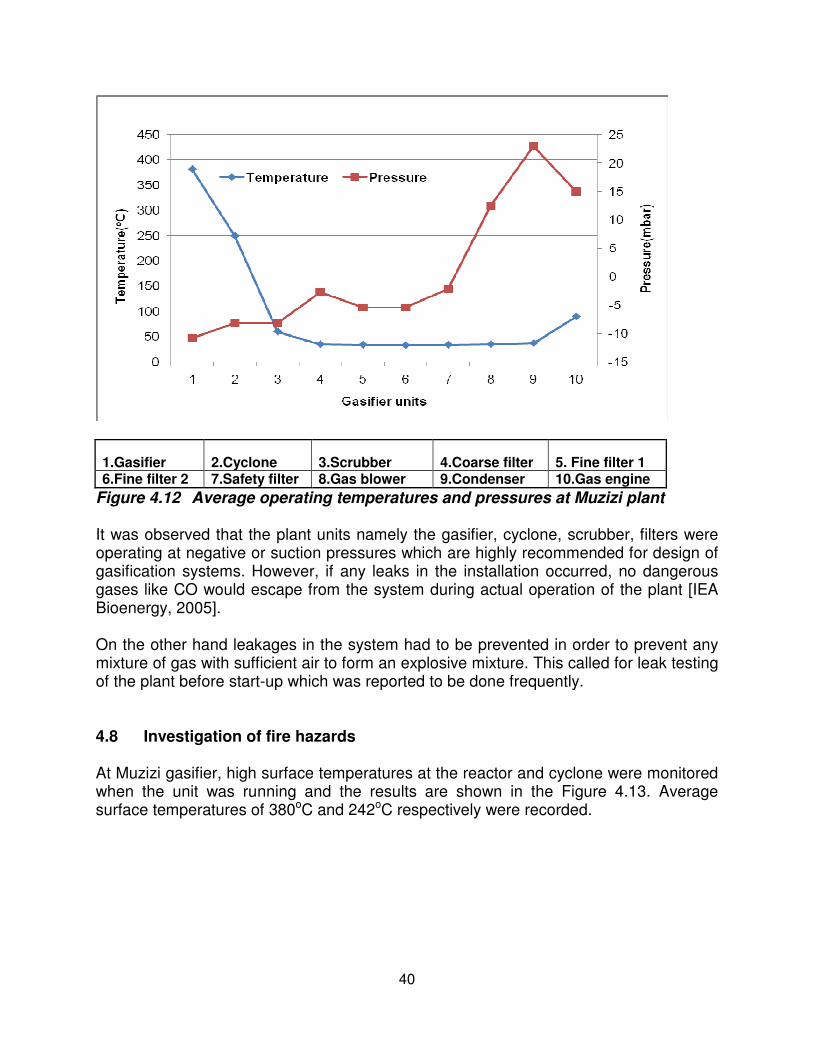
40
1.Gasifier 2.Cyclone 3.Scrubber 4.Coarse filter 5. Fine filter 1 6.Fine filter 2 7.Safety filter 8.Gas blower 9.Condenser 10.Gas engine
Figure 4.12 Average operating temperatures and pressures at Muzizi plant It was observed that the plant units namely the gasifier, cyclone, scrubber, filters were operating at negative or suction pressures which are highly recommended for design of gasification systems. However, if any leaks in the installation occurred, no dangerous gases like CO would escape from the system during actual operation of the plant [IEA Bioenergy, 2005]. On the other hand leakages in the system had to be prevented in order to prevent any mixture of gas with sufficient air to form an explosive mixture. This called for leak testing of the plant before start-up which was reported to be done frequently. 4.8 Investigation of fire hazards At Muzizi gasifier, high surface temperatures at the reactor and cyclone were monitored when the unit was running and the results are shown in the Figure 4.13. Average surface temperatures of 380oC and 242oC respectively were recorded.

41
Figure 4.13 Variation of surface temperatures of the reactor and cyclone at Muzizi plant. At Makerere gasifer, average surface temperatures of the reactor were measured at 200oC while that at Kyambogo gasifier were recorded at 240oC. These temperatures were unsafe since they were outside the STT range of 56oC to 100oC [Subramanian et al., 1998]. 4.9 Water pollution The gasification processes at Muzizi Tea estate and Kyambogo installations had a scrubber system incorporated which meant that these systems operate by disposal of scrubber water from the scrubber ponds which is known to be highly toxic based on its composition [Jönsson et al., 2005]. At Muzizi plant it was reported that the sludge from the pond is removed from time to time and disposed off a distance away from the plant without any proper precautions in place. In addition, there were no present and future methods in place for the proper handling of the waste water in terms of its dilution, secondary treatment before its final inland disposal. Furthermore, there was no information regarding the amount of waste water discharged from the systems, there were no records at these installations.

42
4.10 Safety Risk Assessment of the installations 4.10.1 Risk model In determining safety risks associated with the operation of the installations, the following model was used for calculating the level of risk:
FxSR = ……………………………………………………………..…………………….. (a) Where: R=Risk rating. F=Frequency/Probability of occurrence of the hazardous event. S=Severity/consequence of the hazardous event. 4.10.2 Frequency Rating Table
Each identified hazard within the installation was rated in accordance with the numerical ratings and definitions as shown in Table 4.6 Table 4.6 Hazard likelihood ranking
Rating Notation Description Frequency range
1 Extremely unlikely No recorded incidence. < 10-6 per year
2 Very unlikely Very few recorded or known incidents. 10-6 to 10-4 per year
3 Unlikely Occur infrequently. Possibility exists. 10-4 to 10-2 per year
4 Improbable Incidents occur regularly with medium frequency. 10-2 to 1 per year
5 Probable Frequent incidents and strong likelihood for re- occurrence. > 1 per year
4.10.3 Consequence rating Table
The severity of each hazard as shown in Table 4.7 was divided into three categories namely:
• Personnel (human beings) such as students, operators, visitors to the installations.
• Environment. • Property and goods.

43
Table 4.7 Hazard consequence/severity rating [IEE, 2008]
CONSEQUENCES
Category Minor Significant Severe Major Catastrophic
Rating 1 2 3 4 5
Personnel
No/light injury < 3 days lost time
injury 3- 28 days lost time
severe injury < 56 days lost
disamblement,death 56+ days lost
Multiple fatalities, permanent injury death
Environment
Temporary, short term damage
long lasting, slightly increased emissions
severe pollution widespread damage
catastrophic damage
Property and goods
no plant shut down
plant stop,warm,start possible standstill of plant <2 days
stand still of plant 1 to 3 weeks
standstill of plant >8 weeks
Enormous plant destruction/ damage to whole plant
4.10.4 Risk category The following risk matrix in Figure 4.14 was used in determining the risk category.
Frequency/Severity
Minor
(1)
Significant
(2)
Severe
(3)
Major
(4)
Catastrophic
(5)
Probable
(5) 5x1 = 5 5x2 = 10 5x3 = 15 5x4 = 20 5x5 = 25
Improbable
(4) 4x1 = 4 4x2 = 8 4x3 = 12 4x4 =16 5x4 = 20
Unlikely
(3) 3x1 = 3 3x2 = 6 3x3 = 9 3x4 = 12 3x5 = 15
Very unlikely
(2) 2x1 = 2 2x2 = 4 2x3 = 6 2x4 = 8 2x5 = 10
Extremely unlikely
(1) 1x1 = 1 2x2 = 4 1x3 = 3 1x4 = 4 1x5 = 5
Figure 4.14 Risk quantification and evaluation matrix
4.10.5 Hazard Rating Number
The risk rating values were grouped into three broad classes as shown in Table 4.8.
Table 4.8 Hazard rating and interpretation
Hazard rating number Interpretation of risk level
1 to 4 Acceptable Risk 4 to 9 ALARP
10 to 25 Unacceptable Risk

44
4.10.6 Description of risk levels Acceptable risk A risk identified as acceptable was considered as low and further reduction was not necessary. The term "Acceptable risk" describes the likelihood of a hazardous event whose probability of occurrence is small, whose consequences are so slight. ALARP This is referred to as a medium risk required a planned approach to controlling the hazard and applied temporary measure if required. For ALARP risks, the cost involved in reducing the risk further would be grossly disproportionate to the benefit gained hence needed further discussions. Unacceptable risk A risk or hazard identified as Unacceptable is a HIGH risk which requires immediate action to control the hazard as detailed in the hierarchy of control. Actions taken must be documented on the risk assessment form including date for completion.
4.11 Risk Assessment results
Based on the hazard identification, review of existing hazard control measures and operating documentation, the safety risks at each installation were assessed according to the model discussed in section 4.10.1 above by combining the frequency with the severity of each hazardous event. Table 4.9 Risk Rating Analysis results Muzizi Tea estate plant
Hazardous event
Lik
elih
oo
d
Co
nseq
uen
ce
Ris
k R
an
kin
g
Resu
lt
Fuel storage and drying unit Fire outbreak due to possible burning of feedstock 2 5 10 UNACCEPTABLE
Fuel preparation and feeding
Particulate matter exposure 5 3 15 UNACCEPTABLE
Frequent failure of automated fuel feeding system 4 4 16 UNACCEPTABLE
Gasifier reactor

45
Poor charcoal and ash disposal 5 2 10 UNACCEPTABLE Gas Leakages and air penetration during fuel feeding 5 4 20 UNACCEPTABLE
Hot surfaces of the reactor 5 3 15 UNACCEPTABLE Gas coatings on doors of the reactor and lock hopper 3 2 6 ALARP
Pressure buildups 2 2 4 ACCEPTABLE
Operating errors 4 3 12 UNACCEPTABLE
Flames through reactor nozzles 3 3 9 ALARP
Cyclone and gas cooling
Hot surfaces 5 3 15 UNACCEPTABLE
Leakage of media, dust 2 3 6 ALARP
Water scrubber
Leakage of scrubbing agent 3 2 6 ALARP
Hot surfaces 5 3 15 UNACCEPTABLE
Poor disposal sludge and waste water from pond 4 3 12 UNACCEPTABLE
Dedusting(filtering)
Saw dust leakages 2 2 4 ACCEPTABLE
Operating errors 3 3 9 ALARP
Gas conditioning and transport
Gas leakages and air leakages into system 4 3 12 UNACCEPTABLE
Gas engine and generator
Noise levels due to vibrations 3 2 6 ALARP
Harmful exhaust emissions 5 3 15 UNACCEPTABLE
Hot surfaces 5 3 15 UNACCEPTABLE
Gas leakages 3 3 9 ALARP
Operator errors 2 5 10 UNACCEPTABLE
Flames through engine exhaust stack 3 5 15 UNACCEPTABLE
Flare burnoff
Burning off excess gas 2 1 2 ACCEPTABLE
Hot surfaces 5 3 15 UNACCEPTABLE
The unacceptable hazardous events at the installation were summarized according to their ranks as shown in Table 4.10.
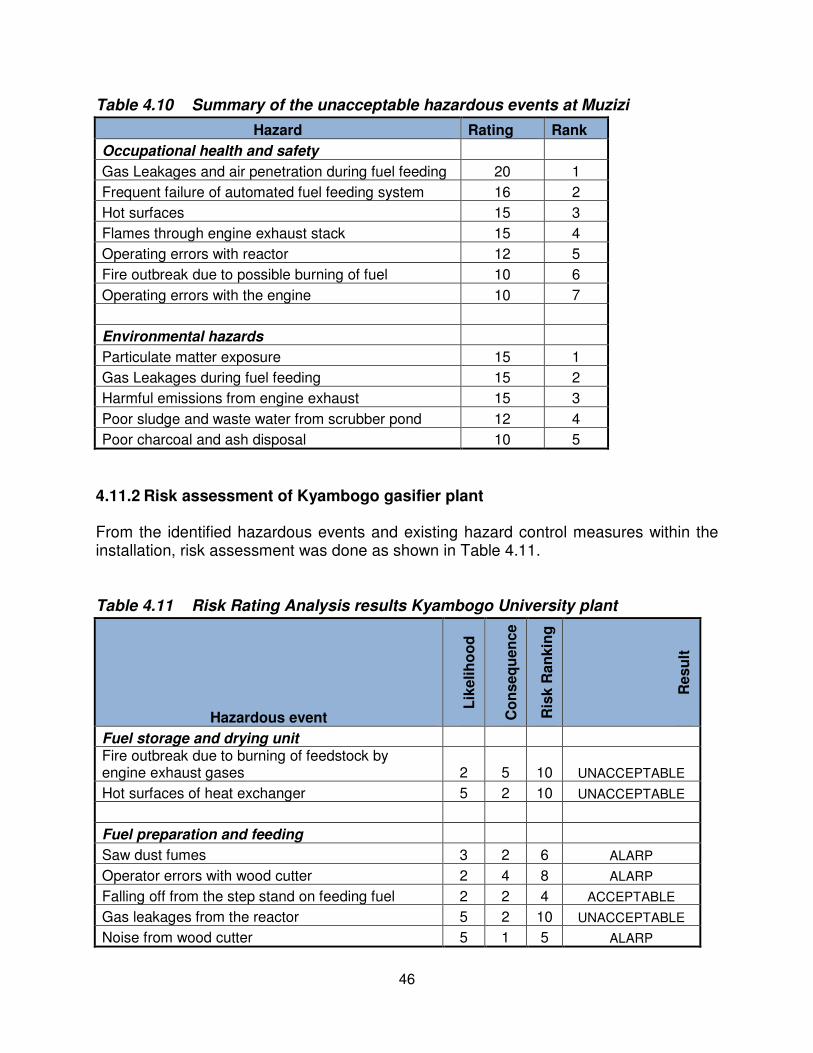
46
Table 4.10 Summary of the unacceptable hazardous events at Muzizi
Hazard Rating Rank
Occupational health and safety Gas Leakages and air penetration during fuel feeding 20 1 Frequent failure of automated fuel feeding system 16 2 Hot surfaces 15 3 Flames through engine exhaust stack 15 4 Operating errors with reactor 12 5 Fire outbreak due to possible burning of fuel 10 6 Operating errors with the engine 10 7 Environmental hazards Particulate matter exposure 15 1 Gas Leakages during fuel feeding 15 2 Harmful emissions from engine exhaust 15 3 Poor sludge and waste water from scrubber pond 12 4 Poor charcoal and ash disposal 10 5
4.11.2 Risk assessment of Kyambogo gasifier plant
From the identified hazardous events and existing hazard control measures within the installation, risk assessment was done as shown in Table 4.11. Table 4.11 Risk Rating Analysis results Kyambogo University plant
Hazardous event
Lik
elih
oo
d
Co
nseq
uen
ce
Ris
k R
an
kin
g
Resu
lt
Fuel storage and drying unit Fire outbreak due to burning of feedstock by engine exhaust gases 2 5 10 UNACCEPTABLE
Hot surfaces of heat exchanger 5 2 10 UNACCEPTABLE
Fuel preparation and feeding
Saw dust fumes 3 2 6 ALARP
Operator errors with wood cutter 2 4 8 ALARP
Falling off from the step stand on feeding fuel 2 2 4 ACCEPTABLE
Gas leakages from the reactor 5 2 10 UNACCEPTABLE
Noise from wood cutter 5 1 5 ALARP

47
Gasifier reactor
Poor char disposal 5 2 10 UNACCEPTABLE Gas leakages, PM from the reactor during combustion 5 3 15 UNACCEPTABLE
Hot surfaces of the reactor 5 3 15 UNACCEPTABLE
Pressures fluctuations(back firing) 3 4 12 UNACCEPTABLE
Noise and vibrations from vibrator motor 3 3 9 ALARP
Operating errors by technicians. 3 4 12 UNACCEPTABLE Air leakages through refuelling on opening of the reactor lockhopper. 4 5 20 UNACCEPTABLE
Flames through the gasifier reactor nozzles. 2 2 4 ACCEPTABLE
Backfires through the air nozzles 3 4 12 UNACCEPTABLE
Water scrubber and drain box
Leakage of scrubbing agent, water 2 2 4 ACCEPTABLE
Hot surfaces of the scrubber 3 2 6 ALARP
Poor disposal of sludge from the scrubber pond 4 3 12 UNACCEPTABLE
Unprotected scrubber pond 5 4 20 UNACCEPTABLE
Dedusting(filtering)
Saw dust fumes 1 2 2 ACCEPTABLE
Operating errors 2 3 6 ALARP
Gas conditioning and transport
Gas leakages, air leakages into system 3 3 9 ALARP
Gas engine and generator
Noise due to vibrations 5 2 10 UNACCEPTABLE
Harmful emissions from wood gas engine stack 5 3 15 UNACCEPTABLE
Hot surfaces at the engine 3 3 9 ALARP
Operating errors by technicians 2 5 10 UNACCEPTABLE
Flames from engine exhaust stack 3 4 12 UNACCEPTABLE
Flare burnoff
Hot surfaces 1 4 4 ACCEPTABLE
Poor flare burnoff installation 5 4 20 UNACCEPTABLE
The unacceptable risks were then summarized according to their ranks as shown in Table 4.12.

48
Table 4.12 Summary of the unacceptable hazardous events at Kyambogo
Hazard Risk Rating Rank
Occupational health and safety Air leakages through refuelling 20 1 Poor flare burnoff installation 20 2 Unprotected scrubber pond 20 3 Hot surfaces of the reactor 15 4 Falling from the step stand on refueling 12 5 Pressure fluctuations 12 6 Operating errors by technicians 12 7 Flames from engine exhaust 12 8 Fire outbreak due to burning of feedstock 10 9 Hot surfaces of heat exchanger 10 10 Hot surfaces of scrubber 10 11 Environmental hazards Gas leakages, PM from reactor 15 1 Harmful emissions from gas engine 15 2 Sludge accumulation from scrubber pond 12 3 Gas leakages from reactor during fuel feeding 10 4 Noise levels and vibrations 10 5 Poor charcoal disposal 10 6
4.10.3 Risk assessment of Makerere University gasification rig From the identified hazardous events and existing hazard control measures within the installation, risk assessment was done as shown in Table 4.13. Table 4.13 Risk Rating Analysis results Makerere University installation
Hazardous event
Lik
elih
oo
d
Co
nseq
uen
ce
Ris
k R
an
kin
g
Resu
lt
Fuel storage and feeding Falling off from the weak step stand on refuelling 5 2 10 UNACCEPTABLE
Exposure to pyrolytic gases, heat and PM 5 2 10 UNACCEPTABLE
Air penetration into reactor on refuelling 4 3 12 UNACCEPTABLE
Fire outbreak due to possible burning of residues 3 4 12 UNACCEPTABLE

49
Gasifier reactor
Hot surfaces of reactor 5 2 10 UNACCEPTABLE
Char and ash disposed around reactor 5 2 10 UNACCEPTABLE
Backfiring 2 4 8 ALARP
Gas and PM leakages 5 1 5 ALARP
Operating errors by technicians 2 4 8 ALARP
Flames through air nozzles 2 3 6 ALARP
Pressure fluctuations 2 4 8 ALARP
Gas cleaning unit(cyclone)
Hot surfaces 5 2 10 UNACCEPTABLE
Dust and gas leakages 2 2 4 ACCEPTABLE
Gas transport unit Gas leakages around the blower, air leakages into system 3 4 12 UNACCEPTABLE
Pressure fluctuations inside hose pipe 2 2 4 ACCEPTABLE
Hot surfaces 5 2 10 UNACCEPTABLE
Gas sampling unit
Tar accumulation 5 2 10 UNACCEPTABLE
Producer gas leakages 2 2 4 ACCEPTABLE
Operating errors 2 3 6 ALARP Hot surface of tube connecting gasifier to sampling unit 5 2 10 UNACCEPTABLE
Flare burnoff
Flare gas released atmosphere 5 1 5 ALARP
Burning off excess gas 4 4 16 UNACCEPTABLE
The risks unacceptable were then summarized according to their ranks as shown in Table 4.14.
Table 4.14 Unacceptable hazardous events at Makerere University rig
Hazard Risk Rating Rank
Occupational health and safety Burning off excess gas at the flare 16 1 Air penetration into reactor on refuelling 12 2 Fire outbreak due to possible burning of residues 12 3 Gas leakages around the blower, air leakages 12 4 Falling off from the weak step stand on refuelling 10 5

50
Hot surfaces 10 6 Environmental hazards Char and ash disposed around reactor 10 1 Exposure to pyrolytic gases and fuel particulates 10 2 Noise from vibrations 10 3 Tar accumulation 10 4
4.12 Summary of Risk Assessment Results
Figures 4.15, provides the risk assessment results for the gasifier installations. It summarizes the risk assessment findings as documented in Tables 4.9, 4.11 and 4.13 respectively.
Figure 4.15 Summary of risk assessment findings
From Figure 4.15, a total of 26, 30 and 22 risks related to the identified hazardous events were observed at Muzizi Tea estate, Kyambogo University and Makerere University gasifier installations respectively. This implies that Kyambogo University installation recorded the highest number of risks followed by Muzizi Tea estate and Makerere University respectively. This was explained by the technology and system description of both Kyambogo University installation and the Tea estate gasifier at Muzizi which had more components than the one at Makerere University. In addition, Kyambogo University reported the highest number of Unacceptable risks followed by Muzizi Tea estate and lastly Makerere University. The results from the risk assessment showed that exposure to toxic gases like CO and particulate matter pose great health
51
risks to personnel followed by fire and explosion hazards respectively. The assessment also found out that the identified HSE risks could be fully mitigated through the implementation of additional controls to supplement on the existing safety control measures in place. 4.13 Comparison of HSE practices at the installations Since safety does not depend on successful plant design but also on management and work practices, it was observed from that there were differences regarding HSE aspects among the installations. Muzizi Tea estate unlike the other installations expressed higher levels of management and work practices in regard to safety. For this reason, more efforts have to be done at the installations in order to provide insights into the process of improving the safety culture.

52
CHAPTER FIVE: CONCLUSION AND RECOMMENDATIONS 5.0 Conclusion As gasification is considered as being one of the most sustainable routes for heat and power production due to its several potential benefits, the findings of the study indicated that the topic of HSE issues regarding the technology have not been addressed in depth at the three installations in Uganda. Firstly, there is limited attention paid to the legislation aspects on product liability, technical and non technical operating aspects of gasifier plants in Uganda. Furthermore there is lack of clear documentation related to the HSE aspects of the installations. Aspects such as information on moving parts, hot surfaces, combustible gas and explosive gas mixtures, expected toxicity of the producer gas and liquid effluent, emissions through leakages and exhaust, ambient conditions of the installations were are not clearly documented. Secondly, there are limited regulatory standards and limits on safety, allowable gaseous, solid and liquid emissions from the gasification processes in Uganda. This is greatly attributed to lack of sufficient knowledge and awareness of the risks associated with the technology. However, with clear attention paid to HSE issues, the operation of gasifiers in Uganda for both thermal and electrical applications is possible and of great importance. 5.1 Recommendations Based on the hazards and safety analysis results from each of the gasifier installation, additional safety control measures aimed at eliminating the hazards or preventing them from harming personnel, property and the environment within which the installations operate are necessary. It is generally recommended that;
• Strict measures to enforce safety procedures at gasifier installations should be put in place. Here, instructions and equipment for onsite treatment of CO poisoning should be availed. Furthermore, operators should wear personal protective equipment during gasifier operations and medical assistance should be availed on site on short notice in case of CO poisoning.
• High temperature insulation of the hot surface equipment such as the cyclone and reactors should be done.
• It is recommended that warning and “Do Not Touch” signs be designed or placed on the hot surface equipment such as at the cyclone and the reactor.
• Due to the potential fires that could occur during the operation of the gasifiers, fire extinguishers should be placed permanently inside the gasifier buildings.
• CO, PM, fire alarms and noise detectors should be incorporated permanently at gasifier installations. This will help in alerting the operators on the levels of
53
concentration within the installation to take appropriate measures to ensure safety of the facility and the environment.
• Training of gasifier operators on HSE issues regarding treatment of people poisoned by CO should be done regularly to keep operators informed of what to do or not.
• The plants should be equipped with possibilities for pressure relief in case of internal explosions.
• Safe working procedures for the operation of the gasifier system such as start up and shut down should be written and displayed within the building. This should be updated when new equipment is installed.
• As with the Muzizi gasifier, separate sheds for storage of biomass feedstock should be put in place at the Makerere and Kyambogo installations. This avoids the risks of fire outbreak. In addition, this creates enough space within the gasifier building.
• As a long term control measure, automatic mechanical feeding of biomass residues should be considered at the Makerere and Kyambogo gasifiers. This will imply that personnel need not go nearer the charging lid hence reducing their exposure to the pyrolytic gases during manual feeding.
• Since the study was limited to the hazards and safety issues of the gasification plants while in regular operation, a similar exercise should also be done to include also start-up, shut down and maintenance of the plants.
Specific recommendations for the gasifier installations include the following. 5.1.1 Muzizi gasifier installation
• A glass cage should be built around the control panels within the building in order to protect operators of the reactor most especially the fuel feeding process which uses a controlled elevator. This would ensure that individuals are not exposed to CO for hours which render them to significant health problems.
• Considering that the average measured CO concentration was above the acceptable limit, options of flue gas cleaning e.g by use of a catalytic reactor. This could be used as an experience from gas cleaning concepts used at gasification plants internationally such as Emmenbrücke plant in Europe.
• Since the sludge collected in the scrubber pond is removed from time to time, it is recommended that this sludge is dewatered and land filled in a separate place a distance away from the power plant following proper precautions. Waste water treatment should also be considered by the power plant/Tea estate authorities in the long run.
• Regular maintenance of the reactor should be encouraged. This will involve removal of the carbon deposits or pyrolytic gas coatings on the inner door of the lockhopper. The presence of the carbon deposits prevent the proper sealing of the door hence leading to penetration of the air during the refueling of the reactor which led to a fire explosion through the reactor nozzles. This injured

54
one personnel who was observing the status of glowing particles within the reactor by looking straight through the nozzles instead of using a mirror.
• Records of the amount of solid and liquid waste or effluent discharged on a daily basis from the gasification process should be made and kept. Such wastes include char, waste waters from the gas cleaning and cooling sections and ash from the reactor. Keeping records of such waste would assist in devising proper solid waste and effluent management practices aimed at reduction of the potential environmental risks.
5.1.2 Makerere University gasifier rig
• A metallic step stand should be fabricated and well guarded to ensure safety of the personnel refueling the reactor with biomass. It was observed that; the current step stand is wooden and is very weak hence posing high risks of personnel falling off and could easily catch fire in case of a fire explosion. Therefore a metallic stand would achieve a lot in mitigating these risks.
• A separate shed or building should be put in place for the storage of the agricultural residues for the gasifier. Currently all the residues are stored in the same building housing the reactor. In case of a fire outbreak, the residues would catch fire causing damage to property. Separate storage of the residues will ensure that their conditions are kept at the required levels while avoiding risks of fire outbreak. In addition, creation of a separate building for residue storage will create enough space within the gasifier building which is not enough at the moment.
• Pressure and high temperature indicators or instrumentation should be placed at appropriate places especially on the reactor. These will act as warning signals for any abnormal operation of the system.
5.1.3 Kyambogo Gasifier installation The scrubber pond used for disposal and recirculation of the cleaning and cooling water for the scrubber system needs to be well protected by enclosing it in a separate building. This will reduce on the risks caused by individuals falling into the pond and any foreign material that could block the scrubber pump hence damaging the system. 5.1.4 Stakeholders and Government
• The legal and regulatory framework to handle emissions from biomass gasification technologies issues needs to be formulated and harmonized with existing but related legislation and regulations. Through this, government as a permitting authority should seek measures aimed at regulating emissions with the gasifier installations and any other heat and power plants. Limits on the gaseous emissions and their properties have to be set through legislations in order to ensure that they are in compliance with the international standards.

55
This could be done by drawing experiences from technical guidelines and comparison with legislations from other countries hence giving an idea of setting the relevant operating standards for biomass gasification plants in Uganda. Furthermore, in setting limits for gasification technology, other related technologies such as thermal power plants should also be put in consideration.
• Government should set standards and precautions for disposal of waste waters (sludge) and effluent from the gasification processes in Uganda as with the case for municipal waste waters. This should also be done by setting a time frame through which operators of the existing plants and future plants provide information regarding the composition of the waste being disposed. These standards should be set in line with the sewerage and municipal waste standards present in Uganda today. Furthermore, as a measure aimed at promoting the biomass gasification technology in Uganda, safety standards should also be set by stakeholders. There should also be a follow up by government in ensuring that all the standards and codes are implemented.

56
REFERENCES
Andreatta et Al., 2006; “The Effects of Carbon Monoxide and Particulates on the Human Body” http://www.vrac.iastate.edu/.../Effects%20of%20Emissions%20on%20the%20Human%20Body%2 ATTAR, 2004; “Hazard and Risk management Procedure” http:// www.workcover.vic.gov.au Bridgewater et Al., 1998; “An Assessment of the Possibilities for Transfer of European Biomass Gasification Technology to China” EU working group survey report.
Chang M, 2009; “Biomass Power Plant” http://www.alibaba.com/productgs/212967353/Biomass_Gasification_Power_Generation_System.html
Covello et Al, 1999; “Risk Analysis” http://fao.org/docrep/fao/010/i0035e/i0035e03.pdf
Cusco L, 2005; “Standards-Good practice and goal setting, UK regulatory perspective, UK HSE Laboratory” Conference paper, IEA – Thermal Net meeting, Innsbruck, 2005 Dickinson T, 2006; “An assessment of Gasification as an alternative technology for the Disposal of slaughterhouse waste” Thompson Rivers University, Kamloops British Columbia
FAO, 1986; “Wood gas as an engine fuel” Health and environmental hazards associated with use of producer gas, ftp://ftp.fao.org/docrep/fao/t0512e/t0512e00.pdf Fierro M, 2000; “Particulate Matter” http://www.airinfornow.com/Particulate_Matter.pdf

57
Fierro M et Al, 2001; “Adverse health effects of exposure to CO” University of Arizona, College of Public Health
Furnsinn S. et Al., 2005; “Thermal Gasification of Biomass, International Workshop on Health, Safety and Environment of Biomass Gasification” September 28, 2005, Innsbruck, Australia
Girard P, 2008; “An integrated network on thermal biomass conversion for power, heat and transport fuels, Environment, Health and Safety” Thermal Net Vienna Austria, Intelligent Energy Europe IEA Bioenergy, 2005; “Workshop on Health, Safety and Environment” Innsbruck, Australia Industrial Accident Prevention Association, 2008; “Carbon monoxide in the workplace” http://www.iapa.ca
Intelligent Energy Europe, 2008; “Guideline for safe and eco-friendly biomass gasification” Grant agreement no. EIE/06/078/S12.447511
Jonsson et Al, 2005; “Composition and Treatment of Waste water from Gasifiers” Department of Water and Environmental Engineering, Lund University of Technology
Knoef H, 2005; “Handbook Biomass Gasification” BTG biomass technology group
La Trobe University, 2001; “Risk assessment and control procedure” La Trobe University Occupational Health and Safety manual
Rambush N. E, 1923; “Modern gas producers” Benn Brothers Limited
Rauch, 2005; “Formation, treatment and avoiding of waste water” Vienna, University of Technology, Institute of Chemical Engineering

58
Reed T. B et Al., 1988; “Handbook of biomass downdraft gasifier engine systems” Solar Energy Research Institute Technical library, Golden Colorado. SANS Institute, 2002; “An Overview of Threat and Risk Assessment” http:// live.sans.org/reading.../an_overview_of_threat_and_risk_assessment_76 Subramanian et al, 1998; “Safe touch temperatures for hot plates” Research article summary, University of Illinois Department of Mechanical and Industrial Engineering Tetra Tech, 2006; “Hazard Evaluation and Risk Assessment” http:// dma.mt.gov/des/Library/2007_PDM_Plan...6.../Section_3_RA.pdf Timmerer et Al., 2005; “Overview, Risk Assessment at Biomass Gasification Plants” International Workshop on HSE, Innsbruck 2005
Turare C, 1998; “Biomass Gasification Technology and Utilization” ARTES Institute Glucksburg, Germany
Vogt D, 2008; “Risk Analysis” Presentation, Measurement Technique Course MJ 2440, Sustainable Energy Engineering, Royal Institute of Technology (KTH), Dept. of Energy Technology Stockholm Sweden, 2008-10-27
WHO, 2005; “Particulate matter air pollution” Fact sheet EURO/04/05, Berlin, Copenhagen, Rome, 14 April 2005

59
APPENDICES
APPENDIX A: LAYOUT OF THE GASIFIER INSTALLATIONS
CF- Coarse Filter FF-Fine Filter SF-Safety Filter AF-Air Filter
Figure A1 Flow diagram of Muzizi Tea estate Power plant (Source: Muzizi Tea estate)

60
Figure A2 Flow diagram of Kyambogo University gasifier plant (Source: Uganda MEMD)
KEY
1. GASIFIER 2. VENTURI SCRUBBER 3. WATER JUNCTION BOX 4. DRAIN TUB 5. FINE FILTER 6. SAFETY FILTER 7. FLARE WITH VALVE 8. CONTROL PANEL 9. ENGINE 10. WOOD DRYER 11. DOUBLE DOOR ASSEMBLY

61
Air Air
1
2
3
Flare
Producer gas to samplingunit for analysis
Biomass Fuel
Ashes and char
4
Figure A3 Flow diagram of Faculty of Technology, Makerere university Gasifier rig
KEY
1. GASIFIER REACTOR 2. CYCLONE 3. CONDENSING UNIT 4. SUCTION BLOWER

62
APPENDIX B: EXPERIMENTAL RESULTS
Table B1 Measured CO concentration (ppm) in the Muzizi installation
Time (minutes) CO reactor side CO engine side
0 38 9 7 51 13
14 85 20 21 59 10 28 150 12 35 101 40 42 80 15 49 76 25 56 100 20 63 102 26
Average 84.2 19
Table B2 Engine stack emissions monitoring period one at Muzizi Tea estate
plant
Time(minutes) CO (%) CO(ppm) UHC(ppm) O2 (%) CO2(%)
0 0.27 2700 1 16.7 17.6 5 0.31 3100 1 17.0 3.52
10 0.26 2600 1 3.6 15 15 0.24 2400 1 15.5 16.1 20 0.29 2900 1 17.6 2.64 25 0.23 2300 0 2.22 17.6 30 0.24 2400 1 2.1 18 35 0.23 2300 1 2.0 17.5 40 0.25 2500 0 2.0 17.6 45 0.22 2200 1 3.0 18.1
Average 0.25 2540 0.8 8.2 14.4
Table B3 Engine stack emissions monitoring period two at Muzizi Tea estate
plant
Time(minutes) CO (%) CO(ppm) UHC(ppm) O2 (%) CO2(%)
0 0.43 4300 1 14.9 7.1 5 0.41 4100 1 13.8 7.3 10 0.26 2600 95 14.6 6.1 15 0.33 3300 114 14.6 6.1 20 0.34 3400 0 14.6 6.2 25 0.31 3100 57 12.6 8.5 30 0.27 2700 0 17.2 3.2 35 0.34 3400 1 15.9 4.6 40 0.35 3500 95 16 4.9

63
45 0.35 3500 76 15.8 5.0 50 0.3 3000 1 15.6 4.9
Average 0.35 3355 40.1 15.1 5.81
Table B4 Engine stack emissions monitoring period three at Muzizi tea estate
plant
Time(minutes) CO(%) CO(ppm) UHC(ppm) O2 (%) CO2(%)
0 0.24 2400 114 3.1 16.8
10 0.2 2000 1 2.7 17.5
20 0.27 2700 76 2.8 17.6
30 0.29 2900 114 1.9 18
40 0.24 2400 1 1.9 18.1
50 0.25 2500 1 2.6 17.5
60 0.34 3400 38 18.3 6.9
Average 0.26 2614 49 5 16
Table B5 Gasifier/reactor operating temperatures and pressures over Muzizi Tea
estate plant
Time(minutes) Temperature(oC) pressure(mmWG)
0 341 70 7 360 75
14 370 85 21 380 95 28 388 96 35 391 105 42 396 110 49 397 112 56 398 96 63 400 95
Average 382.1 93.9
Table B6 Operating Temperatures of Cyclone at Muzizi Tea estate plant
Time(minutes) Temperature(oC)
0 283 7 251 14 285 21 266 28 265 35 245

64
42 200 49 223 56 295 63 108
Average 242.1
Table B7 Measured CO concentration in the Kyambogo plant machine hall
Time(minutes) CO(ppm) gasifier CO(ppm) engine
0 57 171 5 85 100
10 69 113 15 49 195 20 70 115 25 47 236 30 21 320 35 201 56 40 71 219 45 134 199 50 209
Average 80 176
Table B8 Engine stack emissions over the course of the first test at Kyambogo
plant
Time(minutes) CO % vol CO(ppm) UHC(ppm) CO2% vol
0 0.01 100 1 0.1 5 0.2 2000 304 0.1
10 0.26 2600 779 0.2 15 0.31 3100 1729 0.2 20 0.34 3400 779 0.4 25 0.29 2900 95 0.3 30 0.1 1000 76 0 35 0.16 1600 1 0 40 0.17 1700 1 0 45 0.1 1000 1 0
Average 0.19 1940 376.6 0.13

65
Table B9 Engine stack emissions over the course of the second test at Kyambogo plant
Time(minutes) CO % vol CO(ppm) UHC(ppm) CO2% vol
0 0.06 600 1 0.1 5 0.01 100 0.4 0.2 10 0.01 100 1 0.5 15 0.01 100 1 0.4 20 0.28 2800 1 0 25 0.25 2500 76 0 30 0.21 2100 1 0 35 0.26 2600 1 0 40 0.29 2900 1 0.1 45 0.4 4000 1 0.2 50 0.03 300 1 0.1 55 0.01 100 1 0.5
Average 0.15 1517 7.2 0.18
Table B10 Measured CO concentration at Faculty of Technology gasifier
Time(minutes) 0 5 10 15 20 25 30 35 40 45 50 55 60 65 70 75 80 85
CO(ppm) 64 1 4 1 42 16 4 3 6 13 5 18 0 15 10 7 0 8

66
APPENDIX C: GASIFIER PLANT DESCRIPTION QUESTIONNAIRE
PROJECT TITLE: HAZARD AND SAFETY EVALUATION OF BIOMASS GASIFICATION
INSTALLATIONS IN UGANDA. OBJECTIVE The questionnaire below has been designed in order to obtain information that will be used in describing and defining the biomass gasification plant under consideration. This information will be used in identifying the different hazards at the plant thereby giving a baseline for the proper and detailed conduction of a systematic risk assessment at the plant in a bid to improve the Health, Safety and Environmental (HSE) aspects of the gasifier installation. The information to be collected will be used for academic purposes only. 1.0 PLANT NAME ………………………………………………………………………………………………………………………….. 2.0 BASIC PLANT DATA
Plant Operator Phone Address and email Location District 3.0 PLANT PERFORMANCE DATA
Variable Units Value or quantity
1.Thermal power kWth
2.Electrical power kWel
3.Fuel power kW 4.Volume flow producer gas mn
3/h
5.Heating value producer gas MJ/mn3
6.Fuel/Biomass flow 7.Engine power 8.Expected gas composition 9.Operating hours
kg/hr kW % hrs/day
4.0 GASIFIER PROCESS FUNCTIONS
Process unit Present Absent
1.Fuel storage
2.Fuel feeding and drying
3.Gasifier reactor
4.Gas cooling
5.Gas cleaning
6.Gas conditioning and transport
7.Gas engine
8.Flare burn off
9.Indicate any other
5.0 OPERATING MODES AND UNITS OF EACH FUNCTION This section considers the temperatures; pressure ranges etc at which the plant is operated under different conditions.

67
Function: Fuel storage
Operating modes Normal Original startup Original shut down Original emergency stop
UNITS/COMPONENTS PRESENT 1. ……………………………………………. 3………………………………………………… 2……………………………………………… 4………………………………………………… Function: Fuel Preparation and feeding
Operating modes Normal Original startup Original shut down Original emergency stop
UNITS/COMPONENTS PRESENT 1. ……………………………………………. 3………………………………………………… 2……………………………………………… 4…………………………………………………. Function: Gasifier reactor
Operating modes Normal Original startup Original shut down Original emergency stop
UNITS/COMPONENTS PRESENT 1.………………………………………… 3………………………………………………… 2.………………………………………… 4……………………………………………….. Function: Gas cooling system
Operating modes Normal Original startup Original shut down Original emergency stop
UNITS/COMPONENTS PRESENT 1. ……………………………………………. 3………………………………………………… 2……………………………………………… 4………………………………………………… Function: Gas cleaning system
Operating modes Normal Original startup Original shut down Original emergency stop
UNITS/COMPONENTS PRESENT 1. ……………………………………………. 3………………………………………………… 2……………………………………………… 4…………………………………………………

68
Function: Gas conditioning and transport
Operating modes Normal Original startup Original shut down Original emergency stop
UNITS/COMPONENTS PRESENT 1. ……………………………………………. 3………………………………………………… 2……………………………………………… 4………………………………………………… Function: Producer gas engine
Operating modes Normal Original startup Original shut down Original emergency stop
UNITS/ COMPONENTS PRESENT 1. ……………………………………………. 3………………………………………………… 2……………………………………………… 4………………………………………………… Function: Flare burn off Operating modes Normal Original startup Original shut down Original emergency stop
UNITS/COMPONENTS PRESENT 1. ……………………………………………. 3………………………………………………… 2……………………………………………… 4………………………………………………… Function: Other process function
Operating modes Normal Original startup Original shut down Original emergency stop
UNITS/COMPONENTS PRESENT 1. ……………………………………………. 3………………………………………………… 2……………………………………………… 4………………………………………………… 6.0 AUXILIARY MEDIA
Function Auxiliary media
Solid Liquid Gaseous
1.Fuel storage 2. Fuel feeding and drying 3. Gasifier reactor 4.Gas cooling system 5.Gas cleaning system 6.Gas conditioning and transport 7.Producer gas engine 8.Flare burn off

69
APPENDIX D: HAZARD IDENTIFICATION FORM
HAZARD IDENTIFICATION AND CHARACTERISTICS CHECKLIST
GASIFICATION PLANT NAME: ……………………………………………………………………..
Process unit ID.No. Sub processes Units/components Hazards or events Consequences
1.Fuel storage 1.Dry storage of biomass 1 1 1
2 2 2
3 3 3
2.Fuel feeding and drying 1.Fuel transport 1 1 1
4 4 4
3.Gasifier reactor 1.Air supply 1 1 1
4 4 4
4.Cyclone and gas cooling 1.Gas transport 1 1 1
2 2 2
3 3 3
4 4 4
5.Dedusting 1.Dust removal 1 1 1
4 4 4
6.Gas scrubber 1.Gas scrubbing and transport1 1 1
2.scrubbing media circulation2 2 2
3.waste water treatment 3 3 3
4.scrubbing media treatment4 4 4
10 11 10
11 12 11
7.Gas conditioning and transport 1.Dehumidification 1 1 1
2 2 2
3 3 3
4 4 4
8.Gas engine 1.Gas utilization 1 1 1
2 2 2
4 4 4
9.Flare burnoff 1.Gas burnoff 1 1 1
4 4 4

70
APPENDIX E: SAMPLING SITES INSIDE THE INSTALLATIONS
Figure E1 Fuel preparation area inside Muzizi installation.
PM concentration measurements were taken within this area since it is where fuel billets are prepared plus the saw dust used as a filter media for the producer gas.
Figure E2 Inside the machine hall with the reactor and gas filter line at Muzizi plant.
CO measurements were taken near the reactor next to the control panels were personnel spend time controlling the feeding system and the reactor operations.

71
Figure E3 Engine-generator side inside machine hall at Muzizi plant.
CO measurements were also taken at this side since operating personnel spend time here monitoring the operation of the engine-generator set while taking down records in the daily log-sheet for both the reactor and the engine-generator set.
Figure E4 Reactor with manometers inside kyambogo plant

72
Figure E5 Engine generator set inside Kyambogo plant
Figure E6 Scrubber pond at Kyambogo plant
The scrubber pond was not protected which posed a great risk of foreign material blocking the circulation of water through the gas cooling system. Furthermore; this was dangerous to the safety of individuals and personnel.

73
Figure E7 Reactor and wooden step stand at Faculty of Technology rig
Figure E8 Agricultural residues inside installation at Makerere
Agricultural residues are stored in the same building housing the reactor at Makerere University installation. This would increase on the risk caused by potential fire outbreaks within the installation hence calling for a separate building for storage of the biomass residues.


