Has the Propensity to Pay Out Declined? - Rice Universitygrullon/pub/JFQA_2009_2.pdf · Has the...
42
Has the Propensity to Pay Out Declined? Gustavo Grullon Rice University [email protected] 713-348-6138 Bradley Paye Rice University [email protected] 713-348-6030 Shane Underwood Rice University [email protected] 713-348-6341 James Weston Rice University [email protected] 713-348-4480 We thank Alex Butler, Yaniv Grinstein, and doctoral students at the University of Texas at Dallas, as well as seminar participants at the University of South Florida, University of Notre Dame, Rice University, University of Virginia, the Batten Conference at the College of William and Mary, and the 2008 Western Finance Association Meetings for useful comments. We also thank Boyan Jovanovich and Peter L. Rousseau for providing us with age data. All remaining errors are our own.
-
Upload
truongmien -
Category
Documents
-
view
214 -
download
0
Transcript of Has the Propensity to Pay Out Declined? - Rice Universitygrullon/pub/JFQA_2009_2.pdf · Has the...

Has the Propensity to Pay Out Declined?
Gustavo Grullon Rice University
[email protected] 713-348-6138
Bradley Paye
Rice University [email protected] 713-348-6030
Shane Underwood
Rice University [email protected]
713-348-6341
James Weston Rice University
[email protected] 713-348-4480
We thank Alex Butler, Yaniv Grinstein, and doctoral students at the University of Texas at Dallas, as well as seminar participants at the University of South Florida, University of Notre Dame, Rice University, University of Virginia, the Batten Conference at the College of William and Mary, and the 2008 Western Finance Association Meetings for useful comments. We also thank Boyan Jovanovich and Peter L. Rousseau for providing us with age data. All remaining errors are our own.
1
Has the Propensity to Pay Out Declined?
Abstract
Recent studies document both a significant decline in firms’ propensity to pay dividends and a significant increase in firms’ propensity to repurchase shares and issue equity over the past 30 years. In this paper we test whether firms’ net cash disbursements to equity-holders have declined in a pattern similar to firms’ propensity to pay dividends. Contrary to the evidence using dividends, we find no evidence that the conditional propensity to distribute net cash to equity holders (dividends + share repurchases – equity issues) has declined over the past three decades. Surprisingly, we find that, conditional on firm characteristics, net payout yields have been increasing over time.
2
I. Introduction
Over the past 30 years, public firms in the U.S. appear increasingly reluctant to return
cash to their shareholders through dividend payments. For example, Fama and French (2001)
show that the proportion of firms paying dividends falls sharply from 1978 to 1999, even after
conditioning on firm characteristics. Such a widespread disappearance of dividends might
suggest that firms’ earnings have become more transitory over time (see Dittmar and Dittmar
(2008)). However, DeAngelo et al (2006) find that the declining propensity to pay is especially
large among firms with high retained earnings. This is surprising given that Almeida and
Campello (2009) argue that such firms generally have low external financing costs and a
relatively moderate need to hoard cash for investment purposes.
From a capital markets perspective, evidence of a declining propensity to pay dividends
raises important questions about the allocation of corporate funds. Has the decline in dividends
been fully offset by an increase in share repurchases or a decrease in equity issues? Or,
alternatively, does the decline in the incidence of dividend payments reflect a broader shift in the
pattern of net cash exchanges between firms and shareholders? If it does, then the unexplained,
large-scale disappearance of net payouts represents a significant puzzle in corporate finance. In
this paper we test whether firms’ net cash disbursements to equity-holders have declined in a
pattern similar to firms’ propensity to pay dividends.
Theoretically, investors should be more concerned about net capital market flows than
about the amount of cash distributed through any particular channel. For example, in Miller and
Rock’s (1985) signaling model, investors infer the firm’s level of earnings by observing the
firm’s net dividends (dividend payments minus additional funds raised). Moreover, agency
theories such as the free cash flow hypothesis (e.g., Jensen (1986)) imply that net payouts are

3
critical because excess cash declines only when firms make positive net cash disbursements to
investors.
Empirically, Boudoukh et al (2007) illustrate the value in focusing on net payouts when
examining the time-series behavior of corporate payout policy in the U.S. They show that the
net cash flows to shareholders are more informative about asset prices than any particular form
of payout alone. Given this evidence suggesting that what matters to shareholders is the net
amount of cash that they receive from the firm, we examine in this paper whether firms’ net
payouts has declined over time in a similar way as firms’ propensity to pay dividends.
Although net payout is a theoretically and empirically appealing measure, it is possible
that dividends and net payout produce nearly the same classifications in the data. However, this
is not the case. We find that, at any given time, a significant number of firms classified as non-
dividend payers are actually positive net payers and a significant number of firms that are
classified as dividend payers are actually negative net payers. Furthermore, we find that this
difference in classification is higher for firms with relatively high retained earnings. This is
significant because the disappearing dividends puzzle is most severe for these firms as shown by
DeAngelo et al (2006).
Since our net payout indicator does lead to a significantly different classification of firms
that pay, we examine the extent to which net payout behavior trends over time. Consistent with
the evidence in Fama and French (2001), we find that the unconditional proportion of net payers
drops from approximately 63% in the 1970s to 30% in the 2000s. These results are also broadly
consistent with recent studies by Skinner (2008) and Grullon and Michaely (2002) who show an
increasing substitution from dividends to share repurchases, but still an overall decline in the
propensity to pay. Thus, despite the fact that firms substitute repurchases for dividends and

4
recycle equity, the disappearing payout puzzle documented by Fama and French (2001) is not
resolved simply by broadening the definition of payout to a measure of net payout.
We then test the hypothesis that the conditional net propensity to return cash to
shareholders has remained constant over time. Specifically, we use the framework in Fama and
French (2001) and DeAngelo et al (2006) to estimate both actual and expected payers, focusing
instead on the time-series behavior of firms with positive net payout. Not surprisingly, many of
the firm characteristics shown to predict dividend payment also predict positive net payout (e.g.
Fama and French (2001), DeAngelo et al (2006), Hoberg and Prabhala (2009)). Importantly, we
find that the conditional propensity to pay out has been relatively constant over the past 30 years.
That is, after controlling for firms characteristics, we find that firms are as likely to be net payers
in the 2000s as they were in the 1970s. These results are consistent across a number of
alternative methods of measuring payouts and to different econometric specifications.
Finally, we also examine the time-series behavior of payout yields. We find that the
average dividend yield and the average net payout yield experienced a significant decline after
the 1970s. Conditional on changes in firm characteristics, though, actual net payout yields have
been increasing relative to expected net payout yields. This finding suggests that, given the
changes in firm characteristics, corporations are currently distributing more net cash to their
shareholders than in the past.
The remainder of the paper is as follows. Section II describes the sample selection
procedure, defines the variables, and provides summary statistics. Section III discusses the
importance of measuring net payouts. In Section IV we examine the time series behavior of the
unconditional propensity to pay. Section V examines whether, after controlling for changes in
firm characteristics, the proportion of firms making net payments to shareholders has been

5
declining over time. Section VI examines the propensity to pay in terms of payout levels.
Section VII presents concluding thoughts.
II. Sample and Data
Our sample selection procedure closely follows DeAngelo et al (2006). We select firms
that: (a) are domestic firms present on both CRSP and Compustat; (b) are not utilities or
financials (SIC codes 4900 through 4999 or codes 6000 through 6999); (c) are publicly traded on
the NYSE, NASDAQ or AMEX; (d) have CRSP codes 10 or 11; (e) have available data on
dividends and earnings. These selection criteria generate a sample of 136,308 firm-year
observations from 1973 to 2006. On average, we have 4,009 firms in our sample each year. The
highest number of firms is 5,598 in 1997 and the lowest is 3,030 in 1973.
To control for the effect of firm characteristics on the propensity to pay, we focus on the
following variables in our main analyses:
1) Firm size (NYE): This variable is equal to the percentile in which the firm falls on
the distribution of equity market values for NYSE firms in year t.1
2) Market-to-book ratio (M/B): This variable is defined as the ratio of firm value to the
book value of total assets (Compustat item # 6) where firm value is measured as the
market value of equity (Compustat item # 25 times Compustat item # 199) plus the
difference between total assets and total common equity (Compustat item # 60).
3) Return on assets (ROA): This variable is computed as the operating income before
depreciation (Compustat item # 13) scaled by the book value of assets (Compustat
item # 6).
1 Following Fama and French (2001) and DeAngelo, DeAngelo, and Stulz (2006), we use the NYSE percentile breakpoints as a proxy for size to mitigate the effect of the natural growth in firm size over time. However, the use of alternative measures of size such as the logarithm of the market value of equity does not affect any of our empirical results.

6
4) Sales growth (SGR): This variable is computed as the annual percentage change in
total sales (Compustat item # 12).
5) Volatility (VOL): This variable is computed as the annual standard deviation of daily
stock returns.
6) Retained earnings to total assets (RE/TA): This variable is equal to retained earnings
(Compustat item # 36) scaled by the book value of assets (Compustat item # 6).
7) Firm age (AGE): Following Fink et al (2009), we define age as the number of years
since a firm’s founding, incorporation, or listing date (whichever is earliest).2 It is
important to note that our methodology differs from the common alternative which is
to use the date of a firm’s earliest occurrence on CRSP. Using the first CRSP
appearance can induce a significant bias because the average age of a firm at its IPO
date has fallen dramatically over the last forty years.
Table 1 contains descriptive statistics for our entire sample.3 While summary statistics
over such a long time period are hard to interpret, it is useful to benchmark the magnitude of
some sample characteristics. For example, most firms have a reasonable market-to-book ratio
between one and two and the median return on assets (ROA) and sales growth rate (SGR) are
both in the range of 11-12%. The average firm in our sample is 28.6 years old, though there are
many young firms. Given that the median age is 16 years old (in a 30 year sample), the
declining propensity to pay dividends may be tied to the increase of listings by small, less
profitable firms with more investment opportunities than the typical listed firm at the beginning
2 We rely on a variety of sources for this data. Some data are graciously provided by Jovanovich and Rousseau (2001) and Loughran and Ritter (2004). In addition to these samples, we have also filled in/supplemented this database using incorporation and founding dates collected from various issues of the Mergent’s industrial manual, bank & finance manual, and OTC manual, all published by Moody's Investors Service. 3 To mitigate the effect of outliers, all the control variables are winsorized at the 1st and 99th percentiles. However, our empirical results remain virtually the same if we do not winsorize the data.
7
of the sample. In general terms, our sample of firms represents the lion’s share of the whole
market and most of the firm-specific data that we collect is consistent with past studies in terms
of means, medians, standard deviations, etc.
III. The Characteristics of Net Payout A. Measuring Net Payouts
Different channels of equity flows (both into and out of the firm) are often analyzed in
isolation, rather than taken as a whole. However, analyzing a single component provides a
potentially incomplete picture of a firm’s net payout behavior because many firms both raise and
distribute capital all at the same time. To illustrate this issue, Figure 1 depicts, for five different
sub-periods, the fraction of firms that (a) both pay a dividend and repurchase shares, (b) both pay
a dividend and issue stock, (c) both repurchase shares and issue stock, and (d) pay a dividend,
repurchase shares, and issue stock. Consistent with the idea that equity flows occur
simultaneously through multiple channels, this figure shows that a large fraction of dividend
paying and repurchasing firms also raise capital in the same year. Further, it shows that a
nontrivial fraction of firms simultaneously pay dividends, repurchase shares, and issue equity.
These findings highlight the importance of focusing on net payouts because it is not clear a priori
whether a firm with positive dividends or repurchases is indeed raising funds or returning cash to
the capital markets.
In this sub-section we describe our measures of net payout and explore the degree of
concordance when firms are classified based on net payout behavior versus a classification based
on dividend payments alone.4 Following Fama and French (2001) we classify a firm as a
dividend payer if the total amount of dividends paid by the firm during a given fiscal year
4 We also replicate all of our tests using net payments to all owners of the firm (dividends plus repurchases minus equity issues plus debt repayments minus debt issues). Our main findings (not reported in a table) are qualitatively unchanged by this broader definition of total capital market net payout.

8
(Compustat item # 21) is greater than zero. Additionally, we classify a firm as a net payer if the
net payout of the firm (dividends plus share repurchases minus equity issues) during a given
fiscal year is greater than zero. Following Grullon and Michaely (2002) and Boudoukh et al
(2007), we construct our main proxy of net payouts using data on share repurchases and equity
issues from the flow of funds statement. Specifically, we define net total payouts as total
dividends plus purchases of common and preferred stock (Compustat item # 115) minus sales of
common and preferred stock (Compustat item # 108). One advantage of this proxy over
alternative measures is that we do not need to make assumptions regarding the prices at which
the company issues or buys back shares because equity issues and share repurchases are
expressed in total dollar amounts.
For robustness, we also consider alternative definitions of net payout using other
approaches for measuring net repurchases. Following Stephens and Weisbach (1998), we also
use the changes in shares outstanding reported by CRSP. In this approach, we define the
number of shares acquired (issued) by the firm as the decrease (increase) in the number of shares
outstanding over a quarter. We adjust the number of shares outstanding for stock splits, stock
dividends, and other events using the cumulative factor to adjust shares. We do not know,
however, at what prices the firm acquired or issued the shares. In light of this missing
information, we multiply the change in the number of shares by the average share price (scaled
by the cumulative factor to adjust prices) over the same quarter to estimate the quarterly amount
of net equity issues (equity issues minus share repurchases). Finally, we calculate an annual
measure of net equity issues by aggregating the quarterly data over a year. Our alternative
measure of net payout is thus equal to total dividends minus the annual net equity issues.

9
As a second alternative measurement scheme for net payout, we follow the methodology
in Fama and French (2001) and use the change in the dollar value of Treasury stock (Compustat
item # 226) as a proxy for net share repurchases. Using this measure, we define net payouts as
total dividends plus the change in the dollar value of Treasury stock. If the firm uses the
retirement method, we then use the difference between share repurchases and equity issues from
the flow of funds statement as a proxy for net repurchases (see Fama and French (2001) for a
detailed discussion of this issue). Although this is an intuitive approach, it has one serious
limitation: data on the change in the dollar value of Treasury stock are only available after 1982.
Thus, it is impossible for us to determine using this measure whether a firm is a net payer before
1983. This is a significant issue because for our main analysis, we need to estimate the
parameters of logit regressions modeling the probability of being a net payer over the 1970s. As
a compromise, we use our main proxy for net payouts (based on the flow of funds statement) to
estimate the parameters of the logit regressions during the pre-estimation period and use the
proxy for net payouts based on the changes in the dollar value of Treasury stock during the post-
estimation period.
B. The Importance of Examining Net Payouts
It is possible that dividend status serves as a very accurate proxy for net payout status. If
this is the case, then there is little scope for an analysis of net payout to contribute significantly
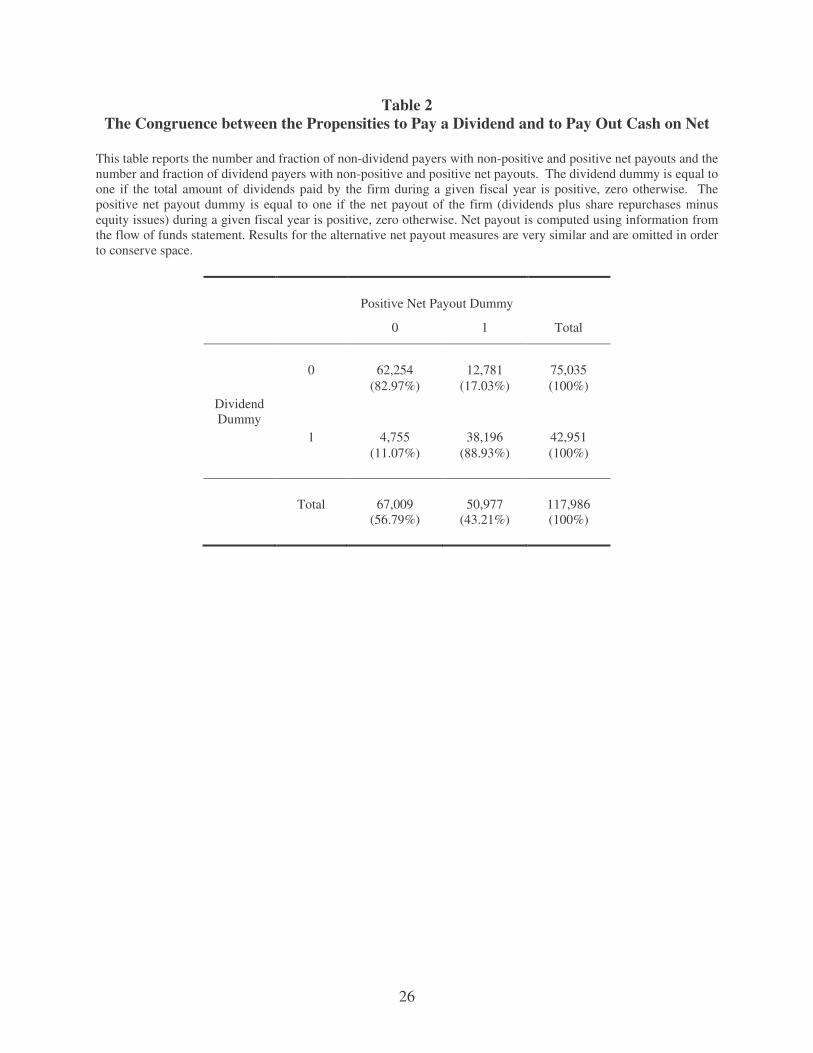
to our understanding of firms’ payout policy relative to existing research. Table 2 displays the
degree of concordance between the dividend payment dummy variable and the positive net
payout dummy variable. For about 83% of the firm-year observations where the dividend
indicator is zero, the net payout indicator is also zero. But this means that 17% (almost 13,000
observations) of the firms classified as non-dividend payers actually had positive net payout to

10
shareholders once repurchases and equity issues are taken into account. Conversely, 4,755 firm-
year observations which were classified as positive dividend payers actually had non-positive net
payout. This represents about 11% of the positive dividend dummy observations.
In Table 3, we dig deeper into the difference between measuring net payouts and
dividends. Specifically, we identify all firm-year observations where the dividend payment
status does not reflect the net payout status of a firm and report averages across three sub-periods
and across retained earnings quintiles. A difference in classification occurs when a non-dividend
payer pays out on net, or when a dividend payer does not pay out on net. Two patterns emerge
from the data. First, the difference in classification occurs most frequently in the three highest
retained earnings quintiles. This is intuitive, since firms with little retained earnings are often
relatively young firms who are unlikely to be returning cash to investors under any definition of
payout.
Second, for the two highest retained earnings quintiles, the difference in classification
increases over time. This finding is consistent with the substitution hypothesis studied by
Grullon and Michaely (2002) and Skinner (2008). Firms with high retained earnings have cash
available to return to investors. Early in our sample period, dividends effectively served as the
sole channel for returning cash to investors. Later in our sample, repurchases became available as
an additional channel for distributing cash, contributing to a more substantial divergence in
payout classification between the two measures.
It is worth emphasizing that discordance between dividend status and net payout status
does not solely result from the substitution phenomenon. Equity issuance patterns also
contribute significantly to differences in classification status. Consistent with evidence in Weld
(2008), we find that a nontrivial fraction of firms are “recyclers”: that is, they actually issue
11
equity while paying a dividend or repurchasing equity (or both). Panel A of Table 4 shows the
fraction of firms in the various retained earnings quintiles that (a) pay a dividend or repurchase
shares and (b) simultaneously issue equity in an amount that exceeds the total payout in
dividends and repurchases. For firms in the middle three retained earnings quintiles, at least 10
percent of the firms are recyclers, and this holds true for each of the three subperiods examined.
These firms would be classified as payers whether we used a dividend-only classification or a
total payout classification (dividends plus repurchases). On net, however, they are raising cash
from shareholders during the period. Panel B illustrates that, even for firms that are in fact
positive net payers, a large fraction of payout is recycled. For example, firms in the lowest
retained earnings quintile fund (on average) approximately 50% of their repurchases and
dividends through equity issues. The fraction of payout funded by equity issues increases from
the first to the last subperiod for all of the retained earnings quintiles.
The results presented in this section highlight the importance of examining net payout
patterns over time. Since sorting firms according to net payout status versus dividend status
leads to substantially different classifications, and since this difference increases through time,
studying net payout patterns may lead to new insights regarding firms’ interactions with
shareholders.
IV. Variation in the Propensity to Pay
We first consider the time series behavior of the unconditional propensity to pay out.
Given that the composition of publicly listed firms has shifted dramatically over the past thirty
years toward firms that are younger and less profitable, it is natural to expect that the time series
of the fraction of firms returning cash to shareholders trends downward over this period. Since
small young firms are more likely to be financially constrained (e.g., Fazzari et al (1988)), they
12
have an incentive to save most of their earnings to internally finance their investment projects.
Consistent with this view, Almeida et al (2004) show that financially constrained firms (e.g.,
small firms) retain a larger fraction of their incremental cash inflows than do unconstrained
firms.
To investigate the unconditional trend in payout policy, we report in Figure 2 the fraction
of firms in each year that had either (a) positive dividend payout, or (b) positive net payout
(dividends plus repurchases less equity issues). Clearly, whether one considers dividends or net
payout, the unconditional propensity to pay out cash declines over the period from the 1970’s
through the 2000’s. With respect to dividend payout, Figure 2 replicates the unconditional
pattern documented by Fama and French (2001). The time series for the propensity to pay out on
net illustrates that, unconditionally, shifting to a net payout measure `explains’ only about one
quarter of the decline in payout observed using dividends alone as a measure of payout.5
Figure 2 also demonstrates that a substantial portion of the overall decline in propensity
to pay, whether measured using dividends or net payout, occurs between the 1970s and 1980s.
While safe harbor provisions related to share repurchases were enacted in 1982, repurchasing
activity accelerated only gradually until the mid 1990s (see, for example, Grullon and Michaely
(2002), Allen and Michaely (2003) and Skinner (2008)). Thus in an unconditional setting, the
substitution of repurchases for dividends cannot fully explain the declining propensity to pay
from the late 1970s to the present. This is consistent with Fama and French (2001), who consider
repurchases as a potential resolution to the puzzle but conclude that since repurchases are largely
done by firms already paying dividends, repurchases alone cannot explain why firms are less
likely to return cash to shareholders.
5 These results are broadly consistent with Skinner (2008) who finds a modest increase in the fraction of firms that do not pay dividends or repurchase shares though his sample starts in 1980. This misses much of the relatively large drop in dividends from the late 1970’s to the early 1980’s, which is not the focus of Skinner’s paper.

13
V. Changing Firm Characteristics and the Propensity to Pay
A. Has the conditional propensity to pay declined?
In this section, we turn to the central question of our paper: Is there a declining
propensity to return cash to shareholders after controlling for the changing characteristics of
firms over the last 30 years?
In order to benchmark our results against past studies, we begin by replicating the main
findings in Fama and French (2001). The basic empirical strategy is simple. First, we run
pooled logit regressions of the “pay/no pay” decision for some initial formation period (in our
base case, we use 1973-1978). This provides a model of how firms’ propensity to pay depends
upon firm characteristics such as size, profitability and growth opportunities. We then use this
estimated payout model to “forecast” the proportion of firms that will pay dividends over the
period 1979-2006. Indeed, by accounting for future changes in firm characteristics, our
predictions capture the component of variation in propensity to pay that may be explained by
changes in characteristics.
For each year during the 1979 to 2006 period, we compare the incidence of expected
dividend payers (the forecast) to the incidence of actual dividend payers (the actual data). Since
the expected fraction of payers incorporates changes in firm characteristics, any difference
between the expected and the actual fraction of payers represents a surprise, i.e., variation in the
fraction of payers that is unexplained by corresponding variation in firm characteristics. Our null
hypothesis is that there is no time trend in the time series of “surprises” (expected payers less
actual payers). Under the alternative, if there is, for example, a decreasing propensity to pay
given firm characterisitcs, then the annual time series of expected proportions of payers would
14
rise above the observed proportions of payers, generating an upward-trending times series of
“propensity to pay deficits.”
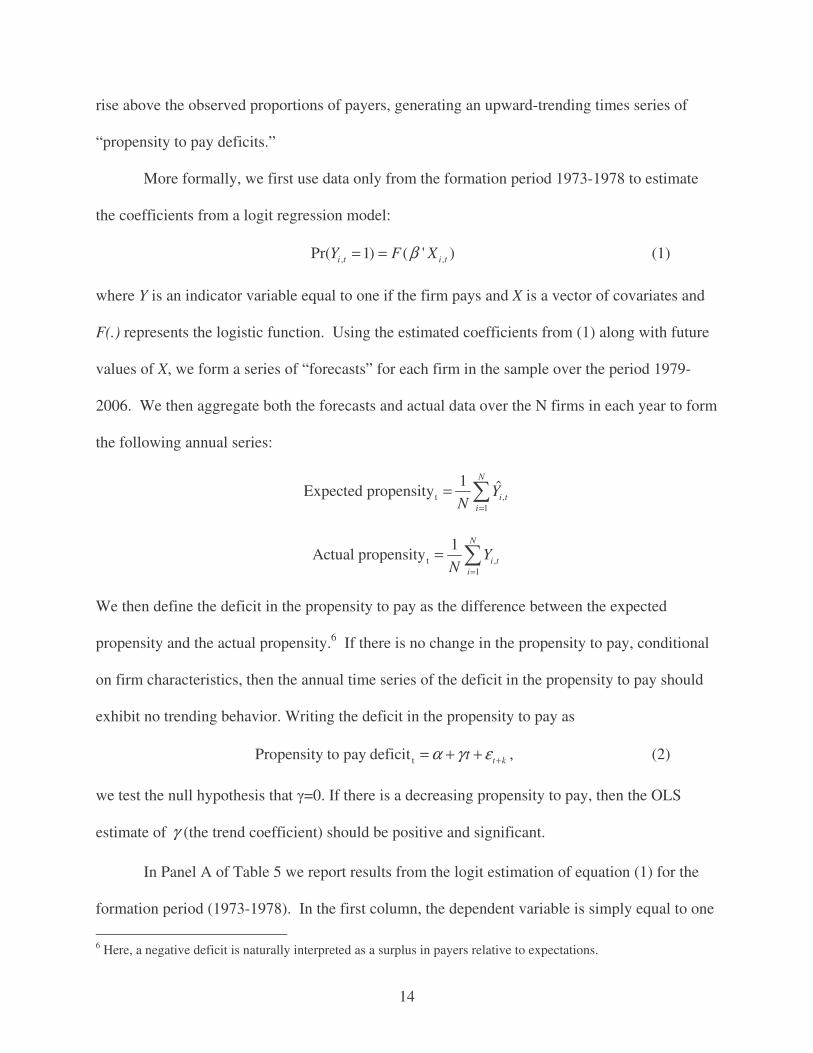
More formally, we first use data only from the formation period 1973-1978 to estimate
the coefficients from a logit regression model:
, ,Pr( 1) ( ' )i t i tY F Xβ= = (1)
where Y is an indicator variable equal to one if the firm pays and X is a vector of covariates and
F(.) represents the logistic function. Using the estimated coefficients from (1) along with future
values of X, we form a series of “forecasts” for each firm in the sample over the period 1979-
2006. We then aggregate both the forecasts and actual data over the N firms in each year to form
the following annual series:
t ,1
1 ˆExpected propensityN
i ti
YN =
= �
t ,1
1Actual propensity
N
i ti
YN =
= �
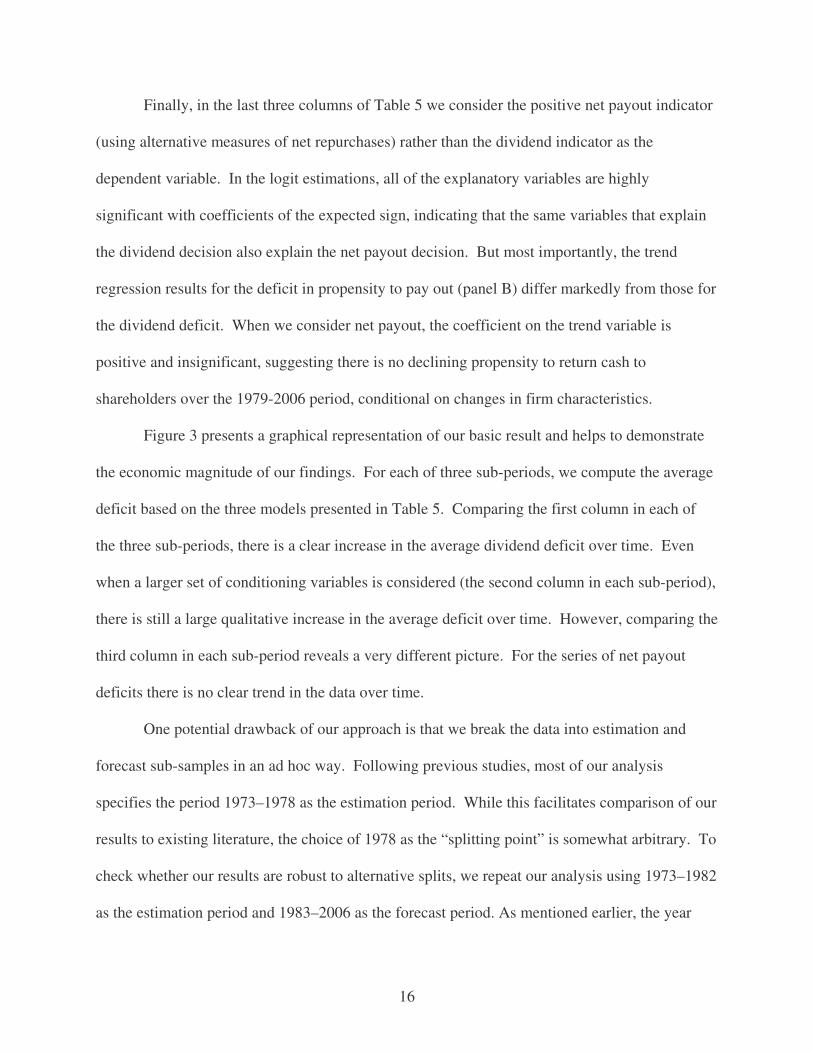
We then define the deficit in the propensity to pay as the difference between the expected
propensity and the actual propensity.6 If there is no change in the propensity to pay, conditional
on firm characteristics, then the annual time series of the deficit in the propensity to pay should
exhibit no trending behavior. Writing the deficit in the propensity to pay as
tPropensity to pay deficit t ktα γ ε += + + , (2)
we test the null hypothesis that �=0. If there is a decreasing propensity to pay, then the OLS
estimate of γ (the trend coefficient) should be positive and significant.
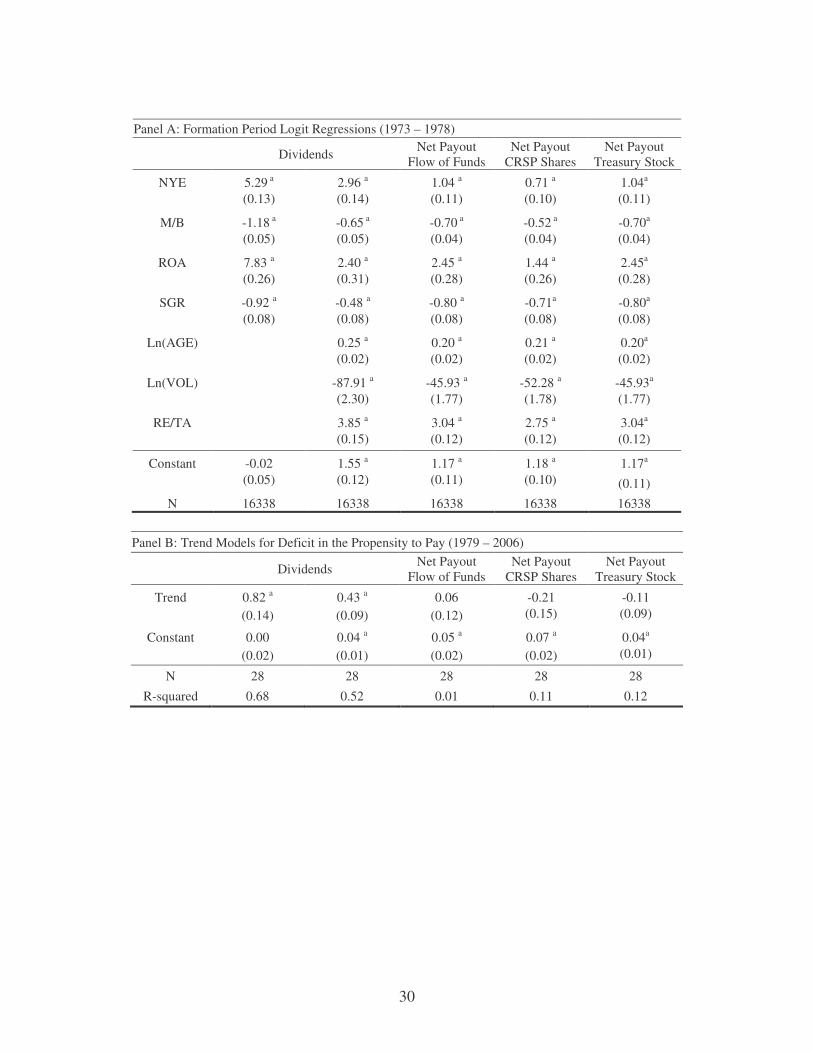
In Panel A of Table 5 we report results from the logit estimation of equation (1) for the
formation period (1973-1978). In the first column, the dependent variable is simply equal to one
6 Here, a negative deficit is naturally interpreted as a surplus in payers relative to expectations.

15
if a dividend is paid, and zero otherwise. For this benchmark analysis we use the same control
variables as in Fama and French (2001); namely, firm size, market-to-book ratio, return on
assets, and sales growth. The results confirm that size, profitability, and measures of growth or
investment opportunities are all significant determinants of the decision to pay dividends. Large
and profitable firms with a high return on assets are more likely to pay dividends, while firms
with high growth rates and high market-to-book ratios are less likely to pay dividends. The
coefficient estimates are all similar in magnitude to those reported in Fama and French (2001).
Panel B of Table 5 presents our estimation of equation (2) over the period 1979-2006.
The results in the first column show a positive and significant coefficient estimate for the time
trend variable �; that is, the gap between the expected fraction of payers and the actual fraction
grows over time. The increasing deficit is economically significant as well: the deficit increases
by about 82 basis points per year for a total increase of 23% (0.82*28 years). This is the
declining propensity to pay dividends first documented by Fama and French (2001).
In the second column of Panel A, we augment the Fama-French logit estimation with
three additional variables: the log of firm age, log of volatility (Hoberg and Prabhala (2009)),
and the ratio of retained earnings to total assets (DeAngelo, et al (2006)). All three variables are
significant at the 1% level, and in Panel B we see that the trend in the propensity to pay deficit is
roughly cut in half: with the coefficient now 0.43 vs. 0.82 in the baseline estimation. This means
the deficit increases by about 12% over the 1979-2006 period. Thus, as in Hoberg and Prabhala
(2009), adding additional variables does help to explain the declining propensity to pay
dividends, but there remains an economically significant decrease in the propensity to pay (at a
rate of approximately 0.5% per year) even after accounting for changing firm characteristics.
16
Finally, in the last three columns of Table 5 we consider the positive net payout indicator
(using alternative measures of net repurchases) rather than the dividend indicator as the
dependent variable. In the logit estimations, all of the explanatory variables are highly
significant with coefficients of the expected sign, indicating that the same variables that explain
the dividend decision also explain the net payout decision. But most importantly, the trend
regression results for the deficit in propensity to pay out (panel B) differ markedly from those for
the dividend deficit. When we consider net payout, the coefficient on the trend variable is
positive and insignificant, suggesting there is no declining propensity to return cash to
shareholders over the 1979-2006 period, conditional on changes in firm characteristics.
Figure 3 presents a graphical representation of our basic result and helps to demonstrate
the economic magnitude of our findings. For each of three sub-periods, we compute the average
deficit based on the three models presented in Table 5. Comparing the first column in each of
the three sub-periods, there is a clear increase in the average dividend deficit over time. Even
when a larger set of conditioning variables is considered (the second column in each sub-period),
there is still a large qualitative increase in the average deficit over time. However, comparing the
third column in each sub-period reveals a very different picture. For the series of net payout
deficits there is no clear trend in the data over time.
One potential drawback of our approach is that we break the data into estimation and
forecast sub-samples in an ad hoc way. Following previous studies, most of our analysis
specifies the period 1973–1978 as the estimation period. While this facilitates comparison of our
results to existing literature, the choice of 1978 as the “splitting point” is somewhat arbitrary. To
check whether our results are robust to alternative splits, we repeat our analysis using 1973–1982
as the estimation period and 1983–2006 as the forecast period. As mentioned earlier, the year
17
1982 corresponds to the passage of legislation (Rule 10b-18) that substantially changed the usage
of repurchases as a means to return cash to shareholders and therefore seems like a natural
alternative choice for the sample split-point (see Grullon and Michaely (2002) for a detailed
discussion of this regulatory change). Table 6 reports the results from this alternative analysis.
Consistent with our previous findings, this table shows that, after conditioning for changes in
firm characteristics, the propensity to distribute cash to shareholders has not decline over time.7
B. The relationship between payout propensity and retained earnings
As DeAngelo et al (2006) show, the declining dividend puzzle is most pronounced in
firms with positive retained earnings. For firms with negative retained earnings, there is no
decline in the propensity to pay dividends over the last several decades. For more profitable
firms, however, the declining propensity is even greater than the one documented in Fama and
French (2001). Here we test whether similar patterns exist in the net payout series.
Our analysis begins by replicating the full sample results for various sub-samples based
on retained earnings. Table 7 presents results from regressing the deficit in the propensity to pay
on a constant and a time trend variable for each of ten portfolios based on the ratio of retained
earnings to total assets (RE/TA). On the left side of the table, we confirm the DeAngelo et al
(2006) results using the deficit in the propensity to pay dividends: firms with negative retained
earnings show no declining propensity to pay, while for profitable firms the declining propensity
is magnified. These results are presented graphically in Figure 4. Panel A shows the deficit in
propensity to pay dividends for each RE/TA portfolio for two subperiods: 1980-1988 and 1998-
2006. For all but the negative RE/TA group, there is a large increase in the deficit from the first
to the last subperiod.
7 We also repeated our analysis using 1973–1989 as the estimation period and 1989–2006 as the forecast period, and find similar results.

18
In the last three columns of Table 7, we present the trend regression results where the
dependent variable is the net payout deficit. There are two important themes in the results. First,
when we examine portfolios with low retained earnings (RE/TA values less than 0.6 as well as
negative RE/TA values), the coefficient on the trend variable is actually negative. Thus for these
firms, we find evidence of an increasing propensity to return cash to shareholders, given firm
characteristics, over the 1979-2006 period. For example, our estimates imply that for firms with
negative retained earnings, the deficit in propensity to pay shrinks by 8.68% (-.31*28 years) over
the 1979-2006 period. These findings suggest that, conditional on changes in firm characteristics,
firms with relatively low retained earnings are paying out more often than expected and that this
“surplus” is increasing over time. We do not necessarily view these results as a puzzle, however.
The safe harbor provisions for stock repurchases enacted in the 1980s provided another channel
for firms to return cash to shareholders. This may have lowered the cost of paying out cash rather
than retaining it, particularly for firms early in their life-cycle (with negative or relatively low
retained earnings). Given a downward shift in the cost of paying out cash for low RE firms, one
might expect that these firms would increase their propensity to pay out cash, consistent with our
findings.
Our second main finding is that, among firms with relatively high retained earnings, the
magnitude of the increase in the propensity to pay deficit (the puzzle documented by DeAngelo
et al (2006)) is substantially smaller using net payout relative to results using dividends. For
example, for portfolio 8, comprised of firms having RE/TA values between 0.7 and 0.8, the
estimated rate of increase in the propensity to pay deficit is 1.43% per year using dividends as a
measure of payout but only 0.23% per year using net payout. Panel B of Figure 3 depicts our
results graphically. Examining this figure, it appears that the lack of any trend in the full sample
19
is the product of two components: 1) firms with relatively high RE earnings paying out less than
expected given changes in firm characteristics (as in DeAngelo et al (2006) although with
smaller magnitude) and 2) firms with relatively low retained earnings paying out more than
expected given changes in firm characteristics.
VI. Cash Distributions to Shareholders
In Section V we present evidence that there is little change in the propensity of firms to
pay out on net over the last 30 years after accounting for changes in firm characteristics. This
says nothing, however, about how much cash firms are paying to shareholders. As DeAngelo,
DeAngelo, and Skinner (2004) show, total dollar dividends paid by industrial firms have actually
increased since 1978, both in nominal and real terms. They also show that dividends have
become increasingly concentrated among a small number of profitable firms. For example, the
top 25 dividend paying firms typically pay more than 50% of aggregate dividends.
It may be the case that a similar result holds for net payouts; i.e., even though we show an
increasing propensity to pay for firms in the lower end of the profitability spectrum, the actual
amounts paid by such firms may be so small that they are of little economic consequence. To
consider an extreme example, consider a firm which has a positive net payout of $100 in a given
year. Our net payout dummy would equal 1 for this firm, but the real economic magnitude of
this payout is very small. As a first step to resolving this question, we consider whether total
payout has witnessed the same increase in concentration as dividends over the past few decades.
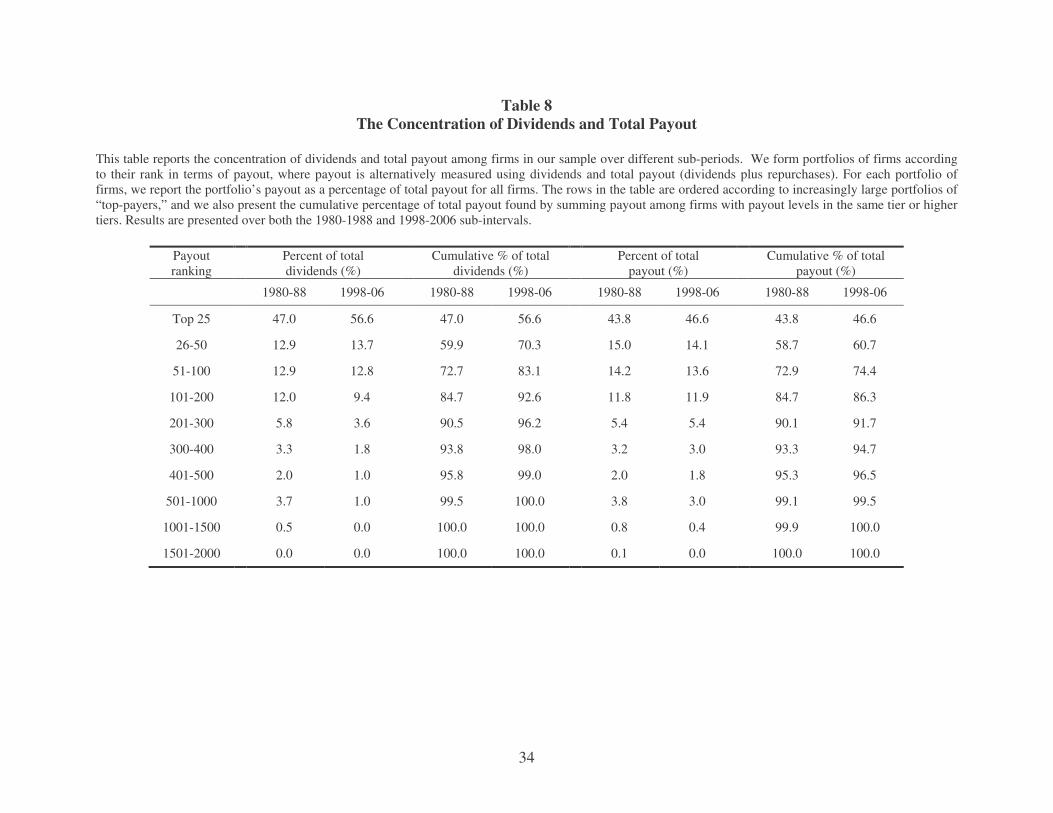
Table 8 shows the percent of total dividends and total payout attributable to firms in
various categories based on the given payout variables.8 The dividend concentration results are
very similar to those presented by DeAngelo, DeAngelo, and Skinner (2004): dividends have
8 Note that we exclude concentration metrics for net payout. Given that net payout is often negative, the measures of concentration considered here would be difficult to interpret in considering the concentration of net payout.

20
become increasingly concentrated in the largest 25 firms. For the 1980-1988 period, the top 25
firms (ranked by dividend payments) pay 47% of the total dividends in a typical year. In the
1998-2006 period, this has increased to 56.6%. For total payout (dividends plus share
repurchases), two patterns are worth noting. First, the level of concentration is lower than for
dividends. In the 1998-2006 period, the top 25 firms in terms of total payout only pay 46.6% of
all dividends and repurchases. This is a full 10 percentage points less than in the case of
dividends. Second, the increase in concentration over the sample period is less dramatic than for
dividends. The percent of total payout from the top 25 firms only increases from 43.8% to
46.6% from the first to the last subperiod. In short, the results presented in Table 8 suggest that
total payouts are less concentrated than dividends, and this gap has increased over the last several
decades. Thus the total payouts made by firms outside of the top 25 are of real economic
importance, and have not diminished much in their role since the late 1970’s.
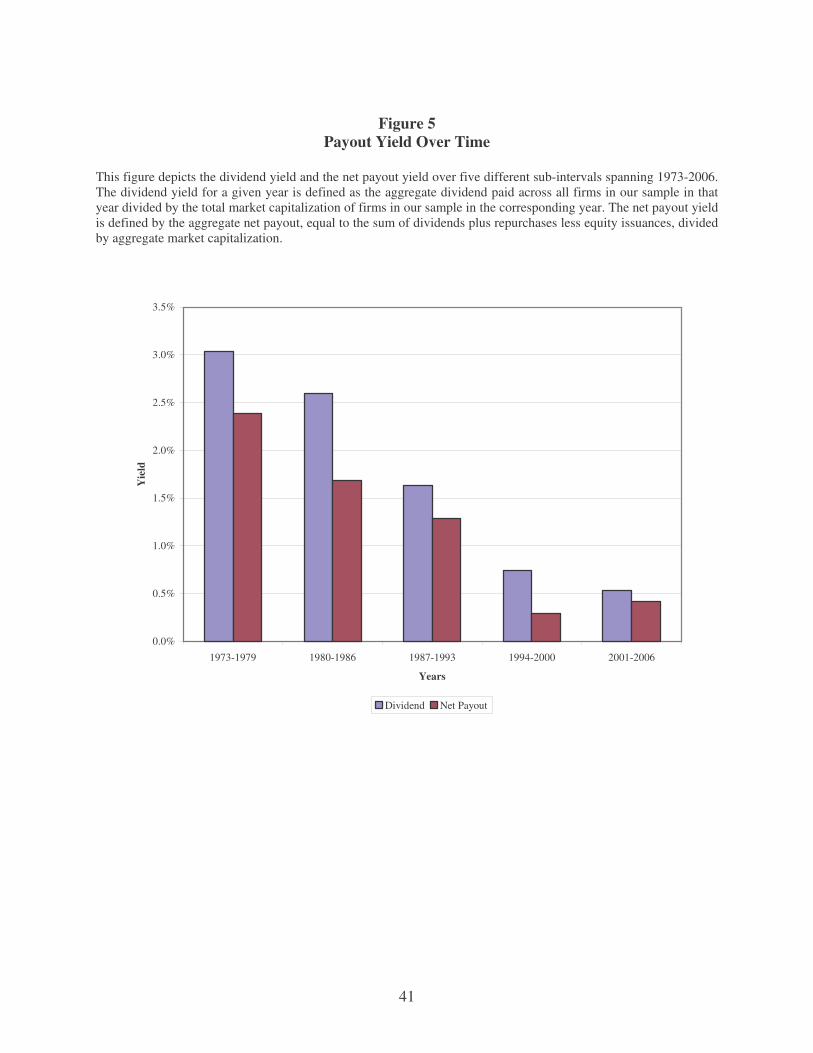
To directly determine whether our main findings are sensitive to the use of a dichotomous
indicator variable for payout, we repeat our analysis using payout yields rather than indicator
variables. A first question of interest is whether, unconditionally, there is a disappearing payout
puzzle for yields similar to that for the propensity to payout. Figure 5 shows that this is indeed
the case. Both the average dividend yield and the average net payout yield have fallen markedly
since the 1970’s. This suggests that, as with the propensity to pay, substitution from dividends to
repurchases cannot, on its own, explain lower payout yields over time.
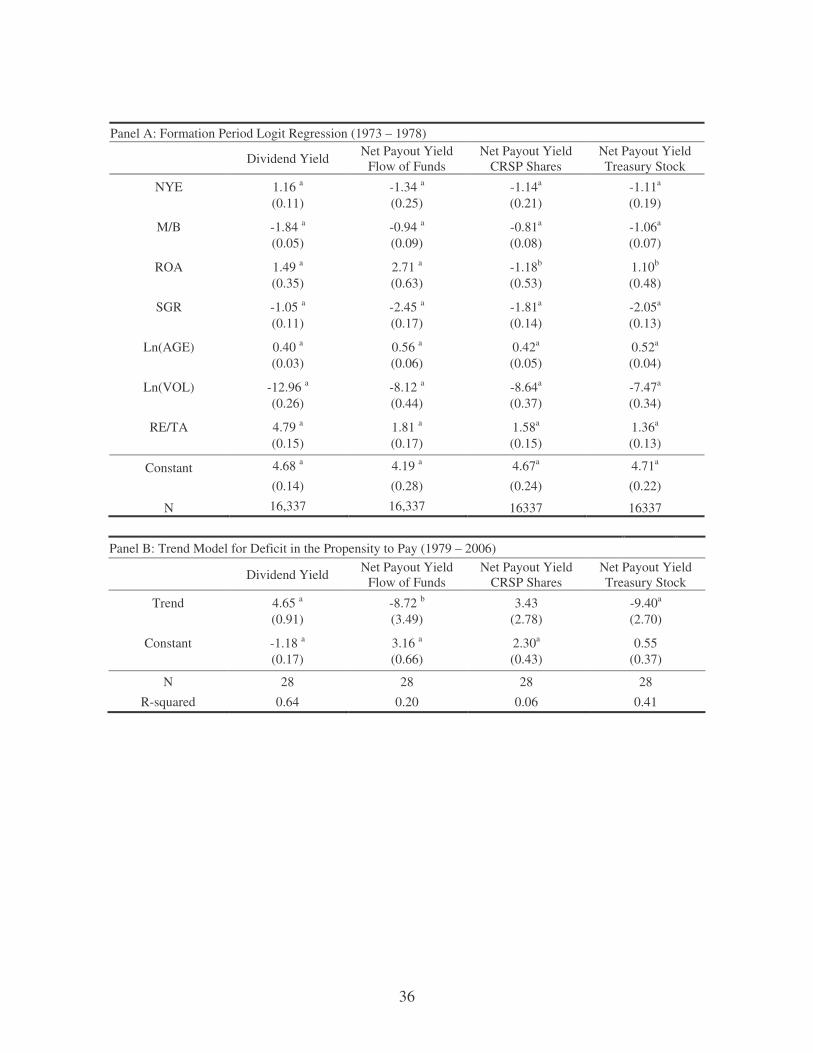
Can changing firm characteristics account for decreasing payout yields over the past few
decades? In Table 9, we repeat the analysis of Table 5, but now our dependent variables are
payout yields rather than the 0/1 dummy variables. More explicitly, we first model the
relationship between payout yield, defined alternatively as either dividends yield or net payout
21
yield, and the set of firm characteristics. We again use 1973-1978 as the estimation period. Using
this model, we produce “forecasts” of the expected payout yield conditional on future values for
firm characteristics.9 These represent predicted variation in payout yields due to changes in firm
characteristics. Then, we form a time series of the difference between the expected payout yield
and the observed payout yield. These differences represent variations in payout yield that cannot
be explained by changes in firm characteristics. Finally, we test for the existence of a time trend
in this “payout deficit” series.
Panel A of Table 9 presents the formation period estimation results. All of the control
variables are significant in the expected direction in explaining yields. Panel B presents results
from regressing the deficit in the propensity to pay (i.e., expected yield less actual yield) on the
time trend variable. In the first column, we see that there is indeed a decreasing propensity to
pay dividends. In the last four columns, we find that for two out of three definitions of net
payout yield, though, the coefficients on the trend variable are actually negative and significant.
Thus, once we account for repurchases and equity issues as pieces of the payout pie, firms
actually appear to be returning more cash to shareholders than we would expect given the
changing characteristics of firms.
VII. Conclusion
In this paper we test the hypothesis that the net propensity for firms to return cash to
shareholders has remained constant over time. Using various measures of the net cash flowing
back to shareholders, we find that the propensity to pay out has been relatively constant over the
past 30 years. Moreover, we find that among firms with low retained earnings there is actually
an increasing propensity to distribute cash to equity holders.
9 For the dividend yield regressions, we use a Tobit model rather than a linear model due to the clustering of values at zero.

22
We show that using net payouts instead of dividends has a tremendous impact on the
conclusions drawn concerning the changing nature of payout policy. Conditional on their
characteristics, firms are just as likely to return cash to shareholders as they were in the 1970’s.
Thus, the puzzles posed by Fama and French (2001) and DeAngelo et al (2006) do not
materialize when one jointly considers firms’ net cash disbursements to investors. Additionally,
we find that firms with negative or relatively low retained earnings are actually more likely to
return cash to shareholders than they were in the 1970’s, a finding that may reflect the loosening
of restrictions regarding repurchases that have facilitated the use of stock buybacks among
smaller, less mature firms.
Our findings are an important step in understanding the payout behavior of U.S. public
firms. For example, our findings bear interesting implications for tax policy. One argument in
favor of the Jobs and Growth Tax Relief Reconciliation Act of 2003 (the “JGTRRA”) was that in
the wake of the corporate scandals of 2001-2002, firms needed to be encouraged to return cash to
shareholders to reduce agency problems. Bratton (2005) notes that “According to the JGTRRA’s
proponents, this adjustment will help jumpstart a staggering economy, jolt stock prices upward,
and release a cascade of corporate cash into the pockets of upscale consumers” [emphasis
added]. The presumption behind such arguments seems to be that firms were much less likely to
distribute cash to investors than they had been in the past, and that altering the tax code could
help alleviate such agency conflicts. Our results suggest that firms were actually just as likely to
return cash in 2003 as they were in 1978. Moreover, by shifting cash distributions to repurchases
instead of dividends, firms were actually moving toward an optimal policy of minimizing the tax
burden of their investors.

23
References
Allen, F., and R. Michaely. “Payout Policy.” In Handbook of the Economics of Finance, edited by G. Constantinides, M. Harris and R. Stulz. North Holland (2003), 337-429.
Almeida, H., M. Campello, and M. Weisbach. “The Cash Flow Sensitivity of Cash.”
Journal of Finance, 59 (2004), 1777-1804. Almeida, H., and M. Campello. “Financing Frictions and the Substitution between
Internal and External Funds.” Journal of Financial and Quantitative Analysis, (forthcoming 2009).
Bratton, W. “The New Dividend Puzzle.” Georgetown Law Journal, 93 (2005). Boudoukh, J., R. Michaely, M. Richardson, and M. Roberts. “On the Importance of
Measuring Payout Yield: Implications for Empirical Asset Pricing.” Journal of Finance, 62 (2007), 877-916.
DeAngelo, H., L. DeAngelo, and D. Skinner. “Are Dividends Disappearing? Dividend Concentration and the Consolidation of Earnings.” Journal of Financial Economics, 72 (2004), 425-456.
DeAngelo, H., L. DeAngelo, and R. Stulz. “Dividend Policy and the
Earned/Contributed Capital Mix: A Test of the Life-Cycle Theory.” Journal of Financial Economics, 81 (2006), 227-254.
Dittmar, A., and R. Dittmar. “The Timing of Financing Decisions: An Examination of the
Correlation in Financing Waves.” Journal of Financial Economics, 90 (2008), 59-83. Fama, E., and K. French. “Disappearing Dividends: Changing Firm
Characteristics or Lower Propensity to Pay?” Journal of Financial Economics, 60 (2001), 3-43.
Fazzari S., R. G. Hubbard, and B. Petersen. “Financing Constraints and Corporate
Investment.” Brooking Papers on Economic Activity, 1 (1988), 141-195. Fink, J., K. Fink, G. Grullon, and J. Weston. “What Drove the Increase in Idiosyncratic
Volatility during the Internet Boom?” Working Paper, Rice University (2009). Grullon, G., and R. Michaely. “Dividends, Share Repurchases, and the
Substitution Hypothesis.” Journal of Finance, 57 (2002), 1649-1684. Hoberg, G., and N. Prabhala. “Dividend Policy, Risk and Catering.” Review of Financial
Studies, (forthcoming 2009).

24
Jensen, M. “Agency Costs of Free Cash Flow, Corporate Finance, and Takeovers.” American Economic Review, 76 (1986), 323-329.
Jovanovich, B., and P. L. Rousseau. “Why Wait? A Century of Life before IPO.”
American Economic Review, 91 (2001), 336-41. Loughran, T., and J. Ritter. “Why has IPO Underpricing Changed over Time.” Financial
Management, 33 (2004), 5-37. Miller, M., and K. Rock. “Dividend Policy under Asymmetric Information.” Journal of
Finance, 40 (1985), 1031-1051. Skinner, D. “The Evolving Relation between Earnings, Dividends, and Stock
Repurchases.” Journal of Financial Economics, 87 (2008), 582-609.
Stephens, C., and M. Weisbach. “Actual Share Reacquisitions in Open- Market Repurchase Programs.” Journal of Finance, 53 (1998), 313-333.
Weld, W. “Recycled Equity.” Working Paper, Cornell University (2008).

25
Table 1 Summary Statistics
This table reports summary statistics for various firm characteristics based on annual firm-year data over the sample period 1973-2006. The sample consists of firms that: (a) are present on both CRSP and Compustat; (b) are not a utility (SIC codes 4900 through 4999) or a financial firm (SIC codes 6000 through 6999); (c) are publicly traded on the NYSE, NASDAQ or AMEX; (d) have securities with CRSP codes 10 or 11; (e) are incorporated in the U.S. as per Compustat; (f) have available data on dividends and earnings. NYE is equal to the percentile in which the firm falls on the distribution of equity market values for NYSE firms in year t. M/B is equal to the ratio of firm value to the book value of total assets where firm value is measured as the market value of equity plus the difference between total assets and total common equity. ROA is equal to the operating income before depreciation scaled by the book value of assets. SGR is equal to the annual percentage change in total sales. AGE is defined as the number of years since the firms’ founding, incorporation, or listing date, whichever is earliest. VOL is equal to the annual standard deviation of daily returns. RE/TA is equal to the ratio of retained earnings to total assets. To mitigate the effect of outliers, all the variables are winsorized at the 1% and the 99% of their empirical distribution.
Mean S.D. 25% 50% 75%
NYSE equity value percentile (NYE) 0.22 0.26 0.02 0.09 0.34
Book-to-market ratio (M/B) 1.83 1.57 0.98 1.30 1.98
Return on assets (ROA) 0.07 0.22 0.04 0.12 0.18
Sales growth rate (SGR) 0.24 0.70 -0.01 0.11 0.27
Firm age (AGE) 28.63 31.80 7.00 16.00 38.00
Volatility (VOL) 0.04 0.03 0.02 0.03 0.05
Earned equity to total assets (RE/TA) -0.18 1.26 -0.12 0.16 0.36
26
Table 2 The Congruence between the Propensities to Pay a Dividend and to Pay Out Cash on Net
This table reports the number and fraction of non-dividend payers with non-positive and positive net payouts and the number and fraction of dividend payers with non-positive and positive net payouts. The dividend dummy is equal to one if the total amount of dividends paid by the firm during a given fiscal year is positive, zero otherwise. The positive net payout dummy is equal to one if the net payout of the firm (dividends plus share repurchases minus equity issues) during a given fiscal year is positive, zero otherwise. Net payout is computed using information from the flow of funds statement. Results for the alternative net payout measures are very similar and are omitted in order to conserve space.
Positive Net Payout Dummy
0 1 Total
Dividend Dummy
0 62,254 12,781 75,035 (82.97%) (17.03%) (100%)
1 4,755 38,196 42,951 (11.07%) (88.93%) (100%)
Total 67,009 50,977 117,986
(56.79%) (43.21%) (100%)

27
Table 3 Differences in Classification
This table reports the total fraction of observations in which the dividend dummy variable does not reflect the net payout status of a firm across three sub-periods and across retained earnings quintiles. A difference in classification occurs when a non-dividend payer has a positive net payout or a dividend payer has a non-positive net payout. A firm is classified as a dividend payer if the total amount of dividends paid by the firm during a given fiscal year is greater than zero. A firm is classified as a net payer if the net payout of the firm (dividends plus share repurchases minus equity issues) during a given fiscal year is greater than zero. Net payout is computed using information from the flow of funds statement. Results for the alternative net payout measures are very similar and are omitted in order to conserve space.
Retained Earnings Quintile Full Sample 1980-1988 1989-1997 1998-2006
1 0.09 0.10 0.08 0.08
2 0.15 0.18 0.13 0.15
3 0.20 0.21 0.18 0.21
4 0.22 0.19 0.21 0.25
5 0.19 0.13 0.18 0.26

28
Table 4 Equity Recycling
This table presents the proportion of “recycling” firms in our sample, where recycling refers to the practice of simultaneously issuing equity and either paying dividends or repurchasing shares (or both). Panel A presents the proportion of firms that pay a dividend or repurchase shares and simultaneously issue equity in excess of the value of total payout (dividends plus repurchases). Panel B depicts the proportion of total payout that is recycled. This is computed for each firm as the positive level of payout net of equity issues (1-(max [0, dividends + repurchases – equity issues])/(dividends + repurchases)). Net payout is computed using information from the flow of funds statement. Results for the alternative net payout measures are very similar and are omitted in order to conserve space.
Panel A: Proportion of “Recycling” Firms
Retained Earnings Quintile Full Sample 1980-1988 1989-1997 1998-2006
1 0.09 0.10 0.06 0.12
2 0.13 0.15 0.12 0.15
3 0.13 0.15 0.14 0.16
4 0.10 0.10 0.11 0.14
5 0.04 0.04 0.05 0.06
Panel B: Proportion of Total Payout that is Recycled
Retained Earnings Quintile Full Sample 1980-1988 1989-1997 1998-2006
1 0.52 0.58 0.55 0.65
2 0.39 0.35 0.49 0.51
3 0.35 0.36 0.42 0.44
4 0.27 0.26 0.31 0.39
5 0.18 0.14 0.21 0.29
29
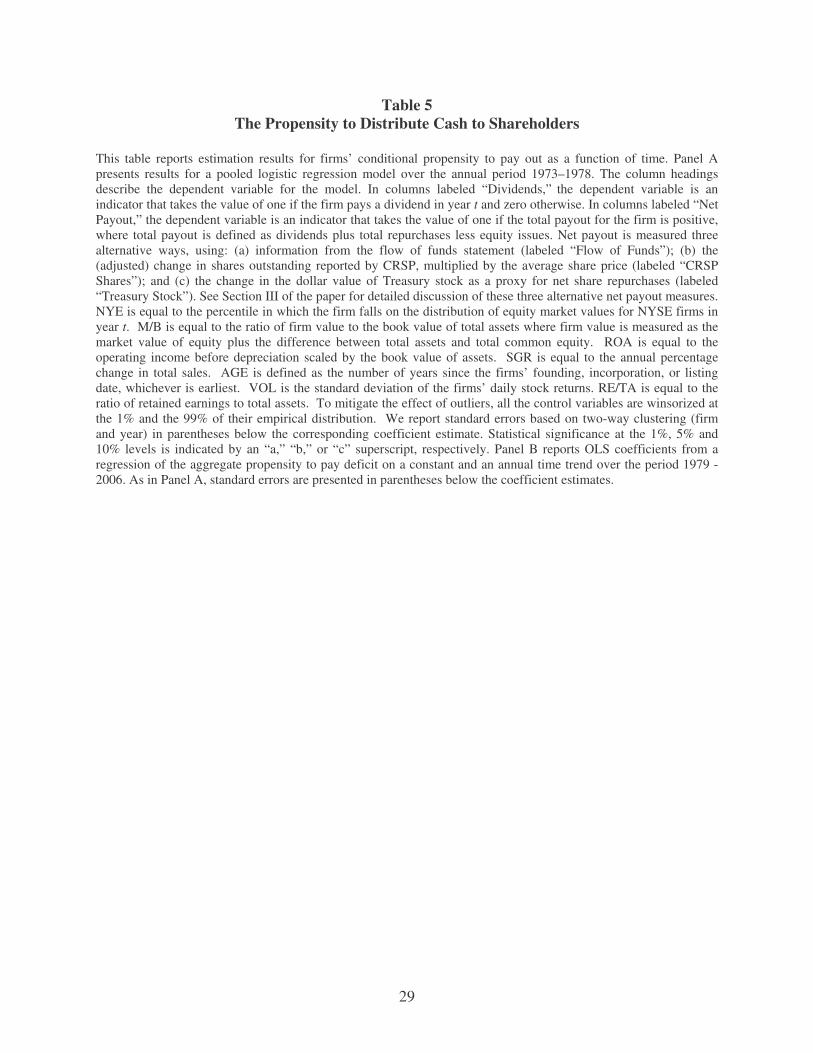
Table 5 The Propensity to Distribute Cash to Shareholders
This table reports estimation results for firms’ conditional propensity to pay out as a function of time. Panel A presents results for a pooled logistic regression model over the annual period 1973–1978. The column headings describe the dependent variable for the model. In columns labeled “Dividends,” the dependent variable is an indicator that takes the value of one if the firm pays a dividend in year t and zero otherwise. In columns labeled “Net Payout,” the dependent variable is an indicator that takes the value of one if the total payout for the firm is positive, where total payout is defined as dividends plus total repurchases less equity issues. Net payout is measured three alternative ways, using: (a) information from the flow of funds statement (labeled “Flow of Funds”); (b) the (adjusted) change in shares outstanding reported by CRSP, multiplied by the average share price (labeled “CRSP Shares”); and (c) the change in the dollar value of Treasury stock as a proxy for net share repurchases (labeled “Treasury Stock”). See Section III of the paper for detailed discussion of these three alternative net payout measures. NYE is equal to the percentile in which the firm falls on the distribution of equity market values for NYSE firms in year t. M/B is equal to the ratio of firm value to the book value of total assets where firm value is measured as the market value of equity plus the difference between total assets and total common equity. ROA is equal to the operating income before depreciation scaled by the book value of assets. SGR is equal to the annual percentage change in total sales. AGE is defined as the number of years since the firms’ founding, incorporation, or listing date, whichever is earliest. VOL is the standard deviation of the firms’ daily stock returns. RE/TA is equal to the ratio of retained earnings to total assets. To mitigate the effect of outliers, all the control variables are winsorized at the 1% and the 99% of their empirical distribution. We report standard errors based on two-way clustering (firm and year) in parentheses below the corresponding coefficient estimate. Statistical significance at the 1%, 5% and 10% levels is indicated by an “a,” “b,” or “c” superscript, respectively. Panel B reports OLS coefficients from a regression of the aggregate propensity to pay deficit on a constant and an annual time trend over the period 1979 - 2006. As in Panel A, standard errors are presented in parentheses below the coefficient estimates.
30
Panel A: Formation Period Logit Regressions (1973 – 1978)
Dividends Net Payout Flow of Funds
Net Payout CRSP Shares
Net Payout Treasury Stock
NYE 5.29 a 2.96 a 1.04 a 0.71 a 1.04a (0.13) (0.14) (0.11) (0.10) (0.11)
M/B -1.18 a -0.65 a -0.70 a -0.52 a -0.70a (0.05) (0.05) (0.04) (0.04) (0.04)
ROA 7.83 a 2.40 a 2.45 a 1.44 a 2.45a (0.26) (0.31) (0.28) (0.26) (0.28)
SGR -0.92 a -0.48 a -0.80 a -0.71a -0.80a (0.08) (0.08) (0.08) (0.08) (0.08)
Ln(AGE) 0.25 a 0.20 a 0.21 a 0.20a (0.02) (0.02) (0.02) (0.02)
Ln(VOL) -87.91 a -45.93 a -52.28 a -45.93a (2.30) (1.77) (1.78) (1.77)
RE/TA 3.85 a 3.04 a 2.75 a 3.04a (0.15) (0.12) (0.12) (0.12)
Constant -0.02 1.55 a 1.17 a 1.18 a 1.17a (0.05) (0.12) (0.11) (0.10) (0.11)
N 16338 16338 16338 16338 16338
Panel B: Trend Models for Deficit in the Propensity to Pay (1979 – 2006)
Dividends Net Payout Flow of Funds
Net Payout CRSP Shares
Net Payout Treasury Stock
Trend 0.82 a 0.43 a 0.06 -0.21 -0.11 (0.14) (0.09) (0.12) (0.15) (0.09)
Constant 0.00 0.04 a 0.05 a 0.07 a 0.04a (0.02) (0.01) (0.02) (0.02) (0.01)
N 28 28 28 28 28 R-squared 0.68 0.52 0.01 0.11 0.12

31
Table 6 The Propensity to Distribute Cash to Shareholders: Robustness to Formation Period
This table reports estimation results for firms’ conditional propensity to pay out as a function of time. Panel A presents results for a pooled logistic regression model over the annual period 1973–1983. The column headings describe the dependent variable for the model. In columns labeled “Dividends,” the dependent variable is an indicator that takes the value of one if the firm pays a dividend in year t and zero otherwise. In columns labeled “Net Payout,” the dependent variable is an indicator that takes the value of one if the total payout for the firm is positive, where total payout is defined as dividends plus total repurchases less equity issues. Net payout is measured three alternative ways, using: (a) information from the flow of funds statement (labeled “Flow of Funds”); (b) the (adjusted) change in shares outstanding reported by CRSP, multiplied by the average share price (labeled “CRSP Shares”); and (c) the change in the dollar value of Treasury stock as a proxy for net share repurchases (labeled “Treasury Stock”). See Section III of the paper for detailed discussion of these three alternative net payout measures. NYE is equal to the percentile in which the firm falls on the distribution of equity market values for NYSE firms in year t. M/B is equal to the ratio of firm value to the book value of total assets where firm value is measured as the market value of equity plus the difference between total assets and total common equity. ROA is equal to the operating income before depreciation scaled by the book value of assets. SGR is equal to the annual percentage change in total sales. AGE is defined as the number of years since the firms’ founding, incorporation, or listing date, whichever is earliest. VOL is the standard deviation of the firms’ daily stock returns. RE/TA is equal to the ratio of retained earnings to total assets. To mitigate the effect of outliers, all the control variables are winsorized at the 1% and the 99% of their empirical distribution. We report standard errors based on two-way clustering (firm and year) in parentheses below the corresponding coefficient estimate. Statistical significance at the 1%, 5% and 10% levels is indicated by an “a,” “b,” or “c” superscript, respectively. Panel B reports OLS coefficients from a regression of the aggregate propensity to pay deficit on a constant and an annual time trend over the period 1984 - 2006. As in Panel A, standard errors are presented in parentheses below the coefficient estimates.

32
Panel A: Formation Period Logit Regressions (1973 – 1983)
Dividends Net Payout Flow of Funds
Net Payout CRSP Shares
Net Payout Treasury Stock
NYE 5.15a 3.08a 0.94a 0.61a 0.94a (0.09) (0.10) (0.07) (0.07) (0.07)
M/B -1.04a -0.65a -0.74a -0.58a -0.59a (0.03) (0.03) (0.03) (0.02) (0.02)
ROA 7.72a 3.36a 3.29a 2.07a 2.61a (0.17) (0.21) (0.18) (0.17) (0.18)
SGR -0.94a -0.37a -0.73a -0.57a -0.63a (0.05) (0.05) (0.05) (0.05) (0.05)
Ln(AGE) 0.33a 0.25a 0.25a 0.27a (0.02) (0.02) (0.01) (0.02)
Ln(VOL) -72.78a -40.19a -45.09a -41.86a (1.64) (1.31) (1.31) (1.30)
RE/TA 3.68a 2.65a 2.16a 2.38a (0.10) (0.08) (0.08) (0.08)
Constant -0.10a 0.55a 0.66a 0.76a 0.72a (0.03) (0.08) (0.08) (0.07) (0.07)
N 32130 32130 32130 32130 32130
Panel B: Trend Models for Deficit in the Propensity to Pay (1984 – 2006)
Dividends Net Payout Flow of Funds
Net Payout CRSP Shares
Net Payout Treasury Stock
Trend 0.54a 0.37a -0.25c 0.13 -0.10 (0.16) (0.10) (0.12) (0.15) (0.11)
Constant 0.07a 0.04b 0.05a 0.01 0.02 (0.02) (0.02) (0.02) (0.02) (0.02)
N 23 23 23 23 23 R-squared 0.47 0.48 0.14 0.04 0.03

33
Table 7 Firm Retained Earnings and the Deficit in the Propensity to Pay
This table reports OLS coefficients from a time trend regression of the propensity to pay deficit for equal-weighted portfolios of firms formed based on retained earnings levels. In all cases, the expected propensity to pay for each year from 1979 – 2006 is computed based on coefficient estimates from the pooled logistic regression model (across all firms) over the annual period 1973–1978 reported in Table 5. We then form various portfolios of firms based on retained earnings levels. First we form ten retained earnings portfolios based on the absolute level of the RE/TA, following DeAngelo, DeAngelo and Skinner (2006). We also form two separate portfolios comprised of the largest 500 and 1,000 firms in terms of RE/TA. All portfolios are rebalanced annually. For each of these portfolios, we compute the actual fraction of firms with positive payouts, where positive payout is assessed based on whether a dividend is paid, or, alternatively, whether the firm’s net payout is positive. The actual fraction of firms with positive payout is then compared to the expected proportion of firms paying out. The table displays intercept and trend estimates for the regression of the deficit in the propensity to pay, defined as the expected proportion of paying firms less the actual proportion for each of the RE/TA-based portfolios of firms. Statistical significance at the 1%, 5% and 10% levels is indicated by an “a,” “b,” or “c” superscript, respectively. Net payout is computed using information from the flow of funds statement. Results for the alternative net payout measures are very similar and are omitted in order to conserve space.
Dividend Deficit Net Payout Deficit RE/TE Constant Trend Adj. R2 Constant Trend Adj. R2
<0.00 0.01 0.01 -0.03 0.01 -0.31 a 0.36
0.00-0.10 0.04 0.44 a 0.31 0.11 -0.35 b 0.12
0.10-0.20 0.02 0.82 a 0.67 0.13 -0.21 0.03
0.20-0.30 0.08 0.76 a 0.58 0.17 -0.34 b 0.10
0.30-0.40 0.10 0.90 a 0.56 0.18 -0.25 0.03
0.40-0.50 0.08 1.06 a 0.57 0.20 -0.39 c 0.09
0.50-0.60 0.05 1.17 a 0.73 0.17 -0.18 -0.01
0.60-0.70 0.00 1.55 a 0.81 0.11 0.14 -0.01
0.70-0.80 -0.04 1.43 a 0.86 0.03 0.23 0.05
0.80-0.90 0.01 0.76 a 0.46 -0.01 0.18 0.03
0.90+ 0.01 0.51 a 0.79 -0.03 -0.06 -0.02
34
Table 8 The Concentration of Dividends and Total Payout
This table reports the concentration of dividends and total payout among firms in our sample over different sub-periods. We form portfolios of firms according to their rank in terms of payout, where payout is alternatively measured using dividends and total payout (dividends plus repurchases). For each portfolio of firms, we report the portfolio’s payout as a percentage of total payout for all firms. The rows in the table are ordered according to increasingly large portfolios of “top-payers,” and we also present the cumulative percentage of total payout found by summing payout among firms with payout levels in the same tier or higher tiers. Results are presented over both the 1980-1988 and 1998-2006 sub-intervals.
Payout ranking Percent of total
dividends (%) Cumulative % of total dividends (%) Percent of total
payout (%) Cumulative % of total payout (%)
1980-88 1998-06 1980-88 1998-06 1980-88 1998-06 1980-88 1998-06
Top 25 47.0 56.6 47.0 56.6 43.8 46.6 43.8 46.6
26-50 12.9 13.7 59.9 70.3 15.0 14.1 58.7 60.7
51-100 12.9 12.8 72.7 83.1 14.2 13.6 72.9 74.4
101-200 12.0 9.4 84.7 92.6 11.8 11.9 84.7 86.3
201-300 5.8 3.6 90.5 96.2 5.4 5.4 90.1 91.7
300-400 3.3 1.8 93.8 98.0 3.2 3.0 93.3 94.7
401-500 2.0 1.0 95.8 99.0 2.0 1.8 95.3 96.5
501-1000 3.7 1.0 99.5 100.0 3.8 3.0 99.1 99.5
1001-1500 0.5 0.0 100.0 100.0 0.8 0.4 99.9 100.0
1501-2000 0.0 0.0 100.0 100.0 0.1 0.0 100.0 100.0

35
Table 9 Payout Yield Regressions
This table reports results for firms’ payout normalized by the market value equity. In the first column of the table, the dependent variable is the firm’s annual dividend payment divided by its year-end market value. In the second column of the table, the dependent variable is the firm’s annual net payout (dividends plus repurchases less equity issuances), divided by year-end market capitalization. Net payout is measured three alternative ways, using: (a) information from the flow of funds statement (labeled “Flow of Funds”); (b) the (adjusted) change in shares outstanding reported by CRSP, multiplied by the average share price (labeled “CRSP Shares”); and(c.) the change in the dollar value of Treasury stock as a proxy for net share repurchases (labeled “Treasury Stock”). See Section III of the paper for detailed discussion of these three alternative net payout measures. For each year during the 1979 – 2006 period the expected payout yield, where payout is measured alternatively as dividends, total payout, or net payout, is computed based on estimates from a pooled linear regression model over the 1973 – 1978 period. For the dividend yield regressions, we use a Tobit model rather than a linear model due to the clustering of values at zero. The firm-level characteristics included in the model are NYE, M/B, SGR, ROA, Ln(AGE), Ln(VOL) and RE/TA . All control variables are winsorized at the 1% and the 99% of their empirical distribution and a constant term is also included in the model. We report standard errors based on two-way clustering (firm and year) in parentheses below the corresponding coefficient estimate. We then compute the difference between the expected yield and the actual yield for each firm-year over 1979 – 2006. These are then averaged by year to produce an annual time series of deficits in the level of payout. Panel B reports OLS coefficients from a time trend regression of these deficits for 1979 – 2006. As in Panel A, standard errors are presented in parentheses below the coefficient estimates. Statistical significance at the 1%, 5% and 10% levels is indicated by an “a,” “b,” or “c” superscript, respectively.
36
Panel A: Formation Period Logit Regression (1973 – 1978)
Dividend Yield Net Payout Yield Flow of Funds
Net Payout Yield CRSP Shares
Net Payout Yield Treasury Stock
NYE 1.16 a -1.34 a -1.14a -1.11a (0.11) (0.25) (0.21) (0.19)
M/B -1.84 a -0.94 a -0.81a -1.06a (0.05) (0.09) (0.08) (0.07)
ROA 1.49 a 2.71 a -1.18b 1.10b (0.35) (0.63) (0.53) (0.48)
SGR -1.05 a -2.45 a -1.81a -2.05a (0.11) (0.17) (0.14) (0.13)
Ln(AGE) 0.40 a 0.56 a 0.42a 0.52a (0.03) (0.06) (0.05) (0.04)
Ln(VOL) -12.96 a -8.12 a -8.64a -7.47a (0.26) (0.44) (0.37) (0.34)
RE/TA 4.79 a 1.81 a 1.58a 1.36a (0.15) (0.17) (0.15) (0.13)
Constant 4.68 a 4.19 a 4.67a 4.71a
(0.14) (0.28) (0.24) (0.22)
N 16,337 16,337 16337 16337
Panel B: Trend Model for Deficit in the Propensity to Pay (1979 – 2006)
Dividend Yield Net Payout Yield Flow of Funds
Net Payout Yield CRSP Shares
Net Payout Yield Treasury Stock
Trend 4.65 a -8.72 b 3.43 -9.40a (0.91) (3.49) (2.78) (2.70)
Constant -1.18 a 3.16 a 2.30a 0.55 (0.17) (0.66) (0.43) (0.37)
N 28 28 28 28 R-squared 0.64 0.20 0.06 0.41

37
Figure 1 Activity in Multiple Payout Channels
This figure presents the average proportion of firms in our sample that (a) pay a dividend and repurchase shares in the same year; (b) pay a dividend and issue equity in the same year; (c) repurchase shares and issue equity in the same year; and (d) pay a dividend, repurchase shares and issue equity in the same year. These proportions are presented over five different sub-intervals spanning 1973-2006.
0.00
0.05
0.10
0.15
0.20
0.25
1973-1979 1980-1986 1987-1993 1994-2000 2001-2006
Ye ars
Prop
ortio
n of
Fir
ms
Div. and Rep. Div.and Iss. Rep. and Iss. Div., Rep. and Iss.

38
Figure 2 Payout Incidence Over Time
This figure presents the average proportion of firms (a) paying a dividend; and (b) with positive net payout over five different sub-intervals spanning 1973-2006. Net payout is defined as dividends plus total repurchases less equity issues. Net payout is computed using information from the flow of funds statement as described in detail in Section III of the paper.
0.0
0.1
0.2
0.3
0.4
0.5
0.6
0.7
0.8
1973-1979 1980-1986 1987-1993 1994-2000 2001-2006
Years
Prop
ortio
n of
Fir
ms
Paying a Dividend With Positive Net Payout

39
Figure 3
Deficit in the Propensity to Pay The figure tracks the deficit in the propensity to pay over time for alternative models of firm payout. The deficit in the propensity to pay for each year is defined as the proportion of firms expected to pay less the actual proportion of paying firms. The deficit in the propensity to pay is presented for three pooled logit models: (a) a model in which the dependent variable is a dummy that takes the value one if the firm pays a dividend with the explanatory variables SIZE, M/B, ROA and SGR (collectively labeled “Fama-French controls”); (b) a model in which the dependent variable is a dummy that takes the value one if the firm pays a dividend with the explanatory variables SIZE, M/B, ROA, SGR, the natural logarithm of AGE, the natural logarithm of VOL and RE/TA (collectively labeled “all controls”); and (c) a model in which the dependent variable is a dummy that takes the value of one if the net payout of the firm in a given year is positive, where net payout is defined as dividends plus repurchases less equity issuances, with all controls included. Table 5 presents coefficient estimates for these models and fits linear trends to the time series of deficits presented here. The figure includes deficits for the out-of-sample period of 1979 – 2006, during which the expected proportion of paying firms is computed using coefficient estimates from the 1973 – 1978 period.
0
0.02
0.04
0.06
0.08
0.1
0.12
0.14
0.16
0.18
0.2
Exp
ecte
d %
Pay
ers
-Act
ual %
Pay
ers

40
Figure 4 Deficit in the Propensity to Pay Dividends vs. Deficit in the Propensity to Pay Cash for
Firms Sorted by Retained Earnings This figure depicts the proportion of expected payers minus the proportion of actual dividend payers by groups of firms sorted on the ratio of retained earnings to total equity (RE/TE). This information is presented both for dividends as a measure of payout and for net payout, defined as dividends plus repurchases less equity issuances. Panel A depicts results for dividends, while Panel B depicts results for net payout. Net payout is computed using information from the flow of funds statement as described in detail in Section III of the paper.
Panel A: Dividends
-0 .2 0
-0 .10
0 .0 0
0 .10
0 .2 0
0 .3 0
0 .4 0
<0 .0 0 0 .0 0 -0 .10 0 .10 -0 .2 0 0 .2 0 -0 .3 0 0 .3 0 -0 .4 0 0 .4 0 -0 .50 0 .50 -0 .6 0 0 .6 0 -0 .70 0 .70 -0 .8 0 0 .8 0 -0 .9 0 0 .9 0 +
RE/TE Le ve l
Exp.
% -
Act
. %
1980-1988 Dividends 1998-2006 Dividends
Panel B: Net Payout Measured Using Flow of Funds Information
-0.20
-0.10
0.00
0.10
0.20
0.30
0.40
<0.00 0.00-0.10 0.10-0.20 0.20-0.30 0.30-0.40 0.40-0.50 0.50-0.60 0.60-0.70 0.70-0.80 0.80-0.90 0.90+
RE/TE Level
Exp
. % -
Act
. %
1980-1988 Net Payout 1998-2006 Net Payout
41
Figure 5
Payout Yield Over Time
This figure depicts the dividend yield and the net payout yield over five different sub-intervals spanning 1973-2006. The dividend yield for a given year is defined as the aggregate dividend paid across all firms in our sample in that year divided by the total market capitalization of firms in our sample in the corresponding year. The net payout yield is defined by the aggregate net payout, equal to the sum of dividends plus repurchases less equity issuances, divided by aggregate market capitalization.
0.0%
0.5%
1.0%
1.5%
2.0%
2.5%
3.0%
3.5%
1973-1979 1980-1986 1987-1993 1994-2000 2001-2006
Years
Yie
ld
Dividend Net Payout