Has Ghana avoided the “Resource Curse” and taken a path ... · PDF fileHas Ghana...
25
Kate Starkey 1 School of Economics L13500 Economics Dissertation 2015 Has Ghana avoided the “Resource Curse” and taken a path toward sustainable development? Name: Kate Starkey Supervisor: Markus Eberhardt This Dissertation is presented in part fulfilment of the requirement for the completion of an undergraduate degree in the School of Economics, University of Nottingham. The work is the sole responsibility of the candidate. I give permission for my dissertation to be made available to students in future years if selected as an example of good practice.
Transcript of Has Ghana avoided the “Resource Curse” and taken a path ... · PDF fileHas Ghana...
Kate Starkey
1
School of Economics
L13500 Economics Dissertation 2015
Has Ghana avoided the “Resource Curse” and taken a path toward sustainable
development?
Name: Kate Starkey
Supervisor: Markus Eberhardt
This Dissertation is presented in part fulfilment of the requirement for the completion of an
undergraduate degree in the School of Economics, University of Nottingham. The work is the
sole responsibility of the candidate.
I give permission for my dissertation to be made available to students in future years if selected
as an example of good practice.
Kate Starkey
2
Contents
Preface .................................................................................................................................................... 3
1. Literature Review on the Resource Curse and it’s Causes .................................................................. 4
1.1 Introduction ............................................................................................................................ 4
1.2 Evidence supporting the “Resource Curse” effect .................................................................. 4
1.3. Economic Causes of the Resource Curse ..................................................................................... 5
1.4. Political causes of the Resource Curse ......................................................................................... 7
1.5 Conclusions ................................................................................................................................... 8
2. Case Study of Ghana ........................................................................................................................... 8
2.1 Introduction .................................................................................................................................. 8
2.2 Ghana’s Economy .......................................................................................................................... 9
2.3 Economic Transmission ............................................................................................................... 10
2.3.1 Dutch Disease........................................................................................................................... 10
2.3.2 Terms of Trade Volatility .......................................................................................................... 12
2.4 Political Transmission .................................................................................................................. 13
2.4.1 Tendency to Optimism ............................................................................................................. 13
2.4.2 Productivity of Investment & Debt Overhang ......................................................................... 14
2.4.3 Corruption ................................................................................................................................ 16
Ghana’s Revenue Management Act ............................................................................................. 17
Public Interest and Accountability Committee ............................................................................. 17
Extractive Industries Transparency Initiative (EITI) ...................................................................... 17
3. Policy Implications ........................................................................................................................ 18
Conclusion ............................................................................................................................................. 19
Bibliography .......................................................................................................................................... 22

Kate Starkey
3
Preface
Globally, the growth rate between countries varies massively. In 2013, Paraguay grew by 14.2%,
whereas the Central African Republic shrank by 36% (World Bank, 2015). These differences
have huge consequences for the quality of human life and hence understanding why disparities
exist and how to induce growth is an important question to tackle. Robert Lucas famously
summarised this, asking: ‘is there some action that the government of India could take that
would lead the Indian economy to grow like Indonesia’s? The consequences for human welfare
involved in questions like these are simply staggering’ (Lucas, 2002, p. 21). Therefore theories
on economic growth are paramount, yet a paradoxical result contradicting neoclassical growth
theory exists: on average finding natural resources leads to a slowdown in the economic growth
rate (Frankel, 2010). However, few would advise a country that finds resource wealth to destroy
its assets, suggesting that most believe that the resource curse is avoidable. This matches
anecdotal evidence, Torvik notes that ‘For every Nigeria or Venezuela there is a Norway or a
Botswana’ (Torvik, 2009, p. 241) showing that although the negative relationship exists on
average, there are exceptions. This paper seeks to improve understanding within traditional
frameworks of why this may be the case and how it can be prevented in the future. To do this
we have employed the case of Ghana: recently, Ghana had been celebrated as an African
development success and looked set to join a path to prosperity. However, in 2007 the country
discovered oil and since exportation began many macroeconomic indicators have declined,
leading to the suggestion that the economy is suffering from the resource curse. This paper
begins with an objective stance, seeking to understand whether this is the case in Ghana, and if
so then why. In order to make a judgment on this we use the following framework:
We begin by examining a range of evidence that resource endowment leads to a negative effect
on growth, finding that in certain periods evidence that this is the case seems robust. Taking its
existence as given, we then turn to examine why resources may be a ‘curse’ - meaning there is
an inherent reason why resources are detrimental to growth. We examine both economic
arguments such as the impact on terms of trade, commodity price volatility and Dutch disease
as well as political arguments including the behaviourist view, institutions and corruption.
Through this analysis we find that in theory any one of these reasons could potentially link
resources to a negative growth effect, however there is the suggestion that institutions could
prevent this from occurring and hence resources would not be a curse if managed well.
Therefore, as Ghana has recently received the windfall of oil and appears to have relatively
Kate Starkey
4
stable institutions, we investigate if and how the resource curse has managed to take hold,
examining indicators such as the growth rate, exchange rate, debt ratio and corruption indices.
We judge that the high debt to GDP ratio and the finding of resources are somewhat intertwined
and propose that the link between the two is that discovering oil inspired optimism which lead
to mismanagement of an economy which was otherwise secure. In this way we strengthen the
line of argument that resources are a curse to an economy as they induce a type of behaviour
which was not previously apparent. We then turn to look at whether there is a way out for
Ghana and if/how this scenario could be prevented in the future, concluding that the resource
curse has not yet fully materialised and some policy changes could mitigate the resource curse.
As a result of this, we hope that lessons can be learnt from Ghana and be applied elsewhere to
prevent the ‘resource curse’ taking hold in the future.
1. Literature Review on the Resource Curse and it’s Causes
1.1 Introduction
The evidence in favour of a resource curse is not only anecdotal, but has been borne out in
econometric tests across a broad sample of countries. Development economists did not predict
this paradoxical result: theoretically resources can help to fund investment, a key driver of
growth in the Lewis and Solow models and provide the necessary ‘big push’ to exit the cycle of
poverty, advocated by Murphy et al.1989. In spite of this, cross sectional studies have shown
that resource rich economies grow slower than others, notably Sachs and Warner’s 1995 paper
which inspired a revival of interest. This section seeks to critically examine the evidence for a
resource curse and its causes.
1.2 Evidence supporting the “Resource Curse” effect
Sachs and Warner’s 1995 paper takes 1971 as the base year and finds that economies with a
high ratio of natural resource exports to GDP in this year had lower growth rates during the
subsequent years 1971-89. They control for variables considered in the literature to impact
growth. In this way, their regression analysis is more robust than papers such as Doppelhofer et
al. (2000) which fails to control for geographical factors and hence suffers from omitted variable
bias (Sachs & Warner, 2001). Other economists ran similar regressions and confirmed their
findings: Auty (2004), Leite and Weidmann (1999) and Gylfason et al., (1993) found similar

Kate Starkey
5
results using bigger data sets. However, they all looked at a similar period to Sachs and
Warner’s 1995 paper (1960-1990, 1970-90, 1960-1992, respectively). According to Hong
(2009), extending Sachs and Warner’s analysis from 1970 to 2003 shows that the effects of the
natural resource curse are not constant – in the most recent time period 1990-2003 the
negative relationship between natural resources and growth appears to have diminished, ratio
of natural resource exports to GDP is no longer statistically significant at the 10% level. This is
interesting as it suggests that we may have learnt how to mitigate the resource curse over time.
Another criticism of Sachs and Warner (1995) comes from Brunnschweiler & Bulte (2006) who
find fault in their proxy for resource abundance which is ratio of resource exports to GDP. This
highlights a valuable point: the ‘resource curse’ only exists for those dependent on natural
resources, not abundant in them. Defining the resource curse in this way, we generate a
necessary understanding of the economic and political ramifications when natural resource
revenues are a large proportion of GDP rather than large revenues in absolute terms.
A further criticism from Neumayer suggests that GDP is not the most appropriate measure of
income as it ‘contains an element of depreciation of capital that should not be counted as
income’ (Neumayer, 2004, p. 1627). He argues that depreciation tends to be higher for
economies that are intensive in natural resources and that when you take this into account the
correction to GDP can be up to 30%. Correcting for this using Net Domestic Product (NDP),
Neumayer finds that the evidence in favour of the resource curse is more robust than previous
studies. This is an important finding and strengthens the evidence that a resource curse exists.
The effect of natural resources on NDP has not been studied for the 1990-2003 period, and this
gap in the literature makes it hard to definitively conclude whether the resource curse is an
ongoing phenomenon. However, the evidence that it existed from 1960-1999 seems conclusive,
and as a result we will now investigate the economic and political causes of this counterintuitive
relationship.
1.3. Economic Causes of the Resource Curse
Literature on the resource curse originated in 1950, where economists Singer (1950) and
Prebisch (1950) hypothesise that reliance on primary exports weaken a country’s terms of
trade (TOT) over time as they become cheaper relative to manufactured goods due to their
lower income elasticity of demand. However, Arezki, et al., 2013 contest this. They examine the
trends in commodity prices over three and a half centuries, accounting for structural breaks
which eliminates a main cause of inaccuracy. They find mixed results in TOT trends, but
conclude volatility is high. This suggests that the Prebisch-Singer hypothesis has not fully

Kate Starkey
6
materialised as expected because TOT have not declined for all. Therefore, if a curse does exist,
TOT cannot be the sole cause as it does not account for the variance.
Whilst the evidence from Arezki et al., 2013 does not fully support the TOT thesis, their findings
that TOT are volatile supports the work of Nurkse (1958) and Levin (1960). They argue that
commodity markets are inherently unstable and this is passed on to the governments of
resource exporting countries who receive volatile income streams, increasing the risk
associated with investing in these countries (Rosser, 2006). This is further supported by
Turnovsky and Chattopadhyay (2003) who conclude that ‘terms of trade volatility, government
expenditure volatility and monetary volatility have strong negative impacts on the equilibrium
growth rate’ (Turnovsky & Chattopadhyay, 2003, p. 294). Therefore, there is strong evidence
that TOT have an effect, however, government expenditure volatility and monetary policy
volatility are not free market responses, they reflect intervention which could support that
although there is an economic resource curse effect, there may also be a political aspect.
TOT volatility is not the only credible economic argument. Much of the literature emphasises
the impact of ‘Dutch disease’. This is an extension of the TOT argument, which theorises that the
boom and bust cycle for natural resources means that there are periods of rapid appreciation
which depress other sectors of the economy (Corden & Neary, 1982). The second strand argues
that investment in the booming resource sector does not lead to a large increase in growth
because it pulls away resources from other sectors which were previously more profitable,
reducing productivity growth and hence the change in output is minimal. This argument is the
primary explanation offered by Sachs and Warner (1995). Whilst there is significant rationale
for the Dutch disease some suggest it can be overcome by policy. Wijnbergen (1984) concludes
that whilst Dutch disease has negative effects, these can be mitigated by subsidising industries
where there is a strong learning by doing effect, meaning high potential for productivity gain. As
a result, this hypothesis could explain the varied effects of finding natural resources on an
economy, as although Dutch disease is very much real, it can be overcome by policy and so is not
in itself a curse.
The Dutch disease hypothesis is one of the few which could also suggest why the resource curse
has not been apparent in the most recent period. Most economies found their natural resources
before 1990, their currency will not appreciate once output has plateaued, and their
manufacturing sector may already be too small for there to be any significant negative effect of
diverting resources away from this area. As a result, there is a suggestion that the economic
‘resource curse’ could be transitional, future research could focus on this area by accounting for
the time since the resources were discovered in regression analysis.
Kate Starkey
7
1.4. Political causes of the Resource Curse
In the previous section we highlighted that some of the economic reasons for the resource curse
may have a policy prescription. However, it was also suggested that government expenditure
and monetary policy, if volatile, could undermine growth. Therefore, it is necessary to
investigate how policy can alter the problems posed by natural resource endowment, and the
extent to which policy choices are necessitated by economic rationale, as this will explain
whether they are driven by the resource endowment.
A political argument which supports the resource curse is the behavouralist view (Rosser, 2006,
p. 14). Mitra has argued that resource booms produce a ‘tendency to optimism’ (Mitra, 1994, p.
295) which leads to excessive government spending. Rosser explains that this is corroborated
by Krause (1955) and Ross (1999), strengthening the line of argument. In this way, the resource
creates the optimism and overspending as opposed to political failure. This provides evidence
that a curse exists and there is no blame to find. However, Mitra (1994) on the case of Kenya
concludes that the spending decisions and shocks to terms of trade had equally negative effects
on growth, and so whilst there is merit in this argument it should not attain sole attention.
The state centred perspective extends this, explaining that not only is there overspending but
this is exacerbated by bad investment decisions (Rosser, 2006, p. 15). When the majority of tax
revenue comes from natural resources rather than productive activity, there is less incentive to
promote policy which is good for future business (Chaudhry, 1994), hence the investment may
have a low return; future growth is below its potential. Whilst Chaudhry stops here, Manzano
and Rigobon (2001) extend this to borrowing: lenders are more likely to lend to resource rich
countries as their resources are collateral. An economy may take advantage of this to finance the
costs of extraction, but may also be ‘overly optimistic’ and borrow beyond their means to keep
the people happy and promote growth in the current period (Auty, 2001). However, if the
return on investment is low, countries may not be able to finance this debt in the future - this is
known as debt overhang. Combining this with Dutch disease induced currency appreciation
means that the cost of servicing the debt increases. Therefore, a combination of political failure
and market reactions can have devastating effects on the economy. This argument seems logical,
and is based on the premise that the government will behave in a way which pleases its people.
As this problem is an effect of policy, it could have a political solution.
Another relationship which has been identified is between dependency on resources and
corruption. Leite & Weidmann conclude from their empirical work that ‘capital intensive

Kate Starkey
8
natural resources are a major determinant of corruption’ (Leite & Weidmann, 1999, p. 30).
Papyrakis & Gerlagh (2004) agree with this view, claiming ‘Natural resources have a negative
impact on growth if considered in isolation, but a positive direct impact on growth if other
explanatory variables, such as corruption… are included’ (Papyrakis & Gerlagh, 2004, p. 1).
Their reasoning is that investment is a large determinant of growth, and when corruption exists
this channel is limited because revenues from resources are instead leaked out for personal
gain. This is in line with neoclasical growth theory, and highlights the need for institutions
which serve the people. Bleaney & Halland, (2009) find that institutions, as measured by the
proxy variable Rule of Law Index, matter for growth, however, they conclude that this is not
because of their effect on reducing volatile government spending. As a result, further
investigation into the transmission mechanism between institutions and the resource curse may
clarify the connection.
1.5 Conclusions
Whether or not the resource curse still exists is debated, but from our review we have
concluded that between the years 1960-1990 there is robust evidence that this phenomenon
existed and, unless we understand why, it may be revived in the future. Both economic and
political arguments find cause for the resource curse. Terms of trade volatility and Dutch
disease are empirically shown to have some effect, as are investment decisions and corruption.
Even when a link is established such as between institutions and growth of the resource rich, it
is hard to ascertain why from these studies. As a result, there is no concrete understanding of
the resource phenomenon. By using a case study approach and exploring a country which has
found natural resources more recently, such as Ghana, we may improve our understanding of
the link. Part 2 will aim to assess the rent flows from the extraction of oil and analyse their
economic and political impact.
2. Case Study of Ghana
2.1 Introduction
In 2007 Ghana discovered the largest quantity of oil of any West African economy in the
offshore Jubilee oil field (Kosmos Energy, 2012). Jubilee has recoverable reserves estimated
between ‘370 million barrels and 1.8 billion barrels’ (Ayensu, 2013, p. 152) and further

Kate Starkey
9
exploration has revealed more oil fields currently in development. Senior political figures have a
strong will to use this oil revenue for the development of Ghana (BBC, 2007) and to avoid the
pitfalls of resource windfalls which have affected many other Sub-Saharan African economies
(Amoako-Tuffour, 2011). As well as this intent, Ghana’s economic history makes it a case of
interest: between 2000-2007 they reported year on year growth of 5% (Trading Economics,
2015) suggesting the economy was on a path to transition from a low to a middle income
country. An acceleration of this growth, ceteris paribus, would suggest that the discovery of oil
has been beneficial, whereas a slowdown from this trajectory could provide further evidence for
the resource curse. In this section we will examine data from Ghana since 2007, concluding that
although they have not yet fallen victim to the resource curse, neither are they in the clear. We
will then explore each of the arguments for the resource curse outlined in Section 1 with respect
to Ghanaian macroeconomic data including: GDP growth and composition, exchange rates,
interest rates, debt levels, investment and indicators of corruption. Whist we accept that it will
be hard to draw definitive conlusions from this type of analysis due to the difficulty in
attributing cause and the recent nature of the discovery, we hope to gain further insight into
how the resource curse takes hold. This should enable judgment on the effectiveness of Ghana’s
resource management and also aid policy decisions to mitigate the resource curse in the future
for both Ghana and other developing economies.
2.2 Ghana’s Economy
Figure 1: Plot shows annual real GDP growth rate at market prices based on constant local currency. Aggregates are based on constant 2005 U.S. dollars. Source: World Bank, 2015
Kate Starkey
10
Ghana made the transition from a low to middle income country in 2011 (Kenny & Sumner,
2011). Although the growth rate has fallen from its 2011 peak, 2014 data still shows growth
above 4% (Ghana Statistical Service, 2014) suggesting that the economy is still on track.
Although growth is strong, the economy is not necessarily healthy: large current account and
balance of payments deficits, high interest rates, crippling national debt levels and a rapidly
depreciating currency could soon undermine growth (Blas, 2014). Although many
macroeconomic indicators have declined since exporting oil we cannot declare Ghana a casualty
of the resource curse yet. In this section we assess whether oil has impacted the economy in line
with the expectations of the literature and hence whether Ghana’s recent troubles are early
symptoms of the resource curse.
2.3 Economic Transmission
2.3.1 Dutch Disease
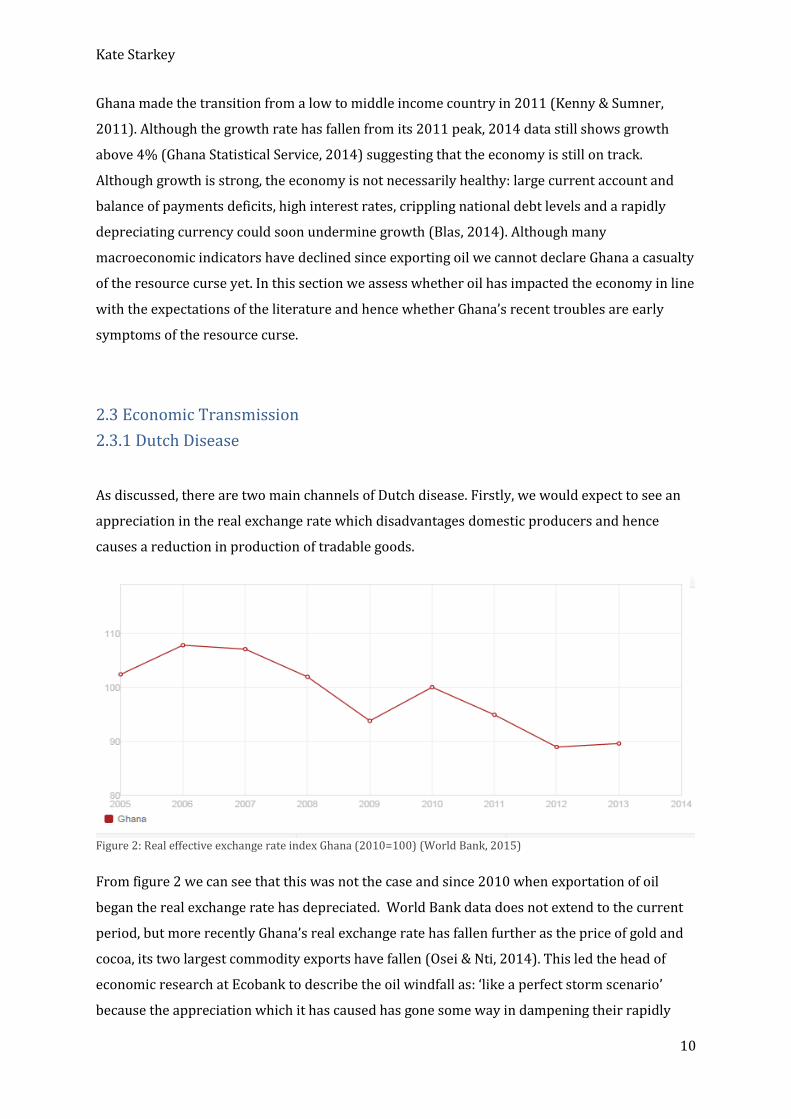
As discussed, there are two main channels of Dutch disease. Firstly, we would expect to see an
appreciation in the real exchange rate which disadvantages domestic producers and hence
causes a reduction in production of tradable goods.
Figure 2: Real effective exchange rate index Ghana (2010=100) (World Bank, 2015)
From figure 2 we can see that this was not the case and since 2010 when exportation of oil
began the real exchange rate has depreciated. World Bank data does not extend to the current
period, but more recently Ghana’s real exchange rate has fallen further as the price of gold and
cocoa, its two largest commodity exports have fallen (Osei & Nti, 2014). This led the head of
economic research at Ecobank to describe the oil windfall as: ‘like a perfect storm scenario’
because the appreciation which it has caused has gone some way in dampening their rapidly

Kate Starkey
11
depreciating currency (Osei & Nti, 2014). Therefore, the timing of Ghana’s oil export seems to
have helped to stabilise the exchange rate. In this way, oil has been a blessing.
However, this does not ensure that the secondary impact of reducing productivity growth has
been avoided. To see this we must examine structural change to the economy.
Figure 3: Gross Domestic Product (GDP) at Current Market Prices by Economic Activity, Ghana Statistical Service, 2015
Theory on Dutch disease suggests that since finding oil, factors of production will be pulled
away from non-resource sectors towards resources and non tradeables. This would see services
grow whilst agriculture and industry decline. However data shows that this has not materialised
as expected. Services have increased as a proportion of GDP but not dramatically. Agriculture
has experienced the biggest change and reduced in line with expectations. However we would
have expected industry to decline as resources are diverted toward non tradeables. This has
likely not happened due to the depreciation of the cedi which has kept industry competitive.
However productivity is still a concern. The 2014 Competitiveness report of the World
Economic Forum highlighted Ghana’s weakness in technology, innovation and labour market
efficiency (Schwab, 2014), suggesting that productivity is behind the competitiveness challenge.
The literature suggested that this would happen as resources are diverted from productive
activity to resource extraction. But, in line with the suggestion of Wijnbergen (1984), Ghana has
been proactive in implementing policies to become more competitive: the five year industrial
development plan (2011-2015) targeted industry with the aim of boosting production and
competitiveness (Oxford Business Group, 2011). This is likely to have been part of the reason
for the growth of industry and hence has helped balance the growth in services, going some way
in avoiding the Dutch disease effect.
As a result, we can conclude that Dutch disease has not impacted Ghana in the way that the
literature suggests. This has happened largely due to luck; we cannot connect the change in
global gold and cocoa prices with the discovery of oil, but also due to good management as
Agriculture, 29%
Industry, 21%
Services, 50%
2007
Agriculture
Industry
Services
Agriculture, 20%
Industry, 28%
Services, 52%
2014
Agriculture
Industry
Services

Kate Starkey
12
Ghana’s government has been proactive by introducing policies to deal with competitiveness.
This said, we are unable to judge the success of this policy as it is too early to see long term
effects so whilst we agree with their policy intentions, we can say less about overall
effectiveness at this stage.
2.3.2 Terms of Trade Volatility
We previously concluded that there was significant evidence that the volatility in commodities
markets and resulting policy could pose a threat to development. The recent drop of nearly 50%
in crude oil price is a stark example of this type of volatility: the government announced its
November budget based on a price of $99.736 a barrel, now it trades below $50 (Kpodo, 2015).
Turnovsky and Chattopadhyay (2003) suggested that this would hurt Ghana by impacting fiscal
policy but this has not yet been the case.
Ghana had implemented the Petroleum Revenue Management Act, to prevent any revenue
shortfalls from impacting the budget. The act established two petroleum funds: the Ghana
Heritage Fund (GHF) aimed at conserving wealth for future generations and the Ghana
Stabilisation Fund (GSF) to promote macroeconomic stability by cushioning budget revenue in
times of shortfall. These funds should help mitigate Dutch disease by diversifying their portfolio
of investments. The setup is such that after the Annual Budget Funding Amount (ABFA) (which
can be up to 70% of revenue) is met, the remaining revenue is split between funds. It is only the
GSF which can be drawn on in times of shortfall and this was capped at $250 million. In 2014,
the GSF reached the cap and hence no more was deposited. According to the model created by
the Natural Resource Government Institute who have used public data to model oil revenues as
price changes, if the price of oil remains at an average of $50 barrel throughout 2015, the GSF
will be depleted by -$137 million, over half its value in one year (Table 1).
Table 1: Data from the oil revenue forecasting model by the Natural Resource Governance Institute (Mihalyi, 2014)
2015 Brent price Total GNPC ABFA GHF GSF Contingency Total
$/barrel $ million $ million $ million $ million $ million $ million $ million
50 664 125 676 0 -137 664
50.00 664 125 676 0 -137 664
99.38 1,386 196 722 141 150 178 1,386
70.00 956 153 722 24 57 0 956
130.00 1,834 240 722 262 150 461 1,834

Kate Starkey
13
Thus how well Ghana will be able to maintain budget stability and finance its outgoings seems
to be in the hands of fate. Another year of $50/barrel prices would put the country at risk.
Deloitte suggest a price rise is likely in the latter half of the year (Deloitte, 2015) but this is
uncertain. Therefore, whilst Ghana has done well to establish the petroleum wealth funds, the
level of the GSF cap could be deemed inappropriate due to the short timeframe it would take to
wipe out. As a result, the current volatility in the oil market has not yet adversely affected state
finances severely, but should the price continue at under $50 a barrel this scenario could
quickly change. Ghana face high borrowing costs and would be ill advised to borrow more to
maintain spending given the investor response to their already high budget deficit. Therefore it
seems plausible that volatility could impact their economy in future years and hence there will
be some negative consequence of finding oil.
Overall, we have found that in the case of Ghana the economic transmission mechanisms which
the literature suggest would cause Dutch disease have not prevailed. This is partially due to
good fortune in the cedi’s depreciation but also due to good management in the establishment of
the GSF and GHF. However, as discussed the GSF may not be large enough to stabilise future
budgets and therefore whilst at the minute the effect of volatile commodity prices can be
mitigated, this is may not be the case in the future due to the level of the cap.
2.4 Political Transmission
2.4.1 Tendency to Optimism
The resource curse is also said to take hold through political means. The first argument from
this school of thought suggests that no corruption need exist for this to happen and that it is a
likely transmission of the resource curse in any economy regardless of usual prudence. Mitra
calls this tendency to optimism which results in excessive, unusual borrowing levels.
Figure 4: Government Budget as % of GDP using data from the Bank of Ghana, (Trading Economics, 2015)
Kate Starkey
14
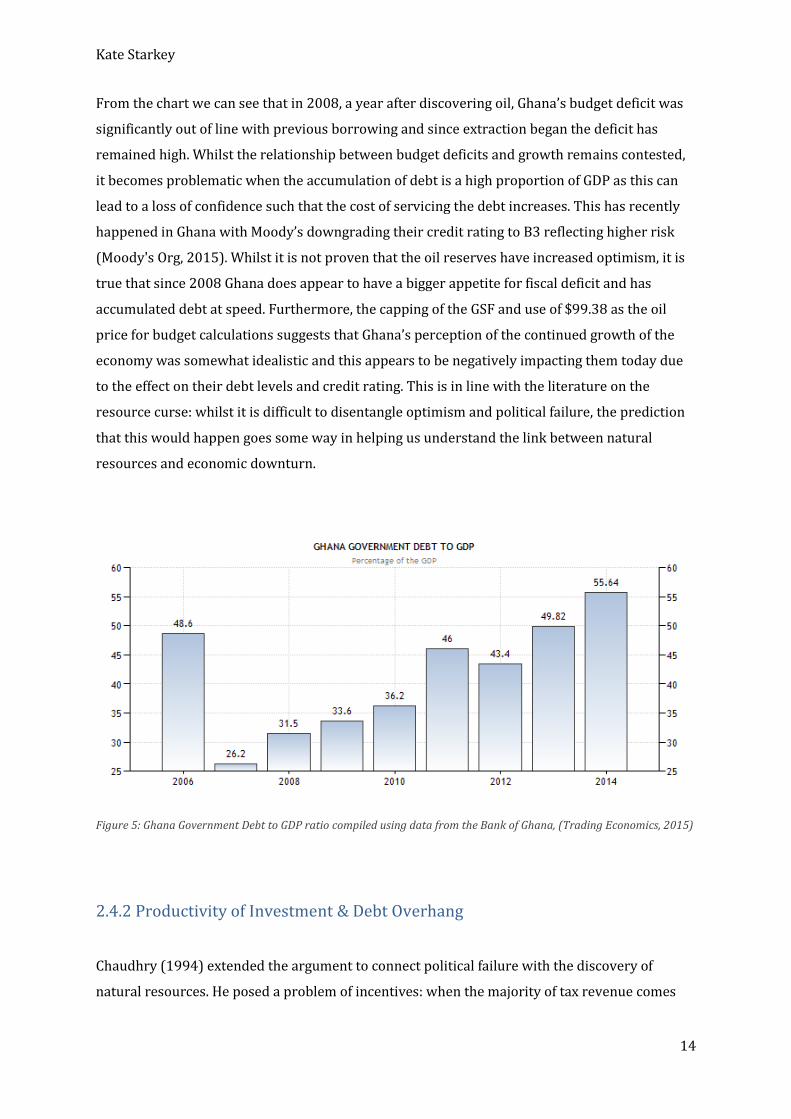
From the chart we can see that in 2008, a year after discovering oil, Ghana’s budget deficit was
significantly out of line with previous borrowing and since extraction began the deficit has
remained high. Whilst the relationship between budget deficits and growth remains contested,
it becomes problematic when the accumulation of debt is a high proportion of GDP as this can
lead to a loss of confidence such that the cost of servicing the debt increases. This has recently
happened in Ghana with Moody’s downgrading their credit rating to B3 reflecting higher risk
(Moody's Org, 2015). Whilst it is not proven that the oil reserves have increased optimism, it is
true that since 2008 Ghana does appear to have a bigger appetite for fiscal deficit and has
accumulated debt at speed. Furthermore, the capping of the GSF and use of $99.38 as the oil
price for budget calculations suggests that Ghana’s perception of the continued growth of the
economy was somewhat idealistic and this appears to be negatively impacting them today due
to the effect on their debt levels and credit rating. This is in line with the literature on the
resource curse: whilst it is difficult to disentangle optimism and political failure, the prediction
that this would happen goes some way in helping us understand the link between natural
resources and economic downturn.
Figure 5: Ghana Government Debt to GDP ratio compiled using data from the Bank of Ghana, (Trading Economics, 2015)
2.4.2 Productivity of Investment & Debt Overhang
Chaudhry (1994) extended the argument to connect political failure with the discovery of
natural resources. He posed a problem of incentives: when the majority of tax revenue comes

Kate Starkey
15
from natural resources rather than productive activity, there is less incentive to promote policy
which is good for future business. Ghanaian tax revenues and total spending data are not
publically available but a report from the African Economic Outlook suggests that oil accounted
for 5% of government revenue in 2012. Based on what we know about extraction which is still
below its 120,000 barrel a day threshold and oil prices which have roughly halved, one can
estimate that this figure is less still for 2015. Given this, it seems unlikely that the incentive to
neglect productive investment is strong, although there is some suggestion that this is the case.
One such suggestion was that oil revenue was used wastefully to pay higher civil servant
salaries (Financial Times, 2014). If this were true, Chaudhry, 1994 suggests that Ghana will
become trapped in a debt problem in the future as the increase in wages will not be matched by
an increase in productivity and hence the money borrowed to fund this increased spending will
accrue a higher level of interest than Ghana will be able to repay. This is known as debt
overhang. Whilst it is certainly true that Ghana’s public sector wage bill is high, linking this to oil
reserves is more difficult.
Table 2: Comparing Ghana’s Wage bill with SSA economies (Bank of Ghana, 2007)
Statistics from the IMF show that Ghana’s wage bill has been growing since the early 2000s and
has always been higher than other West African economies proportional to GDP. This suggests
that structural reasons such as unionisation are partly driving higher wage costs. However,
since the single spine salary system (SSSS) was introduced in 2010, pay of public workers as a
percentage of GDP increased dramatically leading to misconceptions. Whilst we are of the view
that such high wage bills are a source of imbalance and are detrimental to Ghana’s economy the
Kate Starkey
16
SSSS, whilst increasing the wage bill in the 2011-12 period, is not a sign that Ghana has
neglected productive investment but is instead doing its best to reform public sector pay. In the
short term sizeable deferred wage payments retroactive to January 2010 appear to show
uncontrolled public spending, but in the medium term the measure should be beneficial to the
economy due to the increased transparency - as yet it is too early to weigh up its full effect
(International Monetary Fund, 2012). Therefore, whilst we judge that public sector wages are a
serious problem and a cause of the deficit in Ghana, the 2011-12 increase was not a symptom of
perverse incentives brought about by the resource curse, but instead an attempt to correct the
macroeconomic imbalance in the long term, although the costs of this plan were poorly
estimated.
Although we have rejected the claim that perverse incentives are at play, projected increases in
income appear to have made spending decisions more careless. A paper from the World Bank
provides evidence of this: The Ghana Shared Growth and Development Agenda (GSGDA I) was a
2010 government initiative to allocate development spending, however it was ‘relatively
unconstrained in its costing… and resourcing through the budget was rarely consistent, creating
‘discrepancies between planning and budgeting’ (Ceesay, 2015). This shows that the systems in
place in Ghana were flawed and ensuring productive use of funds was not prioritised. We are
not contesting that Ghana is neglecting policy which is good for future business, but the
evidence of the way in which budgeting and costing were undertaken does seem to suggest that
the budget was not seen as a strictly binding constraint, again giving weight to the argument
that resources may have created a misplaced sense of optimism in government. Given the size of
the mounting national debt, this is not something which can continue and productivity of
investment needs to return to the heart of government spending decisions in the future to
prevent national debt accumulating beyond sustainable levels.
2.4.3 Corruption
According to Leite & Weidmann (1999), finding natural resources increases corruption and this
is one of the reasons for the resource curse. They suggest that finding natural resources
increases the incentive to be corrupt as there are more potential rents and hence a higher payoff
for the same risk. It was believed that this would not be problematic in Ghana due to its
democratic nature and low corruption rating. The transparency index rated them the 64th least
corrupt country in 2014, putting them in the 33rd percentile (TransparencyOrg, 2014). To assess

Kate Starkey
17
whether corruption exists in Ghana’s oil industry, we will look at the individual policies in place
and determine their effectiveness.
Ghana’s Revenue Management Act
As discussed, this act splits oil revenues into the budget (70%) and then into funds for heritage
and stablisation (30%). This aimed to increase transparency as the government are accountable
for showing where the revenue has gone meaning that it cannot be leaked to politicians.
However the funds can be capped and at present there are no guidelines for where these caps
should be set. This enabled government to spend more than 70% of oil revenue and hence
undermined the fund’s objective. In order to maintain trust there should be clear guidelines on
when the use of caps is appropriate to make sure that revenue is ringfenced as promised.
Furthermore the Act contains a contingency fund which can be used when revenues are higher
than predicted but at present there are no rules on spending this fund. This again gives
government too much discretion and should be regulated. As well as this, there is no report on if
or how the heritage and stabilisation funds are being used and so again whilst in principle the
Revenue Management Act should ensure productive spending and resources for the future it is
undermined by a lack of detail.
Public Interest and Accountability Committee
Another provision of the Revenue Management Act was the establishment of the Public Interest
and Accountability Committee (Natural Resource Governance Institute, 2011). This is a
multistakeholder committee which produces ‘an independent assessment of the management
and use of Petroleum revenues’ (Public Interest and Accountability Committee;, 2013) which is
publically available and hence shows a willingness from government to include the people in
decisions regarding use of oil revenues. However, in 2013 it did not debate spending for the
next three years as the committee did not renew in time (Public Interest and Accountability
Committee;, 2013). This shows that they are underfunded and so cannot fulfil all objectives,
again showing how the principles of policy are challenged at ground level.
Extractive Industries Transparency Initiative (EITI)
Ghana is a signatory to this international committee which ‘promotes open and accountable
management of natural resources. It seeks to strengthen government and company
systems, inform public debate, and enhance trust’ (EITI, n.d.). As a member, Ghana must publish
a report containing full disclosure of taxes and other payments made by oil, gas and mining
companies to governments. This prevents corruption by government and empowers Ghanaian
citizens. However, to begin with Ghana was only a signatory for the mining setor and did not
submit to EITI audits for oil and gas until 2013 (GHEITI, 2013). Even then, the report cites
difficulties and delays in data collection but on the whole payments by corporations do match
Kate Starkey
18
government reciepts (GHEITI, 2014). This shows how although it was lacking at first,
transparency in the oil and gas sector is improving.
From this analysis we can conclude that Ghana has some good policies in place to ensure
transparency, but ensuring that the legislation is adhered to will be paramount for the
reputation of Ghana in the future. Monitoring does dampen corruption and so as the payoffs for
corrupt officials increase with oil revenue the need for transparency becomes evermore
essential to prevent misappropriation of funds. The freedom of press in Ghana is instrumental
in ensuring that citizens get this transparency and we have seen improvements such as EITI
reporting under the current administration. This said, there is still much to be done. On time,
accurate and well funded reports are necessary to maintain confidence in Ghana’s poltical
system and there is a need for investment in this area.
3. Policy Implications
In light of the current depreciation of the cedi due to events unrelated to the discovery of
natural resources, Ghana does appear to have circumvented the Dutch disease effect and in fact
any appreciation of the currency created by oil revenues would actually be beneficial to Ghana
at this time. Because of this, Ghana cannot shed any light on the link between resources and
Dutch disease but it does show that finding oil is not necessarily detrimental because of its
effect on the exchange rate and it depends on the state of the individual economy at the time oil
is exported. Furthermore, spending projects such as the five year industrial development plan
seem to have prevented the expected decline of industry. The extent to which this is due to the
plan and not due to the exchange rate is difficult to judge due to the limited timeframe since
implementation, but it seems likely that the policy will have gone some way in avoiding Dutch
disease and should be promoted in other developing economies which discover a natural
resource.
Terms of trade in oil and other commodities have been volatile of late, reflecting how reliance
on commodity revenues can expose an economy to vulnerability. Initially we judged that the
way Ghana had split their oil revenue into the ABFA, GHF and GSF was sensible in helping to
avoid the resource curse: the revenue towards the budget could help with current investment,
the heritage fund ensures benefits to future generations and the stabilisation fund should help
to insure against price volatility. Theoretically, such a policy ticks all the boxes for resource
curse mitigation as all of the economic transmissions suggested in the literature
(underinvestment, volatility and Dutch disease) should be limited by diversifying investment
Kate Starkey
19
and saving to insulate future price collapses. This type of policy should therefore be promoted
in economies who discover oil.
However, whilst in theory all of the policies directly to control the use of resources are in line
with sound economic judgement, more general government policy has been questionable. The
sizeable increase in the debt levels since the discovery of oil cannot be ignored and suggests that
something has gone wrong. Our analysis does not suggest that this is due to corruption in the
truest sense, but more likely due to misguided political optimism created by the discovery of
natural resources. There is evidence that spending decisions are not strictly based on cost
benefit analysis and that the budget is not seen as binding, embedding a culture of frivolity and
borrowing which could undermine Ghana’s success as ratings agencies and investors lose
confidence in their capabilities. Furthermore, borrowing based on projected oil revenue
increases risk and because of this debt will accumulate faster. The case of Ghana has therefore
added merit to the theory of Mitra that tendency to optimism can lead to economic
mismanagement even in economies which have historically been well managed and have good
institutions in place. As a result, there needs to be a greater awareness of the detrimental effects
of borrowing using natural resources as collateral and expectations of the benefits that finding a
natural resource such as oil can bring should be rationalised from the start. Whilst it is still
possible for Ghana to use oil revenues to develop sustainably, this will not happen if the
economy is undermined by debt problems and investors lose confidence: this is currently the
biggest threat to Ghana.
Furthermore, Ghana has highlighted that institutions are only as good as the behaviour which
they enforce. Although the Revenue Management Act ticks all the boxes of good policy, it is
undermined by clauses which give government too much discretion such as the setting of caps
and the freedom to predict oil prices. In the future, acts such as this should urge caution when
predicting oil prices and provide a greater safety net against revenue volatility by showing less
appetite for risk. In addition, whilst the Public Interest and Accountability Committee is also
theoretically beneficial these benefits will only be realised if it is correctly funded and
prioritised. Such a committee is vital to limit any scope for corruption and hence should be
recognised as integral to resource management rather than an aside as in the Ghanaian case.
Conclusion
The resource curse is said to exist when finding oil has a negative impact on the rate of
economic growth, ceteris paribus. Whilst we concluded from the literature that Dutch disease
Kate Starkey
20
looked to be one of the main reasons for this, other events in Ghana causing a depreciation of
the cedi have meant that this has not materialised and their weakened currency and oil
revenues are not connected so in this way the resource curse has not taken hold. Yet other
macroeconomic indicators have declined too and if this can be linked with finding oil then it is
strong evidence that Dutch disease is not the sole cause of a resource curse which is an
interesting result as Dutch disease has previously received much attention. The recent period
has seen terms of trade volatility negatively impact commodity prices as suggested and we
would agree that in Ghana this has led to some of the economic instability but we do not accept
that the resource curse is a purely economic phenomenon. Volatility becomes problematic when
it is underestimated by government. Our analysis of Ghana suggests that projections were too
optimistic and this led them to borrow too much at unpredictable rates of interest. Combined
with currency depreciation this caused investor confidence to decline. To generate the
investment citizens expected, Ghana needs to remain a safe, well balanced economy for
investors - since finding oil it seems that this has not been apparent. Due to timing, this
carelessness does seem to be linked to the exportation of oil and so the overriding conclusion of
this paper is that a link between inappropriate government spending and a windfall of a natural
resource appears to exist even without corruption. Therefore, we suggest that future analysis of
the resource curse should further investigate this link and future developing countries who
discover oil should be advised to learn from Ghana’s mistakes and take a more cautious
approach to predicting and spending oil revenue.
This said, our analysis is not without caveats. A main limitation of using Ghana as a case study is
that in many ways it is too early to fully appreciate the impact of policy measures or the effect
that oil will have on long term growth. Therefore to definitively conclude whether ‘Ghana has
avoided the “Resource Curse”’ is not possible, although we would judge at this stage that if it
continues to improve transparency and promote industry the way that it has begun to do then it
should find itself on a path toward sustainable development, although this is in no way
cemented and depends on their ability to maintain investor confidence. Whilst this makes it
more difficult to draw policy implications from, it also makes the continual monitoring of Ghana
a priority as there is still the possibility that the country could go either way. From what we
have discovered thus far, there may be cause for further research in to the relationship between
oil discovery and debt ratio to empirically test whether the link that we have found in Ghana
between oil and optimism is a channel by which the resource curse propagates through the
economy, as if debt to GDP ratio increased on average this could provide further evidence for
the tendency to optimism of spending decisions which we have found to be the case in Ghana.
This would give greater weight to the policy recommendations we have made as it would
Kate Starkey
21
suggest that this pitfall is not merely one which has occurred In Ghana but one which is likely to
occur and hence receive more attention from governments wishing to avert the resource curse
and develop sustainably.

Kate Starkey
22
Bibliography
Amoako-Tuffour, J., 2011. Public Participation in the Making of Ghana’s Petroleum Revenue Managment Law, Canada: Natural Resource Charter Technical Advisory Group.
Arezki, R., Hadri, K., Loungani, P. & Rao, Y., 2013. Testing the Prebisch-Singer Hypothesis since
1650: Evidence from Panel Techniques that Allow for Multiple Breaks, WP/30/180: IMF.
Auty, R., 2001. Why resource endowments can undermine economic development: concepts and
case studies, Oxford: Paper Prepared for the BP-Amoco Seminar, Lincoln College.
Auty, R., 2004. Natural Resources and Civil Strife: A Two-Stage Process. [Online]
Available at:
http://graduateinstitute.ch/files/live/sites/iheid/files/sites/political_science/shared/political_
science/9957/Auty%202004.pdf
[Accessed 8 Dec 2014].
Ayensu, F., 2013. MANAGING GHANA’S OIL REVENUE: GHANA PETROLEUM FUNDS. Asian
Journal of Humanities and Social Sciences , 1(2), pp. 148-161.
Bank of Ghana, 2007. ISSUES ON WAGES AND LABOUR MARKET COMPETITIVENESS IN GHANA,
Accra: Bank of Ghana.
BBC, 2007. UK's Tullow uncovers oil in Ghana. [Online]
Available at: http://news.bbc.co.uk/1/hi/business/6764549.stm
[Accessed 09 04 2015].
Blas, J., 2014. Ghana seeks IMF help after currency falls 40%. [Online]
Available at: http://www.ft.com/cms/s/0/195ce3ec-1a5f-11e4-8131-
00144feabdc0.html#axzz3VCojXvFo
[Accessed 20 03 2015].
Bleaney, M. & Halland, H., 2009. The Resource Curse and Fiscal Policy Volatility, Nottingham:
Credit Research Paper.
Brunnschweiler, C. N. & Bulte, E. H., 2006. “The Resource Curse Revisited and Revised: A Tale of
Paradoxes and Red Herrings, Zurich: Center of Economic Research .
Ceesay, I. B., 2015. PROJECT INFORMATION DOCUMENT PIDA23351, Accra: World Bank.
Chaudhry, K. A., 1994. Economic Liberalisation nd the Lineages of the Rentier State. Comparative
Politics, 27(1), pp. 1-25.
Corden, M. & Neary, P., 1982. Booming sector and de-iindustrialisation in a smal open economy.
Economic Journal, 92(1), pp. 825-48.
Deloitte, 2015. Oil Prices in Crisis. [Online]
Available at: http://bit.ly/1DngJC2
[Accessed 09 04 2015].
Kate Starkey
23
Doppelhofer, G., Miller, R. & Sala-i-Martin, X., 2000. Determinnts of long tem growth: growth: A
Bayesian averaging of classical estimates (BACE) approach, s.l.: NBER 7750.
EITI, n.d. What is the EITI?. [Online]
Available at: https://eiti.org/eiti
[Accessed 02 04 2015].
Financial Times, 2014. Ghana tarnishes ‘Africa rising’ story. Financial Times, 5 August.
Frankel, J., 2010. The Natural Resource: A Survey, Cambridge: NBER.
GHEITI, M. O. F., 2013. 2013 FINAL ANNUAL REPORT, s.l.: EITI.
GHEITI, M. o. F., 2014. FINAL REPORT ON THE PRODUCTION OF OIL & GAS SECTOR GHEITI
REPORT FOR 2012 AND 2013, s.l.: GHEITI.
Gylfason, T., Tryggvi , H. T. & Zoega, G., 1993. A Mixed Blessing. Macro Dynamics, 3(1), pp. 204-
255.
Heilbrunn, J. R., 2014. Oil, Democracy, and Development in Africa. 1st ed. Cambridge: Cambridge
University Press.
Hong, A., 2009. EXAMINING SACHS AND WARNER’S MODEL OF NATURAL RESOURCE CURSE:
IMPLICATIONS AND LESSONS FOR NATURAL RESOURCE-RICH COUNTRIES, Washington DC:
Georgetown Public Policy Institute.
International Monetary Fund, 2012. Ghana: Fifth Review Under the Three-Year Arrangement
Under the Extended Credit Facility and Request for Modification of Performance Criteria, s.l.: IMF.
Jeffrey D. Sachs, A. M. W., n.d. Natural Resource Abundance and Economic Growth.
Kenny, C. & Sumner, A., 2011. How 28 poor countries escaped the poverty trap. [Online]
Available at: http://www.theguardian.com/global-development/poverty-
matters/2011/jul/12/world-bank-reclassifies-28-poor-countries
[Accessed 20 03 2015].
Kosmos Energy, 2012. Jubilee Field. [Online]
Available at: http://www.kosmosenergy.com/operations-ghana-jubilee-field.php
[Accessed 20 03 2015].
Kpodo, K., 2015. Ghana to review budget estimates due to lower oil prices. [Online]
Available at: http://www.reuters.com/article/2015/01/16/ghana-economy-
idUSL6N0UV1W820150116
[Accessed 25 03 2015].
Leite, C. & Weidmann, J., 1999. Does Mother Nature Corrupt? Natural Resources,Corruption, and,
Economic Growth, Washington DC: IMF WP 99/85.
Levin, J., 1960. The Exports Economies: Their Pattern of Development in Historical Perspective,
Cambridge: Harvard University Press.
Lucas, R. E., 2002. Lectures on Economic Growth. 1st ed. s.l.:Harvard University Press.
Kate Starkey
24
Manzano, O. & Rigbon, R., 2001. Resource Curse or Debt Overhang? Working Paper No. 8390,
Cambridge, MA: National Bureau of Economic Research.
Matsen, E. & Ragnar, T., 2005. Optimal Dutch Disease. Journal of Development Economics, 78(2),
pp. 494-515.
Mihalyi, D., 2014. Forecasting Ghana's Oil Revenues for the 2015 Budget Using a Fiscal Model of
the Jubilee Field, s.l.: Natural Resource Governance Institute.
Mitra, P., 1994. Adjustment in Oil-Importing Developing Countries: A Comparative Economic
Analysis, Cambridge: Cambridge University Press.
Moody's Org, 2015. Moody's. [Online]
Available at: https://www.moodys.com/credit-ratings/Ghana-Government-of-credit-rating-
806356876
[Accessed 30 03 2015].
Murphy, K. M., Schleifer, A. & Vishny, R. W., 1989. Industrialisation and the Big Push. The Journal
of Political Economy, 97(5), pp. 1003-1026.
Natural Resource Governance Institute, 2011. Ghanaian Parliament Passes Revenue Management
Bill. [Online]
Available at: Public Interest and Accountability Committee
[Accessed 02 04 2015].
Neumayer, E., 2004. Does the ‘‘Resource Curse’’ hold for Growth in Genuine Income as Well?.
World Development, 32(12), pp. 1627-1640.
Nurkse, R., 1958. Trade Fluctuations and Buffer Policies of Low-Income Countries. Kyklos, 11(2),
pp. 141-54.
OilGas, 2015. ACEP to sue Government over petroleum revenue reports. [Online]
Available at: http://www.reportingoilandgas.org/acep-to-sue-government-over-petroleum-
revenue-reports/
[Accessed 02 04 2015].
Osei, F. M. & Nti, O. A., 2014. Why is Ghana's currency collapsing?. [Online]
Available at: http://www.theafricareport.com/West-Africa/why-is-ghanas-currency-
collapsing.html
[Accessed 20 03 2015].
Oxford Business Group, 2011. The Report: Ghana 2011. 1st ed. Oxford: Oxford Business Group.
Papyrakis, E. & Gerlagh, R., 2004. The resource curse hypothesis and its transmission channels.
Journal of Comparative Economics, 32(1), pp. 181-193.
Public Interest and Accountability Committee;, 2013. Report on Management of Annual
Petroleum Revenues for 2013, Accra: Republic of Ghana.
Rosser, A., 2006. The Political Economy of the Resource Curse: A Literature Survey, Brighton:
Institute of Development Studies.
Kate Starkey
25
Sachs, J. D. & Warner, A. M., 1995, revised 1997,1999. Natural Resource Abundance and
Economic Growth. National Bureau of Economic Research, Cambridge(MA), p. Working paper
No. 5398.
Sachs, J. D. & Warner, A. M., 2001. The curse of natural resources. European Economic Review,
45(4-6), pp. 827-838.
Schwab, K., 2014. The Global Competitiveness Report 2014-2015, Geneva: World Economic
Forum.
SWFI, 2014. Ghana Petroleum Funds. [Online]
Available at: http://www.swfinstitute.org/swfs/ghana-petroleum-funds/
[Accessed 25 03 2015].
Torvik, R., 2009. Why do some resource abundant countries succeed while others do not?, s.l.:
Norwegian University of Science and Technology.
Trading Economics, 2015. Ghana Government Budget. [Online]
Available at: http://www.tradingeconomics.com/ghana/government-budget
[Accessed 09 04 2015].
Trading Economics, 2015. Trading Economics. [Online]
Available at: http://www.tradingeconomics.com/ghana/gdp-growth-annual
[Accessed 20 03 2015].
TransparencyOrg, 2014. CORRUPTION PERCEPTIONS INDEX 2014: RESULTS. [Online]
Available at: http://www.transparency.org/cpi2014/results
[Accessed 01 04 2015].
Turnovsky, S. J. & Chattopadhyay, P., 2003. Volatility and growth in developing economies: some
numerical results and empirical evidence. Journal of International Economics, 9(2), p. 267–295.
Wijnbergen, S. v., 1984. The Dutch Disease: A Disease After All?. The Economic Journal, 94(373),
pp. 41-55.
World Bank, 2015. GDP growth (annual %). [Online]
Available at:
http://data.worldbank.org/indicator/NY.GDP.MKTP.KD.ZG?order=wbapi_data_value_2013+wb
api_data_value+wbapi_data_value-last&sort=asc
[Accessed 08 04 2015].