Hans Walter Steinhauer and Sabine Zinn NEPS TECHNICAL ... Papers/SP_II.pdf · Survey Papers of the...
25
Hans Walter Steinhauer and Sabine Zinn NEPS TECHNICAL REPORT FOR WEIGHTING: WEIGHTING THE SAMPLE OF STARTING COHORT 4 OF THE NATIONAL EDUCATIONAL PANEL STUDY (WAVE 1 TO 6) NEPS Survey Paper No. 2 Bamberg, May 2016 NEPS SURVEY PAPERS
Transcript of Hans Walter Steinhauer and Sabine Zinn NEPS TECHNICAL ... Papers/SP_II.pdf · Survey Papers of the...
Hans Walter Steinhauer and Sabine Zinn
NEPS TECHNICAL REPORT FOR WEIGHTING: WEIGHTING THE SAMPLE OF STARTING COHORT 4 OF THE NATIONAL EDUCATIONAL PANEL STUDY (WAVE 1 TO 6)
NEPS Survey Paper No. 2Bamberg, May 2016
NEPS SURVEY PAPERS

Survey Papers of the German National Educational Panel Study (NEPS) at the Leibniz Institute for Educational Trajectories (LIfBi) at the University of Bamberg The NEPS Survey Paper Series provides articles with a focus on methodological aspects and data handling issues related to the German National Educational Panel Study (NEPS). The NEPS Survey Papers are edited by a review board consisting of the scientific management of LIfBi and NEPS. They are of particular relevance for the analysis of NEPS data as they describe data editing and data collection procedures as well as instruments or tests used in the NEPS survey. Papers that appear in this series fall into the category of 'grey literature' and may also appear elsewhere. The NEPS Survey Papers are available at https://www.neps-data.de (see section “Publications“). Editor-in-Chief: Corinna Kleinert, LIfBi/University of Bamberg/IAB Nuremberg Contact: German National Educational Panel Study (NEPS) – Leibniz Institute for Educational Trajectories – Wilhelmsplatz 3 – 96047 Bamberg − Germany − [email protected]
NEPS Technical Report for Weigh ng: Weigh ng the Sampleof Star ng Cohort 4 of the Na onal Educa onal Panel Study
(Wave 1 to 6)
Hans Walter Steinhauer, Leibniz Ins tute for Educa onal TrajectoriesSabine Zinn, Leibniz Ins tute for Educa onal Trajectories
Technical Report referring to DOI:10.5157/NEPS:SC4:6.0.0
E-mail address of lead author:
methoden@li i.de
Bibliographic data:
Steinhauer, H. W. & Zinn, S. (2016). NEPS Technical Report for Weigh ng: Weigh ng thesample of Star ng Cohort 4 of the Na onal Educa onal Panel Study (Wave 1 to 6) (NEPSSurvey Paper No. 2). Bamberg: Leibniz Ins tute for Educa onal Trajectories, Na onalEduca onal Panel Study.
NEPS Survey Paper No. 2, 2016
Steinhauer & Zinn
NEPS Technical Report for Weigh ng: Weigh ng the Sample of Star ng Cohort 4 of the Na-onal Educa onal Panel Study (Wave 1 to 6)
AbstractThe sample of Grade 9 students in the Na onal Educa onal Panel Study (NEPS) focuses onthe pathways through higher secondary and voca onal educa on tracks. When entering thevoca onal track, students will leave their ins tu onal context in which they were originallysampled and surveyed. Thus, from then onwards they are individually surveyed. Studentspassing into the academic track are very likely to remain in their ins tu onal context, whichmeans that they are surveyed in groups. This report provides details on the sampling design,the deriva on of design weights and the wave-specific nonresponse adjustments to providecross-sec onal as well as longitudinal weights. For the students par cipa ng in the panel studywe find sampling school type informa on, migra on background, na ve language and previouswaves par cipa on to influence their par cipa on propensi es.
Keywordsstra fied two-stage cluster sampling, unit nonresponse, weigh ng adjustments, NEPS SC4
NEPS Survey Paper No. 2, 2016 Page 2
Steinhauer & Zinn
1. Introduc on
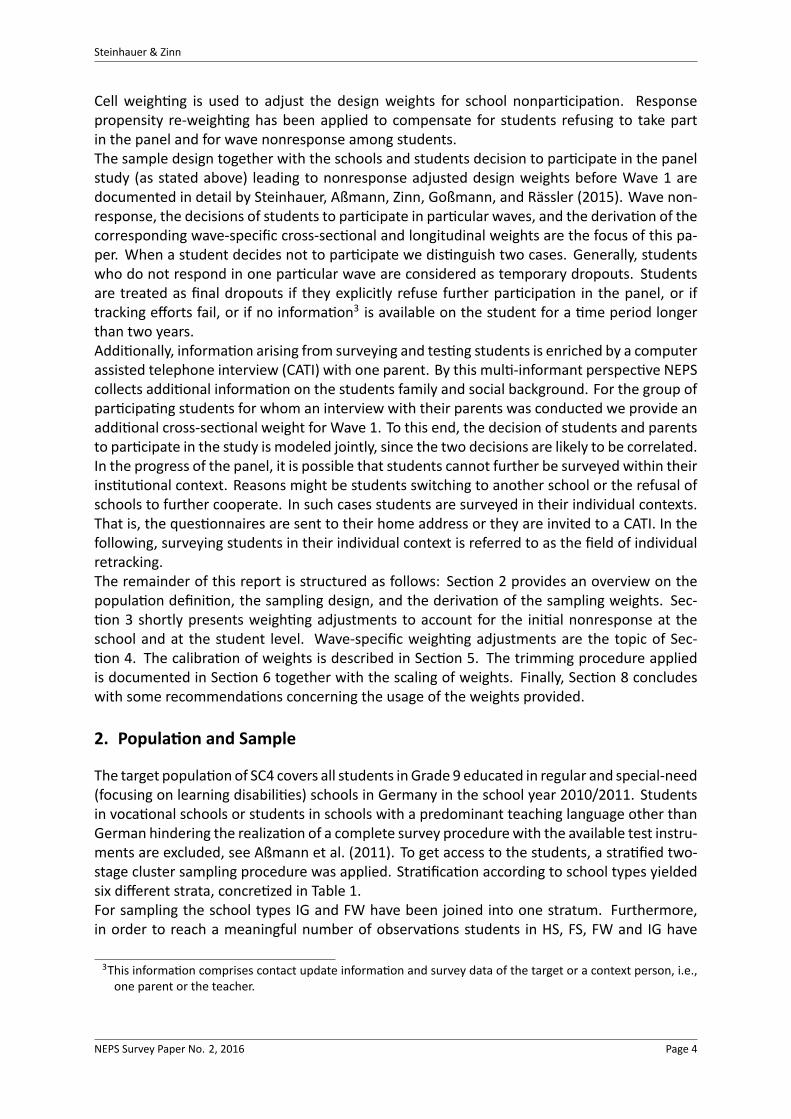
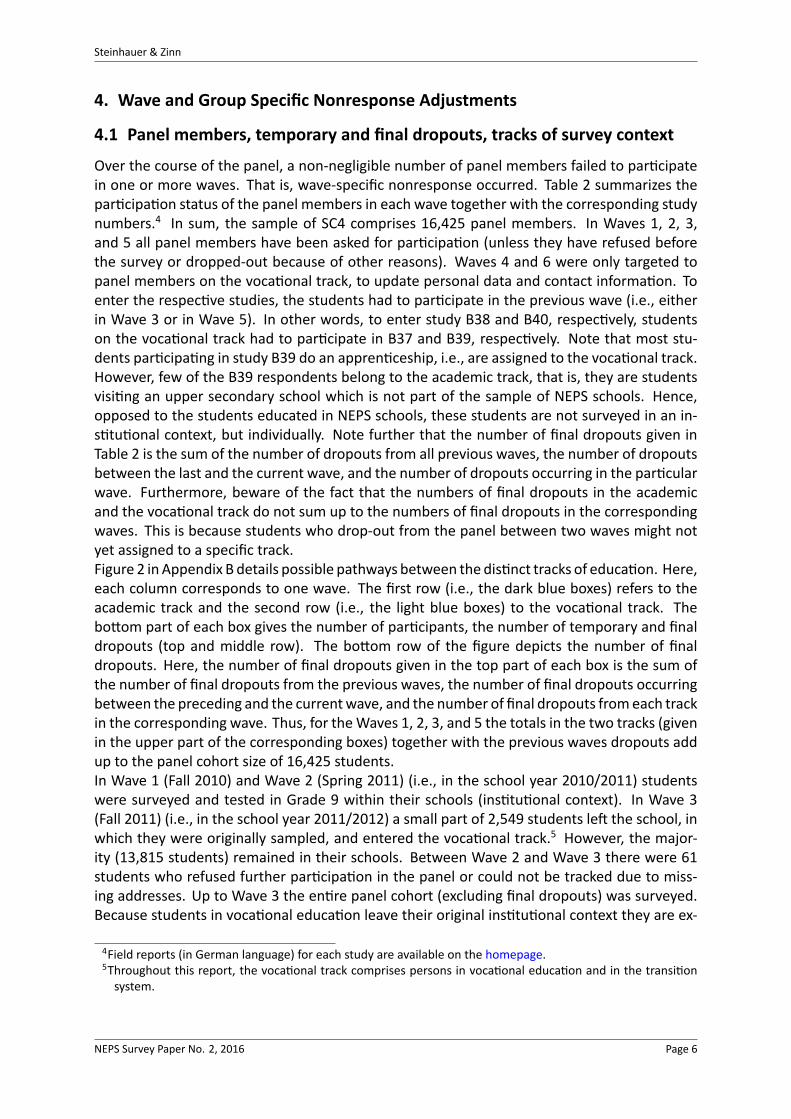
Star ng Cohort 4 (SC4) of the Na onal Educa onal Panel Study (NEPS) focuses on studentsin Grade 9 and their pathway through higher secondary educa on and voca onal educa ontraining.1 For this purpose, a stra fied sample of Grade 9 students in different types of regularschools and special-need schools was set up.2A two-stage sampling approach has been used to gain access to the target popula on. Thesample of students par cipa ng in the panel study (i.e., the panel members) are followed upover me. In Germany, students usually decide a er Grade 10 to enter either the academictrack or the voca onal track, see Figure 1. Students entering the academic track mostly remainwithin their ins tu onal context, while students entering the voca onal track leave for a voca-onal school or training. The majority of students enters the voca onal track a er Grade 10.
However, also other pathways are possible, that is, students enter the voca onal track earlieror later in their educa onal career. Figure 1 illustrates this transi on pa ern.
..Grade 9. Grade 10. Grade 11. Grade 12. Grade 13.
Voca onalEduca onFirst year
.
Voca onalEduca onSecondyear
.
Voca onalEduca onThird year
Figure 1: Ideal pathways through upper secondary and voca onal educa on.
The sampling units of stra fied mul stage designs are very likely subject to unequal selec onprobabili es. Disregarding this aspect in sta s cal analysis may lead to biased popula on es-mates and misleading research conclusions. A common way to compensate for unequal se-
lec on probabili es is the usage of weights; see for example Särndal, Swensson, andWretman(2003) or Pfeffermann and Rao (2009). The par cipa on in the SC4 survey is voluntary, whichmeans that at each of the two stages of sampling schools as well as students might refuse ornot respond. To this end, usually nonresponse adjustments of design weights are used. Whencompu ng weights for the panel members of SC4, the different processes leading to the par c-ipa on decision in a par cular wave have to be considered. These decision processes include
1. the schools ini al decision to par cipate in the survey,
2. the students ini al decision to par cipate in the panel,
3. and lastly the students successive decisions to par cipate in each panel wave.1This report refers to Scien fic Use File (SUF; DOI:10.5157/NEPS:SC4:6.0.0). For more specific informa on onresearch topics in the NEPS, see Blossfeld, Roßbach, and von Maurice (2011).
2Regular schools are all ``allgemeinbildende Schulen´´, that is, schools of general educa on according to thedefini on of the Kultusministerkonferenz (2012).
NEPS Survey Paper No. 2, 2016 Page 3
Steinhauer & Zinn
Cell weigh ng is used to adjust the design weights for school nonpar cipa on. Responsepropensity re-weigh ng has been applied to compensate for students refusing to take partin the panel and for wave nonresponse among students.The sample design together with the schools and students decision to par cipate in the panelstudy (as stated above) leading to nonresponse adjusted design weights before Wave 1 aredocumented in detail by Steinhauer, Aßmann, Zinn, Goßmann, and Rässler (2015). Wave non-response, the decisions of students to par cipate in par cular waves, and the deriva on of thecorresponding wave-specific cross-sec onal and longitudinal weights are the focus of this pa-per. When a student decides not to par cipate we dis nguish two cases. Generally, studentswho do not respond in one par cular wave are considered as temporary dropouts. Studentsare treated as final dropouts if they explicitly refuse further par cipa on in the panel, or iftracking efforts fail, or if no informa on3 is available on the student for a me period longerthan two years.Addi onally, informa on arising from surveying and tes ng students is enriched by a computerassisted telephone interview (CATI) with one parent. By this mul -informant perspec ve NEPScollects addi onal informa on on the students family and social background. For the group ofpar cipa ng students for whom an interview with their parents was conducted we provide anaddi onal cross-sec onal weight for Wave 1. To this end, the decision of students and parentsto par cipate in the study is modeled jointly, since the two decisions are likely to be correlated.In the progress of the panel, it is possible that students cannot further be surveyed within theirins tu onal context. Reasons might be students switching to another school or the refusal ofschools to further cooperate. In such cases students are surveyed in their individual contexts.That is, the ques onnaires are sent to their home address or they are invited to a CATI. In thefollowing, surveying students in their individual context is referred to as the field of individualretracking.The remainder of this report is structured as follows: Sec on 2 provides an overview on thepopula on defini on, the sampling design, and the deriva on of the sampling weights. Sec-on 3 shortly presents weigh ng adjustments to account for the ini al nonresponse at the
school and at the student level. Wave-specific weigh ng adjustments are the topic of Sec-on 4. The calibra on of weights is described in Sec on 5. The trimming procedure applied
is documented in Sec on 6 together with the scaling of weights. Finally, Sec on 8 concludeswith some recommenda ons concerning the usage of the weights provided.
2. Popula on and Sample
The target popula on of SC4 covers all students in Grade 9 educated in regular and special-need(focusing on learning disabili es) schools in Germany in the school year 2010/2011. Studentsin voca onal schools or students in schools with a predominant teaching language other thanGerman hindering the realiza on of a complete survey procedurewith the available test instru-ments are excluded, see Aßmann et al. (2011). To get access to the students, a stra fied two-stage cluster sampling procedure was applied. Stra fica on according to school types yieldedsix different strata, concre zed in Table 1.For sampling the school types IG and FW have been joined into one stratum. Furthermore,in order to reach a meaningful number of observa ons students in HS, FS, FW and IG have
3This informa on comprises contact update informa on and survey data of the target or a context person, i.e.,one parent or the teacher.
NEPS Survey Paper No. 2, 2016 Page 4
Steinhauer & Zinn
Table 1: Strata and abbrevia ons for school types
Stratum Abbrevia on School type
1 GY schools leading to upper secondary educa on and universityentrance qualifica on (Gymnasium)
2 HS schools for basic secondary educa on (Hauptschule)3 RS intermediate secondary schools (Realschule)4 IG comprehensive schools (Integrierte Gesamtschule)4 FW Rudolf Steiner schools (Freie Waldorfschule)5 MB schools with several courses of educa on (Schule mit
mehreren Bildungsgängen)6 FS schools offering schooling to students with special educa-
onal needs in the area of learning (Förderschule)
been oversampled. To enhance precision, the popula on of schools was addi onally implicitlystra fied according to the following three criteria: Federal State, regional classifica on, andfunding. Therea er, sampling was conducted at two stages. At the first stage, a sample ofall officially recognized and state approved schools providing schooling to students in Grade 9has been drawn systema cally with probability propor onal to size. Therea er, at the secondstage, two classes within the sampled schools were selected randomly (if at least three classeswere present), otherwise all classeswere taken. In the classes, all studentswere askedwhetherthey are willing to par cipate in the survey. See Steinhauer et al. (2015) for more details onthe sampling design.The sampling design determines the inclusion probability of each sampled unit, that is, of eachsampled school, class, and student. In the considered case, the inclusion probabili es differat the different stages of the sample. Hence, the SC4 sample is not a self-weighted sample.In other words, design informa on and weights, respec vely, have to be accounted for in sta-s cal inference. The design weights of the sampled units (i.e., of the schools, classes, and
students) are defined as the inverse of their inclusion probabili es. By design, these probabil-i es depend on the number of schools, classes, and students available in the correspondingstrata. The concrete deriva on of the design weights is given in very detail in Steinhauer et al.(2015).
3. Ini al Nonresponse Adjustments
To account for nonresponse in the ini al sample, the design weights of the sampling unitsare adjusted. To this end, the two stages of sampling have to be considered. Nonresponseamong schools was compensated for by cell weigh ng adjustments. For this purpose, cellswere formed using the sampling strata, Federal States, and funding. A response propensityre-weigh ng approach was used to adjust for students not par cipa ng in the panel. This ap-proach means to model response behavior in dependence of individual, contextual, and ins -tu onal factors. Concretely, for the ini al nonresponse adjustments on the students level, lastmaths grade, gender, age group, and the size of the test group had been considered. See Stein-hauer et al. (2015) for more details on this.
NEPS Survey Paper No. 2, 2016 Page 5
Steinhauer & Zinn
4. Wave and Group Specific Nonresponse Adjustments
4.1 Panel members, temporary and final dropouts, tracks of survey context
Over the course of the panel, a non-negligible number of panel members failed to par cipatein one or more waves. That is, wave-specific nonresponse occurred. Table 2 summarizes thepar cipa on status of the panel members in each wave together with the corresponding studynumbers.4 In sum, the sample of SC4 comprises 16,425 panel members. In Waves 1, 2, 3,and 5 all panel members have been asked for par cipa on (unless they have refused beforethe survey or dropped-out because of other reasons). Waves 4 and 6 were only targeted topanel members on the voca onal track, to update personal data and contact informa on. Toenter the respec ve studies, the students had to par cipate in the previous wave (i.e., eitherin Wave 3 or in Wave 5). In other words, to enter study B38 and B40, respec vely, studentson the voca onal track had to par cipate in B37 and B39, respec vely. Note that most stu-dents par cipa ng in study B39 do an appren ceship, i.e., are assigned to the voca onal track.However, few of the B39 respondents belong to the academic track, that is, they are studentsvisi ng an upper secondary school which is not part of the sample of NEPS schools. Hence,opposed to the students educated in NEPS schools, these students are not surveyed in an in-s tu onal context, but individually. Note further that the number of final dropouts given inTable 2 is the sum of the number of dropouts from all previous waves, the number of dropoutsbetween the last and the current wave, and the number of dropouts occurring in the par cularwave. Furthermore, beware of the fact that the numbers of final dropouts in the academicand the voca onal track do not sum up to the numbers of final dropouts in the correspondingwaves. This is because students who drop-out from the panel between two waves might notyet assigned to a specific track.Figure 2 in Appendix B details possible pathways between the dis nct tracks of educa on. Here,each column corresponds to one wave. The first row (i.e., the dark blue boxes) refers to theacademic track and the second row (i.e., the light blue boxes) to the voca onal track. Thebo om part of each box gives the number of par cipants, the number of temporary and finaldropouts (top and middle row). The bo om row of the figure depicts the number of finaldropouts. Here, the number of final dropouts given in the top part of each box is the sum ofthe number of final dropouts from the previous waves, the number of final dropouts occurringbetween the preceding and the currentwave, and the number of final dropouts fromeach trackin the corresponding wave. Thus, for theWaves 1, 2, 3, and 5 the totals in the two tracks (givenin the upper part of the corresponding boxes) together with the previous waves dropouts addup to the panel cohort size of 16,425 students.In Wave 1 (Fall 2010) and Wave 2 (Spring 2011) (i.e., in the school year 2010/2011) studentswere surveyed and tested in Grade 9 within their schools (ins tu onal context). In Wave 3(Fall 2011) (i.e., in the school year 2011/2012) a small part of 2,549 students le the school, inwhich they were originally sampled, and entered the voca onal track.5 However, the major-ity (13,815 students) remained in their schools. Between Wave 2 and Wave 3 there were 61students who refused further par cipa on in the panel or could not be tracked due to miss-ing addresses. Up to Wave 3 the en re panel cohort (excluding final dropouts) was surveyed.Because students in voca onal educa on leave their original ins tu onal context they are ex-
4Field reports (in German language) for each study are available on the homepage.5Throughout this report, the voca onal track comprises persons in voca onal educa on and in the transi onsystem.
NEPS Survey Paper No. 2, 2016 Page 6

Steinhauer & Zinn
Table 2: Par cipa on status bywave and educa onal track (i.e., academic and voca onal track)
Wave Time Study Total Par cipants DropoutsNr. number Temporary Final
Ini al sample 26,868 16,425 - 10,4431 Fall 2010 A46, A60, A67, A83,
A8616,425 15,629 796 0
2 Spring 2011 A47, A61, A68, A84,A87
16,425 15,214 1,211 0
3 Fall 2011 A48, A62, A69, A85,A88, B37
16,425 13,957 2,296 172
of these: academic track 13,815 11,897 1,896 22of these: voca onal track 2,549 2,060 400 89
4 Spring 2012 B38 1,821 1,351 463 75 Fall 2012 A49, B39 16,425 12,982 2,644 799
of these: academic track 6,305 5,768 522 15of these: voca onal track 9,804 7,214 2,122 468
6 Spring 2013 B40 6,119 5,392 667 60
Notes: In the weights file (part of the SUF), the variable tx80220 indicates the par cipa on status of a panel member. The assignment to the
educa onal track is indicated by the variable track_3 and track_5 for Wave 3 and Wave 5, respec vely.
pected to drop out easier. Thus, these students are addi onally surveyed in two intermediatewaves (i.e., Wave 4 and 6), where they get follow up surveys for the previous CATI. Concretely,in Wave 4 (Spring 2012) only students on the voca onal track were asked to par cipate forwhom sufficient contact informa on was available and who provided a valid CATI in Wave 3.At the same me, students on the academic track were not surveyed in Wave 4. BetweenWave 3 and Wave 5, 7,370 students le the academic track and entered the voca onal track.In fall 2015 (i.e., in Wave 5), the en re cohort was then surveyed again. Here, students on theacademic track were expected to be in Grade 11. In Wave 5, the majority of the panel cohort(in sum, 9,804 students) were on the voca onal tack. The remaining 6,305 students were s llon the academic track.6 The voca onal track inWave 5 contains 9,804 panel members, namelythose switching tracks between Wave 3 and Wave 5 (in sum, 7,370 students) and those whoalready were on the voca onal track in Wave 3 and did not drop out so far or switched back toacademic educa on (in sum, 2,434 students7). InWave 5, 6,305 studentswere on the academictrack. These students are the 6,288 panel members8 from the previousWave 3, who remainedon the academic track, and the 17 students switching back from the voca onal track. Alike in
6The percentage of students switching to the voca onal track is higher than the numbers given in official sta s csbecause of oversamplings in the strata related to students in lower secondary educa on. For details see Stein-hauer et al. (2015).
7This number results from the 2,549 par cipants and temporary dropouts ofWave 3minus the 89 final dropoutsin Wave 3, minus the 7 final dropouts in Wave 4, minus 2 dropouts between Wave 4 and Wave 5, and minus17 students switching back to academic educa on.
8In sum, 7,527 of the 13,815 panel members of Wave 3 (i.e., par cipants and temporary dropouts) le theacademic track, either because of entering the voca onal track (in sum, 7,370 students) or because of finallydropping out (22 students inWave 3 and 135 students inWave 5). Thus, 6,288 remained in the academic track.
NEPS Survey Paper No. 2, 2016 Page 7
Steinhauer & Zinn
Wave 4, in Wave 6 only those students on the voca onal track were asked to par cipate whoprovided a valid CATI in the previous wave together with sufficient contact details.
4.2 Wave 1 and Wave 2 and between Wave 2 and Wave 3
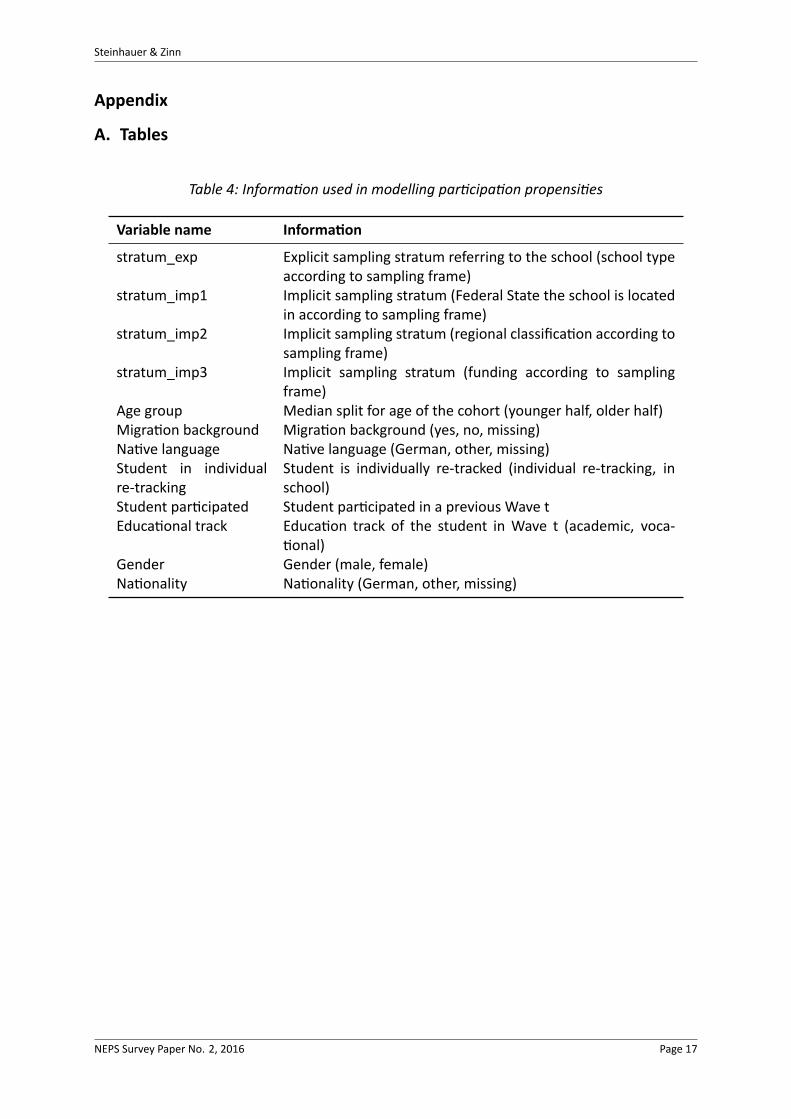
In Wave 1 and Wave 2, all students are surveyed in their schools. Concretely, Wave 1 tookplace in fall 2010 and Wave 2 in spring 2011 in the school year of 2010/2011, when all targetstudents were in Grade 9. Their individual par cipa on propensi es in the dis nct panel waveshave been es mated by means of random intercept probit models. The binary values of thedependent variable mark the par cipa on status (i.e., yes or no), and the random effect aimsat capturing the effect of the school in which a student had been sampled. Table 4 showsthe explanatory variables that have been considered. The columns one and two of Table 5 (inAppendix A) show the results of the variables found to have a significant effect. In summary,students who are educated in schools belonging to the sampling strata FS and HS show in bothwaves a significantly lower par cipa on propensity then their counterparts educated in schoolsof the remaining strata. The par cipa on propensity in Wave 2 is nega vely influenced bybeing part of the (explicit) stratum MB and of the implicit stratum of schools in urban areas.Likewise, in both waves missing informa on on the migra onal background and on the na velanguage has a nega ve effect on the par cipa on propensi es. Furthermore, in both wavesthe younger half of the panel members have a higher propensity to par cipate. The variancees mate for the random intercepts considerably increases fromWave 1 toWave 2, indica ng astrong school effect. By means of the models es mated for each panel member a par cipa onprobability can be derived. The inverse of this serves a correc on factor mul plied to the ini al(nonresponse adjusted) design weight. In the end, every par cipant is assigned such a weight.For previous versions of theseweigh ng adjustments see Steinhauer, Zinn, andAßmann (2016).Star ng from Wave 3, students might either stay in the academic context, or they might be-gin a voca onal training or they might pass to the transi on system. Both la er transi onsmean changing onto the voca onal track. At a later point in me, students on the voca onaltrack might switch back to the academic track. From there, they might again pass to the vo-ca onal track at a later me, and so on. That is, when studying the par cipa on propensi esof the sampled students and the panel members, the two dis nct survey tracks have to be re-garded. To account for this fact, from Wave 3 on wave par cipa on is modeled in a stepwisemanner. First, the probability to enter the voca onal track is determined. Then, the par ci-pa on propensi es of students on the academic and on the voca onal track, respec vely, arees mated. The inverse of the es mated transi on probabili es (first step) and the es matedpar cipa on propensi es (second step) cons tute the two adjustment factors used to compen-sate for nonresponse and a ri on. To yield wave or subgroup9 specific weights both factorsare mul plied to the (nonresponse adjusted) design weights of each panel members. Table 3shows the weights derived that way. The subsequent paragraphs deal with the es ma on ofthe respec ve transi on probabili es and par cipa on propensi es.
4.3 Student and parent weight
In Wave 1 and in Wave 5 informa on collected on students was enriched by surveying one oftheir parents. In Wave 1 there were 9,173 and in Wave 5 there were 3,597 parents par ci-
9Examples of such subgroups are students who have a ended all surveys up to a specific wave or the group ofstudents for whom a parent interview is available.
NEPS Survey Paper No. 2, 2016 Page 8
Steinhauer & Zinn
pa ng in the telephone interview. For Wave 1 we modelled the par cipa on of parents usinga probit framework with random intercept on the school level. The inverse of this es matedpar cipa on propensi es together with the students es mated propensi es were used as anadjustment factor to provide nonresponse adjusted weights for students and parents par c-ipa ng jointly in Wave 1. Table 6 displays the significant es mates of the es mated model.Table 4 gives the variables considered in the model. Parents of students are, compared toparents of students sampled in stratum GY (reference category), less willing to par cipate inthe Wave 1 survey. Also parents of a girl and parents of a child with migra on background ormissing informa on on migra on background have a lower propensity to par cipate. In con-trast parents of a child belonging to the younger part of the cohort's age group have a higherpropensity to par cipate.
4.4 Staying on the same track and switching between tracks
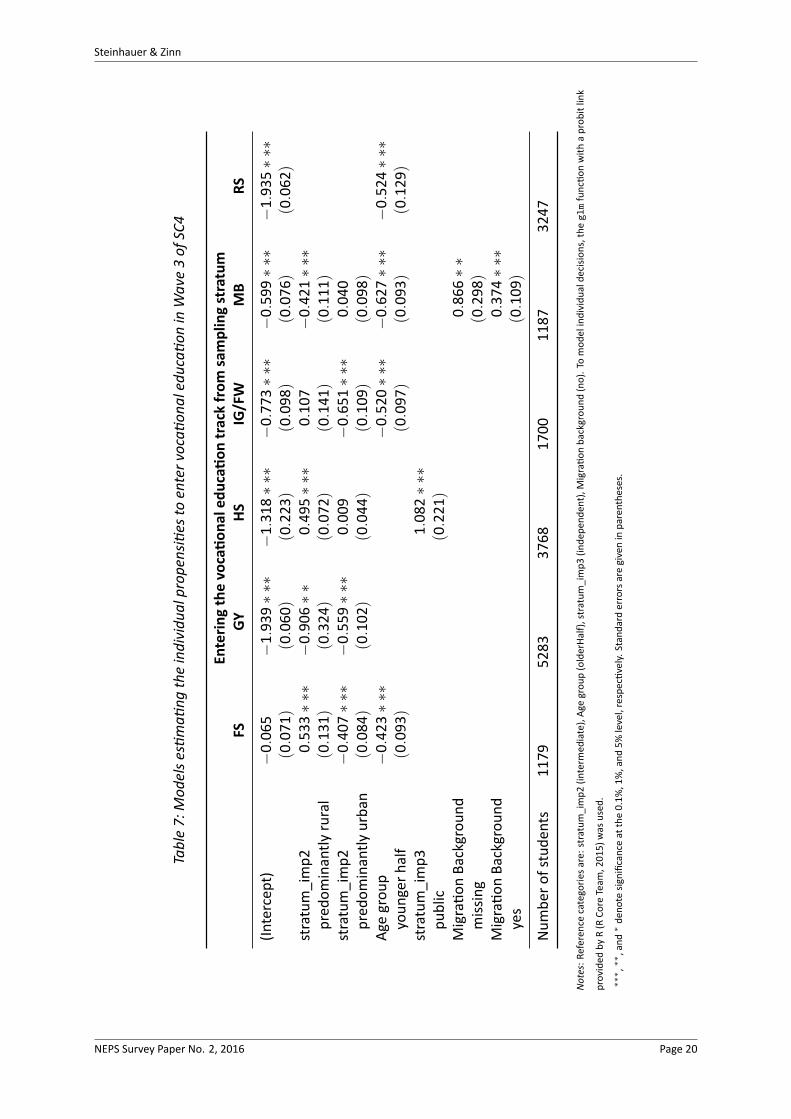
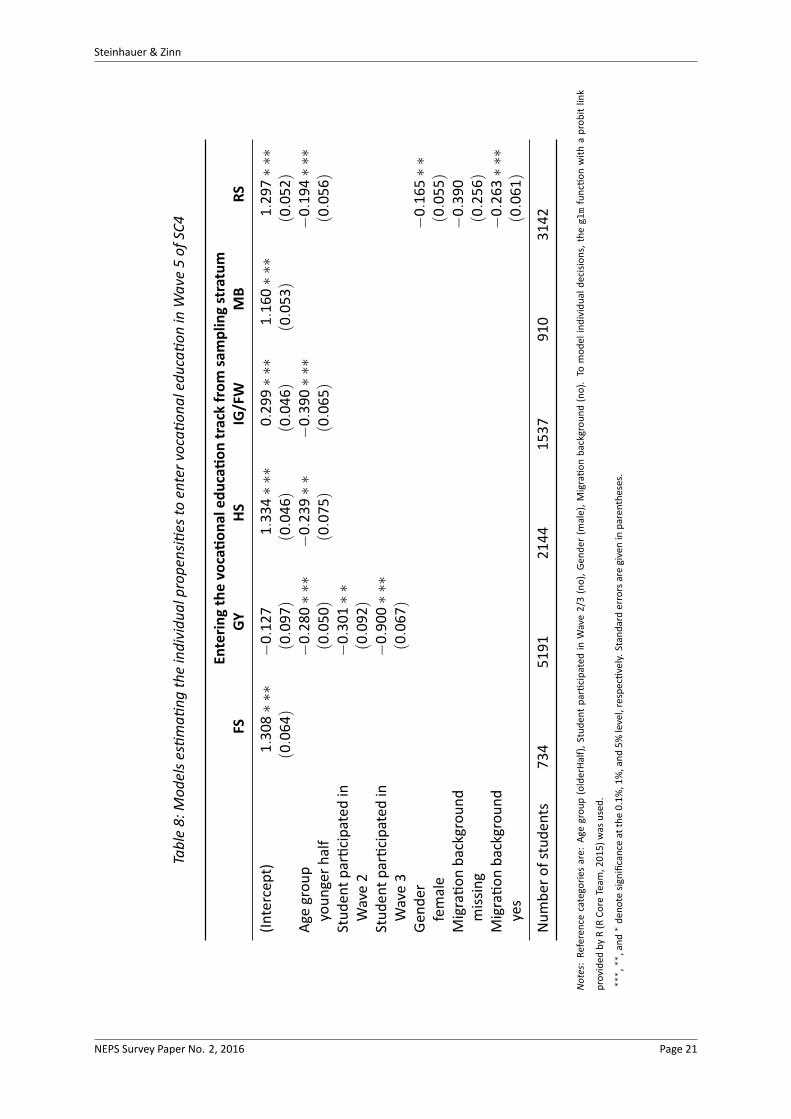
Before es ma ng a student's propensity of par cipa ng in a specific wave, his/her alloca onhas to be clarified. That is, in a first step the probability of switching onto the voca onal track ismodeled. To this end, for each (explicit) sampling stratum a probit model has been es mated.Here, the dependent variable determines whether a student enters the voca onal track (yesor no). The set of explanatory variables used is given in Table 4. Table 7 (in Appendix A) showsthe results that have been found to be significant in Wave 3. The (significant) results corre-sponding to Wave 5 are given in Table 8 (in Appendix A). In the strata IG and RS, students fromthe younger half of the panel members have a significantly lower propensity to enter the voca-onal educa on than the older ones in Wave 3 andWave 5. The same applies also to students
in the strata FS andMB inWave 3 and to students in the strata HS and GY inWave 5. InWave 3,students who are educated in a HS or FS school in a predominantly rural area show a higherpropensity to enter the voca onal track than students in schools in a predominantly semiurbanarea. The opposite is the case for students sampled in the strata GY and MB. In comparison tostudents in schools in a predominantly semiurban area, students in schools in a predominantlyurban area show a lower tendency to enter the voca onal track.10 No comparable rela onshipcould be found for Wave 5. In Wave 3, students a ending a school receiving a public fundingschool have a higher propensity to enter the voca onal track in stratum HS. Equally, having amigra onal background as well as missing informa on on it, have a significantly posi ve ef-fect on the individual propensi es to enter the voca onal track for students in stratum MB. InWave 5, female students and students with amigra onal background have a significantly lowerpropensity to enter the voca onal track in stratum RS as compared to male students and stu-dents without migra onal background or with missing informa on. The propensity to switchto the voca onal track atWave 5 is lower for students in stratumGYwho par cipated inWave 2and Wave 3.
4.5 Academic track (Wave 3 and Wave 5)
Students remaining on the academic track are surveyed inWave3 (Fall 2011, students inGrade10)and Wave 5 (Fall 2012, students in Grade 11). In order to determine their propensity to par-cipate in the two dis nct surveys a probit model has been es mated. Here, opposed to the
models corresponding to Wave 1 to Wave 3, no random effect on the school level had beenconsidered in Wave 5. The reason is that over the panel a non-negligible part of the students
10This result does not apply to students of the strata HS andMB. However, the related es mates are insignificant.
NEPS Survey Paper No. 2, 2016 Page 9
Steinhauer & Zinn
had le the schools in which they have originally been sampled. Thus, they entered the field ofindividual retracking. These students cannot be assigned to school clusters in a reasonableway.The variables considered in the probit models are given in Table 4. The es ma on results of thesignificant variables are given in column three and four of Table 5 in Appendix A. Summarized,in Wave 3 students belonging to the younger half of the panel members have a significantly ahigher par cipa on propensity than the older ones. This interrela on is reversed in Wave 5,that is, here the older ones are more prone to par cipate. In both waves (i.e., in Wave 3 and inWave 5), students in schools located in a predominantly rural area have a significantly higherpar cipa on propensity than students in schools in a predominantly semiurban area. Further-more, students not having been sampled in a Gymnasium tend to have a lower willingness toa end in the panel. Equally, preceding nonpar cipa on is found to effect the propensity offurther par cipa on nega vely. Having no informa on on the migra onal background nega-vely effects individual par cipa on propensi es in Wave 3, whereas it has no effect in Wave
5. Likewise, being in the field of individual retracking has a nega ve effect on the par cipa onpropensity of a student in Wave 3 and a posi ve effect in Wave 5.
4.6 Voca onal track (Wave 3 to Wave 6)
Alike in the case of students on the academic track, the par cipa on propensi es of studentson the voca onal track had been es mated by means of wave-specific probit models. In sum,four such models had been specified and es mated, one for each wave with students on thevoca onal track (i.e, for Wave 3 to Wave 6). As before, the dependent variable indicates thepar cipa on status and Table 4 summarized the explanatory variables. The es mated coeffi-cients corresponding to the variables found to have a significant effect are given in columnsfive to eight of Table 5 (in Appendix A). In summary, students in the younger half of the panelgroup have a higher par cipa on propensity in all waves concerned (i.e., in the Waves 3, 4and 6). Only inWave 3, students with missing informa on on the migra onal background havea significantly lower par cipa on than their counterparts. In the three remaining waves (i.e., inWaves 4 to 6), having a migra onal background lowers the individual par cipa on propensity.Students who par cipated in Wave 1 and/or in Wave 3 are more likely to par cipate also inWave 5. For the other waves, no such effect could be detected. Par cipa ng in Wave 2 posi-vely influences the par cipa on in Wave 3, 5 and 6. Likewise, par cipa ng in Wave 4 has a
posi ve effect on the par cipa on propensity in Wave 5 and 6. Being on the voca onal trackinWave 3 has already a significantly nega ve effect on the par cipa on propensi es inWave 5and 6. In Wave 6, female students are less prone to par cipate than male students.
5. Calibra on
The nonresponse adjusted design weights of Wave 1 have been calibrated to correct for sam-pling errors and undercoverage. For this purpose, data of the school year 2010/2011 fromOfficial Sta s cs have been used (Sta s sches Bundesamt, 2011), that is, data refereing toWave 1.11 Concretely, raking (Deville, Särndal, & Sautory, 1993) has been applied on the num-ber of students by Federal State and school type. In the weights data set of the SUF, the re-lated (calibrated) variable is denoted as w_t1_cal. Beware that schools in the SC4 panel might11The sampling frame used for establishing the sample of SC4 had also been formed by using data from Official
Sta s cs, (for the school year 2008/2009). Thus, all reported quan es are measured in the same way, andcalibra on could be conducted without further data modifica on.
NEPS Survey Paper No. 2, 2016 Page 10
Steinhauer & Zinn
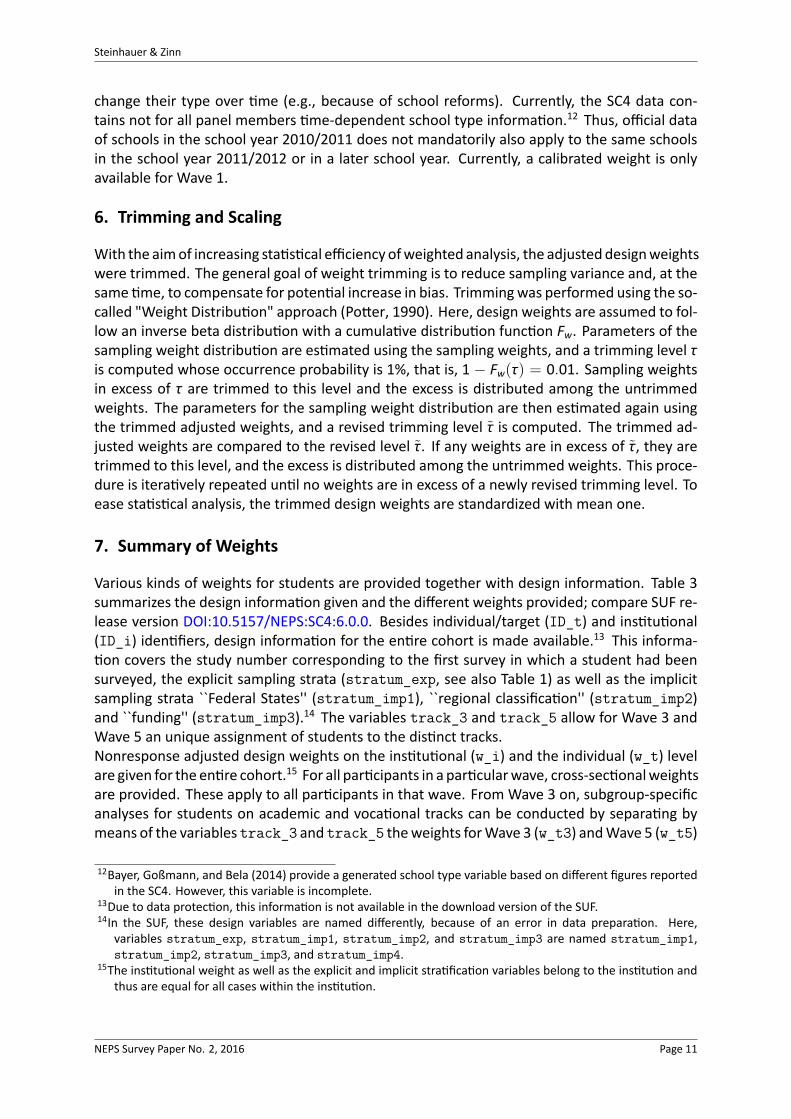
change their type over me (e.g., because of school reforms). Currently, the SC4 data con-tains not for all panel members me-dependent school type informa on.12 Thus, official dataof schools in the school year 2010/2011 does not mandatorily also apply to the same schoolsin the school year 2011/2012 or in a later school year. Currently, a calibrated weight is onlyavailable for Wave 1.
6. Trimming and Scaling
With the aimof increasing sta s cal efficiency ofweighted analysis, the adjusteddesignweightswere trimmed. The general goal of weight trimming is to reduce sampling variance and, at thesame me, to compensate for poten al increase in bias. Trimmingwas performed using the so-called "Weight Distribu on" approach (Po er, 1990). Here, design weights are assumed to fol-low an inverse beta distribu on with a cumula ve distribu on func on Fw. Parameters of thesampling weight distribu on are es mated using the sampling weights, and a trimming level τis computed whose occurrence probability is 1%, that is, 1 − Fw(τ) = 0.01. Sampling weightsin excess of τ are trimmed to this level and the excess is distributed among the untrimmedweights. The parameters for the sampling weight distribu on are then es mated again usingthe trimmed adjusted weights, and a revised trimming level τ̃ is computed. The trimmed ad-justed weights are compared to the revised level τ̃. If any weights are in excess of τ̃, they aretrimmed to this level, and the excess is distributed among the untrimmed weights. This proce-dure is itera vely repeated un l no weights are in excess of a newly revised trimming level. Toease sta s cal analysis, the trimmed design weights are standardized with mean one.
7. Summary of Weights
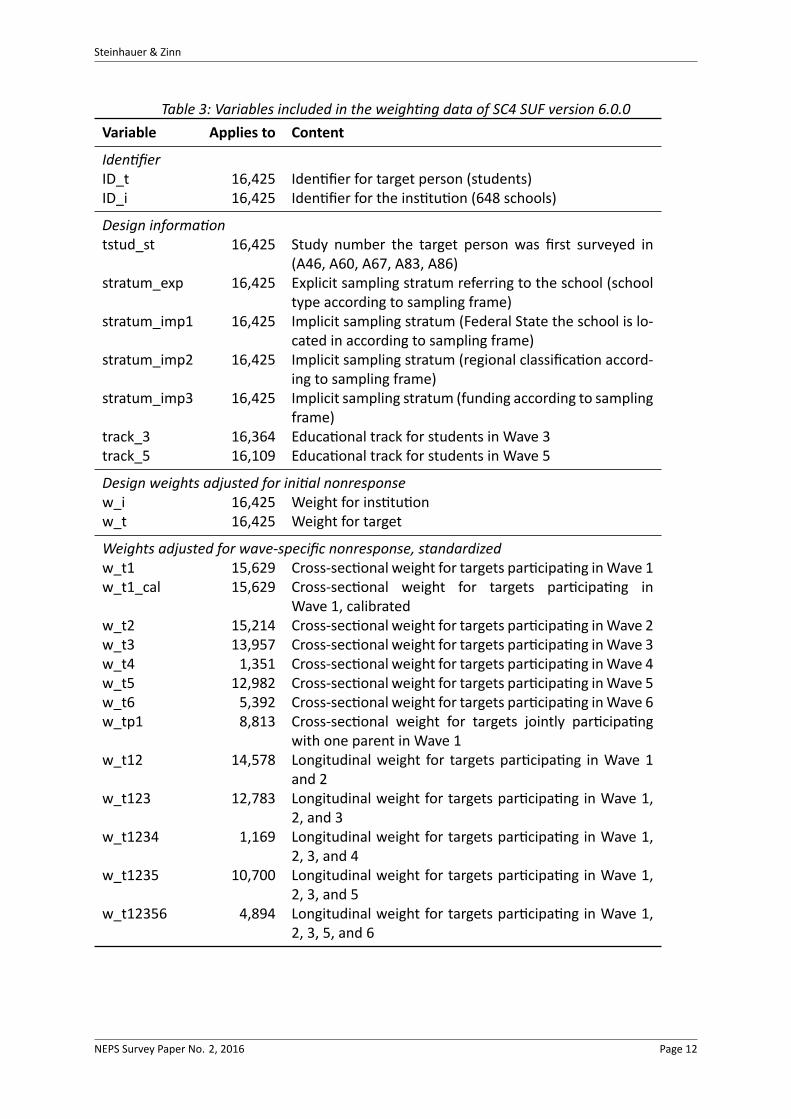
Various kinds of weights for students are provided together with design informa on. Table 3summarizes the design informa on given and the different weights provided; compare SUF re-lease version DOI:10.5157/NEPS:SC4:6.0.0. Besides individual/target (ID_t) and ins tu onal(ID_i) iden fiers, design informa on for the en re cohort is made available.13 This informa-on covers the study number corresponding to the first survey in which a student had been
surveyed, the explicit sampling strata (stratum_exp, see also Table 1) as well as the implicitsampling strata ``Federal States'' (stratum_imp1), ``regional classifica on'' (stratum_imp2)and ``funding'' (stratum_imp3).14 The variables track_3 and track_5 allow for Wave 3 andWave 5 an unique assignment of students to the dis nct tracks.Nonresponse adjusted design weights on the ins tu onal (w_i) and the individual (w_t) levelare given for the en re cohort.15 For all par cipants in a par cularwave, cross-sec onalweightsare provided. These apply to all par cipants in that wave. From Wave 3 on, subgroup-specificanalyses for students on academic and voca onal tracks can be conducted by separa ng bymeans of the variables track_3 and track_5 theweights forWave 3 (w_t3) andWave 5 (w_t5)
12Bayer, Goßmann, and Bela (2014) provide a generated school type variable based on different figures reportedin the SC4. However, this variable is incomplete.
13Due to data protec on, this informa on is not available in the download version of the SUF.14In the SUF, these design variables are named differently, because of an error in data prepara on. Here,
variables stratum_exp, stratum_imp1, stratum_imp2, and stratum_imp3 are named stratum_imp1,stratum_imp2, stratum_imp3, and stratum_imp4.
15The ins tu onal weight as well as the explicit and implicit stra fica on variables belong to the ins tu on andthus are equal for all cases within the ins tu on.
NEPS Survey Paper No. 2, 2016 Page 11
Steinhauer & Zinn
Table 3: Variables included in the weigh ng data of SC4 SUF version 6.0.0Variable Applies to Content
Iden fierID_t 16,425 Iden fier for target person (students)ID_i 16,425 Iden fier for the ins tu on (648 schools)
Design informa ontstud_st 16,425 Study number the target person was first surveyed in
(A46, A60, A67, A83, A86)stratum_exp 16,425 Explicit sampling stratum referring to the school (school
type according to sampling frame)stratum_imp1 16,425 Implicit sampling stratum (Federal State the school is lo-
cated in according to sampling frame)stratum_imp2 16,425 Implicit sampling stratum (regional classifica on accord-
ing to sampling frame)stratum_imp3 16,425 Implicit sampling stratum (funding according to sampling
frame)track_3 16,364 Educa onal track for students in Wave 3track_5 16,109 Educa onal track for students in Wave 5
Design weights adjusted for ini al nonresponsew_i 16,425 Weight for ins tu onw_t 16,425 Weight for target
Weights adjusted for wave-specific nonresponse, standardizedw_t1 15,629 Cross-sec onal weight for targets par cipa ng inWave 1w_t1_cal 15,629 Cross-sec onal weight for targets par cipa ng in
Wave 1, calibratedw_t2 15,214 Cross-sec onal weight for targets par cipa ng inWave 2w_t3 13,957 Cross-sec onal weight for targets par cipa ng inWave 3w_t4 1,351 Cross-sec onal weight for targets par cipa ng inWave 4w_t5 12,982 Cross-sec onal weight for targets par cipa ng inWave 5w_t6 5,392 Cross-sec onal weight for targets par cipa ng inWave 6w_tp1 8,813 Cross-sec onal weight for targets jointly par cipa ng
with one parent in Wave 1w_t12 14,578 Longitudinal weight for targets par cipa ng in Wave 1
and 2w_t123 12,783 Longitudinal weight for targets par cipa ng in Wave 1,
2, and 3w_t1234 1,169 Longitudinal weight for targets par cipa ng in Wave 1,
2, 3, and 4w_t1235 10,700 Longitudinal weight for targets par cipa ng in Wave 1,
2, 3, and 5w_t12356 4,894 Longitudinal weight for targets par cipa ng in Wave 1,
2, 3, 5, and 6
NEPS Survey Paper No. 2, 2016 Page 12

Steinhauer & Zinn
according to the track considered. Note, that by design in Wave 4 and Wave 6 all students areon the voca onal track. Thus, there no separa on into tracks is needed.Longitudinal weights are provided for those students of the cohort con nuously par cipa ngin all succussive waves. Students par cipa ng in Wave 1 and Wave 2 can be weighted usingthe weight (w_t12). As with the cross-sec onal weights, also the longitudinal weights can beseparated from Wave 3 on to regard the corresponding educa onal track using the variabletrack_3 for weight w_t123. Again, there is no need for separa ng the weight w_t1234 be-cause Wave 4 includes students in the voca onal track only. As before, the weight w_t1235can be correctly assigned using the variables track_3 and track_5. Again there is no need ofdifferen a ng tracks when using the weight w_t12356 since Wave 6 only includes students onthe voca onal track.
8. Comments regarding the Usage of Weights
No general recommenda on for the usage of weights can be given. Whether and how weightshave to be used depends on the problem to be studied. If the focus is on a popula on at apar cular point in me (e.g., a specific school year) weighted analysis are reasonable. However,if the research objec ve is studying processes weighted analysis might not give the intendedresult. Concretely, weights always refer to a specific popula on. In the case of SC4, they refer toall students in Grade 9 educated in regular and special-need schools in Germany in the schoolyear 2010/2011; compare Sec on 2. Thus, all weighted analyses give a representa ve pictureof these students, and not, for example, of all students in voca onal training.If the focus of the study is on the target popula on of SC4, it is recommended to apply corre-sponding weights when conduc ng descrip ve sta s cs. Beware that weights are only mean-ingful as a whole. The reason is that weights facilitate capturing the variability emerging due tosampling, a ri on, and unit-nonresponse. As a direct consequence, item-nonresponse amongthe studied popula on has to be quan fied and reported. For analy cal analysis, models fo-cusing on the popula on of SC4 have to be tested for their dependence on the sampling design.Concretely, this means that the user has to ensure that the way of sampling has no or only anegligible effect on the model results or that the sampling design is considered in the modeldefini on adequately. A general descrip on of how to test and account for the sampling designis given in, for example, Snijders and Bosker (2012). Here, as a guideline, it is recommended toinclude the basic design variables (i.e., school type as sampled, Federal State, regional classifi-ca on, funding) into the model under considera on. Addi onally, also those variables shouldbe included as explanatory variables that have found to have a significant effect on the propen-sity to par cipate in a specific wave and (if applicable) on the probability to switch tracks. Therelated informa on is detailed in Sec on 4 of this report. If the effects of these variables andof the SC4 design variables are found to be insignificant or negligible in the model under study,the corresponding variables might be omi ed in sta s cal inference. This kind of analysis isdenoted as model-based inference. However, model-based inference should be used with cau-on. The dependent variable of a regressionmodel might be a func on of the explanatory vari-
ables (of interest) and the (nonresponse adjusted) design weights. Ignoring this rela onshiplikely results in biased parameter es mates. Besides this, the intermingling of design informa-on and model parameters (to be studied) is generally difficult, since the interpreta on of the
es mated coefficients might be difficult with respect to the research objec ve.Alterna vely, one might go with a pure design-based approach and conduct weighted regres-sion analysis by including the corresponding weights. Beware that here standard errors are
NEPS Survey Paper No. 2, 2016 Page 13
Steinhauer & Zinn
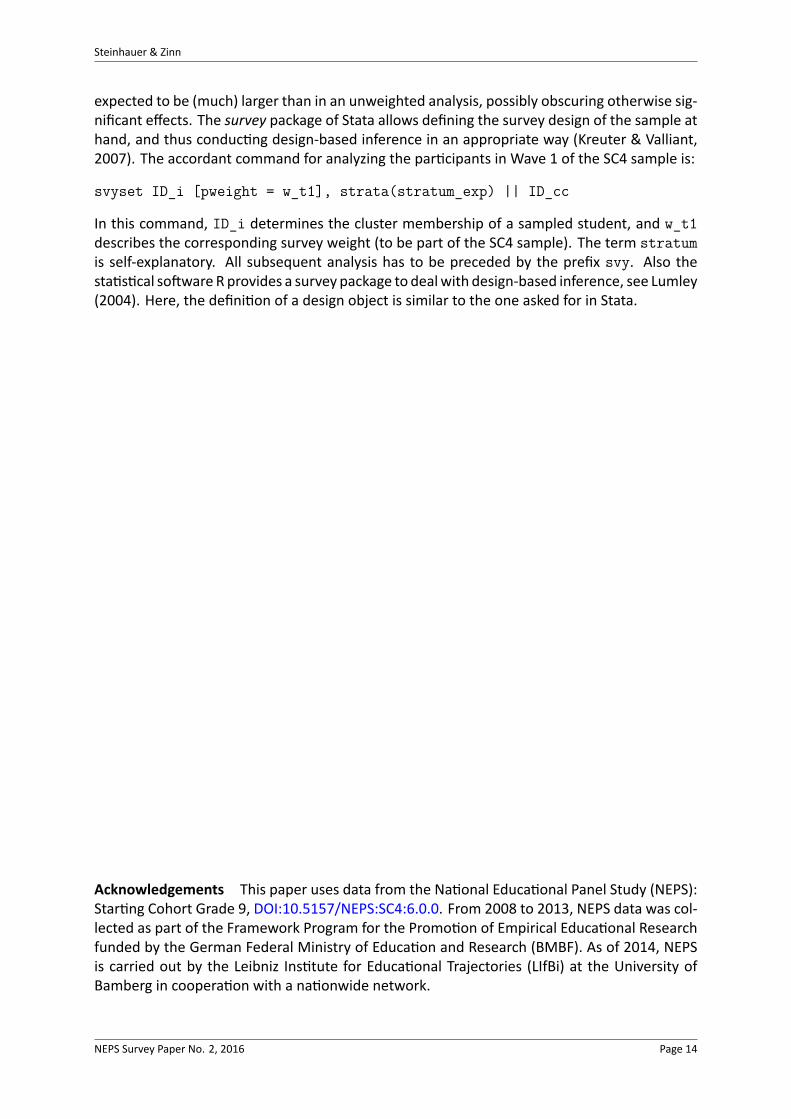
expected to be (much) larger than in an unweighted analysis, possibly obscuring otherwise sig-nificant effects. The survey package of Stata allows defining the survey design of the sample athand, and thus conduc ng design-based inference in an appropriate way (Kreuter & Valliant,2007). The accordant command for analyzing the par cipants in Wave 1 of the SC4 sample is:
svyset ID_i [pweight = w_t1], strata(stratum_exp) || ID_cc
In this command, ID_i determines the cluster membership of a sampled student, and w_t1describes the corresponding survey weight (to be part of the SC4 sample). The term stratumis self-explanatory. All subsequent analysis has to be preceded by the prefix svy. Also thesta s cal so ware Rprovides a survey package to dealwith design-based inference, see Lumley(2004). Here, the defini on of a design object is similar to the one asked for in Stata.
Acknowledgements This paper uses data from the Na onal Educa onal Panel Study (NEPS):Star ng Cohort Grade 9, DOI:10.5157/NEPS:SC4:6.0.0. From 2008 to 2013, NEPS data was col-lected as part of the Framework Program for the Promo on of Empirical Educa onal Researchfunded by the German Federal Ministry of Educa on and Research (BMBF). As of 2014, NEPSis carried out by the Leibniz Ins tute for Educa onal Trajectories (LIfBi) at the University ofBamberg in coopera on with a na onwide network.
NEPS Survey Paper No. 2, 2016 Page 14

Steinhauer & Zinn
References
Aßmann, C., Steinhauer, H. W., Kiesl, H., Koch, S., Schönberger, B., Müller-Kuller, A., Rohwer,G., Rässler, S., & Blossfeld, H.-P. (2011). Sampling designs of the Na onal Educa onalPanel Study: challenges and solu ons. In H.-P. Blossfeld, H. G. Roßbach, & J. von Mau-rice (Eds.), Educa on as a lifelong process: The German Na onal Educa onal Panel Study(NEPS) [Special Issue]: Zeitschri für Erziehungswissenscha (Vol. 14, p. 51-65). VS Verlagfür Sozialwissenscha en. doi: 10.1007/s11618-011-0181-8
Bates, D., Maechler, M., & Bolker, B. (2012). lme4: Linearmixed-effectsmodels using S4 classes.Retrieved 03.06.2014, from http://CRAN.R-project.org/package=lme4
Bayer, M., Goßmann, F., & Bela, D. (2014). NEPS Technical Report: Generatedschool type variable t723080_g1 in Star ng Cohorts 3 and 4 (NEPS Working PaperNo. 46). Bamberg: Leibniz Ins tute for Educa onal Trajectories, Na onal Educa onalPanel Study. Retrieved 09.06.2015, from https://www.neps-data.de/Portals/0/Working%20Papers/WP_XLVI.pdf
Blossfeld, H.-P., Roßbach, H. G., & von Maurice, J. (Eds.). (2011). Educa on as a lifelong pro-cess: The German Na onal Educa onal Panel Study (NEPS) [Special Issue]: Zeitschri fürErziehungswissenscha (Vol. 14). Wiesbaden: VS Verlag für Sozialwissenscha en.
Deville, J.-C., Särndal, C.-E., & Sautory, O. (1993). Generalized raking procedures in surveysampling. Journal of the American Sta s cal Associa on, 88(423), 1013-1020. doi: 10.1080/01621459.1993.10476369
Kreuter, F., & Valliant, R. (2007). A survey on survey sta s cs: What is done and can be donein stata. Stata Journal, 7(1), 1.
Kultusministerkonferenz. (2012). Defini onenkatalog zur Schulsta s k 2012. Re-trieved 06.05.2014, from http://www.kmk.org/fileadmin/pdf/Statistik/Defkat_2012.2_m_Anlagen.pdf
Lumley, T. (2004). Analysis of complex survey samples. Journal of Sta s cal So ware, 9(1),1-19.
Pfeffermann, D., & Rao, C. R. (2009). Sample surveys: Design, methods and applica ons(Vol. 29A).
Po er, F. J. (1990). A study of procedures to iden fy and trim extreme sampling weights. InA. S. Associa on (Ed.), Proceedings of the survey research methods sec on (p. 225-230).Retrieved 17.02.2014, fromhttp://www.amstat.org/sections/srms/Proceedings/papers/1990_034.pdf
R Core Team. (2015). R: A language and environment for sta s cal compu ng [Computerso ware manual]. Vienna, Austria. Retrieved from https://www.R-project.org/
Särndal, C.-E., Swensson, B., &Wretman, J. (2003). Model assisted survey sampling. New York:Springer.
Snijders, T. A. B., & Bosker, R. J. (2012). Mul level analysis: An introduc on to basic andadvanced mul level modeling (2nd ed.). London: Sage.
Sta s sches Bundesamt. (2011). Bildung und Kultur: Allgemeinbildende Schulen Schuljahr2010/2011 (Fachserie 11, Reihe 1). Wiesbaden. Retrieved from https://www.destatis.de/DE/Publikationen/Thematisch/BildungForschungKultur/Schulen/AllgemeinbildendeSchulen2110100117004.pdf?__blob=publicationFile
Steinhauer, H. W., Aßmann, C., Zinn, S., Goßmann, S., & Rässler, S. (2015). Sampling andweigh ng cohort samples in ins tu onal contexts. AStA Wirtscha s- und Sozialsta s s-ches Archiv, 9(2), 131-157. doi: 10.1007/s11943-015-0162-0
NEPS Survey Paper No. 2, 2016 Page 15
Steinhauer & Zinn
Steinhauer, H. W., Zinn, S., & Aßmann, C. (2016). Weigh ng Panel Cohorts in Ins tu onalContexts. In H.-P. Blossfeld, J. von Maurice, M. Bayer, & J. Skopek (Eds.), MethologicalIssues of Longitudinal Surveys (p. 39-61). Wiesbaden: Springer.
NEPS Survey Paper No. 2, 2016 Page 16
Steinhauer & Zinn
Appendix
A. Tables
Table 4: Informa on used in modelling par cipa on propensi es
Variable name Informa on
stratum_exp Explicit sampling stratum referring to the school (school typeaccording to sampling frame)
stratum_imp1 Implicit sampling stratum (Federal State the school is locatedin according to sampling frame)
stratum_imp2 Implicit sampling stratum (regional classifica on according tosampling frame)
stratum_imp3 Implicit sampling stratum (funding according to samplingframe)
Age group Median split for age of the cohort (younger half, older half)Migra on background Migra on background (yes, no, missing)Na ve language Na ve language (German, other, missing)Student in individualre-tracking
Student is individually re-tracked (individual re-tracking, inschool)
Student par cipated Student par cipated in a previous Wave tEduca onal track Educa on track of the student in Wave t (academic, voca-
onal)Gender Gender (male, female)Na onality Na onality (German, other, missing)
NEPS Survey Paper No. 2, 2016 Page 17

Steinhauer & Zinn
Table 5: Models es ma ng the individual par cipa on propensi es for students in Wave 1 upto Wave 6 of SC4 used to derive adjustment factors for adjusted wave-specific cross-sec onal and longitudinal weights
Academic educa on Voca onal educa onWave 1 Wave 2 Wave 3 Wave 5 Wave 3 Wave 4 Wave 5 Wave 6
(Intercept) 1.859∗∗∗ 1.793∗∗∗ 1.067∗∗∗ 1.156∗∗∗ 0.514∗∗∗ 0.670∗∗∗ −0.253∗∗ 1.050∗∗∗(0.089) (0.090) (0.069) (0.103) (0.085) (0.045) (0.088) (0.086)
stratum_exp −0.191∗ −0.483∗∗∗ −0.280∗∗∗ 4.017FS (0.086) (0.085) (0.082) (112.320)
stratum_exp −0.195∗∗ −0.210∗∗ −0.118 −0.580∗∗HS (0.063) (0.070) (0.062) (0.126)
stratum_exp −0.108 −0.100 −0.077 −0.183∗IG (0.083) (0.094) (0.077) (0.068)
stratum_exp −0.125 −0.204∗ −0.058 −0.025MB (0.091) (0.101) (0.087) (0.216)
stratum_exp −0.082 −0.002 0.092 3.825RS (0.068) (0.079) (0.063) (44.429)
stratum_imp2 −0.012 −0.130predominantly rural (0.083) (0.095)
stratum_imp2 −0.133∗ −0.250∗∗∗predominantly urban (0.055) (0.055)
Age group 0.083∗ 0.165∗∗∗ 0.072∗ −0.114∗∗ 0.191∗∗ 0.269∗∗∗ 0.154∗∗∗younger half (0.041) (0.035) (0.034) (0.048) (0.068) (0.072) (0.045)
Migra on background −2.449∗∗∗ −0.515∗ −0.561∗∗∗ −0.406∗∗ 0.099 0.210 0.009missing (0.197) (0.222) (0.126) (0.154) (0.242) (0.121) (0.180)
Migra on background 0.094 0.005 −0.094∗ −0.117 −0.266∗∗∗ −0.123∗∗∗ −0.107∗yes (0.052) (0.043) (0.037) (0.061) (0.066) (0.030) (0.046)
Na ve language 0.076 −0.048German (0.072) (0.061)
Na ve language −1.081∗∗∗ −1.267∗∗∗missing (0.247) (0.236)
Individual re-tracking −1.826∗∗∗ 0.429∗∗∗yes (0.046) (0.090)
Student par cipated in 0.183∗Wave 1 (0.071)
Student par cipated in 0.566∗∗∗ 0.429∗∗∗ 0.423∗∗∗ 0.244∗∗∗ 0.245∗∗Wave 2 (0.057) (0.091) (0.087) (0.051) (0.083)
Student par cipated in 0.644∗∗∗Wave 3 (0.037)
Student par cipated in 1.103∗∗∗ 0.395∗∗∗Wave 4 (0.064) (0.094)
Educa onal track in Wave 3 −0.474∗∗∗ −0.560∗∗∗voca onal (0.042) (0.087)
Gender −0.118∗∗female (0.042)
Random intercept 0.068 0.194 0.100on the school level
Number of students 16,425 16,425 13,815 6,305 2,549 1,821 9,804 6,119
Notes: Reference categories are: stratum_exp (GY), stratum_imp2 (intermediate), Age group (older half), Migra on background (no), Na ve
language (German), Student in individual re-tracking (no), Student par cipated in Wave 1/2/3/4 (no), Educa onal track in Wave 3 (academic),
Gender (male). To model individual par cipa on, the glmer func on with a probit link provided by lme4 package (Bates, Maechler, & Bolker,
2012) and the glm func on with a probit link provided in R (R Core Team, 2015) was used.∗∗∗, ∗∗, and ∗ denote significance at the 0.1%, 1%, and 5% level, respec vely. Standard errors are given in parentheses.
NEPS Survey Paper No. 2, 2016 Page 18

Steinhauer & Zinn
Table 6: Models es ma ng the par cipa on propensi es for parents par cipa ng inWave 1 ofSC4 used to derive adjustment factors for adjusted weights
Wave 1
(Intercept) 0.742∗∗∗(0.073)
stratum_exp −0.513∗∗∗FS (0.060)
stratum_exp −0.463∗∗∗HS (0.046)
stratum_exp −0.293∗∗∗IG (0.062)
stratum_exp −0.550∗∗∗MB (0.066)
stratum_exp −0.289∗∗∗RS (0.050)
stratum_imp3 −0.187∗∗public (0.070)
Age group 0.076∗∗∗younger half (0.022)
Gender −0.072∗∗∗female (0.021)
Migra on background −0.706∗∗∗missing (0.084)
Migra on background −0.368∗∗∗yes (0.024)
Random intercept 0.095on the school level
Number of parents 16,425
NEPS Survey Paper No. 2, 2016 Page 19
Steinhauer & Zinn
Table7:
Mod
else
sma
ngtheindividu
alprop
ensi
esto
enterv
oca
onal
educa
onin
Wav
e3of
SC4
Enterin
gthevo
caon
aled
uca
ontrackfrom
samplingstratum
FSGY
HSIG/FW
MB
RS
(Intercep
t)−0.06
5−1.93
9∗∗∗
−1.31
8∗∗∗
−0.77
3∗∗∗
−0.59
9∗∗∗
−1.93
5∗∗∗
(0.071
)(0.060
)(0.223
)(0.098
)(0.076
)(0.062
)stratum_imp2
0.53
3∗∗∗
−0.90
6∗∗
0.49
5∗∗∗
0.10
7−0.42
1∗∗∗
pred
ominan
tlyrural
(0.131
)(0.324
)(0.072
)(0.141
)(0.111
)stratum_imp2
−0.40
7∗∗∗
−0.55
9∗∗∗
0.00
9−0.65
1∗∗∗
0.04
0pred
ominan
tlyurba
n(0.084
)(0.102
)(0.044
)(0.109
)(0.098
)Ag
egrou
p−0.42
3∗∗∗
−0.52
0∗∗∗
−0.62
7∗∗∗
−0.52
4∗∗∗
youn
gerh
alf
(0.093
)(0.097
)(0.093
)(0.129
)stratum_imp3
1.08
2∗∗∗
public
(0.221
)Migra
onBa
ckgrou
nd0.86
6∗∗
miss
ing
(0.298
)Migra
onBa
ckgrou
nd0.37
4∗∗∗
yes
(0.109
)
Num
bero
fstude
nts
1179
5283
3768
1700
1187
3247
Notes:Re
ferencecatego
riesa
re:stratum
_imp2
(interm
ediate),Ag
egrou
p(olderHa
lf),stratum
_imp3
(inde
pend
ent),M
igra
onba
ckgrou
nd(no).Tomod
elindividu
alde
cisio
ns,the
glmfunc
onwith
aprob
itlin
k
provided
byR(R
Core
Team
,201
5)was
used
.∗∗
∗,∗
∗,and
∗de
note
significan
ceat
the0.1%
,1%,and
5%level,respec
vely.
Stan
dard
errorsaregivenin
parenthe
ses.
NEPS Survey Paper No. 2, 2016 Page 20
Steinhauer & Zinn
Table8:
Mod
else
sma
ngtheindividu
alprop
ensi
esto
enterv
oca
onal
educa
onin
Wav
e5of
SC4
Enterin
gthevo
caon
aled
uca
ontrackfrom
samplingstratum
FSGY
HSIG/FW
MB
RS
(Intercep
t)1.30
8∗∗∗
−0.12
71.33
4∗∗∗
0.29
9∗∗∗
1.16
0∗∗∗
1.29
7∗∗∗
(0.064
)(0.097
)(0.046
)(0.046
)(0.053
)(0.052
)Ag
egrou
p−0.28
0∗∗∗
−0.23
9∗∗
−0.39
0∗∗∗
−0.19
4∗∗∗
youn
gerh
alf
(0.050
)(0.075
)(0.065
)(0.056
)Stud
entp
arcipa
tedin
−0.30
1∗∗
Wave2
(0.092
)Stud
entp
arcipa
tedin
−0.90
0∗∗∗
Wave3
(0.067
)Ge
nder
−0.16
5∗∗
female
(0.055
)Migra
onba
ckgrou
nd−0.39
0miss
ing
(0.256
)Migra
onba
ckgrou
nd−0.26
3∗∗∗
yes
(0.061
)
Num
bero
fstude
nts
734
5191
2144
1537
910
3142
Notes:
Referencecatego
riesare:
Agegrou
p(olderHa
lf),S
tude
ntpa
rcipa
tedin
Wave2/3(no),G
ende
r(m
ale),M
igra
onba
ckgrou
nd(no).To
mod
elindividu
alde
cisio
ns,the
glmfunc
onwith
aprob
itlin
k
provided
byR(R
Core
Team
,201
5)was
used
.∗∗
∗,∗
∗,and
∗de
note
significan
ceat
the0.1%
,1%,and
5%level,respec
vely.
Stan
dard
errorsaregivenin
parenthe
ses.
NEPS Survey Paper No. 2, 2016 Page 21

Steinhauer & Zinn
B. Figures
NEPS Survey Paper No. 2, 2016 Page 22

Steinhauer & Zinn
..
Grad
e9
NoTrack
1642
5cases
1562
9Part
796TD
O
.
Wave1
.
Grad
e9
NoTrack
1642
5cases
1521
4Part
1211
TDO
.
Wave2
.
Grad
e10
1381
5cases
1189
7Part
1896
TDO
22FD
O
.
Wave3
.
Voc.
Track
2549
cases
2060
Part
400TD
O89
FDO
.
FDO
Total
172cases
61prev.
.no
survey
inthe
Acad
.Track
.
Wave4
.
Voc.
Track
1821
cases
1351
Part
463TD
O7FD
O
.
FDO
Total
179cases
172prev.
.
Grad
e11
Acad
.Track
6305
cases
5768
Part
522TD
O15
FDO
.
Wave5
.
Voc.
Track
9804
cases
7214
Part
2122
TDO
468FD
O
.
FDO
Total
799cases
316prev.
.no
survey
inthe
Acad
.Track
.
Wave6
.
Voc.
Track
6119
cases
5392
Part
667TD
O60
FDO
.
FDO
Total
859cases
799prev.
.16
425
.13
815
.
6288
.
1821
given
CATI
.
2434
.
6119
given
CATI
.
2549
.
7370
.
17
.
172
.
179
.
799
.
61
.
135
.
2
Figu
re2:
Observedpa
thway
sthrou
ghup
pers
econ
dary
andvo
caon
aled
uca
onNEP
SSC
4.No
tes:Ab
brevia
onsa
re:P
art=
Parcipa
nts,TD
O=tempo
rary
drop
out,FD
O=fin
aldrop
out(coloured
inmagen
ta),prev.=
previous
wavedrop
out,Ac
ad.=
Acad
emic(colou
redincyan
),Vo
c.=Vo
caon
al(colou
red
inlight
blue
).Blackarrowsa
ndan
nota
onsind
icatecasess
taying
inthecorrespo
ndingtrackor
stayingFD
O.A
rrow
sand
anno
taon
sincyan
indicate
casess
witching
from
voca
onalto
acad
emictrack.
Ligh
tblue
arrowsa
ndan
nota
onsind
icatecasess
witching
form
acad
emicto
voca
onaltrack.
Arrowsa
ndan
nota
onsinmagen
taindicate
casesfi
nally
drop
ping
outb
etwee
nwaves.
NEPS Survey Paper No. 2, 2016 Page 23