Benjamin Schulz, Andreas Horr, and Kerstin Hoenig The ... Papers/SP_XXIII.pdf · Benjamin Schulz,...
45
Benjamin Schulz, Andreas Horr, and Kersn Hoenig THE POSITION GENERATOR IN THE NEPS NEPS Survey Paper No. 23 Bamberg, May 2017 NEPS SURVEY PAPERS
Transcript of Benjamin Schulz, Andreas Horr, and Kerstin Hoenig The ... Papers/SP_XXIII.pdf · Benjamin Schulz,...
Benjamin Schulz, Andreas Horr, and Kerstin Hoenig
The PosiTion GeneraTor in The nePs
nePs survey Paper no. 23Bamberg, May 2017
nePs survey PaPers

Survey Papers of the German National Educational Panel Study (NEPS) at the Leibniz Institute for Educational Trajectories (LIfBi) at the University of Bamberg The NEPS Survey Paper Series provides articles with a focus on methodological aspects and data handling issues related to the German National Educational Panel Study (NEPS). The NEPS Survey Papers are edited by a review board consisting of the scientific management of LIfBi and NEPS. They are of particular relevance for the analysis of NEPS data as they describe data editing and data collection procedures as well as instruments or tests used in the NEPS survey. Papers that appear in this series fall into the category of 'grey literature' and may also appear elsewhere. The NEPS Survey Papers are available at https://www.neps-data.de (see section “Publications“). Editor-in-Chief: Corinna Kleinert, LIfBi/University of Bamberg/IAB Nuremberg Contact: German National Educational Panel Study (NEPS) – Leibniz Institute for Educational Trajectories – Wilhelmsplatz 3 – 96047 Bamberg − Germany − [email protected]
NEPS Survey Paper No. 23, 2017
The Position Generator in the NEPS
Benjamin Schulz, WZB Berlin Social Science Center
Andreas Horr, Leibniz Institute for Educational Trajectories (LIfBi) and Mannheim Centre for European Social Research (MZES)
Kerstin Hoenig, Leibniz Institute for Educational Trajectories (LIfBi)
E-mail address of lead author
Bibliographic data:
Schulz, B., Horr, A., & Hoenig, K. (2017). The position generator in the NEPS (NEPS Survey Paper No. 23). Bamberg, Germany: Leibniz Institute for Educational Trajectories, National Educational Panel Study.
Schulz, Horr, & Hoenig
NEPS Survey Paper No. 23, 2017 Page 2
The Position Generator in the NEPS
Abstract
The position generator is an established survey instrument to measure the status composition of actors’ egocentric social networks. This paper sets forth the theoretical background of the position generator by providing a brief overview of social capital theory and the mechanisms through which social capital can affect educational outcomes. Against this background, it details the version of the position generator implemented in all NEPS starting cohorts. The NEPS position generator is intended to measure respondents’ social resources by giving a range of 13 professions and asking respondents whether they personally know someone who pursues this profession and if so, about the ethnic background of this person. We analyzed the scientific use files of four NEPS starting cohorts to test the reliability and validity of the instrument and to describe corresponding distributions. Results show that the instrument performs well over all starting cohorts. We found consistent differences between migrants’ and natives’ social networks in terms of number of contacts, mean status composition and ethnic composition of the network. Likewise, respondents’ occupational status is associated with their social network’s status composition. Finally, we examined changes in network composition over a four-year span and found that networks do change over time, with a propensity to increase as respondents age and advance in their careers. We are confident that the position generator is well suited to measure differences in respondents’ social capital and to examine inter-group differences.
Keywords
social capital, position generator, social networks
Schulz, Horr, & Hoenig
NEPS Survey Paper No. 23, 2017 Page 3
1. Introduction
Since their development in the 1980s, social capital theories made a stellar career in the social sciences. Scholars use them to better understand educational inequality, status transmission, labor market integration but also group coherence and political participation (cf. e.g., Brandt, 2006; Coleman, 1988; Dufur, Parcel & Troutman, 2013; Krug & Rebien, 2012; Moerbeek & Flap, 2008; Morgan & Todd, 2009; Mouw, 2006; Weiss & Klein, 2011; Yakubovich, 2005). Moreover, social capital has been identified as a crucial factor for immigrant integration, especially for educational attainment and labor market integration (cf. esp., Portes, 2008). A key reason for the steep career of ‘social capital’ is that—under the same label—different concepts have been developed simultaneously in different fields. The concepts proposed by Bourdieu (1986), Burt (1992, 2001), Coleman (1988, 1990), Lin (1982, 2001), and Putnam (1993, 1995, 2000) are probably the most influential contributions, each of them inspiring a vast number of empirical applications (for reviews, cf. e.g., Adam & Roncevic, 2003; Castiglione et al., 2008; Flap, 1999; Field, 2008; Lin & Erickson, 2008; Van Deth, 2003).
Despite meaningful differences between the various concepts of social capital, there is one significant commonality: Social capital is usually defined with reference to the resources accessible through social networks. The common thread of the various social capital concepts is that networks give access to some kind of resource, which individuals can use to achieve their goals. Besides the configuration of networks, the resources that one’s contacts possess are the main determinant of social capital (see, e.g., Lubbers et al., 2010). Social capital is thus contingent on the economic, human, and cultural capital as well as the prestige, status, and power of one’s contacts (cf. esp., Bourdieu, 1986).
Given the link between the resources controlled by an actor’s contacts on the one hand and her endowment with social capital on the other, it is hardly surprising that the distribution of social capital tends to mirror the distribution of other forms of capital. This fact is a result of both preferences for relationships with others who are similar to oneself and more opportunities to meet similar others, for instance, in school or at the place of work. Inter-personal networks, consequently, tend to be homogeneous in terms of attitudes, world views, and lifestyles and in terms of education and socio-economic status. Members of the middle or upper class, accordingly, tend to be embedded in networks with a higher socio-economic status than members of the lower classes (Bourdieu, 1986; Lin, 1999, 2001).
Lin (2001) summarized social inequality in endowment with social capital in his strength-of-position proposition:
“This proposition predicts a structural effect on social capital: those in better social positions will have the advantage in accessing and mobilizing social ties with better resources.” (Lin, 2001: 65)
According to this proposition, actors in higher socio-economic positions not only have access to more social resources but can also mobilize them more easily than actors in lower positions. Lin (1999, 2001), moreover, underlines that the effect of an actor’s socio-structural positioning on her social capital endowment is stronger than the well-known effects of network configuration, such as the strength of (weak) ties.
Schulz, Horr, & Hoenig
NEPS Survey Paper No. 23, 2017 Page 4
In light of the importance of socio-economic network composition for one’s social capital endowment—and its effects on individual outcomes such educational attainment, labor market participation, or status transmission— a specific survey instrument has been developed: the position generator (cf. esp., Lin & Dumin, 1986; Lin & Erickson, 2008; Lin, Fu & Hsung, 2001; Van der Gaag, Snijders & Flap, 2008). It measures the status composition of an actor’s network by providing respondents with a list of occupations of different social status and asking them to indicate whether they know anybody in that occupation. Under the assumption that contacts in higher socio-economic positions control more valuable resources, it therefore provides us with an indirect estimate of the social resources accessible through an individual’s wider network.
In this paper, we present the NEPS position generator. In the next section we set forth its theoretical background. Against this background, we discuss the fundamental methodological concerns that we considered in the development of the instruments and provide an overview of how the position generator is implemented across the different NEPS starting cohorts and the NEPS social capital framework (section 3). Finally, we describe the data as available in the Scientific Use Files of several NEPS cohorts by now and draw conclusion along with some suggestions for the usage of the instrument.
2. Theoretical background
Social capital has been conceptualized in very different ways by scholars such as Bourdieu (1986), Coleman (1988), Granovetter (1973), or Lin (1999). In light of the diversity in its origins and frameworks, it is not surprising that social scientists mean quite different things when they refer to ‘social capital’—a particularly large amount of conceptual ambiguity has often been criticized (cf. e.g., Adam & Roncevic, 2003; Esser, 2008; Van Deth, 2003). In order to reduce this ambiguity, it is helpful to differentiate between a collective and an individual concept of social capital (cf. e.g., Esser, 2008; Kriesi, 2007). Collective social capital covers the degree of trust, social control, cooperativeness, and the validity of norms in social collectives. In the second perspective, (individual) social capital is considered as a relation-based social resource. It covers, for instance, the exchange of information or support among friends. As the concept underlying the position generator is individual social capital, we focus on this form here.
Individual social capital refers to the resources that actors can access through the inter-personal networks and groups they belong to—and which they can use as productive means to achieve their goals. Individual social capital is a resource that actors can use to create (more) benefits (Lin, 1999: 30; Snijders, 1999: 29). The probably most cited definition of this form of social capital reads as follows:
“Social capital is the sum of the resources, actual or virtual, that accrue to an individual or a group by virtue of possessing a durable network of more or less institutionalized relationships of mutual acquaintance and recognition.” (Bourdieu & Wacquant, 1992: 119)
Inter-personal networks are the basis of individual social capital as it arises from an actor’s relationships with others. It is a personal asset, although not controlled by the individual actor alone. Rather, it is situated in the relations between actors (Coleman, 1990; Loury, 1977).
Schulz, Horr, & Hoenig
NEPS Survey Paper No. 23, 2017 Page 5
2.1 Forms of social capital
Applying a broad definition of social resources, we identify six forms of social capital that represent five different ways how social capital operates. These five ways are: i) information, ii) instrumental support, iii) social credibility and credentials, iv) emotional support and social recognition, and v) the norms, values, and orientations predominating in a certain network or group. In the following paragraphs, we will briefly explain how these six forms of social capital function.
First, information is an important resource that flows through inter-personal networks. Actors often get to know about new opportunities through their social relations. Moreover, they gain insights into processes they would otherwise not understand. Parents, for instance, who are looking for a kindergarten place for their child, may receive information about new vacancies through their inter-personal networks. Erikson and Jonsson (1996) explain that information about the functioning of the school system contributes to the generation of educational inequality. Similarly, Dufur, Parcel, and Troutman (2013) argue that families with low levels of social capital provide less information and thus impair children’s academic achievement. Information gathered through inter-personal ties reduces transaction costs. If friends or family members, for instance, keep their ears open and forward information on vacancies in childcare facilities to the person in question, that person saves time and search costs. Second, network-based information is particularly likely to lead to better matches between applicants and positions (see esp., Dustmann, Glitz, Schönberg & Brücker, 2015).
A second form of individual social capital is instrumental support or practical help. It can take many forms. A grandmother who regularly takes care of her grandchildren supports her daughter’s career. Support means that others use their resources in order to enhance an actor’s returns or to create benefits for him. This primarily refers to using time and the commitment of specific skills. In most cases, others’ support directly reduces an actor’s costs, which, in turn, gives her more leeway for achieving other goals.
The third form of individual social capital is the social credibility and credentials accruing from one’s inter-personal networks. Whereas support yields returns through reducing an actor’s costs and direct influence on third parties, social credibility works indirectly. Networks, especially mutual acquaintances, function as both a leap of faith and a reassurance for third parties. Inter-personal contacts, especially mutual acquaintances, signal an actor’s trustworthiness and social acknowledgement—that is, they serve as an affirmation of his creditworthiness and soundness. What matters for our discussion of the position generator is the fact that the credibility endorsed by a certain recommendation is a function of the prestige, status and positioning of the persons that provides it.
Fourth, emotional support and recognition is a further form of social capital that is particularly important for mental and physical health (Ferlander, 2007). It functions by strengthening an actor’s identity, self-worth and self-efficacy beliefs as well as his motivation and commitment. In this way, it also has indirect effects on educational and labor market success, as better mental health strengthens one’s capability and employability. Emotional support is almost exclusively provided by strong ties: It is one’s inner circle (partners, close family members, and friends) that usually provides attention, love, and security that
Schulz, Horr, & Hoenig
NEPS Survey Paper No. 23, 2017 Page 6
strengthens and stabilizes one’s self-esteem. Strong ties make an actor feel that he is recognized and cherished, which is particularly important in difficult times, such as in case of severe illness or personal crises (Lüdicke & Diewald, 2007: 266f).
The norms, values and orientations that predominate in a certain group or network constitute a fifth form of social capital. Whereas the first four forms deal with resources in the narrow sense, this fifth form rests on a broad, rather metaphorical, understanding of resources. Norms and values primarily affect individual beliefs and motivations. Such effects can even (mis)lead actors to disregard other situational aspects or to ignore the consequences of a decision. In this way, networks can enforce educational aspirations or establish a normative environment that supports educational attainment (Coleman, 1988; Dijkstra et al., 2003; Thorlindsson et al., 2007; Sewell et al., 1970; Singer, 1981; Stocké et al., 2011). Group norms, however, are not necessarily positively interrelated with educational achievement and attainment—they can also transmit counter-productive norms or anti-social behavior, for instance, by promoting futility cultures (Agirdag, Van Houtte & Van Avermaet, 2012). Effects of group norms on individuals largely stem from the adoption of attitudes and behaviors of role models or the (often unconscious) internalization of peer norms. Group identification and a group’s power to sanction behaviors that violate group norms are important conditions that influence the efficiency of reference group effects (Portes & MacLeod, 1999).
All five forms of social capital rely on resource transmission. As the diversity and subtleties of the five forms already suggest, it is difficult to develop direct measurements of social resources—in large-scale surveys, in fact, it is a hardly feasible task. The position generator therefore takes another approach: it indirectly assesses social resources through the status composition of the social network. It stems from the idea that control over resources is directly linked to an actor’s position in the social hierarchy. According to Lin (2001), the social hierarchy takes the shape of a pyramid – a few actors in the positions at the top control the most valued resources, whereas the most common positions at the bottom control the least valuable resources. Ties to actors with a higher status therefore promise higher benefits, but ties to actors with a similar or lower status are more easy to establish and maintain due to the fact that these positions are more common and due to the homophily principle.
Schulz, Horr, & Hoenig
NEPS Survey Paper No. 23, 2017 Page 7
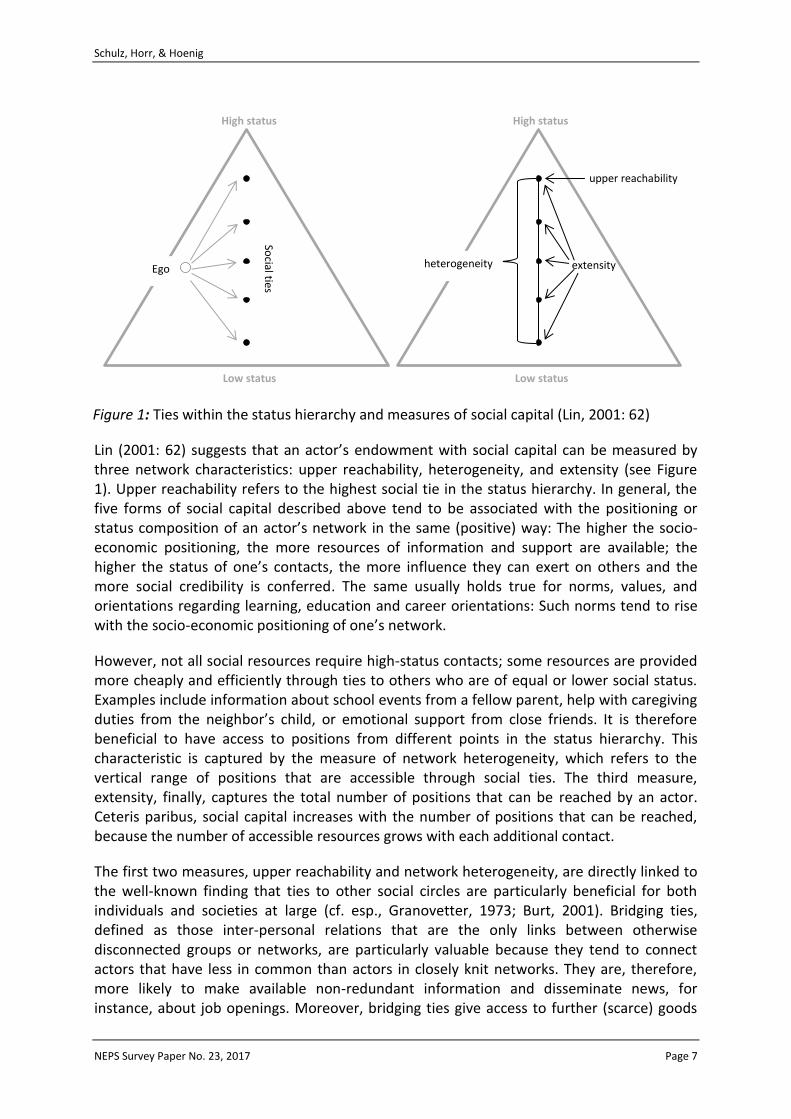
Lin (2001: 62) suggests that an actor’s endowment with social capital can be measured by three network characteristics: upper reachability, heterogeneity, and extensity (see Figure 1). Upper reachability refers to the highest social tie in the status hierarchy. In general, the five forms of social capital described above tend to be associated with the positioning or status composition of an actor’s network in the same (positive) way: The higher the socio-economic positioning, the more resources of information and support are available; the higher the status of one’s contacts, the more influence they can exert on others and the more social credibility is conferred. The same usually holds true for norms, values, and orientations regarding learning, education and career orientations: Such norms tend to rise with the socio-economic positioning of one’s network.
However, not all social resources require high-status contacts; some resources are provided more cheaply and efficiently through ties to others who are of equal or lower social status. Examples include information about school events from a fellow parent, help with caregiving duties from the neighbor’s child, or emotional support from close friends. It is therefore beneficial to have access to positions from different points in the status hierarchy. This characteristic is captured by the measure of network heterogeneity, which refers to the vertical range of positions that are accessible through social ties. The third measure, extensity, finally, captures the total number of positions that can be reached by an actor. Ceteris paribus, social capital increases with the number of positions that can be reached, because the number of accessible resources grows with each additional contact.
The first two measures, upper reachability and network heterogeneity, are directly linked to the well-known finding that ties to other social circles are particularly beneficial for both individuals and societies at large (cf. esp., Granovetter, 1973; Burt, 2001). Bridging ties, defined as those inter-personal relations that are the only links between otherwise disconnected groups or networks, are particularly valuable because they tend to connect actors that have less in common than actors in closely knit networks. They are, therefore, more likely to make available non-redundant information and disseminate news, for instance, about job openings. Moreover, bridging ties give access to further (scarce) goods
Figure 1: Ties within the status hierarchy and measures of social capital (Lin, 2001: 62)
upper reachability
Low status
High status
heterogeneity extensity
Low status
High status
Social ties
Ego
Schulz, Horr, & Hoenig
NEPS Survey Paper No. 23, 2017 Page 8
such as (affordable) housing or child care facilities. Bridging ties thus increase opportunities for individual and collective action by facilitating—or even enabling—interaction among distant actors.
The advantage of ties that bring together distant actors and groups is also critical for the differentiation between bridging and bonding social capital (Putnam, 2001). The crucial difference between the two concepts is exactly what we have just described: Wide networks provide actors with more diverse social resources than narrow ones. Bonding social capital, by contrast, refers to the idea that dense networks have a particular strength as well—they support the mobilization of social resources, especially of costly ones, which accrues from the capacity of dense networks to facilitate social control, (credits of) trust, shared identities, and solidarity.
2.2 Immigrant social capital: How ethnic communities matter
The distinction between bridging and bonding social capital is particularly prominent in integration research, especially in studies investigating the socio-economic incorporation of immigrant groups. For immigrants, bridging social capital is then mostly equated with having inter-ethnic ties, that is, ties to the majority population. Likewise, bonding social capital is equated with having intra-ethnic ties, that is, ties within the co-ethnic community (e.g., Heizmann & Böhnke, 2016; Koopmans, 2016). This distinction is based on the (well confirmed) assumption that immigrant groups are positioned in the lower rungs of the socio-economic hierarchy, thus providing them with less social capital. Inter-ethnic ties, by contrast, indicate bridging social capital because they connect immigrants with more distant others, who also tend to be better situated than co-ethnics. Inter-ethnic ties accordingly provide immigrants with more social capital, which, again, might strengthen socio-economic incorporation through all five ways discussed above.
Besides these general forms of social capital, the impact of further immigrant-specific forms of social capital on immigrant integration is vigorously debated in integration research. These specific forms mainly deal with the effects of ethnic communities that have always been identified as important factors shaping incorporation processes (see esp., Portes & Rumbaut, 2001). We identify four forms of immigrant-specific social capital (for the sake of simplicity we will refer to them as ethnic social capital).
First of all, the ethnic community is particularly important for newly arriving immigrants as it helps them to find guidance despite language barriers. The ethnic community offers easy access to crucial information, especially about typical matters that immigrants face upon arrival in a new environment, such as job search, (affordable) housing, administrative matters, specific shopping facilities, or medical aid. This first form of ethnic social capital largely follows from being able to communicate with each other. This argument, however, is not only about language barriers. It is also concerned with mutual understanding (e.g., of codes, customs, and modes of reaction)—it is linked to socio-cultural characteristics. Last but not least, fellow co-ethnics can more naturally put themselves in the position of newly arriving immigrants as they often share similar (defining) experiences—many community members once happened to be in similar situations.
Second, in response to the particular challenges that immigrants face, ethnic communities often develop particular institutions or organizations that help them to meet these
Schulz, Horr, & Hoenig
NEPS Survey Paper No. 23, 2017 Page 9
challenges. Prime examples of such organizations are cultural associations, religious communities, and youth centers, often headed by social workers from the community (Zhou, 2009). These centers are not only successful because they offer homework assistance and specially tailored activities that meet the needs of young immigrants but also because they are sensitive to group-specific norms and values—thereby, gaining the acceptance of both immigrant youth and parents.
Third, ethnic networks and communities can have protective effects. In particular, they can prevent adolescents from negative contextual influences, especially from adopting the counterproductive attitudes or behavior of disadvantaged groups with whom they come into contact. Immigrants do so more often than natives as they are more likely to grow up in disadvantaged neighborhoods. In contrast to others, ethnic networks are particularly likely to become protective shields against deprivation. This is because they tend to be denser than other networks, which fosters intergenerational closure and facilitates both social control and the enforcement of group norms (Portes & Rumbaut, 2001).
Fourth, for similar reasons ethnic communities might be able to promote achievement norms and values that favor educational and occupational attainment. Again, such arguments have mainly been pushed forward for the U.S., where Asian-Americans are seen as the prime example of (educational) success against the odds (cf. e.g., Zhou & Bankston, 1994; Zhou & Xiong, 2005). Similarly, Shah, Dwyer & Modood (2010) identify shared norms in Pakistani families in the U.K. as crucial factors that help understand why Pakistani student aim for better education than other groups.
Fifth, ethnic networks and communities may also be conducive to socio-economic advancement indirectly—through psychological mechanisms. They can reinforce identities, thereby, strengthening self-esteem and mental health, which, in turn, helps keep alive educational and occupational aspirations and motivations—even in hostile environments, that is, in case of discrimination or exclusion. Shared ethnic identities, moreover, strengthen ethnic solidarity, especially if they are endorsed by a sense of common destiny. Ethnic (in-group) solidarity, then, lets minority group members become more willing to share their resources with others. In other words, solidarity eases the mobilization of all kinds of social capital.
As our brief discussion of the five forms of immigrant social capital has already shown, whether or not ethnic networks and communities, eventually, foster socio-economic integration is conditional on both the resources and norms predominating in a community and corresponding network structure. Ethnic communities are neither solely a springboard nor solely a trap, as Zhou (2009: 1156) put it—, there rather exists a varied “spectrum of resources and constraints” that influence immigrant incorporation. Some effects even depend on further contextual factors, especially on the (non-)existence of ethnic boundaries and social acceptance by the majority population as well as on integration regimes (e.g., regulation of labor market access). This conditional view regarding the influence of ethnic networks and communities challenges us to specify much more precisely which resources, orientations, and values ethnic communities actually provide—and when they influence integration outcomes.
Schulz, Horr, & Hoenig
NEPS Survey Paper No. 23, 2017 Page 10
In order to make progress here, we need both measures of the different forms of social capital and measures of the ethnic composition of the corresponding networks. Having both of them allows us to differentiate between general forms of social capital and immigrant-specific ones. Since it is not feasible to measure the various forms of immigrant social capital directly, we need to include ethnic network composition as a proxy measure for identifying ‘ethnic residuals’ that might point to the significance of immigrant-specific social capital. The special focus of NEPS on education acquisition with a migration background (cf. Kristen et al., 2011) and the apparent lack in social capital data, were a main reason for the development of a comprehensive NEPS social capital instrument, especially for including measures of ethnicity in the position generator (for details, cf. Hoenig et al., 2016).
In order to be able to test the impact of social capital—and to evaluate its role in the generation of inter-group differences in educational achievement and attainment or labor market integration, it is crucial to obtain sound measurements. The position generator is designed to provide a reliable measurement of wide inter-personal networks. By providing a list of positions of different socio-economic status, the position generator can be used to measure the upper reachability, heterogeneity and extensity of an actor’s network. This fact is the main reason why we implemented a short version of the position generator across the NEPS cohorts. In order to be able to distinguish between the general social capital mechanisms discussed in this section and the specific ways how ethnic networks function, we additionally asked for the country of origin of all persons indicated by the respondent in the position generator. In the following section we describe our measurement instrument and how we developed it.
3. Measurement concept and methodological concerns
In large-scale surveys, social capital is usually measured based on the survey participant’s ego-centered network. In ego-centered measurement instruments, the individual respondent herself is the source of information about her social networks. She is regarded as a focal actor F who is connected to other actors A1 to Ak (alteri) via social relations r. These alteri along with their connections to ego form F’s ego-centered network. Such approaches have long been implemented in survey research (see already, Burt, 1984; Fischer, 1982; Marsden, 1990). From the long list of social capital instruments that have been proposed, the most common ones1 are (Häuberer, 2011; Van der Gaag & Webber, 2008): i) name generators, ii) the resource generator, and iii) the position generator. All these measurement instruments are part of the comprehensive NEPS social capital instrument. The rationale, layout, and development process of the NEPS social capital instrument has been described by Hoenig et al. (2016). In what follows, we confine ourselves to presenting the NEPS position generator as an integral part of the NEPS social capital instrument.
3.1 The measurement instrument in general
The position generator is a widely used social capital instrument (Lin & Dumin, 1986; Lin et al., 2001; Lin & Erickson, 2008). In contrast to other ego-centered social capital instruments, it is not meant to gather detailed information about particular contact persons but measures the status composition of an actor’s wider network. It does so by surveying the ties of survey
1 In their meta-analysis, Hlebec & Kogovsek (2013) also cover ‘role generators’ and ‘event-related support networks’. As these two have a very particular focus and have not been considered for implementation in NEPS, we do not take them into consideration here.
Schulz, Horr, & Hoenig
NEPS Survey Paper No. 23, 2017 Page 11
respondents to persons in certain occupations. Respondents are asked to indicate from a list of occupations whether or not they personally know someone who pursues such a profession. These occupations range from low-status occupations, such as security guards or warehousemen, to high-status professions, such as lawyers or physicians. The approach is based on the assumption that occupations can be ranked according to the social status they entail—and that social status involves control over material and immaterial resources.
Social capital indicators derived from the position generator “are based on the idea that the occupations of network members represent social resource collections that can be quantified with job prestige measures” (Van der Gaag & Webber, 2008: 39). Accordingly, prestige scores are allocated to each profession in empirical application. Mostly, the Socio-Economic Index of Occupational Status (ISEI, cf. Ganzeboom, Degraaf & Treimann, 1992) is used. Depending on theoretical interests or substantial hypotheses, researchers can generate various social capital indicators, such as the mean ISEI of all professions reached or the heterogeneity of positions. The position generator, thus, facilitates mapping the status composition of ego’s wider network and available resources.
The position generator usually refers to weak ties. Such ties may include distant acquaintances, (former) colleagues as well as fellow members of clubs or other organizations to which someone belongs. Some versions of the position generator collect further information about the persons that obtain a certain occupation. Such details include the frequency of contact, how well the persons know each other, or the kind or strength of a relationship. If one does not add too many contextual questions, the position generator is a (time-) efficient measurement instruments with particularly low interviewee and interviewer burden (Chua, Madej & Wellman, 2011: 107). Interviewer misconduct and panel conditioning are therefore rather unlikely.
The position generator, of course, has its weaknesses as well. First of all, as it is designed to measure those aspects of social capital that influence instrumental actions, such as job search or occupational attainment, the position generator is not well-suited for covering those social capital dimensions that refer to expressive action (e.g., emotional support or recognition) (Häuberer, 2011: 140). Second, the social capital indicator gained through the position generator depends on the professions included in the list of occupations. At the same time, this list is sensitive to the concrete labeling of occupations. Accordingly, positions (and labels) need to be chosen in a way that suits all subgroups of the study population. This is by no means a given. Gendered labor markets, for instance, can bias results between men and women if the jobs listed in the position generator tend towards one group, that is, if there are primarily male or female dominated jobs in the list of occupations. Similarly, it has been shown that the position generator is less applicable for homemakers, pensioners or unemployed respondents than for those who are in the labor force (Häuberer, 2011: 141). Third, inter-cultural differences in norms or gender role beliefs can affect indicators derived from the position generator. Last but not least, although the position generator is specifically geared to measuring resource possession, it does so in a broad and indirect way—by ascribing prestige scores to occupational positions. Resource exchange or actual resource mobilization is not measured. The position generator is therefore of little help if one seeks to specify the exact channels through which social capital has an effect on certain outcomes.

Schulz, Horr, & Hoenig
NEPS Survey Paper No. 23, 2017 Page 12
3.2 The measurement in the NEPS
The position generator is an integral part of the NEPS social capital instrument. It includes measures of prospective and retrospective access to specific social resources, questions about the expectations and aspirations of friends, family members and peers, and parental involvement in their child’s education. The latter instruments address more directly through which pathways social capital affects educational and labor market outcomes, but they are usually targeted to specific educational or labor market outcomes and lack the general scope of the position generator. Our overall strategy thus aims to combine the strengths of the position generator and more direct measures of resource access and mobilization. An overview of social capital instruments within NEPS can be found in Stocké et al. (2011). For an overview of the process of development, see Hoenig et al. (2016).
It is assumed that networks of professional contacts develop when actors enter the labor market and that actors rely on parental networks before that time (see Granovetter, 1974). Therefore, the position generator is administered to parents while respondents are still in school and only administered to respondents directly once they have left school.
In general, we try to include measures of the position generator shortly before important transitions take place, such as the transition to elementary school in Starting Cohort 1 or the transition into vocational training in Starting Cohort 4. In Starting Cohort 6, which tracks adults of all age groups, most of whom have finished formal education, we measure the position generator every four years. In Starting Cohorts 4 and 5, which track young adults through vocational training or university and then into the labor market, we plan repeated measures of the position generator around the time when subjects make the transition into the labor market. It will thus be possible to examine the development of respondents’ professional networks and (for Starting Cohort 4) compare it with the parental network. An overview of realized and planned schedule for all Starting Cohorts can be found in Table 1.
Table 1: Schedule for position generator measurements in all NEPS Starting Cohorts
Starting Cohort
2009 2010 2011 2012 2013 2014 2015 2016 2017 2018 2019 2020
1 P (W7)
2 P (W3)
3 P (W6)
T (W10)
4 P (W1)
P (W7)
T (W11)
5 T (W4)
T (W11)
T (W18)
6 T (W2)
T (W6)
T (W10)
T: Position generator administered in target person interview P: Position generator administered in parent interview Entries for 2018-2020 reflect current plans and may be subject to change
Schulz, Horr, & Hoenig
NEPS Survey Paper No. 23, 2017 Page 13
We included a short version of the position generator in NEPS studies. Its basic shape comes close to common versions (cf. e.g., Lin, 1999) as sketched above. The biggest difference between the position generator implemented in NEPS and other versions is the number of occupational positions covered. Whereas a complete version of the position generator usually covers 30 to 40 occupations, our NEPS instrument covers only 13. This is a result of time restrictions. Developing a short position generator for the NEPS that would last no longer than 1.5 minutes, we referred to a version of the instrument that has been developed for the project “Young Immigrants in the German and Israeli Educational System” (for details, cf. Roth, Salikutluk & Kogan 2010; Kalter et al., 2013). Based on cognitive pretests and pilot studies, we adapted the labeling of several occupations and their ordering (for details about the development process and pilot studies, see Hoenig et al., 2016). Furthermore, we refined the ethnic network composition measurement: For each occupational position selected, the respondent is asked to indicate from which country the person occupying that position originates. This allows us to construct measures of both the share of alteri with a migration background and the share of co-ethnics in the respondent’s weak tie network.
The NEPS position generator was employed in several NEPS-studies, both for the studies’ main targets person as well as student’s parents in cohort 2 and 4. Currently, data for the position generator are available in the Scientific Use Files for starting cohort 2, 4, 5 and 6:
• SC2, kindergarten (Parents), wave 3 (2013), CATI
• SC4, students in grade 9 (Parents), wave 1 (2010), CATI
• SC5, first-year academic students (Target), wave 4 (2012), CAWI
• SC6, adults (Target), NEPS wave 1 (2009/2010), CATI/CAPI
• SC6, adults (Target), NEPS wave 5 (2013/2014), CATI/CAPI
The position generator was, to a large extent, measured consistently over these cohorts and waves with slight differences in wording, e.g. due to the different survey modes. Respondents were given a list of professions and were asked whether there is someone in their social circle (e.g. partner, family, relatives, friends, colleagues or other acquaintances) who currently works in this profession. If they answered that such a person exists, they were asked about this person’s country of origin (or the person closest to them, if there was more than one).

Schulz, Horr, & Hoenig
NEPS Survey Paper No. 23, 2017 Page 14
Table 2 describes the instrument as it was typically employed and gives English translations.2
2 Please note that the English translations given in the NEPS Scientific Use Files might differ slightly.

Schulz, Horr, & Hoenig
NEPS Survey Paper No. 23, 2017 Page 15
Table 2: Question texts
Question/instruction - professions
Variable German text English translation (as used below)
Ich werde Ihnen nun einige Berufe
vorlesen. Bitte sagen Sie mir jeweils, ob
Sie eine Person in ihrem persönlichen
Umfeld kennen, die derzeit einen solchen
Beruf in Deutschland ausübt. Mit
persönlichem Umfeld meine ich z.B. Ihren
Partner / Ihre Partnerin, Ihre Familie oder
Verwandte, Ihre Freunde, Arbeitskollegen
oder sonstige Bekannte.
I will now read out a few professions.
Please tell me if there is someone in your
social circle who currently works in this
position. By ‘social circle’ I mean, for
instance, your partner, your family,
relatives, your friends, colleagues or other
acquaintances.
1 – ja
2– nein
-98 – weiß nicht
-97 – Angabe verweigert
1 – yes
2– no
-98 – don’t know
-97 – refused
t32600a Kennen Sie in Ihrem persönlichen Umfeld
eine Krankenschwester oder einen
Krankenpfleger?
Does someone in your social circle work
as a nurse or male nurse?
t32600b Kennen Sie persönlich einen Ingenieur
oder eine Ingenieurin, die ihren Beruf in
Deutschland ausüben?
Do you know someone personally who
works as an engineer in Germany?
t32600c Kennen Sie persönlich eine/n Lager- oder
Transportarbeiter/in?
Do you know someone personally who
works as warehouse or transport worker?
t32600d Kennen Sie persönlich einen Sozialarbeiter
oder eine Sozialarbeiterin?
Do you know someone personally who
works as a social worker?
t32600e Kennen Sie persönlich einen Verkäufer
oder eine Verkäuferin?
Do you know someone personally who
works as a sales clerk?
t32600f Kennen Sie persönlich einen Polizisten
oder eine Polizistin?
Do you know someone personally who
works as a police officer?
t32600g Und kennen Sie persönlich einen Arzt
oder eine Ärztin, die in Deutschland ihren
Do you know someone personally who
works as a doctor/physician?

Schulz, Horr, & Hoenig
NEPS Survey Paper No. 23, 2017 Page 16
Beruf ausüben?
t32600h Kennen Sie persönlich einen
Bankkaufmann oder eine Bankkauffrau?
Do you know someone personally who
works as a banker?
t32600k Kennen Sie persönlich einen
Kraftfahrzeugmechaniker oder eine
Kraftfahrzeugmechanikerin?
Do you know someone personally who
works as a car mechanic?
t32600l Kennen Sie persönlich einen Juristen oder
eine Juristin, wie z.B. einen Anwalt oder
eine Anwältin oder einen Richter oder
eine Richterin?
Do you know someone personally who
works as a legal practitioner (e.g. lawyer
or judge)
t32600m Kennen Sie persönlich einen Optiker oder
eine Optikerin?
Do you know someone personally who
works as an optician?
t32600n Kennen Sie persönlich einen Übersetzer
oder eine Übersetzerin?
Do you know someone personally who
works as a translator?
t32600o Und zuletzt: Kennen Sie persönlich einen
Grund-, Haupt- oder Realschullehrer oder
eine Grund-, Haupt- oder
Realschullehrerin?
And finally, do you know someone
personally who works as teacher at an
elementary school, a Hauptschule or a
Realschule?
Question/instruction follow-up question - country of origin for each profession
Variable German text English translation in the following
Aus welchem Land stammt diese Person? What country does he/she come from?
[Herkunftsland]
-98 – weiß nicht
-97 – Angabe verweigert
[country of origin]
-98 – don’t know
-97 – refused
Schulz, Horr, & Hoenig
NEPS Survey Paper No. 23, 2017 Page 17
4. Empirical Results across the NEPS cohorts
In this section, we describe the data as available as NEPS Scientific Use Files at this point. Due to systematic differences in sample selection and survey modes, differences across cohorts have to be interpreted with care. We therefore limit direct comparisons to parents of cohort 2 and 4 and comparisons within a cohort, where already available.
Respondent’s migration background is defined as being born abroad or having at least one parent or grandparent who was born abroad. Contact’s migration background is defined as given in the question text (see Table 2 above).
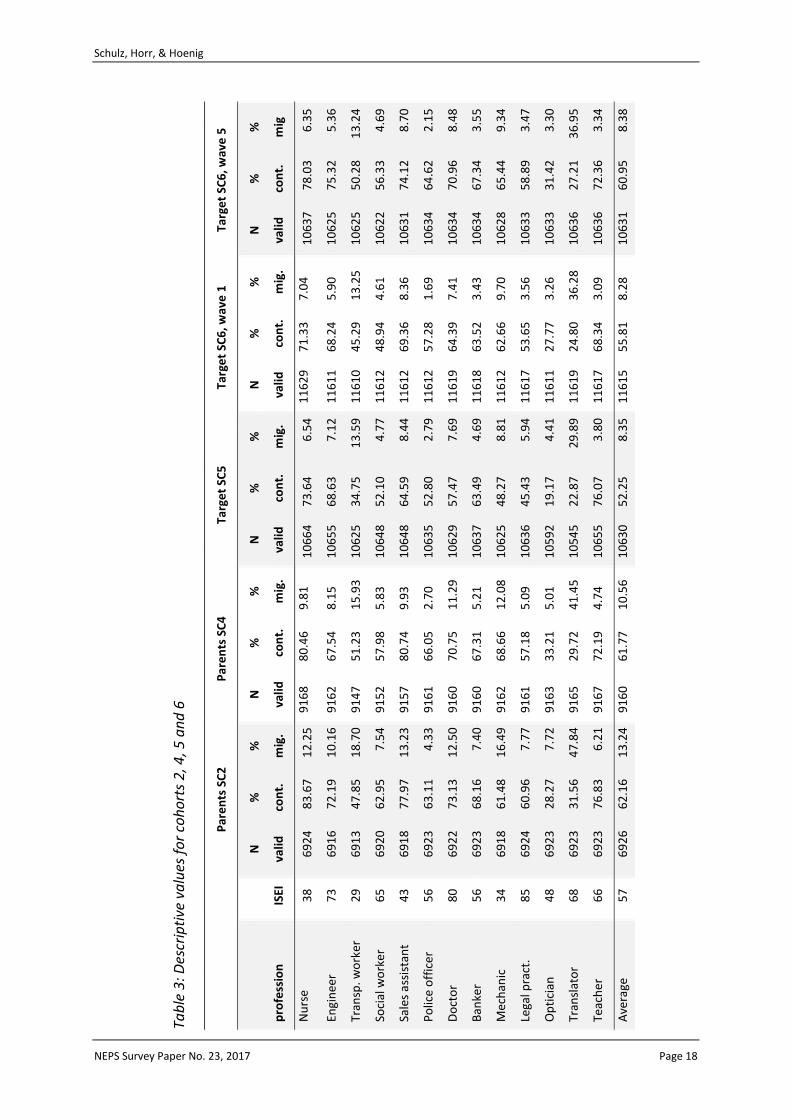
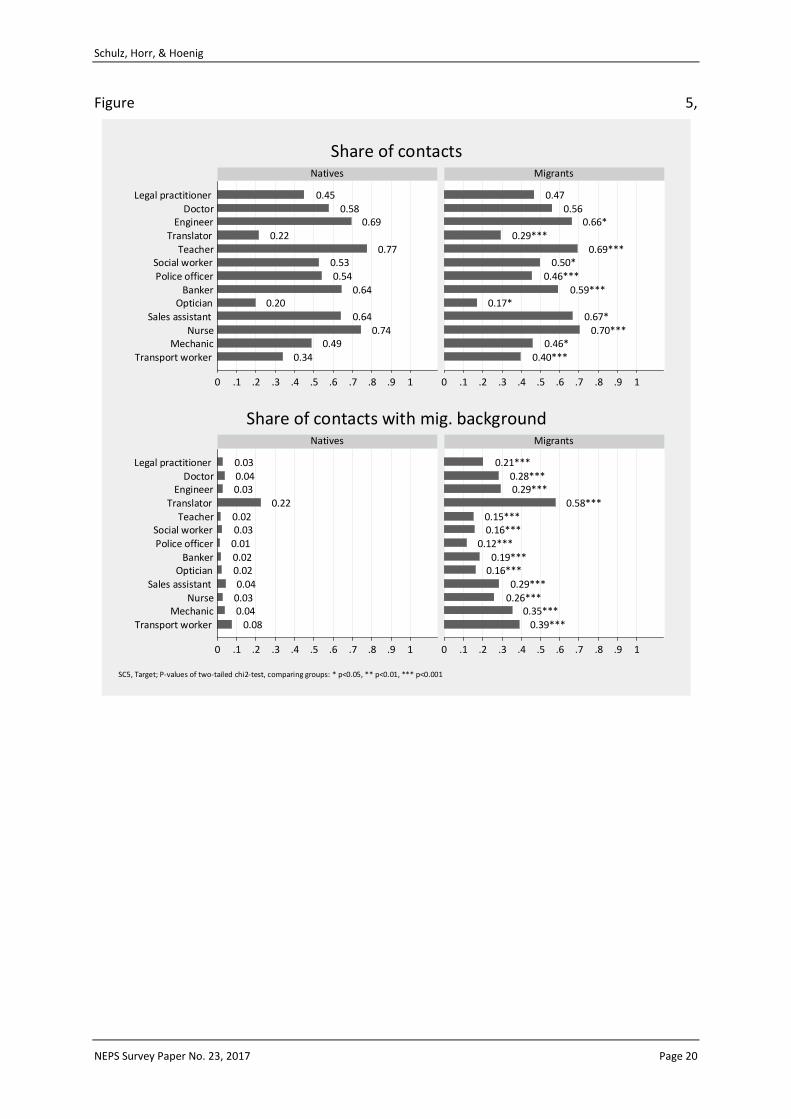
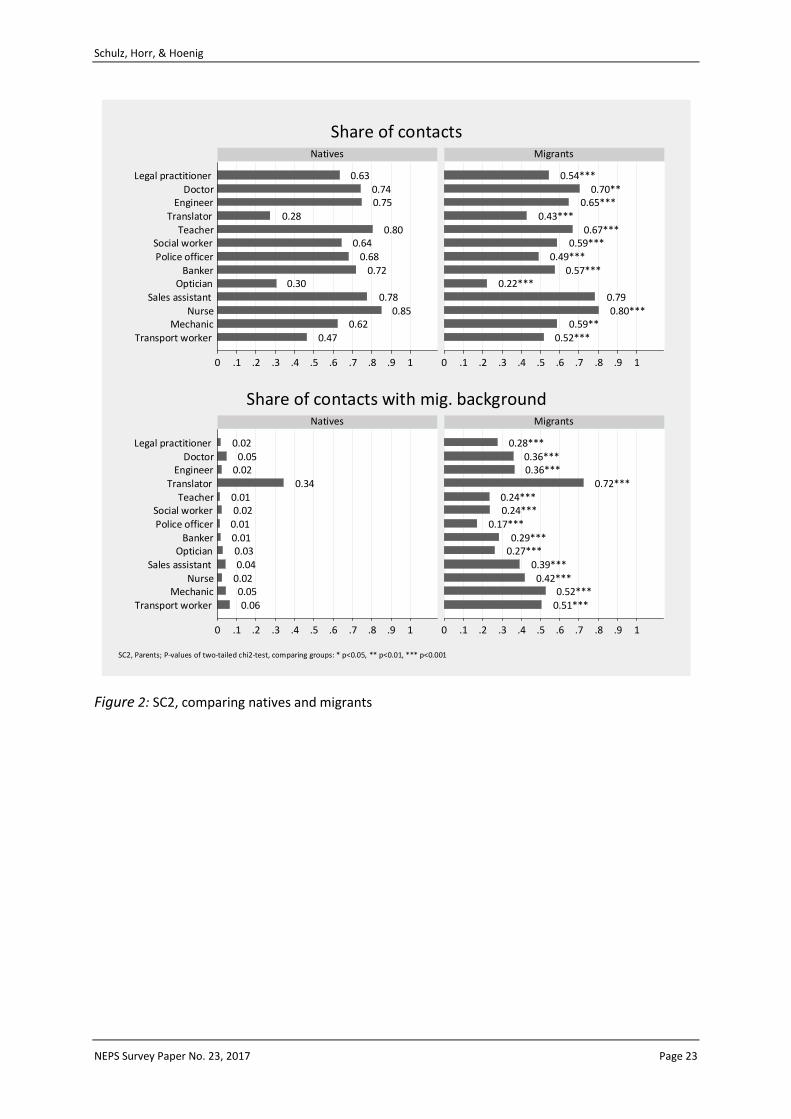
We further describe respondents’ networks using the number of persons indicated, the mean occupational status and the mean share of migrants. For the occupational status, we allocated status values to each of the 13 professions using the International Socio-Economic Index of Occupational Status (ISEI 88). The mean occupational status is calculated as an average over all professions, not only over the contacts an individual respondent has. This results in low mean values as not knowing someone with a certain profession contributes an occupational status value of zero to the calculation. In consequence, the measurement captures both the extensity of a person’s network, as knowing a member of a profession will always increase the indicator, and the network’s status composition, as professions with a higher occupational status lead to a higher increase. Engineer, social worker, doctor, legal practitioner, translator and teacher are positions with an occupational status above the average of 57 points of all professions in the NEPS position generator. Nurse, transport worker, sales assistant, police officer, banker, mechanic and optician have an occupational status below the average of all 13 professions.
As nonresponse within the position generator due to “don’t know”- or “refused”-replies is very low for all items in the available NEPS studies (with an overall average of 0.25% for all contact-items and 0.36% for all ethnic background items and no outliers), we display the number of valid responses for each item but omitted additional analyses.
As a last step, we use the information from a first repeated measurement of the position generator in NEPS waves 1 and 5 in cohort 6 (adults) to examine between- and within-variation.
Table 3 displays case numbers and percentages for both parts of the instrument: how many respondents answered that they personally know a person with that profession and if they do, how many of those have a migration background? Contacts differ strongly for the different professions. We also included the ISEI values assigned to the different occupations to allow replication.
Schulz, Horr, & Hoenig
NEPS Survey Paper No. 23, 2017 Page 18
Tab
le 3
: Des
crip
tive
va
lues
fo
r co
ho
rts
2, 4
, 5 a
nd
6
Par
en
ts S
C2
P
are
nts
SC
4
Targ
et
SC5
Ta
rge
t SC
6, w
ave
1
Targ
et
SC6
, wav
e 5
pro
fess
ion
IS
EI
N
valid
%
con
t.
%
mig
.
N
valid
%
con
t.
%
mig
.
N
valid
%
con
t.
%
mig
.
N
valid
%
con
t.
%
mig
.
N
valid
%
con
t.
%
mig
Nu
rse
3
8
69
24
8
3.6
7
12
.25
9
16
8
80
.46
9
.81
1
06
64
7
3.6
4
6.5
4
11
62
9
71
.33
7
.04
1
06
37
7
8.0
3
6.3
5
Engi
nee
r 7
3
69
16
7
2.1
9
10
.16
9
16
2
67
.54
8
.15
1
06
55
6
8.6
3
7.1
2
11
61
1
68
.24
5
.90
1
06
25
7
5.3
2
5.3
6
Tran
sp. w
ork
er
29
6
91
3
47
.85
1
8.7
0
91
47
5
1.2
3
15
.93
1
06
25
3
4.7
5
13
.59
1
16
10
4
5.2
9
13
.25
1
06
25
5
0.2
8
13
.24
Soci
al w
ork
er
65
6
92
0
62
.95
7
.54
9
15
2
57
.98
5
.83
1
06
48
5
2.1
0
4.7
7
11
61
2
48
.94
4
.61
1
06
22
5
6.3
3
4.6
9
Sale
s as
sist
ant
43
6
91
8
77
.97
1
3.2
3
91
57
8
0.7
4
9.9
3
10
64
8
64
.59
8
.44
1
16
12
6
9.3
6
8.3
6
10
63
1
74
.12
8
.70
Po
lice
off
ice
r 5
6
69
23
6
3.1
1
4.3
3
91
61
6
6.0
5
2.7
0
10
63
5
52
.80
2
.79
1
16
12
5
7.2
8
1.6
9
10
63
4
64
.62
2
.15
Do
cto
r 8
0
69
22
7
3.1
3
12
.50
9
16
0
70
.75
1
1.2
9
10
62
9
57
.47
7
.69
1
16
19
6
4.3
9
7.4
1
10
63
4
70
.96
8
.48
Ban
ker
56
6
92
3
68
.16
7
.40
9
16
0
67
.31
5
.21
1
06
37
6
3.4
9
4.6
9
11
61
8
63
.52
3
.43
1
06
34
6
7.3
4
3.5
5
Mec
han
ic
34
6
91
8
61
.48
1
6.4
9
91
62
6
8.6
6
12
.08
1
06
25
4
8.2
7
8.8
1
11
61
2
62
.66
9
.70
1
06
28
6
5.4
4
9.3
4
Lega
l pra
ct.
85
6
92
4
60
.96
7
.77
9
16
1
57
.18
5
.09
1
06
36
4
5.4
3
5.9
4
11
61
7
53
.65
3
.56
1
06
33
5
8.8
9
3.4
7
Op
tici
an
48
6
92
3
28
.27
7
.72
9
16
3
33
.21
5
.01
1
05
92
1
9.1
7
4.4
1
11
61
1
27
.77
3
.26
1
06
33
3
1.4
2
3.3
0
Tran
slat
or
68
6
92
3
31
.56
4
7.8
4
91
65
2
9.7
2
41
.45
1
05
45
2
2.8
7
29
.89
1
16
19
2
4.8
0
36
.28
1
06
36
2
7.2
1
36
.95
Teac
he
r 6
6
69
23
7
6.8
3
6.2
1
91
67
7
2.1
9
4.7
4
10
65
5
76
.07
3
.80
1
16
17
6
8.3
4
3.0
9
10
63
6
72
.36
3
.34
Ave
rage
5
7
69
26
6
2.1
6
13
.24
9
16
0
61
.77
1
0.5
6
10
63
0
52
.25
8
.35
1
16
15
5
5.8
1
8.2
8
10
63
1
60
.95
8
.38
Schulz, Horr, & Hoenig
NEPS Survey Paper No. 23, 2017 Page 19
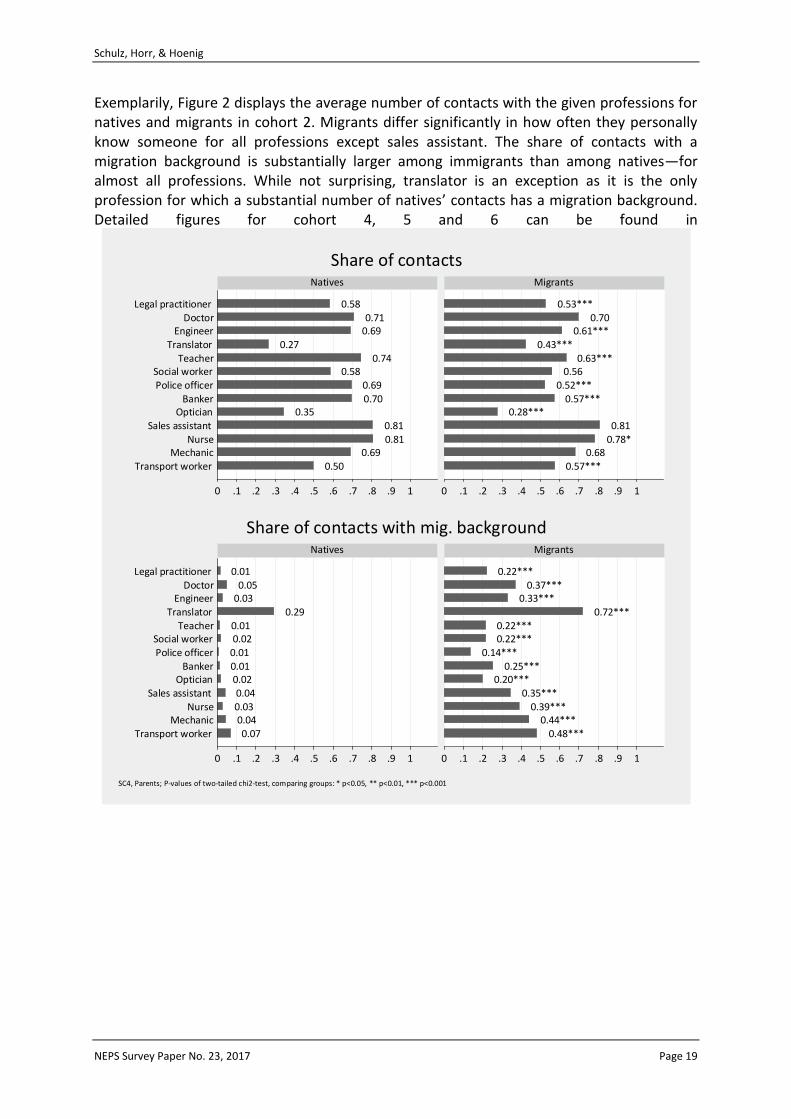
Exemplarily, Figure 2 displays the average number of contacts with the given professions for natives and migrants in cohort 2. Migrants differ significantly in how often they personally know someone for all professions except sales assistant. The share of contacts with a migration background is substantially larger among immigrants than among natives—for almost all professions. While not surprising, translator is an exception as it is the only profession for which a substantial number of natives’ contacts has a migration background. Detailed figures for cohort 4, 5 and 6 can be found in
0.500.69
0.810.81
0.350.700.69
0.580.74
0.270.690.71
0.58
0.57***0.68
0.78*0.81
0.28***0.57***
0.52***0.56
0.63***0.43***
0.61***0.70
0.53***
0 .1 .2 .3 .4 .5 .6 .7 .8 .9 1 0 .1 .2 .3 .4 .5 .6 .7 .8 .9 1
Transport workerMechanic
NurseSales assistant
OpticianBanker
Police officerSocial worker
TeacherTranslator
EngineerDoctor
Legal practitioner
Natives Migrants
Share of contacts
0.070.04
0.030.04
0.020.010.010.020.01
0.290.030.05
0.01
0.48***0.44***
0.39***0.35***
0.20***0.25***
0.14***0.22***0.22***
0.72***0.33***
0.37***0.22***
0 .1 .2 .3 .4 .5 .6 .7 .8 .9 1 0 .1 .2 .3 .4 .5 .6 .7 .8 .9 1
Transport workerMechanic
NurseSales assistant
OpticianBanker
Police officerSocial worker
TeacherTranslator
EngineerDoctor
Legal practitioner
Natives Migrants
Share of contacts with mig. background
SC4, Parents; P-values of two-tailed chi2-test, comparing groups: * p<0.05, ** p<0.01, *** p<0.001
Schulz, Horr, & Hoenig
NEPS Survey Paper No. 23, 2017 Page 20
Figure 5,
0.340.49
0.740.64
0.200.64
0.540.53
0.770.22
0.690.58
0.45
0.40***0.46*
0.70***0.67*
0.17*0.59***
0.46***0.50*
0.69***0.29***
0.66*0.56
0.47
0 .1 .2 .3 .4 .5 .6 .7 .8 .9 1 0 .1 .2 .3 .4 .5 .6 .7 .8 .9 1
Transport workerMechanic
NurseSales assistant
OpticianBanker
Police officerSocial worker
TeacherTranslator
EngineerDoctor
Legal practitioner
Natives Migrants
Share of contacts
0.080.040.030.04
0.020.020.010.030.02
0.220.030.040.03
0.39***0.35***
0.26***0.29***
0.16***0.19***
0.12***0.16***0.15***
0.58***0.29***0.28***
0.21***
0 .1 .2 .3 .4 .5 .6 .7 .8 .9 1 0 .1 .2 .3 .4 .5 .6 .7 .8 .9 1
Transport workerMechanic
NurseSales assistant
OpticianBanker
Police officerSocial worker
TeacherTranslator
EngineerDoctor
Legal practitioner
Natives Migrants
Share of contacts with mig. background
SC5, Target; P-values of two-tailed chi2-test, comparing groups: * p<0.05, ** p<0.01, *** p<0.001
Schulz, Horr, & Hoenig
NEPS Survey Paper No. 23, 2017 Page 21
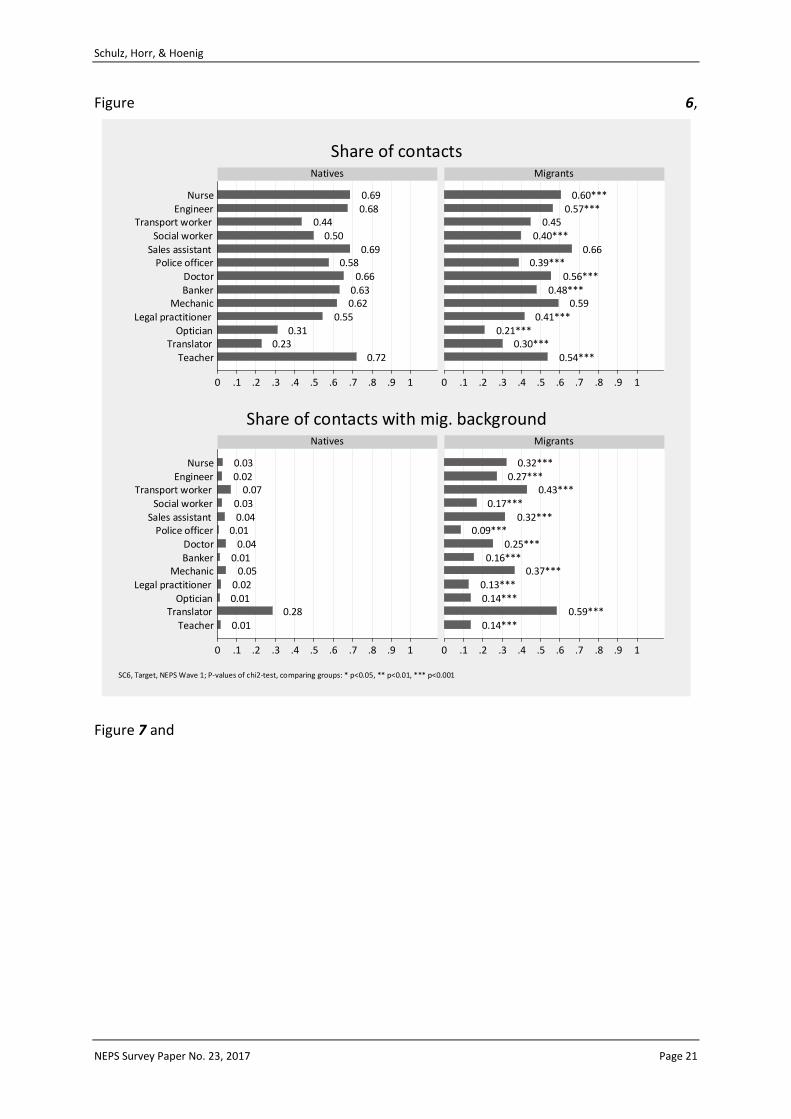
Figure 6,
Figure 7 and
0.720.23
0.310.55
0.620.630.66
0.580.69
0.500.44
0.680.69
0.54***0.30***
0.21***0.41***
0.590.48***
0.56***0.39***
0.660.40***
0.450.57***
0.60***
0 .1 .2 .3 .4 .5 .6 .7 .8 .9 1 0 .1 .2 .3 .4 .5 .6 .7 .8 .9 1
TeacherTranslator
OpticianLegal practitioner
MechanicBankerDoctor
Police officerSales assistant
Social workerTransport worker
EngineerNurse
Natives Migrants
Share of contacts
0.010.28
0.010.02
0.050.01
0.040.01
0.040.03
0.070.020.03
0.14***0.59***
0.14***0.13***
0.37***0.16***
0.25***0.09***
0.32***0.17***
0.43***0.27***
0.32***
0 .1 .2 .3 .4 .5 .6 .7 .8 .9 1 0 .1 .2 .3 .4 .5 .6 .7 .8 .9 1
TeacherTranslator
OpticianLegal practitioner
MechanicBankerDoctor
Police officerSales assistant
Social workerTransport worker
EngineerNurse
Natives Migrants
Share of contacts with mig. background
SC6, Target, NEPS Wave 1; P-values of chi2-test, comparing groups: * p<0.05, ** p<0.01, *** p<0.001
Schulz, Horr, & Hoenig
NEPS Survey Paper No. 23, 2017 Page 22
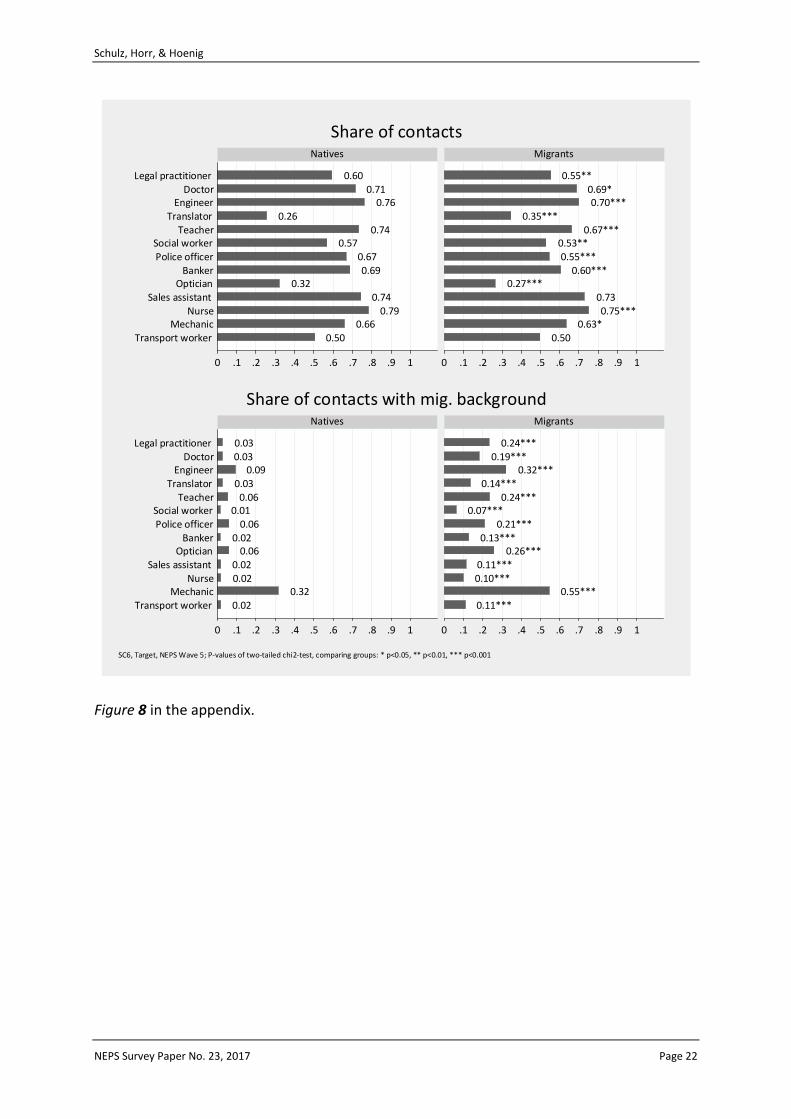
Figure 8 in the appendix.
0.500.66
0.790.74
0.320.69
0.670.57
0.740.26
0.760.71
0.60
0.500.63*
0.75***0.73
0.27***0.60***
0.55***0.53**
0.67***0.35***
0.70***0.69*
0.55**
0 .1 .2 .3 .4 .5 .6 .7 .8 .9 1 0 .1 .2 .3 .4 .5 .6 .7 .8 .9 1
Transport workerMechanic
NurseSales assistant
OpticianBanker
Police officerSocial worker
TeacherTranslator
EngineerDoctor
Legal practitioner
Natives Migrants
Share of contacts
0.020.32
0.020.02
0.060.02
0.060.01
0.060.03
0.090.030.03
0.11***0.55***
0.10***0.11***
0.26***0.13***
0.21***0.07***
0.24***0.14***
0.32***0.19***
0.24***
0 .1 .2 .3 .4 .5 .6 .7 .8 .9 1 0 .1 .2 .3 .4 .5 .6 .7 .8 .9 1
Transport workerMechanic
NurseSales assistant
OpticianBanker
Police officerSocial worker
TeacherTranslator
EngineerDoctor
Legal practitioner
Natives Migrants
Share of contacts with mig. background
SC6, Target, NEPS Wave 5; P-values of two-tailed chi2-test, comparing groups: * p<0.05, ** p<0.01, *** p<0.001
Schulz, Horr, & Hoenig
NEPS Survey Paper No. 23, 2017 Page 23
Figure 2: SC2, comparing natives and migrants
0.470.62
0.850.78
0.300.72
0.680.64
0.800.28
0.750.74
0.63
0.52***0.59**
0.80***0.79
0.22***0.57***
0.49***0.59***
0.67***0.43***
0.65***0.70**
0.54***
0 .1 .2 .3 .4 .5 .6 .7 .8 .9 1 0 .1 .2 .3 .4 .5 .6 .7 .8 .9 1
Transport workerMechanic
NurseSales assistant
OpticianBanker
Police officerSocial worker
TeacherTranslator
EngineerDoctor
Legal practitioner
Natives Migrants
Share of contacts
0.060.05
0.020.040.03
0.010.010.020.01
0.340.020.05
0.02
0.51***0.52***
0.42***0.39***
0.27***0.29***
0.17***0.24***0.24***
0.72***0.36***0.36***
0.28***
0 .1 .2 .3 .4 .5 .6 .7 .8 .9 1 0 .1 .2 .3 .4 .5 .6 .7 .8 .9 1
Transport workerMechanic
NurseSales assistant
OpticianBanker
Police officerSocial worker
TeacherTranslator
EngineerDoctor
Legal practitioner
Natives Migrants
Share of contacts with mig. background
SC2, Parents; P-values of two-tailed chi2-test, comparing groups: * p<0.05, ** p<0.01, *** p<0.001
Schulz, Horr, & Hoenig
NEPS Survey Paper No. 23, 2017 Page 24
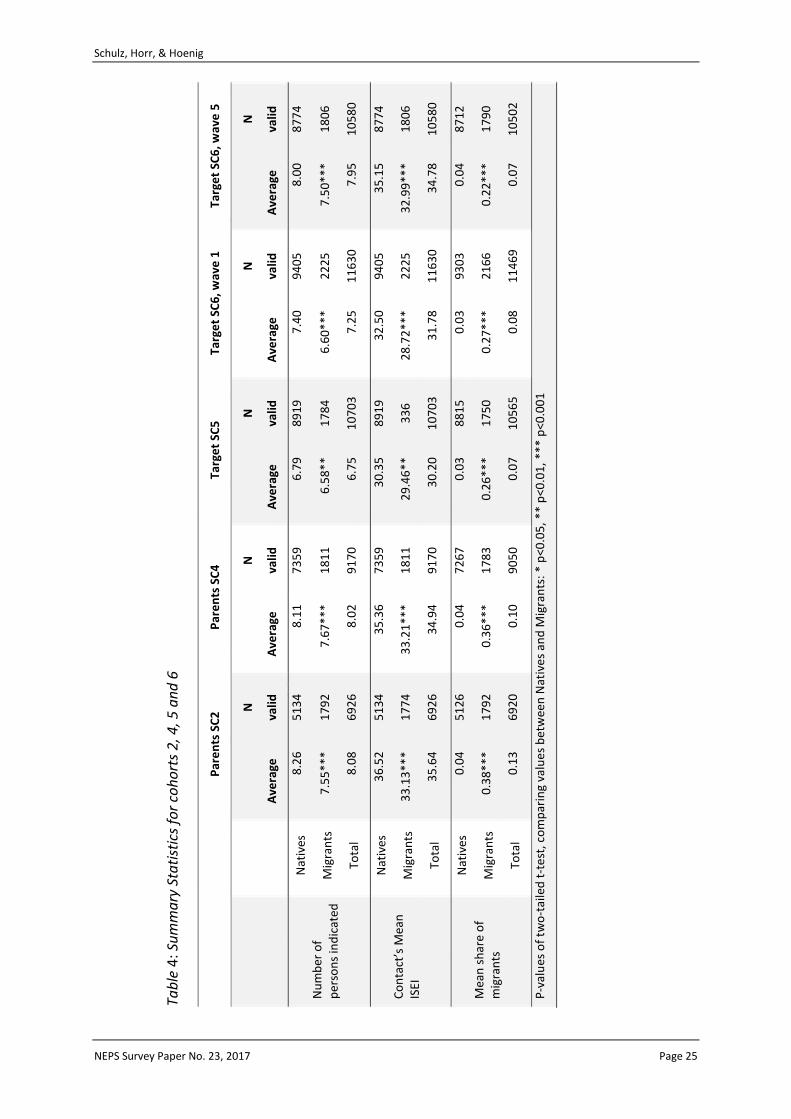
Table 4 displays summary statistics for all cohorts. With a range of 6.58 to 7.67 contacts, migrants have significantly fewer contacts than natives in each cohort (6.79 to 8.26 contacts). Their contacts also have a significantly lower mean occupational prestige with a range of 28.72 to 33.21 points (compared to 30.035 to 36.52 points for natives). Most striking is the difference in the average share of contacts with a migration background. While natives only have a 3-4% share of contacts who are not from Germany among all occupations, numbers for migrants are multiple times higher with range from 22% to 38%. Unsurprisingly, we observe the smallest differences in the mean ISEI and the number of persons indicated for academic students (cohort 5).
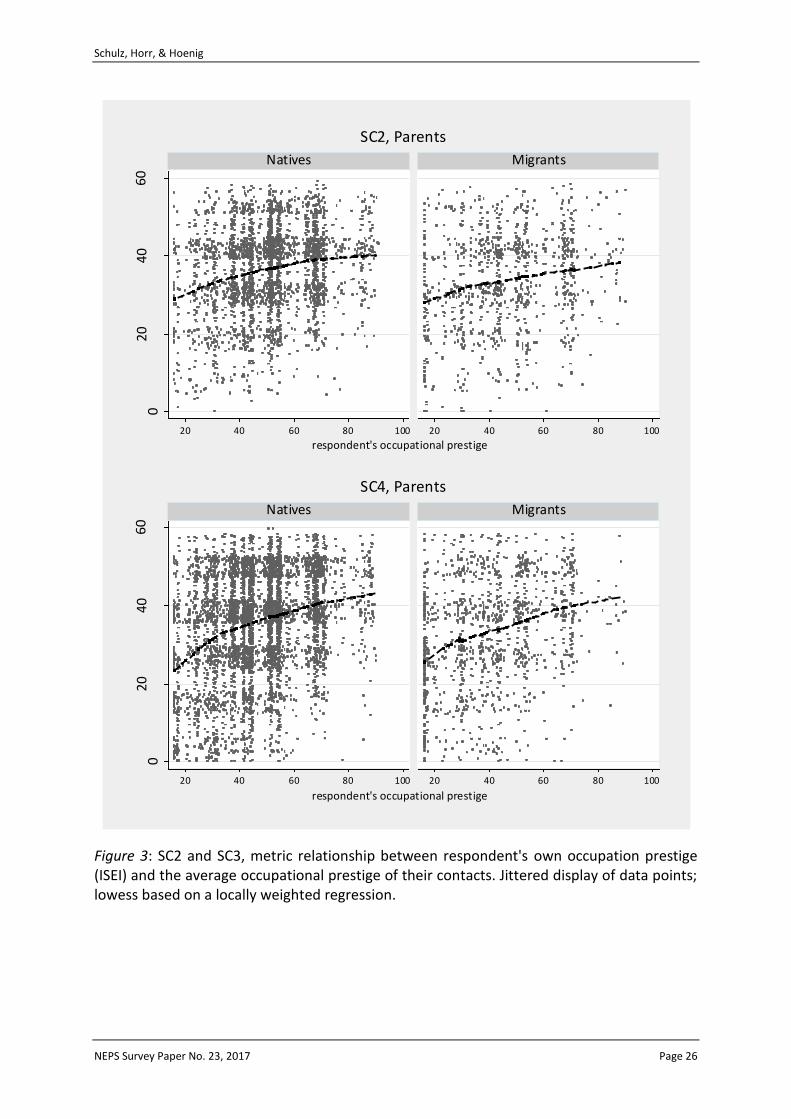
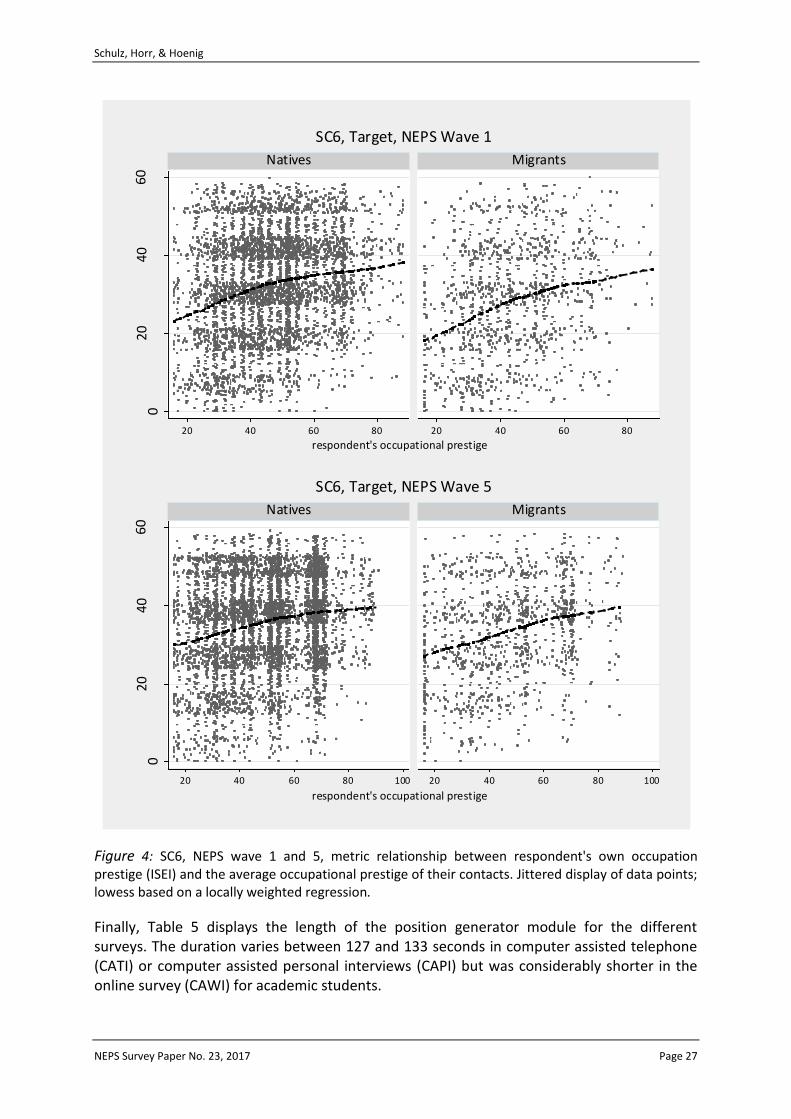
Figure 3 illustrates the relationship between respondent’s own occupational prestige (if they are employed) and their contact’s average occupational prestige for cohorts 2 and 4. Figure 4 displays the corresponding relationship for both waves in cohort 6. As theory suggests, we see a positive relationship, both for Natives and Migrants and over cohorts. As cohort 5 is based on a sample of academic students, showing the relationship between respondent’s own occupational prestige and the average prestige of their networks is less insightful and we therefore omitted a graph for this cohort.
Schulz, Horr, & Hoenig
NEPS Survey Paper No. 23, 2017 Page 25
Tab
le 4
: Su
mm
ary
Sta
tist
ics
for
coh
ort
s 2
, 4, 5
an
d 6
Par
en
ts S
C2
P
are
nts
SC
4
Targ
et
SC5
Ta
rge
t SC
6, w
ave
1
Targ
et
SC6
, wav
e 5
Ave
rage
N
valid
A
vera
ge
N
valid
A
vera
ge
N
valid
A
vera
ge
N
valid
A
vera
ge
N
valid
Nu
mb
er o
f p
erso
ns
ind
icat
ed
Nat
ives
8
.26
5
13
4
8.1
1
73
59
6
.79
8
91
9
7.4
0
94
05
8
.00
8
77
4
Mig
ran
ts
7.5
5*
**
17
92
7
.67
***
1
81
1
6.5
8*
*
17
84
6
.60
***
2
22
5
7.5
0*
**
18
06
Tota
l 8
.08
6
92
6
8.0
2
91
70
6
.75
1
07
03
7
.25
1
16
30
7
.95
1
05
80
Co
nta
ct’s
Mea
n
ISEI
Nat
ives
3
6.5
2
51
34
3
5.3
6
73
59
3
0.3
5
89
19
3
2.5
0
94
05
3
5.1
5
87
74
Mig
ran
ts
33
.13
***
1
77
4
33
.21
***
1
81
1
29
.46
**
33
6
28
.72
***
2
22
5
32
.99
***
1
80
6
Tota
l 3
5.6
4
69
26
3
4.9
4
91
70
3
0.2
0
10
70
3
31
.78
1
16
30
3
4.7
8
10
58
0
Mea
n s
har
e o
f m
igra
nts
Nat
ives
0
.04
5
12
6
0.0
4
72
67
0
.03
8
81
5
0.0
3
93
03
0
.04
8
71
2
Mig
ran
ts
0.3
8*
**
17
92
0
.36
***
1
78
3
0.2
6*
**
17
50
0
.27
***
2
16
6
0.2
2*
**
17
90
Tota
l 0
.13
6
92
0
0.1
0
90
50
0
.07
1
05
65
0
.08
1
14
69
0
.07
1
05
02
P-v
alu
es o
f tw
o-t
aile
d t
-te
st, c
om
par
ing
valu
es
bet
wee
n N
ativ
es
and
Mig
ran
ts:
* p
<0.0
5, *
* p
<0.0
1, *
**
p<0
.00
1
Schulz, Horr, & Hoenig
NEPS Survey Paper No. 23, 2017 Page 26
Figure 3: SC2 and SC3, metric relationship between respondent's own occupation prestige (ISEI) and the average occupational prestige of their contacts. Jittered display of data points; lowess based on a locally weighted regression.
02
04
06
0
20 40 60 80 100 20 40 60 80 100
Natives Migrants
con
tact
s' o
ccu
pat
ion
al p
rest
ige
respondent's occupational prestige
SC2, Parents0
20
40
60
20 40 60 80 100 20 40 60 80 100
Natives Migrants
con
tact
s' o
ccu
pat
ion
al p
rest
ige
respondent's occupational prestige
SC4, Parents
Schulz, Horr, & Hoenig
NEPS Survey Paper No. 23, 2017 Page 27
Figure 4: SC6, NEPS wave 1 and 5, metric relationship between respondent's own occupation prestige (ISEI) and the average occupational prestige of their contacts. Jittered display of data points; lowess based on a locally weighted regression.
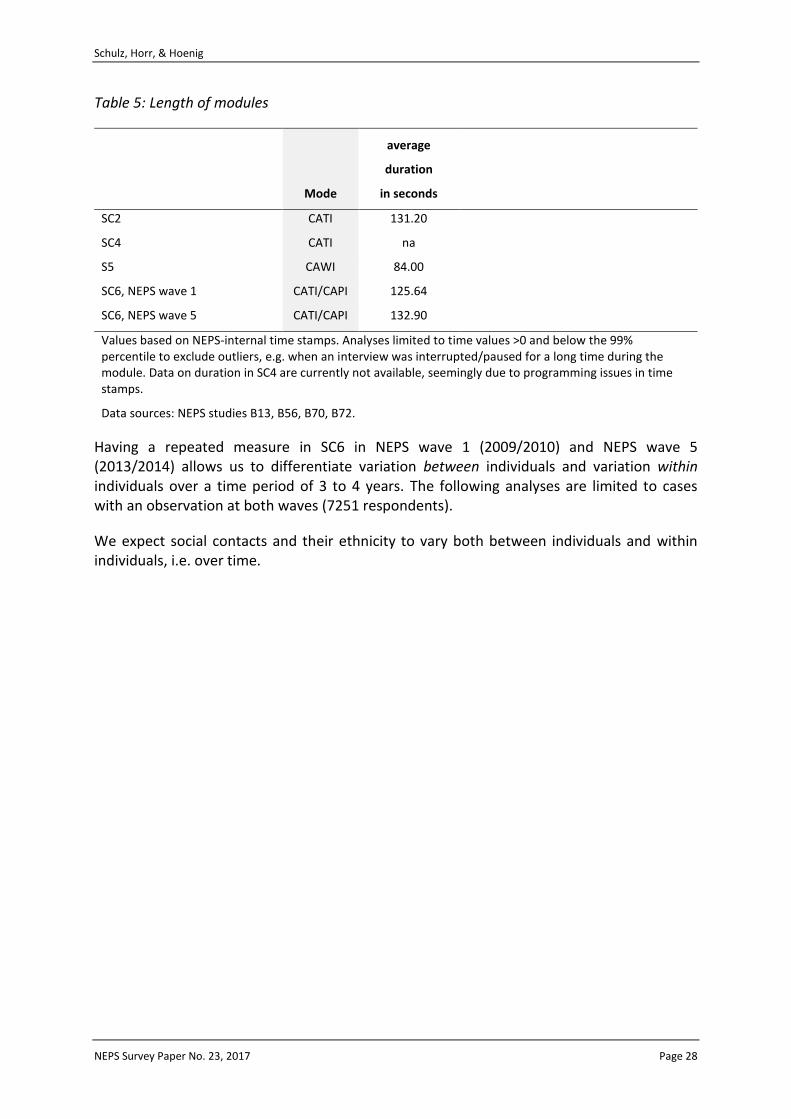
Finally, Table 5 displays the length of the position generator module for the different surveys. The duration varies between 127 and 133 seconds in computer assisted telephone (CATI) or computer assisted personal interviews (CAPI) but was considerably shorter in the online survey (CAWI) for academic students.
02
04
06
0
20 40 60 80 20 40 60 80
Natives Migrants
con
tact
s' o
ccu
pat
ion
al p
rest
ige
respondent's occupational prestige
SC6, Target, NEPS Wave 10
20
40
60
20 40 60 80 100 20 40 60 80 100
Natives Migrants
con
tact
s' o
ccu
pat
ion
al p
rest
ige
respondent's occupational prestige
SC6, Target, NEPS Wave 5
Schulz, Horr, & Hoenig
NEPS Survey Paper No. 23, 2017 Page 28
Table 5: Length of modules
Mode
average
duration
in seconds
SC2 CATI 131.20
SC4 CATI na
S5 CAWI 84.00
SC6, NEPS wave 1 CATI/CAPI 125.64
SC6, NEPS wave 5 CATI/CAPI 132.90
Values based on NEPS-internal time stamps. Analyses limited to time values >0 and below the 99% percentile to exclude outliers, e.g. when an interview was interrupted/paused for a long time during the module. Data on duration in SC4 are currently not available, seemingly due to programming issues in time stamps.
Data sources: NEPS studies B13, B56, B70, B72.
Having a repeated measure in SC6 in NEPS wave 1 (2009/2010) and NEPS wave 5 (2013/2014) allows us to differentiate variation between individuals and variation within individuals over a time period of 3 to 4 years. The following analyses are limited to cases with an observation at both waves (7251 respondents).
We expect social contacts and their ethnicity to vary both between individuals and within individuals, i.e. over time.
Schulz, Horr, & Hoenig
NEPS Survey Paper No. 23, 2017 Page 29
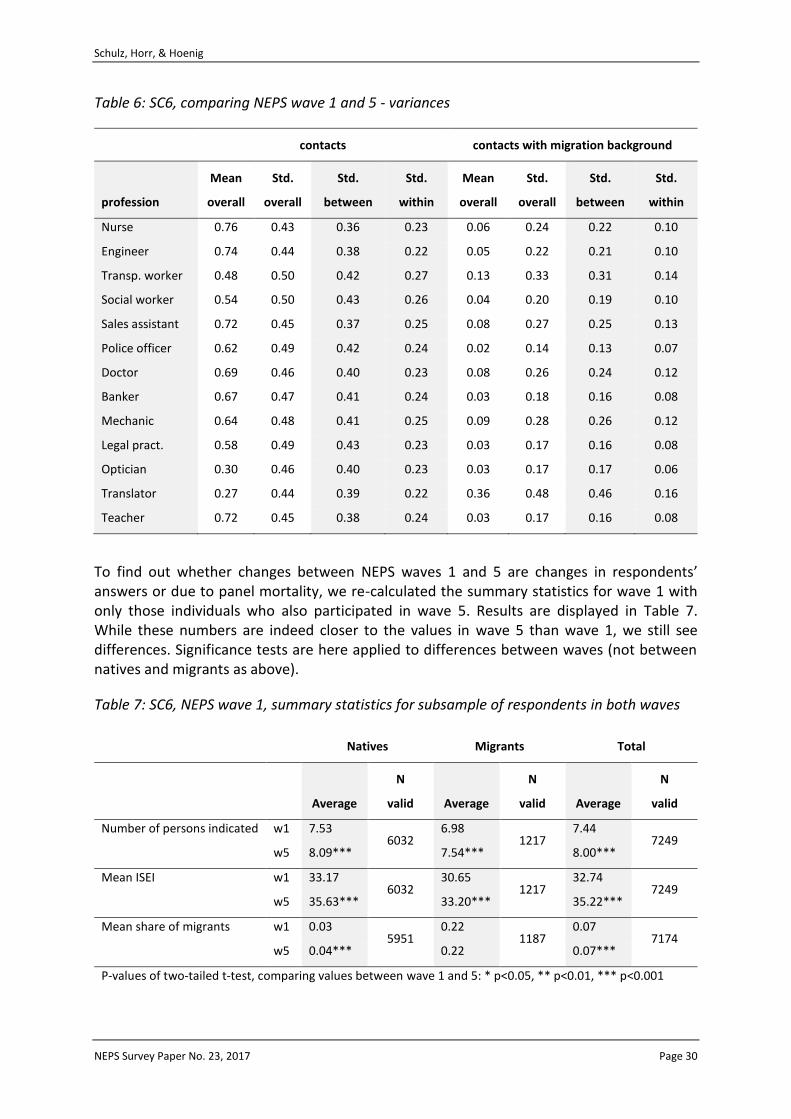
Table 6 displays between-individual and within-individual variation for naming a social contact. Results show that between-variation is higher than within-variation for all professions. This is in line with our expectations, as group differences are an important factor in explaining differences in educational and labor market outcomes. We also observe within-variation for all items, making the instrument suitable for panel analyses to estimate the causal effect of social capital.
Schulz, Horr, & Hoenig
NEPS Survey Paper No. 23, 2017 Page 30
Table 6: SC6, comparing NEPS wave 1 and 5 - variances
contacts contacts with migration background
profession
Mean
overall
Std.
overall
Std.
between
Std.
within
Mean
overall
Std.
overall
Std.
between
Std.
within
Nurse 0.76 0.43 0.36 0.23 0.06 0.24 0.22 0.10
Engineer 0.74 0.44 0.38 0.22 0.05 0.22 0.21 0.10
Transp. worker 0.48 0.50 0.42 0.27 0.13 0.33 0.31 0.14
Social worker 0.54 0.50 0.43 0.26 0.04 0.20 0.19 0.10
Sales assistant 0.72 0.45 0.37 0.25 0.08 0.27 0.25 0.13
Police officer 0.62 0.49 0.42 0.24 0.02 0.14 0.13 0.07
Doctor 0.69 0.46 0.40 0.23 0.08 0.26 0.24 0.12
Banker 0.67 0.47 0.41 0.24 0.03 0.18 0.16 0.08
Mechanic 0.64 0.48 0.41 0.25 0.09 0.28 0.26 0.12
Legal pract. 0.58 0.49 0.43 0.23 0.03 0.17 0.16 0.08
Optician 0.30 0.46 0.40 0.23 0.03 0.17 0.17 0.06
Translator 0.27 0.44 0.39 0.22 0.36 0.48 0.46 0.16
Teacher 0.72 0.45 0.38 0.24 0.03 0.17 0.16 0.08
To find out whether changes between NEPS waves 1 and 5 are changes in respondents’ answers or due to panel mortality, we re-calculated the summary statistics for wave 1 with only those individuals who also participated in wave 5. Results are displayed in Table 7. While these numbers are indeed closer to the values in wave 5 than wave 1, we still see differences. Significance tests are here applied to differences between waves (not between natives and migrants as above).
Table 7: SC6, NEPS wave 1, summary statistics for subsample of respondents in both waves
Natives Migrants Total
Average
N
valid Average
N
valid Average
N
valid
Number of persons indicated w1 7.53 6032
6.98 1217
7.44 7249
w5 8.09*** 7.54*** 8.00***
Mean ISEI w1 33.17 6032
30.65 1217
32.74 7249
w5 35.63*** 33.20*** 35.22***
Mean share of migrants w1 0.03 5951
0.22 1187
0.07 7174
w5 0.04*** 0.22 0.07***
P-values of two-tailed t-test, comparing values between wave 1 and 5: * p<0.05, ** p<0.01, *** p<0.001
Schulz, Horr, & Hoenig
NEPS Survey Paper No. 23, 2017 Page 31
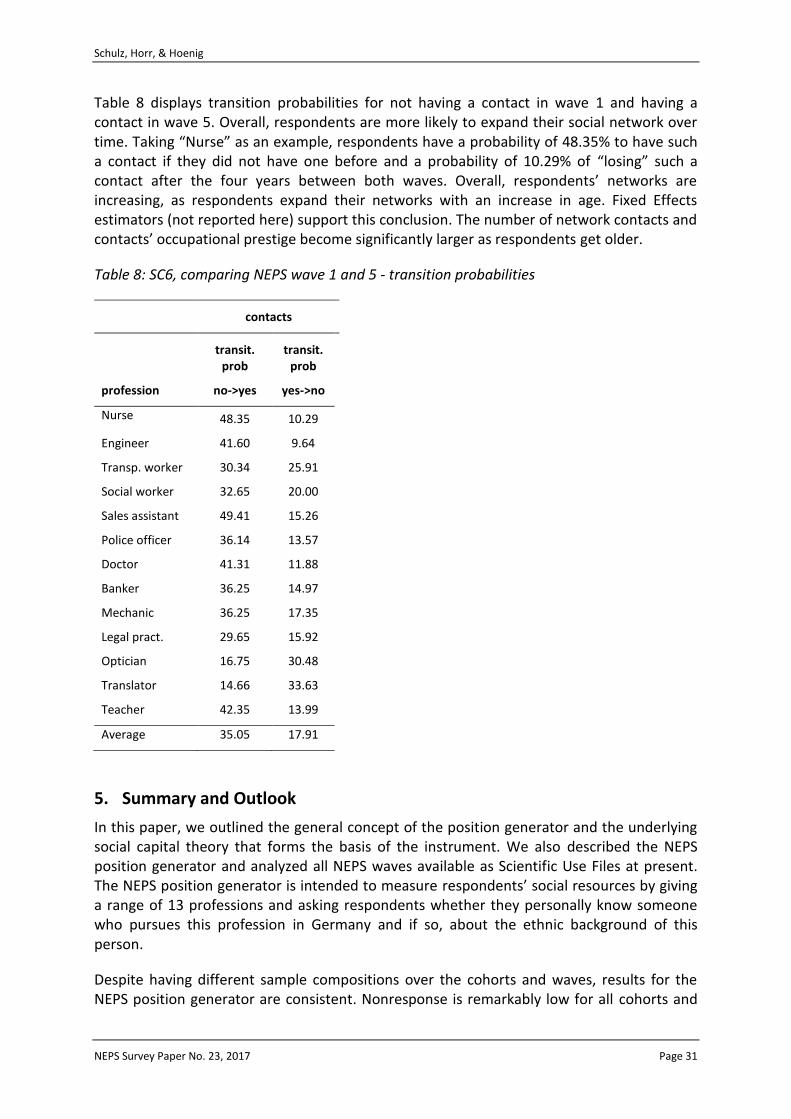
Table 8 displays transition probabilities for not having a contact in wave 1 and having a contact in wave 5. Overall, respondents are more likely to expand their social network over time. Taking “Nurse” as an example, respondents have a probability of 48.35% to have such a contact if they did not have one before and a probability of 10.29% of “losing” such a contact after the four years between both waves. Overall, respondents’ networks are increasing, as respondents expand their networks with an increase in age. Fixed Effects estimators (not reported here) support this conclusion. The number of network contacts and contacts’ occupational prestige become significantly larger as respondents get older.
Table 8: SC6, comparing NEPS wave 1 and 5 - transition probabilities
contacts
profession
transit. prob
no->yes
transit. prob
yes->no
Nurse 48.35 10.29
Engineer 41.60 9.64
Transp. worker 30.34 25.91
Social worker 32.65 20.00
Sales assistant 49.41 15.26
Police officer 36.14 13.57
Doctor 41.31 11.88
Banker 36.25 14.97
Mechanic 36.25 17.35
Legal pract. 29.65 15.92
Optician 16.75 30.48
Translator 14.66 33.63
Teacher 42.35 13.99
Average 35.05 17.91
5. Summary and Outlook
In this paper, we outlined the general concept of the position generator and the underlying social capital theory that forms the basis of the instrument. We also described the NEPS position generator and analyzed all NEPS waves available as Scientific Use Files at present. The NEPS position generator is intended to measure respondents’ social resources by giving a range of 13 professions and asking respondents whether they personally know someone who pursues this profession in Germany and if so, about the ethnic background of this person.
Despite having different sample compositions over the cohorts and waves, results for the NEPS position generator are consistent. Nonresponse is remarkably low for all cohorts and
Schulz, Horr, & Hoenig
NEPS Survey Paper No. 23, 2017 Page 32
we have no reason to assume that respondents have problems understanding or answering the questions. Based on the analyses, we are confident that the position generator is well suited to capture differences in respondents’ social capital resources and to examine inter-group differences. We consistently found meaningful differences between natives and migrants in the number of contacts, their contacts’ mean occupational status and their network’s ethnic composition. We also found a consistent relationship between respondents’ own occupational status and their network’s status composition. Longitudinal analyses showed that respondents’ networks change over time, with a slight increase with age for the adult cohort.
The position generator’s main strength is that it provides a powerful and widely applicable measurement of network composition that is well-grounded in social capital theory. The underlying theoretical assumption is that the resources accessible through a social tie differ systematically according to its position in the socio-economic hierarchy, and that the total volume of an actor’s social capital can be assessed through the three dimensions of heterogeneity, extensity, and upper reachability. The position generator thus provides a way to operationalize these three dimensions in a cost-effective, reliable manner. Furthermore, it is a highly flexible instrument. Depending on the underlying research question, various indices can be constructed from the measurement (cf. Verhaeghe & Li, 2015; Lin et al., 2001; Van der Gaag & Snijders, 2005). While this paper focused mostly on the mean ISEI of the network, it would also be possible to focus on the highest ISEI as a measure of upper reachability, or on the number of known positions to capture extensity. Likewise, although the NEPS position generator has been designed on the basis of ISEI scores, it is possible to use other measures of social status—this choice depends on respective research questions. The inclusion of information on social ties’ migration background further expands the space of possible operationalizations and its value for research on ethnic inequalities and immigrant integration. Thus, the position generator instrument can be customized to fit a wide variety of research questions.
This generalizability comes with two shortcomings. Both of them stem from the fact that the position generator is an indirect measurement of potential access to social resources. Thus, it cannot assess actual resource mobilization, and it does not help specify the proposed mechanisms through which social capital affects educational outcomes. This is why, within the NEPS, the position generator is embedded in a larger social capital module that also includes more direct measures of social capital, such as a prospective and retrospective resource generator and items on reference group effects (cf. Hoenig et al., 2016). These provide more direct insights into specific social capital mechanisms, but lack the position generator’s broad scope and flexibility.
The advantages of the position generator have been widely recognized in the field of labor market research, where it is regularly employed (cf. Lin & Erickson, 2008; Verhaeghe & Li, 2015). In the context of education, however, studies that use position generators are scarce. Thus, the NEPS data offer intriguing new research possibilities for education researchers—we hope that this survey paper will help NEPS users to utilize them.
Schulz, Horr, & Hoenig
NEPS Survey Paper No. 23, 2017 Page 33
References
Adam, F. & Rončević, B. (2003). Social capital: Recent debates and research trends. Social
Science Information, 42, 155-183. doi: 10.1177/0539018403042002001
Agirdag, Orhan; van Houtte, Mieke; van Avermaet, Piet (2012): Why does the ethnic and
socio-economic composition of schools influence math achievement? The role of
sense of futility and futility culture. European Sociological Review 28 (3), 366–378.
Bourdieu, P. (1986). The forms of capital. In J. Richardson (Ed.), Handbook of Theory and
Research for the Sociology of Education (p. 241-258). New York: Greenwood.
Bourdieu, P. & Wacquant, L. J. D. (1992). An invitation to reflexive sociology. Chicago:
University Of Chicago Press.
Brandt, M. (2006). Soziale Kontakte als Weg aus der Erwerbslosigkeit. Kölner Zeitschrift für
Soziologie und Sozialpsychologie, 58, 468-488. doi: 10.1007/s11575-006-0106-6
Burt, R. S. (1984). Network items and the General Social Survey. Social Networks, 6, 293-339.
Burt, R. S. (1992). Structural holes: The social structure of competition. Cambridge: Harvard
University Press.
Burt, R. S. (2001). Structural holes versus network closure as social capital. In N. Lin, K. S.
Cook & R. S. Burt (Eds.), Social capital: Theory and research, (p. 31-55). New York:
Aldine de Gruyter.
Castiglione, D., van Deth, J. W. & Wolleb, G. (2008). Social capital’s fortune: An introduction.
In D. Castiglione, J. W. van Deth & G. Wolleb (Eds.), The handbook of social capital (S.
1-10). New York: Oxford University Press.
Chua, V.; Madej, J.; Wellman, B. (2011). Personal commuities: The world according to me. In:
John Scott und Peter J. Carrington (Eds.): The SAGE Handbook of Social Network
Analysis. London: Sage Publications, 101–115.
Coleman, J. S. (1988). Social capital in the creation of human capital. American Journal of
Sociology, 94, 95-120. doi:10.1086/228943
Coleman, J. S. (1990). Foundations of social theory. Cambridge, Mass: Belknap Press of
Harvard University Press.
Schulz, Horr, & Hoenig
NEPS Survey Paper No. 23, 2017 Page 34
Dufur, M. J., Parcel, T. L. & Troutman, K. P. (2013). Does capital at home matter more than
capital at school? Social capital effects on academic achievement. Research in Social
Stratification and Mobility, 31, 1-21. doi:10.1016/j.rssm.2012.08.002
Dustmann, C., Glitz, A., Schönberg, U., Brücker, H. (2015). Referral-based job search
networks. Review of Economic Studies 83(2), pp.514-546. DOI:
10.1093/restud/rdv045
Erikson, R. & Jonsson, J. O. (1996). Explaining class inequality in education: The Swedish case.
In R. Erikson und J. O. Jonsson (Eds.), Can education be equalized? The Swedish case
in comparative perspective (p. 1-63). Oxford: Westview Press.
Esser, H. (2008). The two meanings of social capital. In D. Castiglione, J. W. van Deth & G.
Wolleb (Eds.), The handbook of social capital (p. 22-49). New York: Oxford University
Press.
Ferlander, S. (2007): The Importance of Different Forms of Social Capital for Health. Acta
Sociologica 50 (2), 115–128. DOI: 10.1177/0001699307077654.
Field, J. (2008). Social capital. London: Routledge.
Fischer, C. (1982). To dwell among friends: Personal networks in town and city. Chicago:
University of Chicago Press.
Flap, Henk (1999): Creation and Returns of Social Capital: A New Research Program. In:
Tocqueville Review 20 (1), 5–26.
Ganzeboom, H. B., de Graaf, P. M. & Treiman, D. J. (1992). A standard international socio-
economic index of occupational status. Social Science Research, 21, 1-56.
Granovetter, M. (1973). The strength of weak ties. The American Journal of Sociology, 78,
1360-1380.
Häuberer, Julia (2011): Social Capital Theory: Towards a Methodological Foundation.
Frankfurt/M.: Springer.
Heizmann, Boris; Böhnke, Petra (2016): Migrant poverty and social capital: The impact of
intra- and interethnic contacts. Research in Social Stratification and Mobility 46
(2016), 73-85. http://dx.doi.org/10.1016/j.rssm.2016.08.006
Schulz, Horr, & Hoenig
NEPS Survey Paper No. 23, 2017 Page 35
Hlebec, Valentina; Kogovšek, Tina (2013): Different approaches to measure ego-centered
social support networks: a meta-analysis. Quality & Quantity 47 (6), 3435–3455. DOI:
10.1007/s11135-012-9731-2.
Hoenig, K., Pollak, R., Schulz, B. & Stocké, V. (2016). Social capital, participation in adult
education, and labor market success: Constructing a new instrument. In H.-P.
Blossfeld, J. von Maurice, M. Bayer & J. Skopek (Eds.), Methodological issues of
longitudinal surveys: The example of the National Educational Panel Study (p. 291-
312). Wiesbaden: Springer Fachmedien Wiesbaden. doi:10.1007/978-3-658-11994-
2_17
Kalter, F., Kogan, I., Kristen, C., Levin-Epstein, N., Shavit, Y. et.al. (2013): Immigrant children
and youths in the German and Israeli educational systems (first transition). GESIS
Data Archive, Cologne. ZA5084 Data file Version 1.0.0, doi:10.4232/1.11701
Koopmans, Ruud (2016) Does assimilation work? Sociocultural determinants of labor market
participation of European Muslims, Journal of Ethnic and Migration Studies, 42(2),
197-216, DOI: 10.1080/1369183X.2015.1082903
Kriesi, H. et al. (2007). Sozialkapital. Kölner Zeitschrift für Soziologie und Sozialpsychologie,
Sonderheft 47, 23-46.
Kristen, C., Edele, A., Kalter, F., Kogan, I., Schulz, B., Stanat, P. & Will, G. (2011). The
education of migrants and their children across the life course. Zeitschrift für
Erziehungswissenschaft, 14, 121-137. doi: 10.1007/s11618-011-0194-3
Krug, G., & Rebien, M. (2012). Network-based job search: An analysis of monetary and non-
monetary labor market outcomes for the low-status unemployed. Zeitschrift für
Soziologie, 41, 316-333.
Lin, N. (1982). Social resources and instrumental action. In P. V. Marsden & N. Lin (Eds.),
Social structure and network analysis (p. 131-145). Beverly Hills, CA: Sage
Publications.
Lin, N. (1999). Social networks and status attainment. Annual Review of Sociology, 25, 467-
487.
Schulz, Horr, & Hoenig
NEPS Survey Paper No. 23, 2017 Page 36
Lin, N. (2001). Social capital: A theory of social structure and action. Cambridge: Cambridge
University Press.
Lin, N. & Dumin, M. (1986). Access to occupations through social ties. Social Networks, 8,
365-385.
Lin, N. & Erickson, B. H. (2008). Theory, measurement, and the research enterprise on social
capital. In N. Lin & B. H. Erickson (Eds.), Social capital: An international research
program (p. 1-24). Oxford: Oxford University Press.
Lin, N., Fu, Y. C. & Hsung, R. M. (2001). The position generator: Measurement techniques for
investigations of social capital. In N. Lin, K. Cook, & R. S. Burt (Eds.), Social capital:
Theory and research (p. 57-81). New York: Aldine de Gruyter.
Loury, G. (1977). A dynamic theory of racial income differences. In P. A. Wallace & A.
LeMond (Eds.), Women, minorities, and employment discrimination (p. 86-153).
Lexington: D.C. Heath.
Lubbers, Miranda J.; Molina, José Luis; Lerner, Jürgen; Brandes, Ulrik; Ávila, Javier; McCarty,
Christopher (2010): Longitudinal analysis of personal networks. The case of
Argentinean migrants in Spain. In: Social networks 32 (1), S. 91–104.
Lüdicke, Jörg; Diewald, Martin (2007): Soziale Netzwerke und soziale Ungleichheit: VS Verlag
für Sozialwissenschaften.
Marsden, P. V. (1990). Network data and measurement. Annual Review of Sociology, 16,
435-463.
Moerbeek, H. & Flap, H. (2008). Social resources and their effect on occupational attainment
through the life course. In N. Lin & B. H. Erickson (Eds.), Social capital: An
international research program (p. 133-156). Oxford: Oxford University Press.
Morgan, S. L. & Todd, J. L. (2009). Intergenerational closure and academic achievement in
high school: A new evaluation of Coleman’s conjecture. Sociology of Education, 82,
267-286. doi:10.1177/003804070908200304
Mouw, T. (2006). Estimating the causal effects of social capital: A review of recent research.
Annual Review of Sociology, 32, 79-102. doi:10.1146/annurev.soc.32.061604.123150
Schulz, Horr, & Hoenig
NEPS Survey Paper No. 23, 2017 Page 37
Portes, A. & Fernandez-Kelly, P. (2008). Exceptional outcomes: Achievement in education
and employment among children of immigrants. The Annals of the American
Academy of Political and Social Science, 620, 312-324.
Portes, Alejandro; Rumbaut, Rubén G. (2001): Legacies: The Story of the Immigrant Second
Generation. Berkeley, CA: University of California Press.
Portes, A. & McLeod, D. (1999). Educating the second generation: Determinants of academic
achievement among children of immigrants in the United States. Journal of Ethnic
and Migration Studies, 25, 373-396.
Putnam, R. D. (1993). Making democracy work. Civic traditions in modern Italy. Princeton,
N.J.: Princeton University Press.
Putnam, R. D. (1995). Bowling alone: America's declining social capital. Journal of
Democracy, 6, 65-78.
Putnam, R. D. (2000). Bowling alone: The collapse and revival of American community. New
York: Simon and Schuster.
Roth, T., Salikutluk, Z. & Kogan, I. (2010). Auf die „richtigen“ Kontakte kommt es an! Soziale
Ressourcen und die Bildungsaspirationen der Mütter von Haupt-, Real- und
Gesamtschülern in Deutschland. In: B. Becker & D. Reimer (Eds.), Vom Kindergarten
bis zur Hochschule. Die Generierung von ethnischen und sozialen Disparitäten in der
Bildungsbiographie (p. 179-212). Wiesbaden: VS Verlag für Sozialwissenschaften.
Sewell, W. H., Haller, A. O. & Ohlendorf, G. W. (1970). The educational and early
occupational status attainment process: Replication and revision. American
Sociological Review, 35, 1014-1027. doi:10.2307/2093379
Shah, Bindi; Dwyer, Claire; Modood, Tariq (2010): Explaining Educational Achievement and
Career Aspirations among Young British Pakistanis: Mobilizing ‚Ethnic Capital‘?
Sociology 44 (6), 1109–1127.
Singer, E. (1981). Reference groups and social evaluations. In M. Rosenberg & R. H. Turner
(Eds.), Sociological perspectives (p. 66-93). New York: Basic Books.
Schulz, Horr, & Hoenig
NEPS Survey Paper No. 23, 2017 Page 38
Stocké, V., Blossfeld, H.-P., Hoenig, K. & Sixt, M. (2011). Social inequality and educational
decisions in the life course. Zeitschrift für Erziehungswissenschaft, Sonderheft 14,
103-119. doi:10.1007/s11618-011-0193-4
Thorlindsson, T., Bjarnason, T. & Sigfusdottir, I. D. (2007). Individual and community
processes of social closure: A study of adolescent academic achievement and alcohol
use. Acta Sociologica, 50, 161-178.
Van der Gaag, M., Snijders, T. A. B. & Flap, H. (2008). Position generator measures and their
relationship to other social capital measures. In N. Lin & B. H. Erickson (Eds.), Social
capital: An international research program (p. 27-48). Oxford: Oxford University
Press.
Van Der Gaag, Martin; Webber, Martin (2008): Measurement of individual social capital.
Questions, instruments, and measures. In: Ichiro Kawachi, S. V. Subramanian und
Daniel Kim (Eds.): Social Capital and Health (p. 29–50). New York: Springer.
Van Deth, Jan W. (2003): Measuring social capital: Orthodoxies and continuing
controversies. In: Journal of Research Methodology 6, 79–92.
Verhaeghe, P. P. & Li, Y. (2015). The position generator approach to social capital research:
Measurements and results. In Y. Li (Ed.), Handbook of research methods and
applications in social capital (p. 166-186). Cheltenham (UK), Northhampton (MA):
Edward Elgar Publishing.
Weiss, F. & Klein, M. (2011). Soziale Netzwerke und Jobfindung von Hochschulabsolventen:
Die Bedeutung des Netzwerktyps für monetäre Arbeitsmarkterträge und
Ausbildungsadäquatheit. Zeitschrift für Soziologie, 40, 228-245.
Yakubovich, V. (2005). Weak ties, information, and influence: How workers find jobs in a
local Russian labor market. American Sociological Review, 70, 408-421.
doi:10.1177/000312240507000303
Zhou, Min (2009): How Neighbourhoods Matter for Immigrant Children: the Formation of
Educational Resources in Chinatown, Koreatown and Pico Union, Los Angeles. Journal
of Ethnic and Migration Studies 35 (7), 1153–1179.

Schulz, Horr, & Hoenig
NEPS Survey Paper No. 23, 2017 Page 39
Zhou, Min; Bankston, Carl L. (1994): Social capital and the adaptation of the second
generation: The case of Vietnamese youth in New Orleans. International migration
review 28 (4), 821–845.
Zhou, Min; Xiong, Yang Sao (2005): The multifaceted American experiences of the children of
Asian immigrants: Lessons for segmented assimilation. Ethnic and Racial Studies 28
(6), 1119–1152.
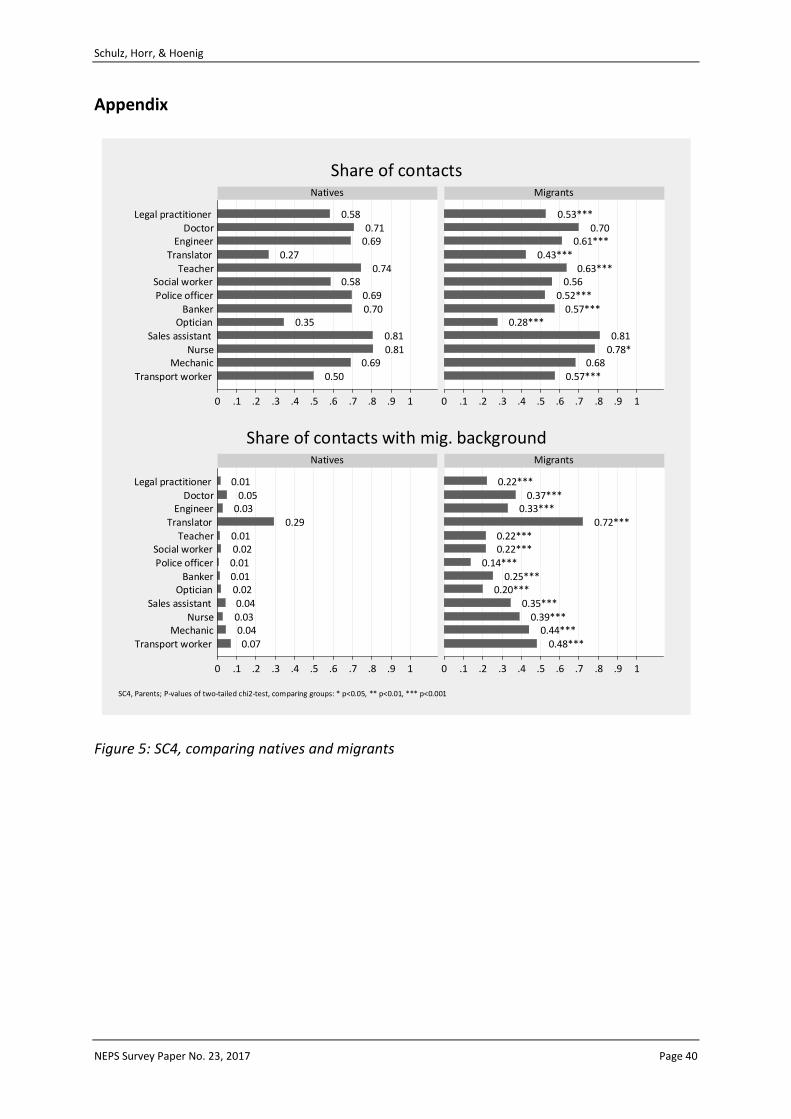
Schulz, Horr, & Hoenig
NEPS Survey Paper No. 23, 2017 Page 40
Appendix
Figure 5: SC4, comparing natives and migrants
0.500.69
0.810.81
0.350.700.69
0.580.74
0.270.690.71
0.58
0.57***0.68
0.78*0.81
0.28***0.57***
0.52***0.56
0.63***0.43***
0.61***0.70
0.53***
0 .1 .2 .3 .4 .5 .6 .7 .8 .9 1 0 .1 .2 .3 .4 .5 .6 .7 .8 .9 1
Transport workerMechanic
NurseSales assistant
OpticianBanker
Police officerSocial worker
TeacherTranslator
EngineerDoctor
Legal practitioner
Natives Migrants
Share of contacts
0.070.04
0.030.04
0.020.010.010.020.01
0.290.030.05
0.01
0.48***0.44***
0.39***0.35***
0.20***0.25***
0.14***0.22***0.22***
0.72***0.33***
0.37***0.22***
0 .1 .2 .3 .4 .5 .6 .7 .8 .9 1 0 .1 .2 .3 .4 .5 .6 .7 .8 .9 1
Transport workerMechanic
NurseSales assistant
OpticianBanker
Police officerSocial worker
TeacherTranslator
EngineerDoctor
Legal practitioner
Natives Migrants
Share of contacts with mig. background
SC4, Parents; P-values of two-tailed chi2-test, comparing groups: * p<0.05, ** p<0.01, *** p<0.001
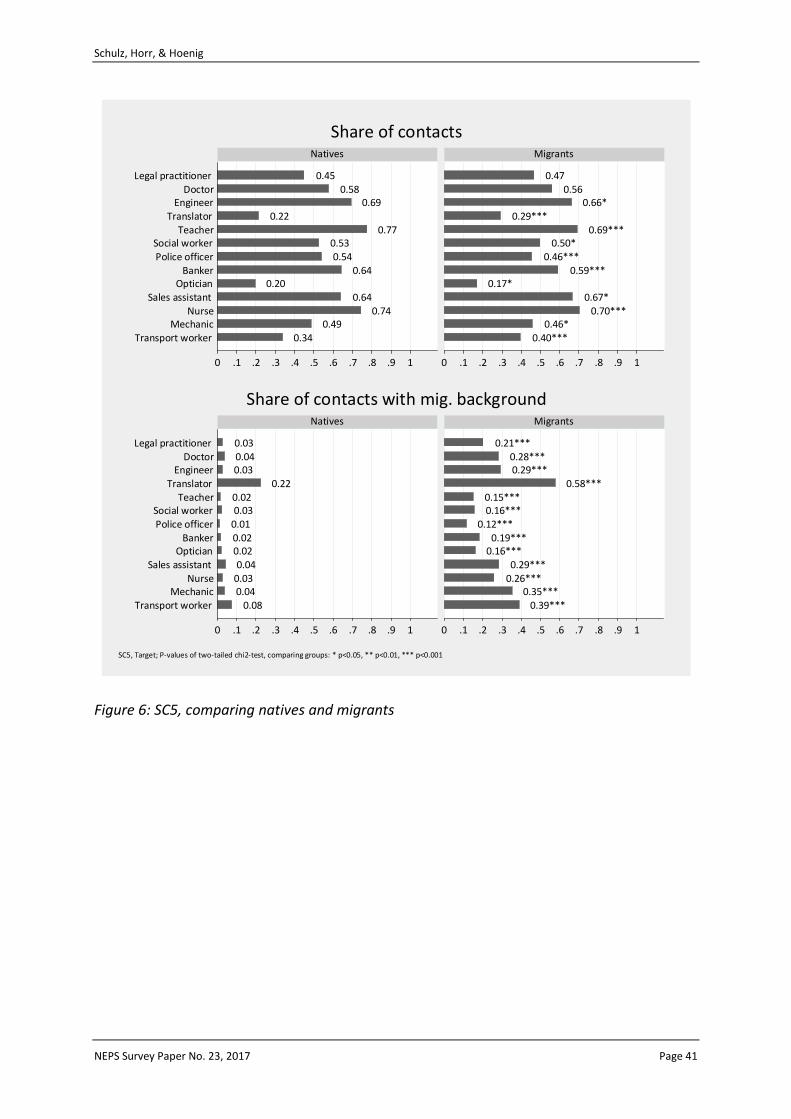
Schulz, Horr, & Hoenig
NEPS Survey Paper No. 23, 2017 Page 41
Figure 6: SC5, comparing natives and migrants
0.340.49
0.740.64
0.200.64
0.540.53
0.770.22
0.690.58
0.45
0.40***0.46*
0.70***0.67*
0.17*0.59***
0.46***0.50*
0.69***0.29***
0.66*0.56
0.47
0 .1 .2 .3 .4 .5 .6 .7 .8 .9 1 0 .1 .2 .3 .4 .5 .6 .7 .8 .9 1
Transport workerMechanic
NurseSales assistant
OpticianBanker
Police officerSocial worker
TeacherTranslator
EngineerDoctor
Legal practitioner
Natives Migrants
Share of contacts
0.080.040.030.04
0.020.020.010.030.02
0.220.030.040.03
0.39***0.35***
0.26***0.29***
0.16***0.19***
0.12***0.16***0.15***
0.58***0.29***0.28***
0.21***
0 .1 .2 .3 .4 .5 .6 .7 .8 .9 1 0 .1 .2 .3 .4 .5 .6 .7 .8 .9 1
Transport workerMechanic
NurseSales assistant
OpticianBanker
Police officerSocial worker
TeacherTranslator
EngineerDoctor
Legal practitioner
Natives Migrants
Share of contacts with mig. background
SC5, Target; P-values of two-tailed chi2-test, comparing groups: * p<0.05, ** p<0.01, *** p<0.001
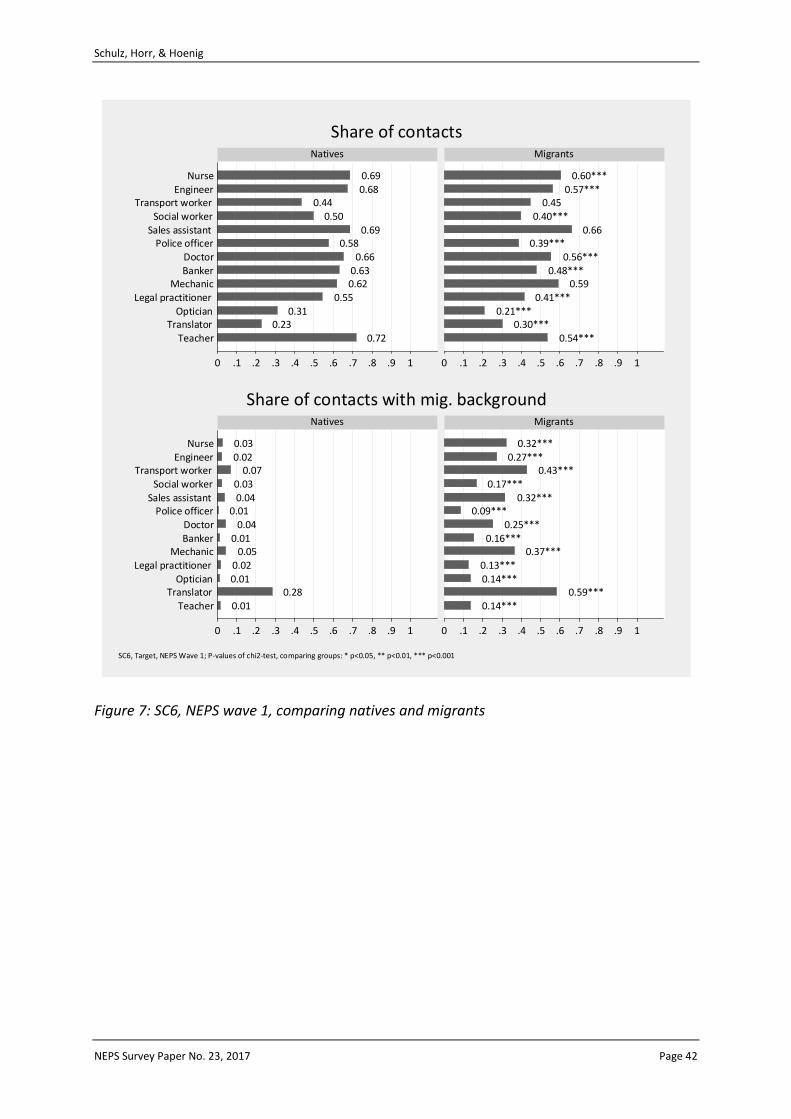
Schulz, Horr, & Hoenig
NEPS Survey Paper No. 23, 2017 Page 42
Figure 7: SC6, NEPS wave 1, comparing natives and migrants
0.720.23
0.310.55
0.620.630.66
0.580.69
0.500.44
0.680.69
0.54***0.30***
0.21***0.41***
0.590.48***
0.56***0.39***
0.660.40***
0.450.57***
0.60***
0 .1 .2 .3 .4 .5 .6 .7 .8 .9 1 0 .1 .2 .3 .4 .5 .6 .7 .8 .9 1
TeacherTranslator
OpticianLegal practitioner
MechanicBankerDoctor
Police officerSales assistant
Social workerTransport worker
EngineerNurse
Natives Migrants
Share of contacts
0.010.28
0.010.02
0.050.01
0.040.01
0.040.03
0.070.020.03
0.14***0.59***
0.14***0.13***
0.37***0.16***
0.25***0.09***
0.32***0.17***
0.43***0.27***
0.32***
0 .1 .2 .3 .4 .5 .6 .7 .8 .9 1 0 .1 .2 .3 .4 .5 .6 .7 .8 .9 1
TeacherTranslator
OpticianLegal practitioner
MechanicBankerDoctor
Police officerSales assistant
Social workerTransport worker
EngineerNurse
Natives Migrants
Share of contacts with mig. background
SC6, Target, NEPS Wave 1; P-values of chi2-test, comparing groups: * p<0.05, ** p<0.01, *** p<0.001

Schulz, Horr, & Hoenig
NEPS Survey Paper No. 23, 2017 Page 43
Figure 8: SC6, NEPS wave 5, comparing natives and migrants
0.500.66
0.790.74
0.320.69
0.670.57
0.740.26
0.760.71
0.60
0.500.63*
0.75***0.73
0.27***0.60***
0.55***0.53**
0.67***0.35***
0.70***0.69*
0.55**
0 .1 .2 .3 .4 .5 .6 .7 .8 .9 1 0 .1 .2 .3 .4 .5 .6 .7 .8 .9 1
Transport workerMechanic
NurseSales assistant
OpticianBanker
Police officerSocial worker
TeacherTranslator
EngineerDoctor
Legal practitioner
Natives Migrants
Share of contacts
0.020.32
0.020.02
0.060.02
0.060.01
0.060.03
0.090.030.03
0.11***0.55***
0.10***0.11***
0.26***0.13***
0.21***0.07***
0.24***0.14***
0.32***0.19***
0.24***
0 .1 .2 .3 .4 .5 .6 .7 .8 .9 1 0 .1 .2 .3 .4 .5 .6 .7 .8 .9 1
Transport workerMechanic
NurseSales assistant
OpticianBanker
Police officerSocial worker
TeacherTranslator
EngineerDoctor
Legal practitioner
Natives Migrants
Share of contacts with mig. background
SC6, Target, NEPS Wave 5; P-values of two-tailed chi2-test, comparing groups: * p<0.05, ** p<0.01, *** p<0.001