Hands-on Workshop on Computational BiophysicsExperiments with transgenic zebrafish embryo showed...
32
Hands-on Workshop on Computational Biophysics by The Theoretical and Computational Biophysics Group (TCBG) and The National Center for Multiscale Modeling of Biological Systems (MMBioS) May 19-23, 2014
Transcript of Hands-on Workshop on Computational BiophysicsExperiments with transgenic zebrafish embryo showed...

Hands-on Workshop on
Computational Biophysics
by
The Theoretical and Computational Biophysics Group
(TCBG)
and
The National Center for Multiscale Modeling of
Biological Systems (MMBioS)
May 19-23, 2014

Workshop Program
Thu, May 22: Collective Dynamics of Proteins Using Elastic Network Models - Iv
Bahar, Tim Lezon and Chakra Chennubhotla
Fri, May 23: Druggability Simulations, and Analyzing Sequence Patterns and
Structural Dynamics - Ivet Bahar , Indira Shrivastava, Chakra Chennubhotla,

Druggable Genome
Human Genome (21,000) genes
Druggable genome
3,000 genes Disease-related genes
~3,000 genes
Drug
Targets 600-1,500
Hopkins and Groom, Nat Reviews Drug Disc, 2002
430+ kinases
70+ kinases
600+ GPCRs
100+ GPCRs
A small subset of are ‘disease-modifying’ – and not all of them are druggable

Lfa1 - a leukocyte glycoprotein that promotes intercellular
adhesion and binds intercellular adhesion molecule 1
Druggable or not? Active site druggability:
Best known Kd 18.3 nM
Simulation 0.03-0.5 nM
Bakan & Bahar, J Chem Theory Comput. 8:2435-2447, 2012

binding site
Initial state
10,000 frames
Simulation trajectory MDM2
Isopropanol
(observed in 57% of drugs)
Isopropylamine (+1)
(25%)
Acetamide
(21%)
Acetate (-1)
(21%)
Bakan & Bahar, J Chem Theory Comput. 8:2435-2447, 2012
Druggability Simulations

Bakan & Bahar, J Chem Theory Comput. 8:2435-2447, 2012
Cytochrome c druggability

Methodology Overview
10-20 ns
From MD simulations to achievable drug affinities
binding site
isopropanol
Identify hotspots
Detect binding sites
calculate achievable affinity

0.9 ns 0.5 ns 20 ns
Annealing, Equilibration, Simulation
NAMD2 with CHARMM force field was used for simulations.
Annealing and equilibration provide homogenous distribution of solute molecules on the protein surface
1 2 3 …... 10000
Free Energy of Binding for Isopropanol Assuming that MD sampling converged to a Boltzmann ensemble
ΔGbinding for isopropanol is calculated using grids ΔGi = – RT ln(Ni/N0)
Ni = observed number of isopropanols (# of frames) * (# of cubes)
N0 = total number of isopropanols total number of frames
0.5 Å (not to scale)
Ni N0
Ni corresponds to the central highlighted grid element; number of cubes is introduced if multiple cubes are occupied by a single isopropanol
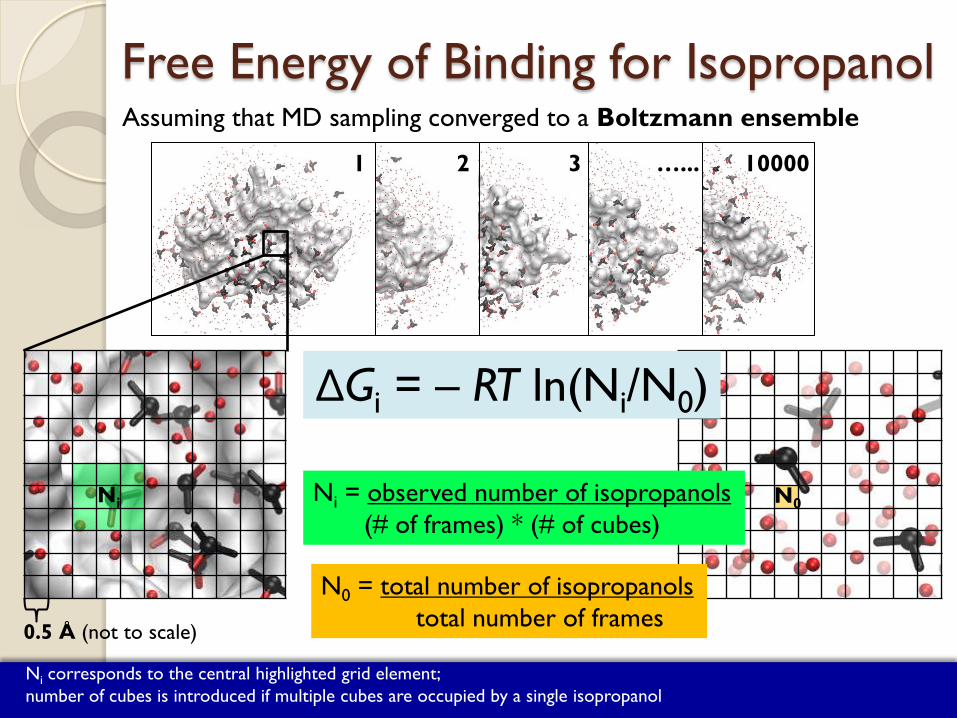
Isopropanol Binding Spots
10
~50,000 grid points with • ΔG <= – 0.416 kcal/mol* (2 fold enrichment)
ΔG grid is mapped onto the protein structure
–0.42
–0.84
–1.27
–1.69
–2.12
–2.54 kcal/mol
Cold-spot
Hot-spot War
m
9/4/2009
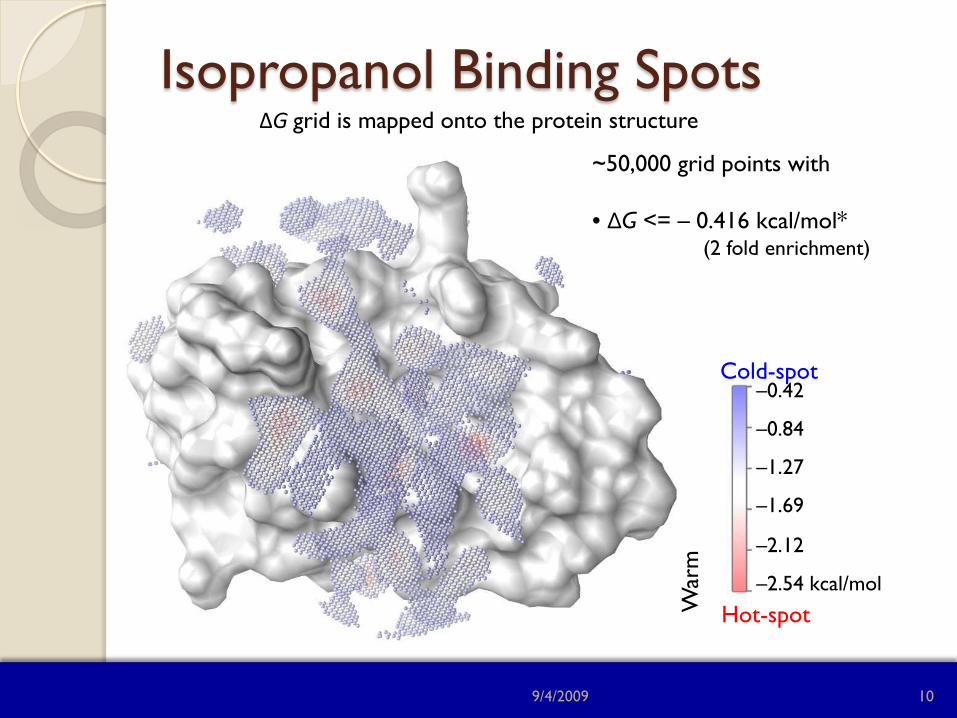
Selecting Isopropanol Binding Spots
9/4/2009 11
191 points out of ~50,000 grid points
–0.42
–0.84
–1.27
–1.69
–2.12
–2.54 kcal/mol
1. Grid element with lowest ΔG value is selected 2. Other elements within 4 Å are removed
(elements inside the red sphere –>) 3. 1 and 2 are repeated until no more points
are left to remove

Affinity of a Drug-size Molecule
12
A heuristic approach for calculating achievable free energy of binding
• Assuming binding of an isopropanol is independent of others
• 7 spatially close binding spots are selected • The sum of ΔGbinding of individual
points is considered as a binding free
energy estimate that is achievable by
a drug-like molecule
This way, the highest affinity we can observe is 5 fM (10-15).
–0.42
–0.84
–1.27
–1.69
–2.12
–2.54 kcal/mol

MDM2: p53 binding site
Predicted binding affinity range : 0.05-0.3 nM Predicted max. affinity by Seco et al. : 0.02 nM
p53 peptide key interactions (X-ray) Highest affinity solution (7 points)
1
2
3
4
5
6
7
Numbers indicate the order that hot spots were merged by the growing algorithm
The top solution is in the protein-protein interaction site
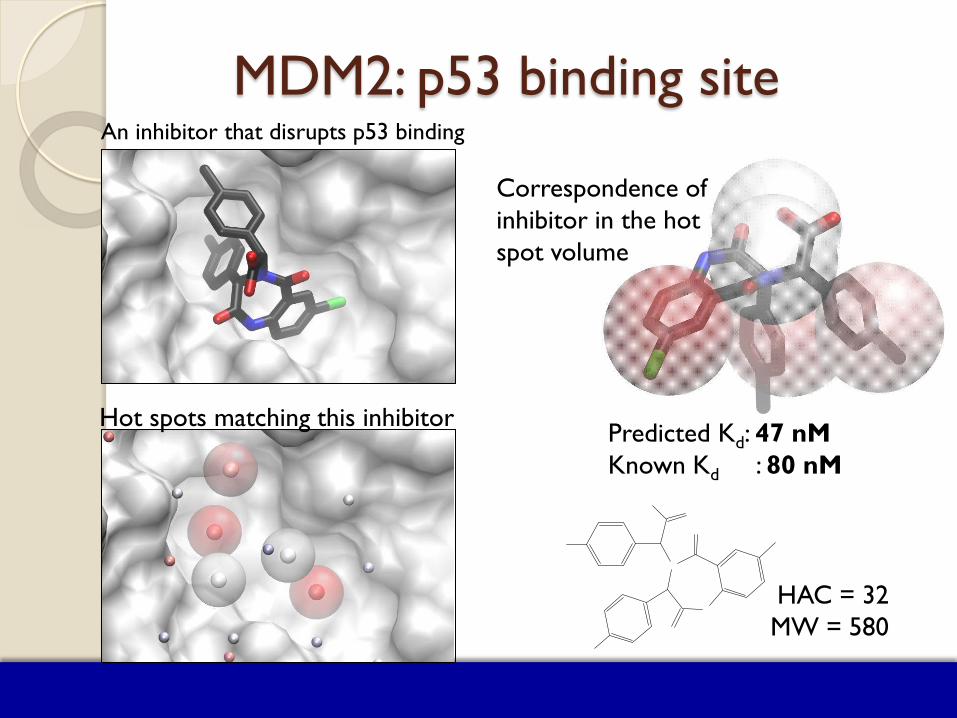
MDM2: p53 binding site An inhibitor that disrupts p53 binding
Hot spots matching this inhibitor
Correspondence of inhibitor in the hot spot volume
HAC = 32 MW = 580
Predicted Kd: 47 nM Known Kd : 80 nM

Proteins may have multiple target sites
Active site
(catalytic site)
Remote hot spot (for substrate binding)

eg5 Druggable Sites
Tubulin binding site (0.3 nM)
Allosteric site (0.3 nM)
3rd site (47 nM) Best Kd
0.2 nM Prediction 0.3 nM
-
+ +
-
Bioorg. Med. Chem. Lett. 2007, 17, 5677-5682
16 Bakan & Bahar, J Chem Theory Comput. 8:2435-2447, 2012

Assessment of druggable allosteric sites
p53
J Med. Chem. 2009, 52, 7970-7973
MDM2 p53 site Best Kd
0.6 nM Prediction 0.3 nM
-
-
-
- -
Bioorg. Med. Chem. Lett. 2003, 13, 3947-3950
PTP1B catalytic site Best IC50 2.2 nM Prediction 0.3 nM
Bound Unbound
Biochemistry 2004, 43, 2394-2404
LFA-1 allosteric site Best IC50 0.35 nM Prediction 0.03 nM
Adenine/ribose pocket allosteric
A
+
J Med. Chem. 2010, 53, 2973-2985
p38 MAPK active site Best IC50 0.05 nM Prediction 0.01 nM
17

Probes capture allosteric modulator site of AMPAR LBD Dimer
Pohlsgarrd et al (2011). Neuropharmacology. 60,135-150.
Experimental Results
Computational modeling detects experimentally observed binding site
18
Dutta, Greger, Bahar, manuscript in preparation.

Interfacial regions captured in AMPAR NTD
LL hotspots
UL hotspots
Mostly non-polar
Isobutane
Isopropanol
Dutta, Greger, Bahar, manuscript in preparation.

SUMMARY
Structure-encoded flexibility of drug targets and significance in drug discovery and design
Druggability assessment: a first step before selecting
a target Modularity and promiscuity of proteins and
quantitative systems pharmacology methods
Future Directions
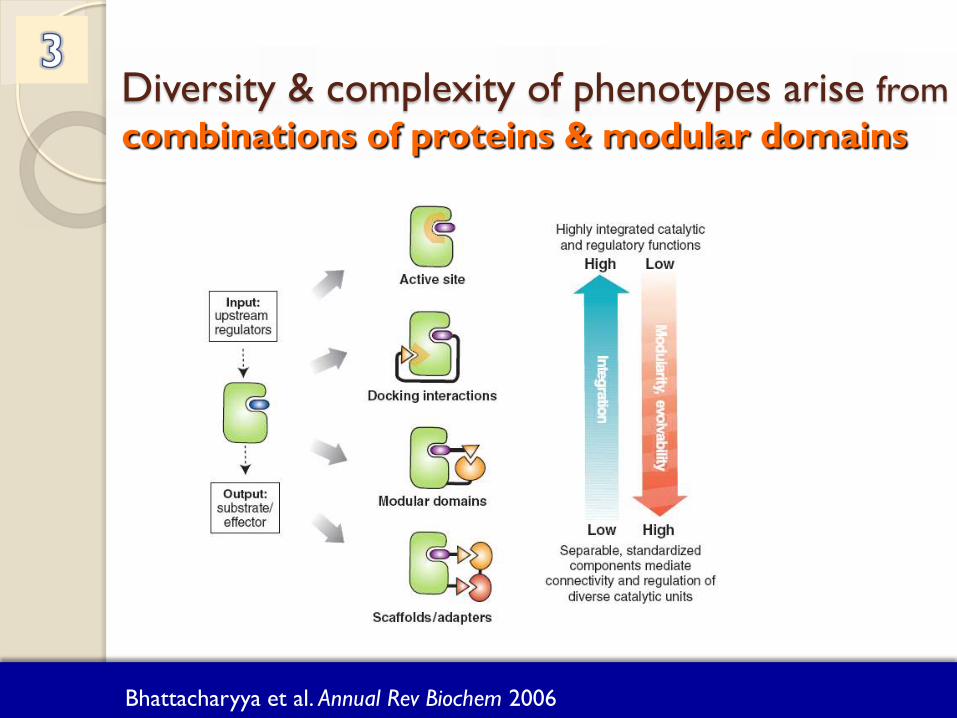
Bhattacharyya et al. Annual Rev Biochem 2006
Diversity & complexity of phenotypes arise from
combinations of proteins & modular domains
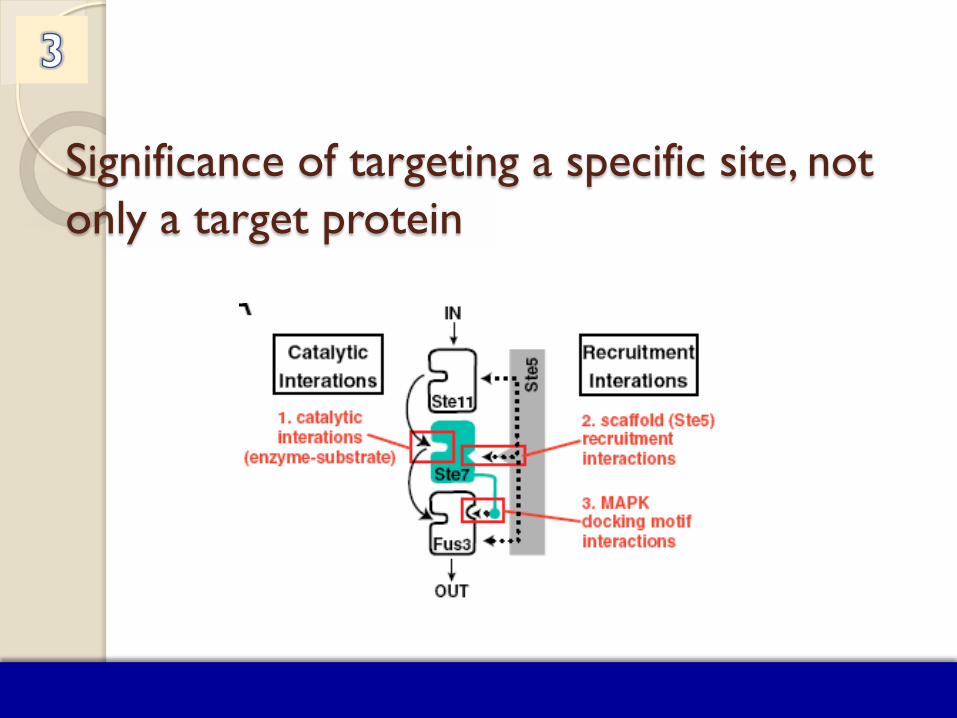
Significance of targeting a specific site, not only a target protein

GPCRs use conformational selection to shape signaling. Two (different) conformations of GPCR bind two (different) agonists, which branch into two pathways
Allostery Can Diversify Cellular Signaling Pathways through a Single Receptor
Nussinov & Tsai (2013) “Allostery in Disease and Drug Discovery” Cell 153, 293-305.

Protein Promiscuity Many proteins are involved in multiple pathways.
Depending on the targeted surface region, or on the accessible structural change/dynamics
the interactions with different (or multiple) upstream or downstream partners/substrates may be affected,
which in turn would impact different (or multiple) pathways, and may result in various phenotypes

Imatinib (Gleevec)
IC50 ~200 nM IC50 > 10,000 nM
2/3 of advanced stage CML
with imatinib resistance
Bcr-Abl tyrosine kinase
Imatinib was developed for chronic myelogenous leukemia
(CML), but was also used for gastrointestinal stromal tumors
(GISTs) and some other diseases.
Assessment of druggable allosteric sites

Imatinib vs Nilotinib
Novartis, approved in 2003 Novartis, approved in 2001
Cancer Cell. 2005, 7:129-41.
Same scaffold

Dasatinib addresses imatinib resistance mutations, but
fails with mutant T315I
Cancer Res. 2006 , 66: 5790-7.
Dasatinib
Bristol Myers Squibb, approved in 2011
Imatinib
Imatinib
Dasatinib
Scaffold hopping via pharmacophore modeling

GNF-2 binds to the myristate-binding site of Abl, leads to changes in the
structural dynamics of the protein, and thus inhibits allosteric interactions!

Simultaneously targeting of
- the ATP binding site (by Gleevec)
- the myristate pocket (by GNF-2)
Evidence for GNF-2 binding to the myristate pocket of
Abl. HSQC spectrum of Abl/imatinib with (red) and without
(black) GNF-2 (top) shows chemical shift changes induced
by ligand binding. Mapping of chemical shift changes to
structure (PDB 1OPK8) identifies the myristate pocket as the
GNF-2 binding site. b, Same as a except myristic acid used
instead of GNF-2.
Polypharmacological strategy: Inhibition of allosteric
interaction site in addition to catalytic site
Khateb et al. BMC Cancer. 2012 Overcoming Bcr-Abl T315I mutation by combination of GNF-2 and ATP competitors in an Abl-independent mechanism.
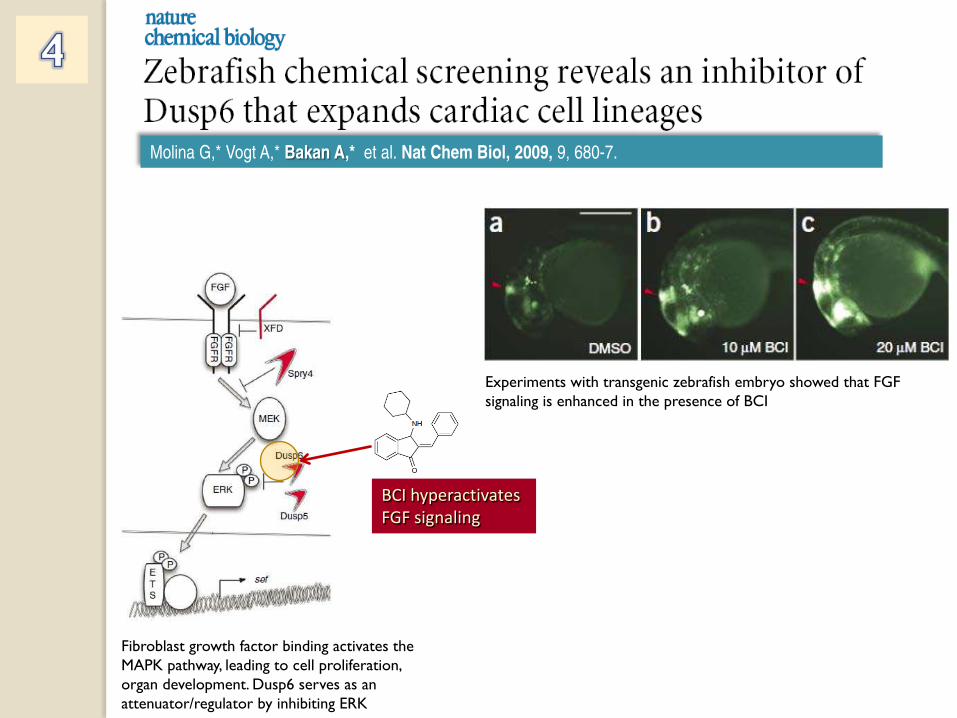
BCI hyperactivates
FGF signaling
Fibroblast growth factor binding activates the MAPK pathway, leading to cell proliferation, organ development. Dusp6 serves as an attenuator/regulator by inhibiting ERK
Experiments with transgenic zebrafish embryo showed that FGF signaling is enhanced in the presence of BCI
Molina G,* Vogt A,* Bakan A,* et al. Nat Chem Biol, 2009, 9, 680-7.

Experiments with transgenic zebrafish embryo showed that FGF signaling is enhanced in the presence of BCI Zebrafish embryos treated with BCI have enlarged hearts!
Molina G,* Vogt A,* Bakan A,* et al. Nat Chem Biol, 2009, 9, 680-7.
Fibroblast growth factor binding activates the MAPK pathway, leading to cell proliferation, organ development. Dusp6 serves as an attenuator/regulator by inhibiting ERK
BCI hyperactivates
FGF signaling

High-Content Screens Targeted Libraries
Information
Signals
extracted
from the data
Models
Refined
cellular
pathways
/processes
Experimental
testing
Quantitative Systems Pharmacology: Integrating Quantitative Models with Experimental Data for Drug Discovery
Data
Measurements of
biological functions
Predicted Drug
binding to targets
Predictions
Clinical Trials
DrugBank
3D or 4D images


![] v ( } u ] } v · Figure S5.Levels of RNAP2 Ser2ph and H3K27ac in zebrafish embryos at the different stages by immunofluorescence using in-house antibodies. Embryos were fixed at](https://static.fdocuments.net/doc/165x107/5e64075a0cf9711b30412675/-v-u-v-figure-s5levels-of-rnap2-ser2ph-and-h3k27ac-in-zebrafish-embryos.jpg)