Hands On Lab: Building and Sharing Your First...
32
Hands-On Lab Building and Sharing Your First Report Builder 3.0 Reports Lab version: 1.0.0 Last updated: 2/26/2022
Transcript of Hands On Lab: Building and Sharing Your First...

Hands-On LabBuilding and Sharing Your First Report Builder 3.0 Reports
Lab version: 1.0.0
Last updated: 5/11/2023

CONTENTS
OVERVIEW................................................................................................................................................. 3
EXERCISE 1: CREATING A REPORT USING THE TABLE WIZARD......................................................4Task 1 – Launching Report Builder.......................................................................................................5
Task 2 – Creating a Report Using the Table Wizard.............................................................................6
Task 3 – Developing the Table Report Layout......................................................................................9
Task 4 – Configuring the Report Parameter.......................................................................................12
Task 5 – Publishing Report Parts........................................................................................................15
EXERCISE 2: CREATING A REPORT USING THE MAP WIZARD........................................................19Task 1 – Creating a Report Using the Map Wizard.............................................................................20
Task 2 – Introducing a Report Part....................................................................................................23
Task 3 – Developing the Map Report Layout.....................................................................................25
Task 4 –Finishing Up..........................................................................................................................28
SUMMARY................................................................................................................................................ 28

Overview
This lab will author two reports using Report Builder 3.0. In the first exercise, you will create a report by using the Table Wizard. You will then create and configure a report parameter for this report. Next, you will publish the report parameter and main dataset as report parts.
In the second exercise, you will create a report by using the Map Wizard. The map analytic data will reference the shared dataset published in the first exercise. You will then introduce the report parameter published in the first exercise.
Note: Before you start with this exercise you must ensure that your machine meets the system requirements detailed in the next section. Additionally, you must complete the setup steps described in the next section.
Objectives
The objectives of this exercise are to:
Use Report Builder 3.0 to:
◦ Create a report using the Table Wizard
◦ Publish report parts
◦ Create a report using the Map Wizard
◦ Introduce report parts into a report
System Requirements
You must have installed the following items to complete this lab:
Microsoft SQL Server 2008 R2:
◦ Database Engine
◦ Reporting Services (Native mode)
SQL Server AdventureWorks2008 R2 sample databases
◦ AdventureWorksDW2008R2
Microsoft SQL Server 2008 R2 Report Builder 3.0

Setup
All the requisites for this lab are verified using the Configuration Wizard. To make sure that everything is correctly configured, follow these steps.
Note: To perform the setup steps you need to run the scripts in a command window with administrator privileges.
1. Launch the Configuration Wizard for this lab by double-clicking the Dependencies.dep file located under the Source\Setup folder of this lab. Install any pre-requisites that are missing (rescanning if necessary) and complete the wizard.
Cleanup
There is no need to cleanup if you intend to continue the sequence of labs in this training kit.
1. To restore the original state of the AdventureWorksDW2008R2 SQL Server database and remove the Reporting Services content, execute the Cleanup.cmd script located under the Setup folder in the Source folder of this lab.
Exercises
This Hands-On Lab comprises the following exercise:
1. Creating a Report Using the Table Wizard
2. Creating a Report Using the Map Wizard
Estimated time to complete this lab: 30 minutes.
Exercise 1: Creating a Report Using the Table Wizard
In this exercise, you will commence by launching Report Builder, and then create a report using the Table Wizard. Having developed the report layout, including the configuration of a report parameter, you will publish the report parameter and main dataset for use by the report authored in Exercise 2.
The finished report will resemble the following.

Figure 1Previewing the Sales by State report
Task 1 – Launching Report Builder
In this task, you will open Report Manager to launch Report Builder.
1. Open Internet Explorer from Start | All Programs | Internet Explorer.
2. In the Internet Explorer window, in the URL box, enter http://<servername>/Reports, and then press Enter.
Note: You will need to substitute <servername> for the name of the machine that hosts Reporting Services.
3. To launch Report Builder, on the Report Manager toolbar, click Report Builder.

Figure 2Launching Report Builder
4. If Report Builder has not already been installed, you will be prompted to download and install the application. When prompted to run the application, click Run.
Figure 3Installing Report Builder
Task 2 – Creating a Report Using the Table Wizard
In this task, you will use the Table Wizard to create the report. This will involve the creation of a dataset, and arranging the dataset fields to produce the table design. The dataset will be configured to support a parameter that will enable users to request the report for a specific calendar quarter.
1. When Report Builder launches, to create a new table report, in the Getting Started window, click Table or Matrix Wizard.
Figure 4Launching the Table or Matrix Wizard

2. In the New Table or Matrix window, in the Choose a Dataset step, ensure the Create a Dataset option is selected(located at the bottom of the window), and then click Next.
3. To browse to a published shared dataset, in the Choose a Connection to a Data Source step, click Browse.
4. In the Select Data Source window, double-click the Data Sources folder, select the AdventureWorksDW2008R2 data source, and then click Open.
5. In the New Table or Matrix window, click Next.
6. In the Design a Query step, in the Database View pane, expand the Views folder, and then check the vReportSalesByState view.
7. In the Selected Fields pane, notice that all the view columns become fields.
8. To preview the data, click Run Query.
Figure 5Previewing the data
9. Notice that the CalendarQuarterKey field values are expressed as integers combining the calendar year and quarter. For example, 20053 represents the third quarter of calendar year 2005.
10. In the Selected Fields list, ensure that the CalendarQuarterKey is selected, and then in the Applied Filters pane, click Add Filter.
Figure 6

Adding the CalendarQuarterKey field as a filter
11. In the Applied Filters list, click inside the CalendarQuarterKey filter value, and enter 20082,and then press Enter.
12. To create a report parameter for the filter, check the Parameter checkbox.
Figure 7Configuring the CalendarQuarterKey filter
13. Click Next.
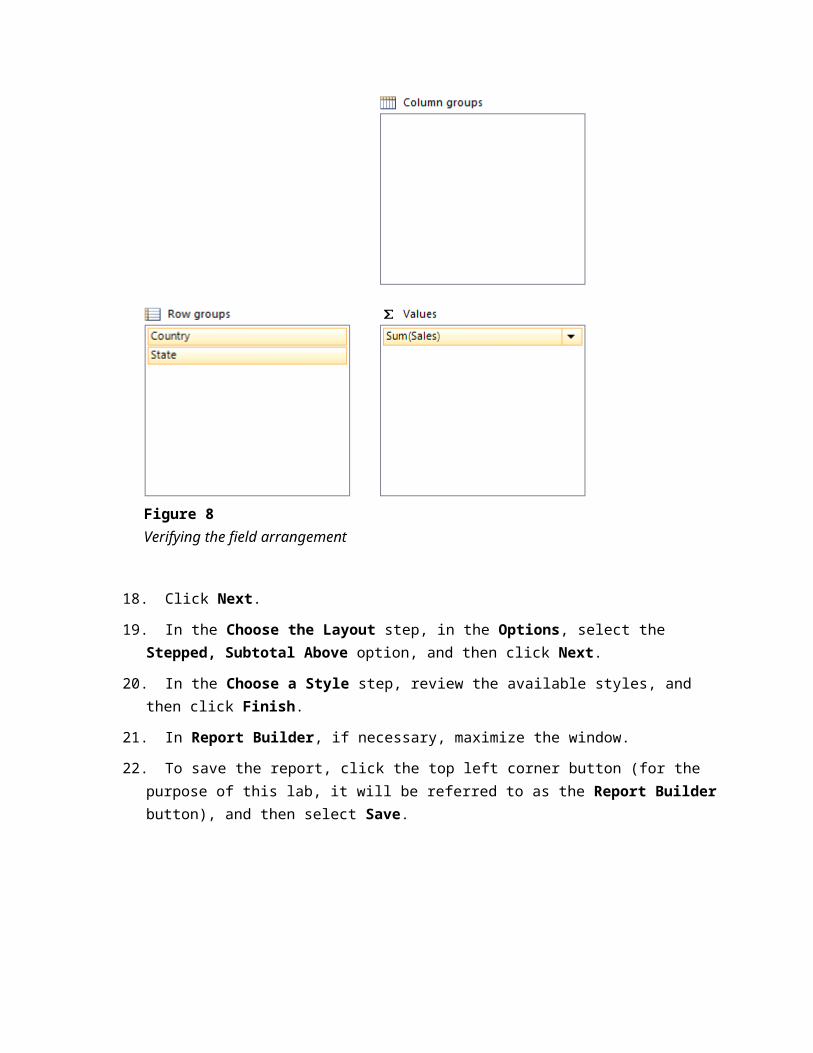
14. In the Arrange Fields step, in the Available Fields list, select the Country field, and then while pressing the Control key, select the State field also.
15. Drag the selected fields into the Row Groups box.
16. From the Available Fields list, drag the Sales field into the Values box.
17. Verify that the field arrangement looks like the following.
Figure 8

Verifying the field arrangement
18. Click Next.
19. In the Choose the Layout step, in the Options, select the Stepped, Subtotal Above option, and then click Next.
20. In the Choose a Style step, review the available styles, and then click Finish.
21. In Report Builder, if necessary, maximize the window.
22. To save the report, click the top left corner button (for the purpose of this lab, it will be referred to as the Report Builder button), and then select Save.
Figure 9Saving the report
23. In the Save as Report window, double-click the Sales Reports folder.
24. In the Name box, replace the text with Sales by State, and then click Save.
Task 3 – Developing the Table Report Layout
In this task, you will format the report layout that will involve adding a report header, configuring the title textbox, and formatting the table, its columns and number value formats.
1. To add a header to the report, on the Insert ribbon tab, inside the Header & Footer group, click Header, and then select Add Header.
2. Select the title textbox (the text in the title textbox reads Click to Add Title), and then drag it into the top left corner of the report header.
3. In the Report Data pane (located on the left), expand the Built-in Fields folder, and then drag the Report Name field into the title textbox.
Note: The last step has assigned an expression that will dynamically assign the name of the report to the textbox.
4. While the report title textbox is selected, on the Home ribbon tab, inside the Border group, select the bottom border.
Figure 10Formatting the textbox bottom border
5. To select the table, click anywhere inside it to reveal the column and row guides, and then click the top left corner.
Figure 11Selecting the table

6. Click and drag the four-headed arrow to reposition the table to the top left corner of the body of the report.
7. To widen the first column, click anywhere inside the table to reveal the column and row guides, and then drag the right edge of the first column guide to widen the column to approximately twice its original size.
8. To select all of the second column’s textboxes, select the second column guide.
Figure 12Selecting all of the second column’s textboxes
9. To right-align the textboxes, on the Home ribbon tab, inside the Paragraph group, click the Right align button.
Figure 13Clicking the Right Align button
10. To format the Sales values, select the first [Sum(Sales)] textbox.
11. On the Home ribbon tab, inside the Number group, in the dropdown list, select Number.
12. Repeat the last two steps to format the other two sales textboxes.
13. To preview the report, on the Home ribbon tab, click Run (located on the far left).
14. Notice the report parameter and its default value requesting data for the second calendar quarter of 2008.
Note: You will configure this report parameter to prompt a user-friendly name, and present a list of available values in the next task.

15. Expand Australia to reveal the states of Australia.
16. To save the report, click the Report Builder button, and the select Save.
Task 4 – Configuring the Report Parameter
In this task, you will develop the Quarter report parameter to prompt the user with available values and default to the first of those values. You will also extend that layout of the report to display the parameter selection in the header of the report.
1. To return to design mode, on the Run ribbon tab, click Design (located on the far left).
2. To add a dataset to provide available values for the report parameter, in the Report Data pane, expand the Data Sources folder, right-click the AdventureWorksDW2008R2 data source, and then select Add Dataset.
3. In the Dataset Properties window, in the Name box, replace the text with dsCalendarQuarter.
4. In the Query Type options, select Stored Procedure.
5. In the Select or Enter Stored Procedure Name dropdown list, select the uspReportParam_CalendarQuarterKey stored procedure, and then click OK.
6. In the Report Data pane, notice the addition of the dataset and that it contains two fields: CalendarQuarterKey and CalendarQuarterLabel.
7. To configure the report parameter, in the Report Data pane, expand the Parameters folder, right-click the CalendarQuarterKey report parameter, and then select Parameter Properties.
8. In the Report Parameter Properties window, in the Prompt box, replace the text with Quarter.
9. Select the Available Values page.
10. Select the Get Values From a Query option, and then configure the following properties.
Property Value
Dataset dsCalendarQuarter
Value Field CalendarQuarterKey
Label Field CalendarQuarterLabel

Figure 14Configuring the report parameter available values
11. Select the Default Values page.
12. Select the Get Values From a Query option, and then configure the following properties.
Property Value
Dataset dsCalendarQuarter
Value Field CalendarQuarterKey

Figure 15Configuring the report parameter default value
Note: This configuration will ensure that the first row retrieved from the dataset becomes the report parameter’s default value.
13. Click OK.
14. To add the parameter selection to the report header, in the Report Data pane, drag the CalendarQuarterKey report parameter and drop it into the report header, directly beneath the report title.
15. Click and drag the four-headed arrow of the textbox to reposition it directly beneath the report title and aligned to the very left of the report title textbox.
16. To configure the textbox expression, right-click inside the report parameter textbox, and then select Expression.

Figure 16Configuring the textbox expression
17. In the Expression window, modify the expression by replacing the Value property with the Label property, and then click OK.
Visual Basic
=Parameters!CalendarQuarterKey.Label
18. To preview the report, on the Home ribbon tab, click Run.
19. In the Quarter parameter dropdown list, select CY2008 Q1, and then click View Report (located at the far right).
20. Notice that the report header displays the parameter selection.
21. To save the report, click the Report Builder button, and the select Save.
Task 5 – Publishing Report Parts
In this task, you will publish the CalendarQuarterKey report parameter and the dataset used by the table. In the next exercise, you will create a new report that will use both of these shared components.
1. To return to design mode, on the Run ribbon tab, click Design.
2. To publish the report parts, click the Report Builder button, and the select Publish Report Parts.
3. In the Publish Report Parts window, select the Review and Modify Report Parts Before Publishing.

Figure 17Publishing report parts
4. To select and configure the report parts to publish, in the Report Parts group, notice that the CalendarQuarterKey report parameter is already checked.
5. Uncheck the Tablix1 report part.
6. In the Datasets group, check the DataSet1 dataset.
7. Click the word DataSet1, and then modify the text to SalesByState.
8. To expand the dataset details, click the arrow to the left of the SalesByState dataset.

Figure 18Configuring the SalesByState dataset
9. To configure a different location to store the dataset, click the Browse button.
Figure 19Clicking the Browse button

10. In the Select Folder window, click the Up One Level button.
Figure 20Clicking the Up One Level button
11. Select the Datasets folder, and then click OK.
12. Verify that your configuration looks like the following.
Figure 21Reviewing the Publish Report Parts configuration
13. To publish the selected parts to the report server, click Publish.

14. Click Close.
15. In the Report Data pane, notice that DataSet1 icon now includes an arrow which signifies that it references a shared dataset.
Figure 22Reviewing the shared dataset icon
16. To save the report, click the Report Builder button, and the select Save.
Exercise 2: Creating a Report Using the Map Wizard
In this exercise, you will create a report using the Map Wizard. Having developed the report layout, you will include the two components published in Exercise 1.
The finished report will resemble the following.

Figure 23Previewing the US Sales by State report
Task 1 – Creating a Report Using the Map Wizard
In this task, you will use the Map Wizard to create the report. This will involve the use of the SalesByState shared dataset published in Exercise 1.
1. Click the Report Builder button, and then select New.
2. In the Getting Started window, click Map Wizard.

Figure 24Launching the Map Wizard
3. In the New Map window, in the Choose a Source of Spatial Data step, notice that the Map Gallery option is selected, then in the Map Gallery, select USA by State Inset, and then click Next.
Figure 25Selecting the USA by State Inset map gallery
4. In the Choose Spatial Data and Map View Options, notice the options to zoom in and out, and to add a Bing Maps layer, and then click Next.
5. In the Choose Map Visualization step, select the Color Analytical Map option, and then click Next.
Figure 26Selecting the Color Analytical Map visualization

6. In the Choose the Analytical Dataset step, to source the shared dataset created in the previous exercise, select the Choose an Existing Dataset in this Report or a Shared Dataset.
7. Click Browse.
8. In the Select Dataset window, double-click the Datasets folder, select the SalesByState dataset, and then click Open.
9. In the New Map window, click Next.
10. In the Specify the Match Fields for Spatial and Analytical Data step, check the STUSPS spatial dataset field, then in the corresponding Analytical Dataset Fields dropdown list, select the StateCode field, and then click Next.
Figure 27Configuring the relationship between the spatial and analytical data
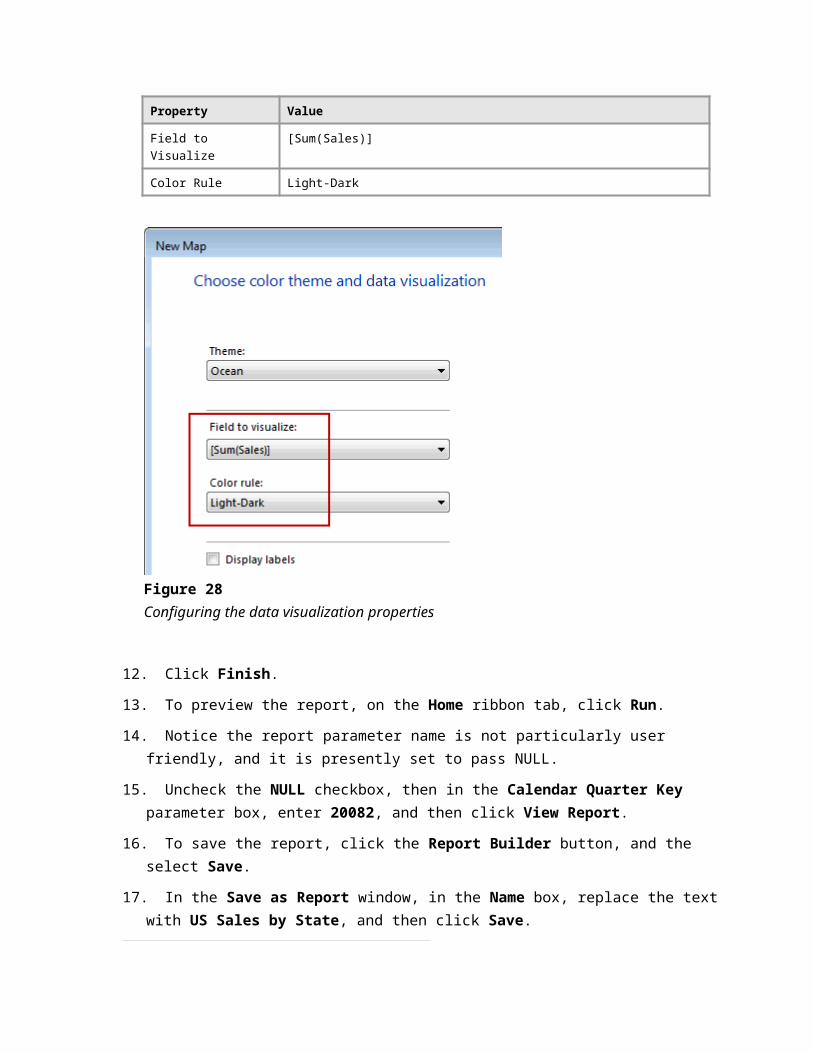
11. In the Choose Color Theme and Data Visualization step, configure the following properties.
Property Value
Field to Visualize [Sum(Sales)]
Color Rule Light-Dark

Figure 28Configuring the data visualization properties
12. Click Finish.
13. To preview the report, on the Home ribbon tab, click Run.
14. Notice the report parameter name is not particularly user friendly, and it is presently set to pass NULL.
15. Uncheck the NULL checkbox, then in the Calendar Quarter Key parameter box, enter 20082, and then click View Report.
16. To save the report, click the Report Builder button, and the select Save.
17. In the Save as Report window, in the Name box, replace the text with US Sales by State, and then click Save.
Task 2 – Introducing a Report Part
In this task, you will introduce the CalendarQuarterKey report parameter published in the previous exercise.
1. To return to design mode, on the Run ribbon tab, click Design.
2. In the Report Data pane, expand the Datasets folder.
3. Notice the SalesByState shared dataset.
4. In the Report Data pane, expand the Parameters folder.

5. Right-click the CalendarQuarterKey report parameter, and then select Delete.
6. When prompted to delete the report parameter, click OK.
7. To introduce the published report parameter, on the Insert ribbon tab, click Report Parts (located on the far left).
8. In the Report Part Gallery (which opens on the right side), click the Search button.
Figure 29Clicking the Search button
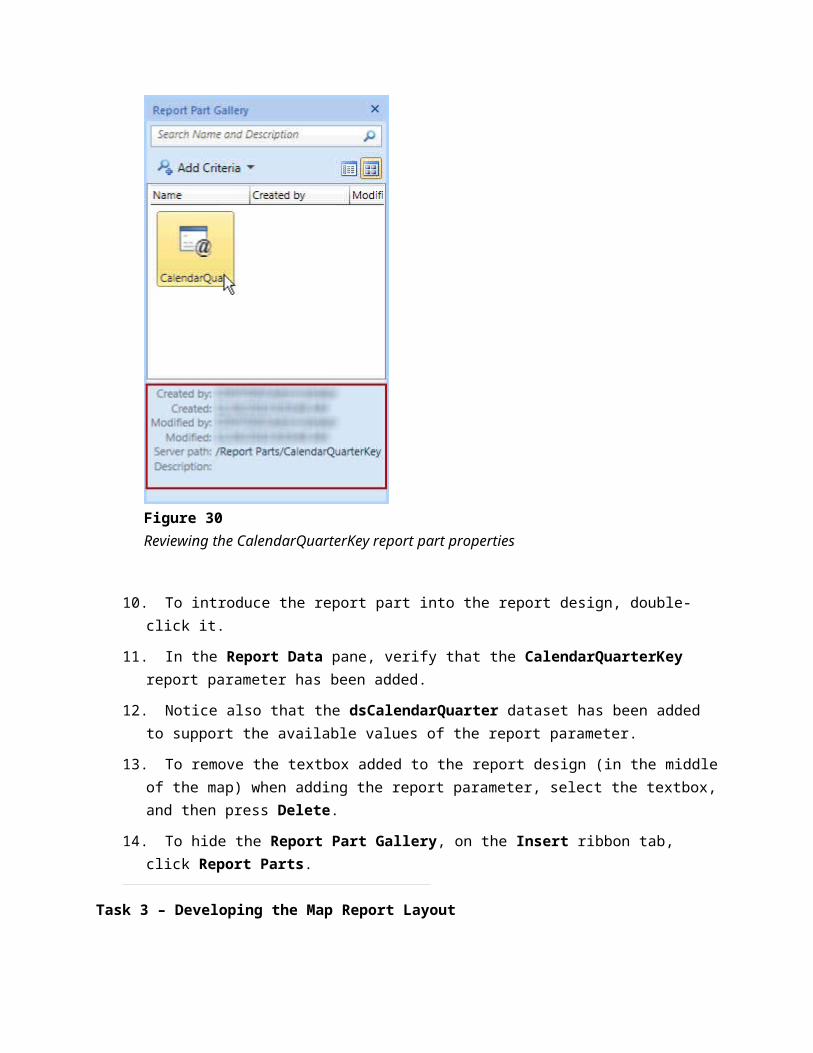
9. Select the CalendarQuarterKey report part, and then notice the properties for the report part displayed at the bottom of the Report Part Gallery.
Figure 30Reviewing the CalendarQuarterKey report part properties

10. To introduce the report part into the report design, double-click it.
11. In the Report Data pane, verify that the CalendarQuarterKey report parameter has been added.
12. Notice also that the dsCalendarQuarter dataset has been added to support the available values of the report parameter.
13. To remove the textbox added to the report design (in the middle of the map) when adding the report parameter, select the textbox, and then press Delete.
14. To hide the Report Part Gallery, on the Insert ribbon tab, click Report Parts.
Task 3 – Developing the Map Report Layout
In this task, you will format the map report layout that will involve defining the map title and legend title, removing the color and distance scales, and introducing a tooltip expression for each polygon (US state) in the map.
1. Right-click the Map Title text, and then select Title Properties.
2. In the Map Title Properties window, to the right of the Title Text box, click the function button.
Figure 31Clicking the function button
3. In the Expression window, in the expression box, remove the entire expression text.
4. In the Category list, select Built-in Fields.
5. To add the report name to the expression, in the Item list, double-click the ReportName field.
6. Complete the expression to look like the following.
Visual Basic
=Globals!ReportName & " " &
7. Position the cursor at the very end of the expression, and ensure there is a space after the last ampersand (&).
8. In the Category list, select Parameters.
9. In the Values list, double-click the CalendarQuarterKey parameter.
10. Modify the expression by replacing the Value property with the Label property.
11. Verify that the completed expression looks like the following.
Visual Basic
=Globals!ReportName & " " & Parameters!CalendarQuarterKey.Label
12. Click OK.
13. In the Map Title Properties window, click OK.
14. To rename the legend title, right-click the Title text in the legend, and then select Legend Title Properties.
Figure 32Configuring the Legend Title properties
15. In the Map Legend Title Properties window, in the Legend Title Text box, replace the text with Sales, and then click OK.
16. To remove the color scale, select the scale, and then press the Delete key.
Figure 33Selecting the color scale
17. To remove the distance scale, select the scale, and then press the Delete key.

18. To configure the polygon properties, click inside the map at least twice to open the Map Layers window, which is located on the right of the report design (you may have to scroll to the right to see it).
19. Right-click the polygon layer, and then select Polygon Properties.
Figure 34Configuring the Polygon properties
20. In the Map Polygon Properties window, to the right of the Tooltip dropdown list, click the function button.
21. In the Expression window, enter the following expression, and then click OK.
Note: The expression required in the following step may be copied from the Assets\Snippets.txt file in the Source folder of this lab.
Visual Basic
=Fields!State.Value & vbCrLf & "Sales: " & CInt(Fields!Sales.Value).ToString("N0")
Note: This expression concatenates the value of the State field with a carriage return and line feed, and then concatenates this with the value of the Sales field converted to an integer and formatted as a numeric with zero decimal places (N0).
22. In the Map Polygon Properties window, click OK.
23. To preview the report, on the Home ribbon tab, click Run.
24. Hover over several shaded states to review the tooltip.
25. In the Quarter parameter dropdown list, select CY2008 Q1, and then click View Report.
26. To save the report, click the Report Builder button, and the select Save.
Task 4 –Finishing Up
In this task, you will finish up by closing all applications.
1. Click the Report Builder button, and then click Exit Report Builder.
Summary
In this lab, you have created two reports using wizards available in Report Builder 3.0. You published two report parts from the first report, and they were both used to assist in the development of the second report.