Gulf Coast Climate Change Adaptation Pilot StudyGulf Coast Climate Change Adaptation Pilot Study 5....
131
Gulf Coast Climate Change Adaptation Pilot Study Final Report AUGUST 2013 FTA Report No. 0072 Federal Transit Administration PREPARED BY Texas A&M Transportation Institute The Texas A&M University System Center for Texas Beaches and Shores Texas A&M University Galveston
Transcript of Gulf Coast Climate Change Adaptation Pilot StudyGulf Coast Climate Change Adaptation Pilot Study 5....

Gulf Coast Climate ChangeAdaptation Pilot Study
Final Report
AUGUST 2013
FTA Report No. 0072 Federal Transit Administration
PREPARED BY
Texas A&M Transportation Institute The Texas A&M University System
Center for Texas Beaches and Shores Texas A&M University Galveston

COVER PHOTO Gulf Coast, USA – Tamaulipas, Mexico to New Orleans, LA Satellite imagery provided courtesy of NASA Planetary Photo Journal
DISCLAIMER This document is disseminated under the sponsorship of the U.S. Department of Transportation in the interest of information exchange. The United States Government assumes no liability for its contents or use thereof. The United States Government does not endorse products of manufacturers. Trade or manufacturers’ names appear herein solely because they are considered essential to the objective of this report.
Gulf Coast Climate Change AdaptationPilot Study Final Report
AUGUST 2013 FTA Report No. 0072
PREPARED BY
Texas A&M Transportation Institute The Texas A&M University System
Center for Texas Beaches and Shores Texas A&M University Galveston
SPONSORED BY
Federal Transit Administration Office of Budget and Policy U.S. Department of Transportation 1200 New Jersey Avenue, SE Washington, DC 20590
AVAILABLE ONLINE
http://www.fta.dot.gov/research

Metric Conversion Table
SYMBOL WHEN YOU KNOW MULTIPLY BY TO FIND SYMBOL
LENGTH
in inches 25.4 millimeters mm
ft feet 0.305 meters m
yd yards 0.914 meters m
mi miles 1.61 kilometers km
VOLUME
fl oz fluid ounces 29.57 milliliters mL
gal gallons 3.785 liter L
ft3 cubic feet 0.028 cubic meters m3
yd3 cubic yards 0.765 cubic meters m3
NOTE: volumes greater than 1000 L shall be shown in m3
MASS
oz ounces 28.35 grams g
lb pounds 0.454 kilograms kg
T short tons (2000 lb) 0.907 megagrams
(or “metric ton”) Mg (or “t”)
TEMPERATURE (exact degrees)
oF Fahrenheit 5 (F-32)/9
or (F-32)/1.8 Celsius oC
FEDERAL TRANSIT ADMINISTRATION ii

REPORT DOCUMENTATION PAGE Form Approved OMB No. 0704-0188
Public reporting burden for this collection of information is estimated to average 1 hour per response, including the time for reviewing instructions, searching existing data sources, gathering and maintaining the data needed, and completing and reviewing the collection of information. Send comments regarding this burden estimate or any other aspect of this collection of information, including suggestions for reducing this burden, to Washington Headquarters Services, Directorate for Information Operations and Reports, 1215 Jefferson Davis Highway, Suite 1204, Arlington, VA 22202-4302, and to the Office of Management and Budget, Paperwork Reduction Project (0704-0188), Washington, DC 20503.
1. AGENCY USE ONLY 2. REPORT DATE August 2013
3. REPORT TYPE AND DATES COVERED 2012–2013
4. TITLE AND SUBTITLE Gulf Coast Climate Change Adaptation Pilot Study
5. FUNDING NUMBERS
6. AUTHOR(S) Jonathan Brooks, Roma Stevens, Stuart Matthew Sandidge, Linda Cherrington, Russell Blessing, Alexandra Stiles, Dr. Samuel Brody
7. PERFORMING ORGANIZATION NAME(S) AND ADDRESSE(ES) Texas A&M Transportation Institute The Texas A&M University System College Station, Texas 77843-3135
8. PERFORMING ORGANIZATION REPORT NUMBER
FTA Report No. 0072
9. SPONSORING/MONITORING AGENCY NAME(S) AND ADDRESS(ES) U.S. Department of Transportation Federal Transit Administration East Building 1200 New Jersey Avenue, SE Washington, DC 20590
10. SPONSORING/MONITORING AGENCY REPORT NUMBER
FTA Report No. 0072
11. SUPPLEMENTARY NOTES http://www.fta.dot.gov/research
12A. DISTRIBUTION/AVAILABILITY STATEMENT Available from: National Technical Information Service (NTIS), Springfield, VA 22161 Phone 703.605.6000, Fax 703.605.6900, email [[email protected]]
12B. DISTRIBUTION CODE
TRI-20
13. ABSTRACT Climate change-related issues place substantial operating and financial burdens on public transit agencies, particularly in coastal settings. Gulf of Mexico coastal transit agencies and their constituents are especially vulnerable to natural hazards resulting from extreme heat, flooding, and high winds. The Federal Transit Administration (FTA) has billions of dollars in assets across the U.S., many of which are threatened by the adverse impacts of climate change. Reducing the impacts of weather events and long-term climate change is a key goal for Gulf Coast transit agencies as well as FTA.
The study was one of seven climate change adaptation pilot studies. The purpose of the Gulf Coast study was two-fold: to provide benefit to three specific project member transit agencies and to compile practical information for all Gulf Coast transit agencies. While a great deal has been written about the expected impacts of climate change, little work has focused specifically on the implications for transit agencies operating along the Gulf of Mexico. The Gulf Coast pilot study report addresses the information and strategy gap by providing the following: background information about climate change, description of climate impacts along the Gulf Coast, a survey of agencies about past severity of various weather events, a conceptual framework for planning and adapting to climate change, vulnerability matrix planning tools, three case study examples of previous/ongoing adaptation strategies, and a detailed methodology using GIS spatial data to assess climate change vulnerability of transit assets. As Gulf Coast transit agencies continue to plan for emergency weather events such as hurricanes and begin to proactively plan for the long-term effects of climate change, they will reduce risk and improve safety. Using the information in this report as a baseline guide, Gulf Coast transit agencies can renew and improve planning for the impacts of finite weather events and long-term climate change, thus increasing agency staff capabilities, protecting valuable assets, and improving rider safety.
14. SUBJECT TERMS Climate change, natural hazards, Gulf Coast transit, emergency transportation, asset management
15. NUMBER OF PAGES 131
16. PRICE CODE
17. SECURITY CLASSIFICATION OF REPORT Unclassified
18. SECURITY CLASSIFICATION OF THIS PAGE
Unclassified
19. SECURITY CLASSIFICATION OF ABSTRACT
Unclassified
20. LIMITATION OF ABSTRACT None
FEDERAL TRANSIT ADMINISTRATION iii
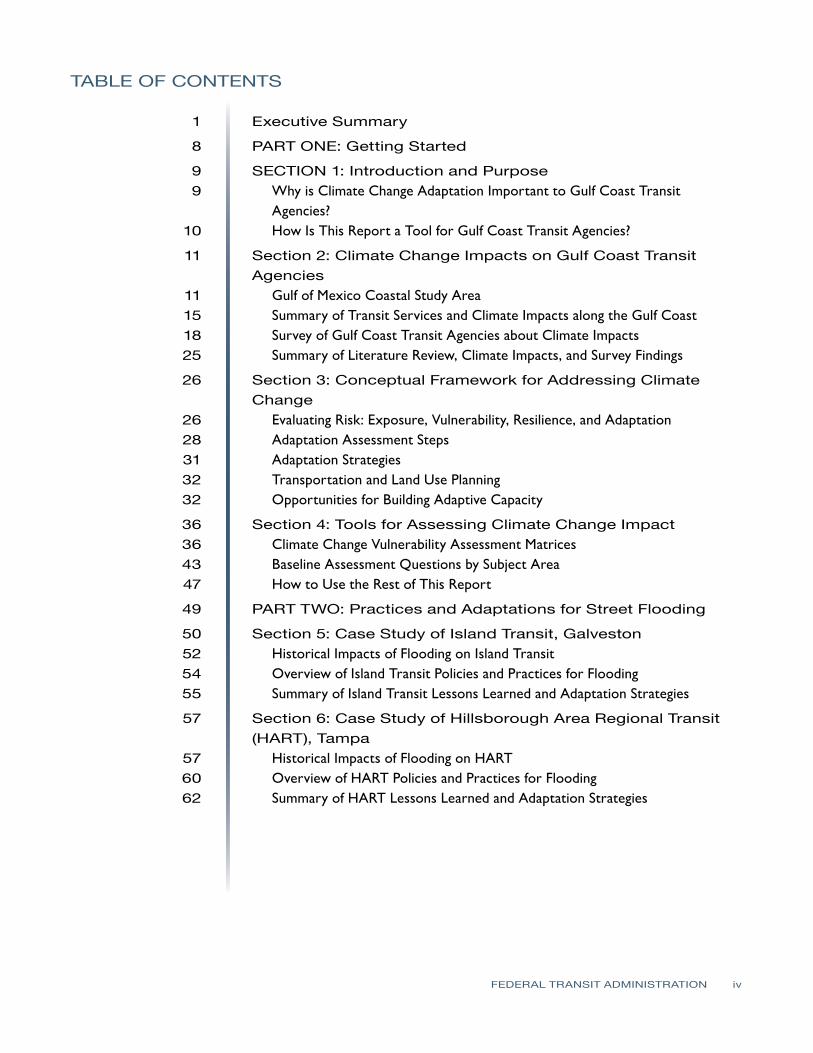
TABLE OF CONTENTS
1
8
9 9
10
11
11 15 18 25
26
26 28 31 32 32
36 36 43 47
49
50 52 54 55
57
57 60 62
Executive Summary
PART ONE: Getting Started
SECTION 1: Introduction and Purpose Why is Climate Change Adaptation Important to Gulf Coast Transit Agencies?How Is This Report a Tool for Gulf Coast Transit Agencies?
Section 2: Climate Change Impacts on Gulf Coast Transit Agencies
Gulf of Mexico Coastal Study Area Summary of Transit Services and Climate Impacts along the Gulf Coast Survey of Gulf Coast Transit Agencies about Climate Impacts Summary of Literature Review, Climate Impacts, and Survey Findings
Section 3: Conceptual Framework for Addressing Climate Change
Evaluating Risk: Exposure, Vulnerability, Resilience, and Adaptation Adaptation Assessment Steps Adaptation StrategiesTransportation and Land Use PlanningOpportunities for Building Adaptive Capacity
Section 4: Tools for Assessing Climate Change Impact Climate Change Vulnerability Assessment Matrices Baseline Assessment Questions by Subject Area How to Use the Rest of This Report
PART TWO: Practices and Adaptations for Street Flooding
Section 5: Case Study of Island Transit, Galveston Historical Impacts of Flooding on Island Transit Overview of Island Transit Policies and Practices for Flooding Summary of Island Transit Lessons Learned and Adaptation Strategies
Section 6: Case Study of Hillsborough Area Regional Transit (HART), Tampa
Historical Impacts of Flooding on HARTOverview of HART Policies and Practices for FloodingSummary of HART Lessons Learned and Adaptation Strategies
FEDERAL TRANSIT ADMINISTRATION iv

64 PART THREE: Practices and Adaptations for Hurricane or Tropical Storm Recovery
65 Section 7: Case Study of Houston METRO 65 Overview of METRO 66 Summary of Storm Impacts on METRO: Hurricane Ike (Category 2, 2008) 66 Organizational Preparation for Hurricanes and Tropical Storms 72 Aspects of Recovery from Hurricanes and Tropical Storms 76 Summary of Lessons Learned and Adaptation Strategies
79 PART FOUR: A Spatial Approach to Assess Climate Change Vulnerability of Transit Assets
80 Section 8: Need for Spatially-Oriented Analysis 80 Problem Statement 81 Climate Change Impacts on Transportation Systems 82 Need for Spatially-Oriented Procedure for Understanding Asset Vulnerability
84 Section 9: Contributing Factors of Climate Change Vulnerability along the Gulf Coast
84 Hurricanes and Tropical Storms 85 Temperature Changes and Drought 86 Sea-Level Rise and Storm Surge 87 Elevation and Subsidence 88 Precipitation
91 Section 10: How to Use GIS to Assess Transit Asset Vulnerability to Climate Change
91 Climate Change Vulnerability Index (CCVI) Methodology 94 Case Study Application of CCVI Methodology to HART Operations Facility 98 Discussion of Case Study Findings 99 Overall Conclusions from CCVI Methodology Development
101 Appendix A: Survey Responses by Transit Agency
114 References
FEDERAL TRANSIT ADMINISTRATION v

LIST OF FIGURES
4 5
11 12
14
15 16 18 23 24 29 31 38 39 41 42 50 53 53 53 55 59 65 68 69 74 91 95 96 97
98
Figure ES-1: Vulnerability Matrix Figure ES-2: Flexible Adaptation Pathways Figure 2-1: Coastal Watersheds and Counties that Make up the Gulf Coast Figure 2-2: Surface Geology of Southeastern U.S. (line is extent of Gulf Coastal
Plain) Figure 2-3: Coastal Vulnerability Index—Relative Vulnerability to Future Sea-
Level Rise Figure 2-4: Percentage and Length of Shoreline by Sea-Level Rise Risk Category Figure 2-5: Map of Gulf Coast Highlighting Census Urbanized Areas Figure 2-6: Map of Survey Respondents Figure 2-7: Frequency of Flooding, Extreme Heat, Drought and High Wind Figure 2-8: Tropical Storm and Hurricane Landfalls Figure 3-1: Two-Dimensional Risk Matrix Figure 3-2: Flexible Adaptation Pathways Figure 4-1: Agency Vulnerability Snapshot Tool Figure 4-2: Agency Vulnerability Snapshot Tool—Island Transit Example Figure 4-3: Sub-Agency Vulnerability Analysis Tool Figure 4-4: Sub-Agency Vulnerability Analysis Tool—Island Transit Example Figure 5-1: Urban-Rural Situation of Galveston Island Figure 5-2: Route 1: 71st via Market & Broadway (most affected by flooding) Figure 5-3: Route 5: Ave S—Stewart Road (occasionally affected by flooding) Figure 5-4: Route 6: 61st via Ave O (occasionally affected by flooding) Figure 5-5: Example of Route Map with Predetermined Flood Reroute Path Figure 6-1: HART System Map Figure 7-1: Houston METRO Service Area Figure 7-2: METRO and Stakeholders Conceptual Hurricane Timeline Figure 7-3: METRO Maintenance Staff Plan during Hurricanes Figure 7-4: Map of METRO Core Routes
Figure 10-1: Coastal Watersheds and Counties that Make Up the Gulf Coast Figure 10-2: Location of HART’s Operations Facility (with half-mile buffer) Figure 10-3: Aerial Image of HART Operations Facility Figure 10-4: Climate Change Vulnerability Index (CCVI) for HART Operations
Facility Figure 10-5: Comparison of HART Facility and Gulf Coast Region
FEDERAL TRANSIT ADMINISTRATION vi

LIST OF TABLES
7 19 20 22 24 51 56 63 71 78 93
101 102 104 106 108 110 112
Table ES-1: Climate Change Dimensions and Spatial Data Layers Table 2-1: List of Survey Respondents Table 2-2: Intensity of Extreme Weather Events Table 2-3: Impact on Agency Operation Aspects Table 2-4: Frequency of Hurricane and Tropical Storm Warnings Table 5-1: Hurricane Ike Impact on Island Transit Funding Table 5-2: Island Transit: Adaptation Strategies and Relative Cost Table 6-1: HART: Adaptation Strategies and Relative Cost Table 7-1: Primary Recovery Responsibilities by Department Table 7-2: METRO: Adaptation Strategies and Relative Cost Table 10-1: Climate Change Dimensions and Spatial Data Layers Table A-1: Survey Respondents Table A-2: Flooding: Survey Responses Table A-3: Tropical Storm and Hurricane Warnings: Survey Responses Table A-4: Tropical Storm and Hurricane Strikes: Survey Responses Table A-5: Extreme Heat: Survey Responses Table A-6: Drought: Survey Responses Table A-7: High Wind: Survey Responses
FEDERAL TRANSIT ADMINISTRATION vii

ACKNOWLEDGMENTS
The authors acknowledge the support and guidance of the Federal Transit Administration staff Brian Alberts and Bryce McNitt.
The authors acknowledge and express special gratitude to the following three partners and case study transit agencies (order is not significant):
• City of Galveston Island Transit (Island Transit), Galveston, Texas
• Metropolitan Transit Authority of Harris County (METRO), Houston, Texas
• Hillsborough Area Regional Transit (HART), Tampa, Florida
The authors also thank the Gulf Coast agencies that responded to the survey and thereby provided invaluable insight into climate impacts and priorities in the region (order is not significant):
• Lake Charles Transit, Lake Charles, Louisiana
• City of Galveston Island Transit, Galveston, Texas
• Pinellas Suncoast Transit Authority, St. Petersburg, Florida
• Okaloosa County BCC, Fort Walton Beach, Florida
• Lee County Transit, Fort Myers, Florida
• Lafayette Transit System, Lafayette, Louisiana
• Coast Transit Authority, Gulf Port-Biloxi, Mississippi
• Southeast Alabama Regional Planning and Development Commission, Dothan, Alabama
• Gulf Coast Center/Connect Transit, Texas City–La Marque, Texas
• Golden Crescent Regional Planning Commission, Victoria, Texas
• LRGVDC–Valley Metro, Harlingen, Texas
• Terrebonne Parish Consolidated Government, Houma, Louisiana
• Brownsville Metro, Brownsville, Texas
• Lakeland Area Mass Transit District, Lakeland, Florida
• Capital Area Transit System, Baton Rouge, Louisiana
• Port Arthur Transit, Port Arthur, Texas
• Hillsborough Area Regional Transit, Tampa, Florida
FEDERAL TRANSIT ADMINISTRATION viii
ABSTRACT
Climate change-related issues place substantial operating and financial burdens on public transit agencies, particularly in coastal settings. Gulf of Mexico coastal transit agencies and their constituents are especially vulnerable to natural hazards resulting from extreme heat, flooding, and high winds. The Federal Transit Administration (FTA) has invested billions of dollars in assets across the U.S., many of which are threatened by the adverse impacts of climate change. Reducing the impacts of weather events and long-term climate change is a key goal for Gulf Coast transit agencies as well as FTA.
The study was one of seven climate change adaptation pilot studies. The purpose of the Gulf Coast study was two-fold: to provide benefit to three specific project member transit agencies and to compile practical information for all Gulf Coast transit agencies. While a great deal has been written about the expected impacts of climate change, little work has focused specifically on the implications for transit agencies operating along the Gulf of Mexico. The Gulf Coast pilot study report addresses the information and strategy gap by providing the following: background information about climate change, description of climate impacts along the Gulf Coast, a survey of agencies about past severity of various weather events, a conceptual framework for planning and adapting to climate change, vulnerability matrix planning tools, three case study examples of previous/ongoing adaptation strategies, and a detailed methodology using GIS spatial data to assess climate change vulnerability of transit assets. As Gulf Coast transit agencies continue to plan for emergency weather events such as hurricanes and begin to proactively plan for the long-term effects of climate change, they will reduce risk and improve safety. Using the information in this report as a baseline guide, Gulf Coast transit agencies can renew and improve planning for the impacts of finite weather events and long-term climate change, thus increasing agency staff capabilities, protecting valuable assets, and improving rider safety.
FEDERAL TRANSIT ADMINISTRATION ix

EXECUTIVE SUMMARY
FEDERAL TRANSIT ADMINISTRATION 1
EXECUTIVE SUMMARY
This Executive Summary provides an overview of this final research report, “Gulf Coast Climate Change Adaptation Pilot Study.” The Federal Transit Administration (FTA) funded the study as one of seven climate change adaptation pilot studies. The purpose of the Gulf Coast study was two-fold:
• Provide benefit to the three partner transit agencies:
- City of Galveston Island Transit (Island Transit), Galveston, Texas
- Metropolitan Transit Authority of Harris County (METRO), Houston, Texas
- Hillsborough Area Regional Transit (HART), Tampa, Florida
• Compile practical information for all Gulf Coast transit agencies
Climate change-related issues place substantial operating and financial burdens on public transit agencies, particularly in coastal settings. Gulf of Mexico coastal transit agencies and their constituents are especially vulnerable to natural hazards resulting from extreme heat, flooding, and high winds. FTA has billions of dollars in assets across the U.S., many of which are threatened by the adverse impacts of climate change.
While a great deal has been written about the expected impacts of climate change on coastal regions of the United States (and elsewhere), little work has focused specifically on the implications for transit agencies operating along the Gulf of Mexico coast. Even less research has been conducted on specific mitigation and adaptation strategies that transit agencies and their partners can implement to reduce the adverse effects of climate change. This report begins to address this information and strategy gap by providing documentation of the following research activities:
• Investigating the climate impacts along the Gulf Coast that affect transit agencies, based on both literature and a survey of Gulf Coast urban transit agencies.
• Using original and published research to provide a conceptual framework for addressing climate change in a formal eight-step planning process.
• Creating analytical tools for agencies to use to assess vulnerability and baseline policies and practices.
• Providing case study examples of climate adaptation by three transit agencies that have experience dealing with street/site flooding or hurricane/tropical storm recovery.
• Documenting a detailed methodology using GIS spatial data to assess climate change vulnerability of transit assets.
The following sections briefly summarize key researcher observations, conclusions, and recommendations from the study.
EXECUTIVE SUMMARY
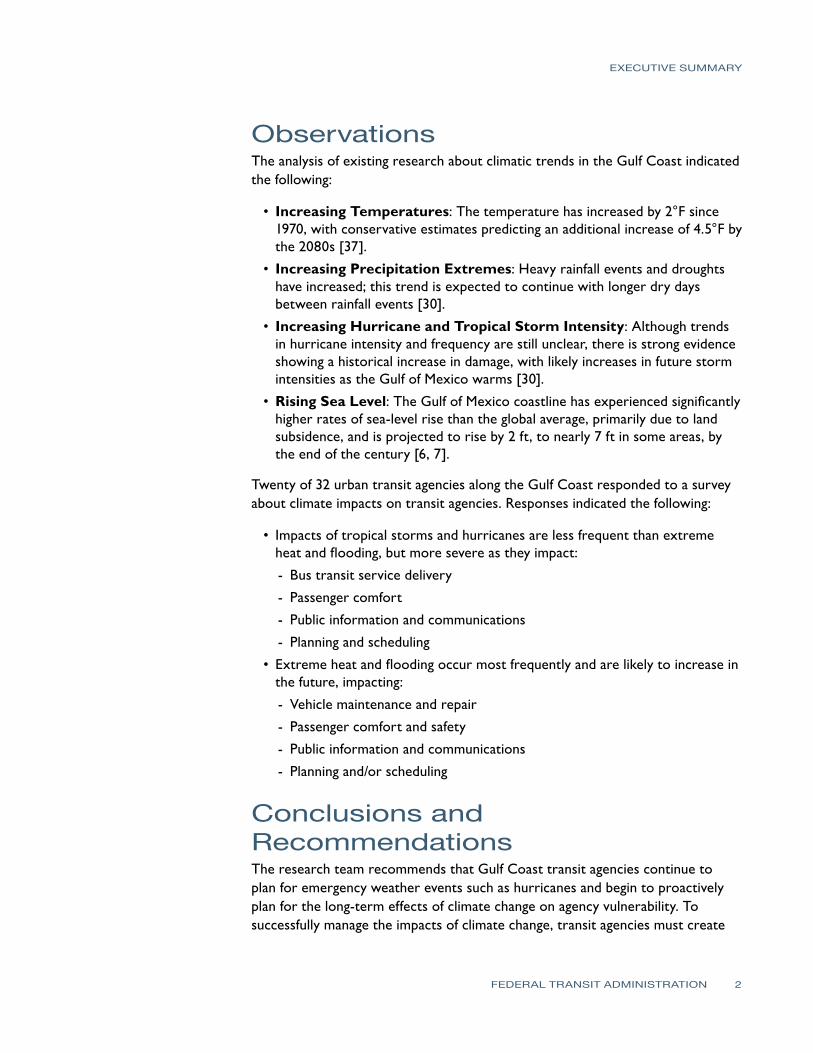
Observations The analysis of existing research about climatic trends in the Gulf Coast indicated the following:
•Increasing Temperatures: The temperature has increased by 2°F since 1970, with conservative estimates predicting an additional increase of 4.5°F by the 2080s [37].
•Increasing Precipitation Extremes: Heavy rainfall events and droughts have increased; this trend is expected to continue with longer dry days between rainfall events [30].
•Increasing Hurricane and Tropical Storm Intensity: Although trends in hurricane intensity and frequency are still unclear, there is strong evidence showing a historical increase in damage, with likely increases in future storm intensities as the Gulf of Mexico warms [30].
•Rising Sea Level: The Gulf of Mexico coastline has experienced significantly higher rates of sea-level rise than the global average, primarily due to land subsidence, and is projected to rise by 2 ft, to nearly 7 ft in some areas, by the end of the century [6, 7].
Twenty of 32 urban transit agencies along the Gulf Coast responded to a survey about climate impacts on transit agencies. Responses indicated the following:
•Impacts of tropical storms and hurricanes are less frequent than extreme heat and flooding, but more severe as they impact:
- Bus transit service delivery
- Passenger comfort
- Public information and communications
- Planning and scheduling
• Extreme heat and flooding occur most frequently and are likely to increase in the future, impacting:
- Vehicle maintenance and repair
- Passenger comfort and safety
- Public information and communications
- Planning and/or scheduling
Conclusions and Recommendations The research team recommends that Gulf Coast transit agencies continue to plan for emergency weather events such as hurricanes and begin to proactively plan for the long-term effects of climate change on agency vulnerability. To successfully manage the impacts of climate change, transit agencies must create
FEDERAL TRANSIT ADMINISTRATION 2
EXECUTIVE SUMMARY
a framework for decision-making that takes into account four major factors: exposure, vulnerability, resilience, and adaptation. Some of the obstacles that will arise when planning for climate change will include, but are not limited to:
• An extraordinarily diverse and decentralized set of public and private actors.
• A common perception that climate change will happen very slowly over time and is thus ignored even in long-range plans despite the fact that impacts are already occurring.
• A high degree of uncertainty regarding climate change, which makes it difficult to accommodate the potential impacts through planning and design of transportation systems.
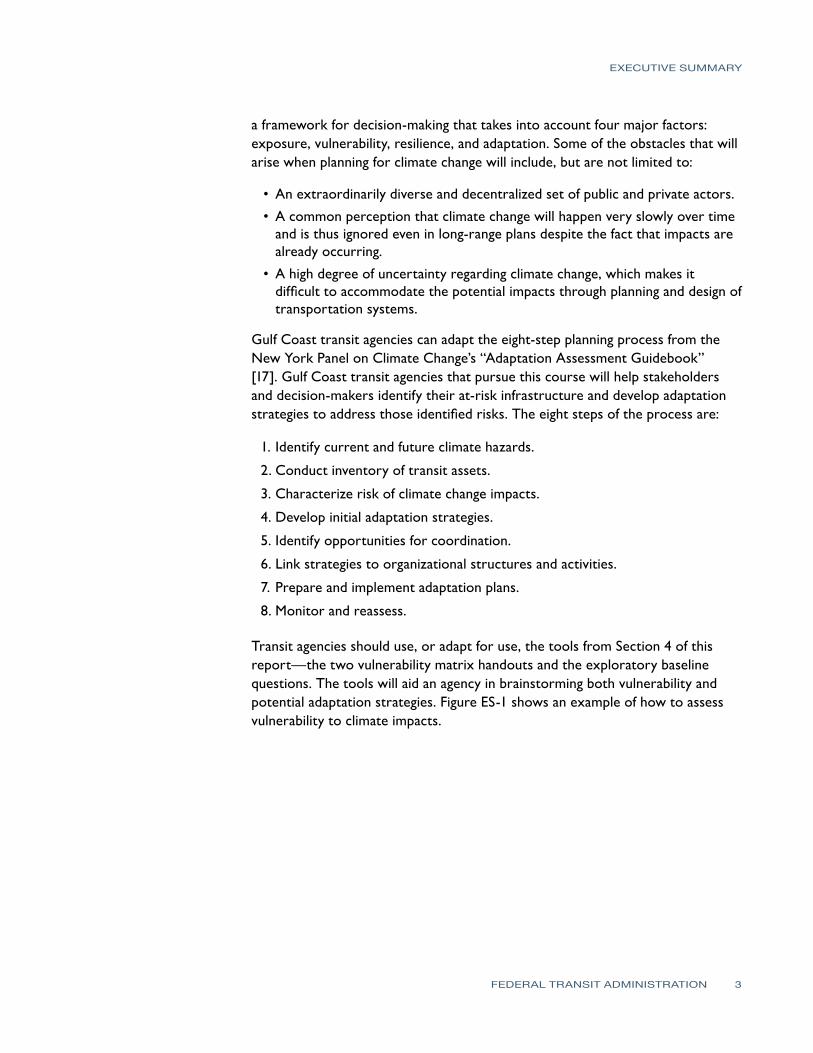
Gulf Coast transit agencies can adapt the eight-step planning process from the New York Panel on Climate Change’s “Adaptation Assessment Guidebook” [17]. Gulf Coast transit agencies that pursue this course will help stakeholders and decision-makers identify their at-risk infrastructure and develop adaptation strategies to address those identified risks. The eight steps of the process are:
1. Identify current and future climate hazards.
2. Conduct inventory of transit assets.
3. Characterize risk of climate change impacts.
4. Develop initial adaptation strategies.
5. Identify opportunities for coordination.
6. Link strategies to organizational structures and activities.
7. Prepare and implement adaptation plans.
8. Monitor and reassess.
Transit agencies should use, or adapt for use, the tools from Section 4 of this report—the two vulnerability matrix handouts and the exploratory baseline questions. The tools will aid an agency in brainstorming both vulnerability and potential adaptation strategies. Figure ES-1 shows an example of how to assess vulnerability to climate impacts.
FEDERAL TRANSIT ADMINISTRATION 3

“”
“”
EXECUTIVE SUMMARY
Lege
nd
1 to 3 “Inconvenient”
4 to 5 “Reduced Capacity”
6 to 7 “Temporary Disruption”
8 Complete
Disruption
9 to 10 Long Term
Disruption
Low risk of occurrence or significant impacts to assets and riders, lowest priority for planning and management attention.
Some disruption and risk to assets and/or riders, some planning and management attention may be needed.
Significant disruption, asset risk, and rider impacts; prior planning, and management attention highly recommended.
Unacceptable, major disruption likely to effect assets, services, and riders; prior planning and management attention required.
Catastrophic risk to assets and services, potential long-term disruption; prior planning and management attention required.
Vulnerability Matrix Negligible (1)
Impact on Agency (i.e., on operations, budget, riders)
Minor (2) Moderate (3) Major (4) Catastrophic (5)
Likelihood
Very High (5) 6 7 8 9 10
High (4) 5 6 7 8 9
Medium (3) 4 5 6 7 8
Low (2) 3 4 5 6 7
Very Low (1) 2 3 4 5 6
Figure ES-1 Vulnerability Matrix
In addition, agencies should consider the lessons learned and adaptations documented in the case studies that comprise Sections 5–7 of this report while considering the following three questions:
• “How are we doing right now?”
• “What more can we do with available resources?”
• “What should our agency do first?”
The “Flexible Adaptation Pathway” depicted in Figure ES-2 accurately describes the iterative planning process. Researchers recommend that Gulf Coast transit agencies pursue a course similar to the green line labeled “Flexible Adaptation Pathway with Mitigation.”
FEDERAL TRANSIT ADMINISTRATION 4

Figure ES-2 Flexible Adaptation
Pathways [20]
EXECUTIVE SUMMARY
Successful climate change adaptation strategies that emerge from this iterative planning process will likely fall into one of the following four categories identified below [19]:
•Maintain and Manage: Absorb increased maintenance and repair costs and improve real-time response to severe events.
• Strengthen and Protect: Design new infrastructure and assets to withstand future climate conditions. Retrofit existing structures and facilities. Build protective features.
• Enhance Redundancy: Identify system alternatives such as increased bus service in the event of rail interruption as well as a broader regional mobility perspective.
•Retreat: Abandon transportation infrastructure located in extremely vulnerable or indefensible areas. Relocate in less vulnerable areas.
Adaptations for Site and Street Flooding Researchers worked closely with staff from Island Transit and HART to synthesize adaptation strategies from their efforts to reduce the impact of site and street flooding due to heavy rainfall. The primary impacts of heavy rainfall induced flooding are reduced passenger comfort, ability to operate normal bus service, and fixed guideway right of way damage. Other challenges include disseminating information to the public and identifying how to plan route alignments that serve public need, take into account geography, and reduce flooding impacts. Examples of adaptation strategies from Island Transit and HART include:
• For routes frequently affected by flooding, identify standard re-routes and acquaint the public with the alternative alignments used if street flooding is present (low cost)
FEDERAL TRANSIT ADMINISTRATION 5

EXECUTIVE SUMMARY
• Establish a method to record site and street flooding impacts to maintenance, facilities, and service delivery for use during future planning processes (low/ medium cost).
• Use operators as eyes on the street; informing community public works departments of blocked storm drains and other drainage issues (low cost). In addition, transit agency management can actively engage in local/regional drainage planning (low cost).
Adaptations for Tropical Storm and Hurricane Recovery The Gulf Coast region experiences the impacts of tropical storms and hurricanes more than any other area of the United States. Researchers worked closely with staff from Houston METRO to synthesize adaptation strategies from METRO’s extensive efforts to mitigate storm impact specifically by preparing for recovery from the impacts of a tropical storm or hurricane. The physical toll to human and physical assets of a region of tropical storms and hurricanes varies widely based on the storm. The primary impacts of these storms include widespread interruption of transit services and potential long-term impact to agency assets. Other challenges include planning (for mitigation and operations), disseminating information to the public, and participating in evacuating vulnerable populations. Examples of adaptation strategies from METRO, specifically for recovery from storms, include:
•Plan for and setup contracts for staff meals, hotels for employee sleep quarters, street clearing equipment and services, and safe parking for the vehicle fleet (all require low, periodic investment to establish and maintain contracts).
• Identify core bus routes that serve emergency medical facilities, evacuation centers, and other critical first-response locations, ensure contracts for route clearing assistance focus on core routes (low cost)
• Arrange to accommodate fueling needs during storm recovery, including fuel reserves and established contracts and practices to maintain fuel availability, as well as the ability to get fuel to wherever vehicle fleet may be located during recovery (low to high cost)
•Identify and disseminate clear information internally and to stakeholders about key personnel during emergency operations and an order of succession in case a key individual becomes unavailable (low annual cost, due to planning)
Using GIS to Assess Transit Asset Vulnerability to Climate Change
Researchers assembled spatial data on various indicators of climate change vulnerability (see Table ES-1) into GIS and developed overall vulnerability scores. Researchers used HART’s operations facility as a case study and found that the facility had a vulnerability score of 45 on a scale of 1 to 100, with 1 being most vulnerable.
FEDERAL TRANSIT ADMINISTRATION 6

Table ES-1 Climate Change Dimensions and Spatial Data Layers
EXECUTIVE SUMMARY
Dimension Spatial Indicator Description
1. Hurricanes Floodplains Distance to FEMA-designated 100-year floodplain boundaries.
Surge Zones Distance to NOAA designated Category 5 surge risk zone.
Property Damage FEMA insured losses from 1998 to 2009.
Distance to Coast Distance to coastline using Bay/Inlet and Sea/Ocean layers from the National Hydrological Dataset.
Wetlands Distance to any wetland type as designated by NOAA’s 2006 land cover dataset.
Distance to Streams Distance to perennial streams as designated by the National Hydrological Dataset.
2. Rainfall Floodplains Distance to FEMA-designated 100-year floodplain boundaries.
Wetlands Distance to any wetland type, as designated by NOAA’s 2006 land cover dataset.
Precipitation Change NCAR projected rate of change in precipitation from 2012 to 2050.
Soil Porosity Measured using SSURGO’s soil hydraulic conductivity field.
Impervious Surfaces Percent imperviousness calculated using NOAA’s 2006 land cover dataset.
Distance to Streams Distance to perennial streams, as designated by the National Hydrological Dataset.
Property Damage FEMA-insured losses from 1998 to 2009.
3. Sea-Level Rise
Coastal Vulnerability Index
Calculated by Thieler and Hammar-Klose’s [12] assessment of sea-level rise (SLR) vulnerability.
Elevation Calculated using NASA’s SRTM30 Digital Elevation Model.
Distance to Coast Distance to coastline using Bay/Inlet and Sea/Ocean layers from the National Hydrological Dataset.
4. Temperature Change Expected Increase NCAR 2000 to 2100 projected temperature increase.
Next Steps for Transit Agencies in the Gulf Coast Region Using the information in this report as a baseline guide, Gulf Coast transit agencies can renew and improve planning for the impacts of finite weather events and long-term climate change. In the words of Michael Leonard, a Senior Planner at Houston METRO, “Planning for a disaster is not a onetime deal, it’s every day.” In fact, examples of adaptation strategies from each of the four categories enumerated above are described in the report as part of case studies of Island Transit, HART, and Houston METRO.
Climate change vulnerability planning and adaptation will increase agency staff capabilities, protect valuable assets, and improve rider safety. While it is true that some weather events and climate trends may present unforeseen or non-preventable damages that lead to unexpected financial or other challenges to agencies, prior climate adaptation planning will reduce the extent and duration of the impact and thus reduce the operating and capital financial implications of impacts.
FEDERAL TRANSIT ADMINISTRATION 7

PART ONE: Getting Started
Part One (Sections 1–4) introduces the purpose of climate change adaptation, climate impacts along the Gulf Coast, a conceptual framework for addressing climate change, and tools for evaluating an agency’s vulnerability (i.e., exposure to risk) to climate impacts.
FEDERAL TRANSIT ADMINISTRATION 8
SECTION
1
Introduction and Purpose
Climate change-related issues place substantial operating and financial burdens on public transit agencies, particularly in coastal settings. Gulf of Mexico coastal transit agencies and their constituents are especially vulnerable to natural hazards resulting from extreme heat, flooding, and high winds. The Federal Transit Administration (FTA) has billions of dollars in assets across the U.S., many of which are threatened by the adverse impacts of climate change. For example, storm-surge-based flooding from Hurricane Ike in 2008 resulted in Island Transit on Galveston Island, Texas, losing 19 of 21 transit buses and 6 support vehicles. The agency also had significant damage to four trolleys, a maintenance facility, and a bus barn. These losses represented $1.6 million in damages, which is about half of the agency’s annual operating expenditures. Transit providers like this one, located in regions near sea level and in areas with poor drainage, are vulnerable to service disruptions from flooding.
While a great deal has been written about the expected impacts of climate change on coastal regions, little work has focused on the implications for transit agencies operating within the Gulf of Mexico coastline. Even less research has been conducted on specific mitigation and adaptation strategies that transit agencies and their partners can implement to reduce the adverse effects of climate change. This report addresses these gaps in the literature and industry practices by summarizing the key issues and challenges transit agencies must address when dealing with potential climate impacts and long-term changes.
Why is Climate Change Adaptation Important to Gulf Coast Transit Agencies? Transit agencies along the Gulf of Mexico coastline share some common geographic and climatic traits. Current climatic conditions in the Gulf Coast expose transit riders and agency assets to climatic risks each year. Common or potential hazards include hurricanes, tropical storms, torrential rainfall, extreme heat, flooding, etc. Transit agencies learn over time how to handle the hazards that affect their service areas. Peer comparison is an important part of the adaptation process for the transit industry. The climate of the Gulf Coast is gradually changing. While it is difficult to know all of the ramifications of climate change 50 or 100 years from now, transit agencies in the Gulf Coast can renew efforts to learn from the past and present to prepare for the future.
FEDERAL TRANSIT ADMINISTRATION 9

SECTION 1: INTRODUCTION
For example, when making very large capital investments in fixed infrastructure, paying extra attention to flood and storm surge mitigation is a good idea.
How Is This Report a Tool for Gulf Coast Transit Agencies? This report is a tool for Gulf Coast transit agencies to use to explore climate change and adaptation specific to their region. The study process that led to this report included the following major tasks:
• Review of literature pertaining to climate change, transit, and adaptation
• Survey of Gulf Coast transit agencies about their experience dealing with climate events
• Case study exploration of how to handle street flooding and site flooding
• Case study exploration of how to handle hurricane/tropical storm planning and recovery
• Creation of a methodology for intensive spatial analysis to identify and compare vulnerability to climate change
• Writing a final report to document and share findings
Each of the remaining chapters in this report is included as a resource and fits in one of five parts:
•Part One (Sections 1–4) introduces the purpose of climate change adaptation, climate impacts along the Gulf Coast, a conceptual framework for addressing climate change, and tools for evaluating an agency’s vulnerability (i.e., exposure to risk) to climate impacts.
•Part Two (Sections 5–6) documents case study analysis of two transit agencies that frequently manage the impacts of heavy rainfall that causes street and/or site flooding.
•Part Three (Section 7) describes the impacts of hurricane/tropical storm activity on the Gulf Coast and provides a case study of practices and adaptations related to hurricane/tropical storm recovery.
•Part Four (Sections 8–10) details a spatial approach to assess climate change vulnerability of transit assets.
•Part Five (Section 11) summarizes observations, recommendations, and conclusions from the study.
FEDERAL TRANSIT ADMINISTRATION 10

SECTION
2
Climate Change Impactson Gulf Coast Transit Agencies
Section 2 provides detailed information about the Gulf of Mexico study area, a summary of transit service and climate impacts in the area (i.e., literature review), and the results of a survey about extreme weather event frequency and impacts completed by 20 Gulf Coast urban transit agencies.
Gulf of Mexico Coastal Study Area The study area consists of more than 144 coastal counties and parishes along the Gulf of Mexico, extending from the Florida Keys westward to the southern tip of Texas, and includes jurisdictions from Florida, Georgia, Alabama, Mississippi, Louisiana, and Texas (see Figure 2-1). The Gulf of Mexico provides an ideal area in which to study ecological risk and flooding for several reasons. First, this low-lying coastal margin is extremely vulnerable to the adverse effects of climate change, particularly associated with meteorological events. For example, data on insured losses from 1996 to 2007 show that jurisdictions bordering the Gulf Coast experienced the largest amount of property damage in the U.S. [2]. Louisiana, which suffered extensively from Hurricane Katrina in 2005, reported the highest amount of property damage, with more than $13.8 billion over a 12-year period, followed by Mississippi ($2+ billion), Florida ($2+ billion), Texas ($1.8+ billion), and Alabama ($793+ million).
Figure 2-1 Coastal Watersheds and Counties that Make Up the Gulf Coast [3]
FEDERAL TRANSIT ADMINISTRATION 11

SECTION 2: OVERVIEW OF PROJECTED CLIMATE CHANGE IMPACTS
Second, jurisdictions fringing the Gulf of Mexico have a legacy of rapid population growth and development of transportation systems and associated infrastructure. Across the study area, high-intensity, older urban cores of Houston, New Orleans, and Tampa contrast with more recent sprawling suburbs around these city centers. A National Oceanic and Atmospheric Administration (NOAA) survey of land use change along U.S. coasts from 1996 to 2001 revealed that 53 percent of new development occurred in the southeast between Texas and North Carolina [3]. Finally, the Gulf study area is a principle target for national policy and planning initiatives to reduce the potential adverse impacts of climate change. Decision-makers can, therefore, directly use the results documented in this report as they work to reduce transit-related vulnerabilities along the coast.
Physical and Natural Environment The Gulf Coast region is in the physiographic province called the southeastern Coastal Plain, characterized as flat and broad with slow-moving streams and sandy or alluvial soils. Due primarily to its sedimentary history, much of this land tends to be near (or below) sea level and is dissected by numerous slow-moving streams and bayous that drain runoff from the Coastal Plain and the adjacent uplands (Figure 2-2). The land area in the Coastal Plains is overlain with sediments deposited during the Holocene epoch (i.e., during the past 10,000 years). The remainder consists primarily of late Cretaceous deposits (65–100 million years old). These sedimentary rocks, deposited mostly in a marine environment, were later uplifted and now tilt seaward [4]. As a result, the Gulf Coast contains many barrier islands and peninsulas, such as Galveston Island (Texas), Grand Isle (Louisiana), and the land between Gulfport and Biloxi (Mississippi). These geological features protect numerous bays and inlets [5].
Figure 2-2 Surface Geology of Southeastern U.S.
(line is extent of Gulf Coastal Plain) [4]
FEDERAL TRANSIT ADMINISTRATION 12

SECTION 2: OVERVIEW OF PROJECTED CLIMATE CHANGE IMPACTS
Erosion, sediment transport and deposition, and changes in elevation relative to mean sea level (i.e., subsidence) are the main land surface processes that interact with climate change and variability in a manner that could adversely affect transportation within the study area. Moreover, Burkett [5] found that erosion is exacerbated by climate-change-related impacts, such as increased water depth, increased frequency or duration of storms, and increased wave energy.
Elevation and Subsidence The majority of the study area lies below 100 ft in elevation and, as a consequence, is prone to flooding during heavy rainfall events, hurricanes, and tropical storms. Moreover, the impact of flooding is compounded in areas experiencing subsidence [4]. Many of the areas within the Gulf Coast are experiencing subsidence, which has resulted in an apparent increase in sea level.
Recent geological and geophysical studies suggest that subsidence is occurring more rapidly than previously thought along the Gulf Coast. That said, the rate of subsidence varies across the area and is driven primarily by differences in geological and human activity [6]. Parts of Alabama, Texas, and Louisiana are experiencing subsidence rates that are much higher than the 20th century rate of global sea-level rise of 1–2 mm/year [7]. For example, the rate of subsidence in the New Orleans area between 1950 and 1995 was about 5 mm/year [8], with some levees, roads, and artificial-fill areas sinking at rates that exceed 25 mm/ year [9]. Due to subsidence, the forced drainage of highly organic soils, and other human development activity, most of the city of New Orleans is below sea level.
The Houston-Galveston region is another area where subsidence, primarily driven by groundwater pumping and oil and gas extraction, has had an adverse impact. Most of the extraction occurred between the 1940s and 1970s, which was marked by an era of rapid growth in the development of groundwater extraction driven primarily by the expansion of the petrochemical industry. As a result, by the end of the 1970s, up to 10 ft of subsidence had occurred, and almost 3,200 mi2 had subsided by more than 1 ft. The growing awareness of subsidence and its associated impacts and increases in coastal flooding resulted in the creation of the Harris-Galveston Coastal Subsidence District, which was authorized as the regulatory agency to restrict groundwater withdrawal and to promote water conservation programs [10].
Due to the increase in flood damage, caused in part by subsidence, the Federal Emergency Management Agency (FEMA) created new Base Flood Elevations maps in 2007. However, the rates of subsidence are so high within the study area that many of these flood maps can be outdated within just a few years, yet it is these maps that form the basis for establishing flood control systems [11].
FEDERAL TRANSIT ADMINISTRATION 13

SECTION 2: OVERVIEW OF PROJECTED CLIMATE CHANGE IMPACTS
Sediment Erosion, Accretion, and Transportation The Gulf Coast shoreline and the interior landforms are shaped due to a highly dynamic set of geomorphic, tectonic, marine, and atmospheric factors. Much of the coastline along the Gulf is classified as “highly vulnerable” to climate change due to the coupling of moderate to very high erosion rates, the relatively low slope (with the exception of areas south of Corpus Christi), and the subsequent high tidal range [12]. The degree of vulnerability is increased only when the removal of wetlands and submerged aquatic vegetation is taken into account. Shoreline retreat via the submergence of land or erosion of the land/water interface is, thus, a very real problem for much of the Gulf Coast, especially during tropical storms or frontal passages. To illustrate this point, Barras [13] estimated that 217 mi2 of land was lost in Louisiana alone during Hurricane Rita and Hurricane Katrina.
Thieler and Hammar-Klose [12] assessed the relative importance of six variables to develop a methodology for measuring coastal vulnerability to sea-level rise for the Gulf Coast region. Their results, expressed as a coastal vulnerability index (CVI), indicated that coastal geomorphology and tide range are the most important variables in determining CVI for the Gulf of Mexico (see Figures 2-3 and 2-4). Wave, height, relative sea-level rise, and coastal slope provide large-scale variability to the CVI, whereas erosion and accretion rates (where complete) contributed the greatest variability to the CVI at short spatial scales. They concluded that large-scale variables must be clearly and accurately mapped and small-scale variables must be understood on a scale that takes into account their geologic and environmental influences to best understand where physical changes may occur.
Figure 2-3 Coastal Vulnerability Index—Relative Vulnerability to Future Sea Level Rise [12]
FEDERAL TRANSIT ADMINISTRATION 14

Figure 2-4 Percentage and
Length of Shoreline by Sea-Level Rise Risk
Category [12]
SECTION 2: OVERVIEW OF PROJECTED CLIMATE CHANGE IMPACTS
Barrier islands are another important geological feature to consider when looking at the potential impacts of climate change along the Gulf Coast. The shape of barrier islands changes slowly due to wind action, wave action, and changes in sea level, including short-term increases associated with storm surge. These islands often serve as a first line of defense for the mainland when tropical storms and hurricanes strike. However, due to their geomorphology, most barrier islands are extremely vulnerable to extreme weather events; for example, barrier islands often lose surface area due to storm or frontal passage erosion. Onshore facilities and development in low-lying coastal areas are increasingly susceptible to inundation and destruction due to extreme weather events and shifts in the overall climate. An example of this phenomenon can be found in Louisiana, where an increase in wave heights in coastal bays is a secondary effect of barrier island erosion, which has increased the erosion rates of shorelines, tidal creeks, and adjacent wetlands [14].
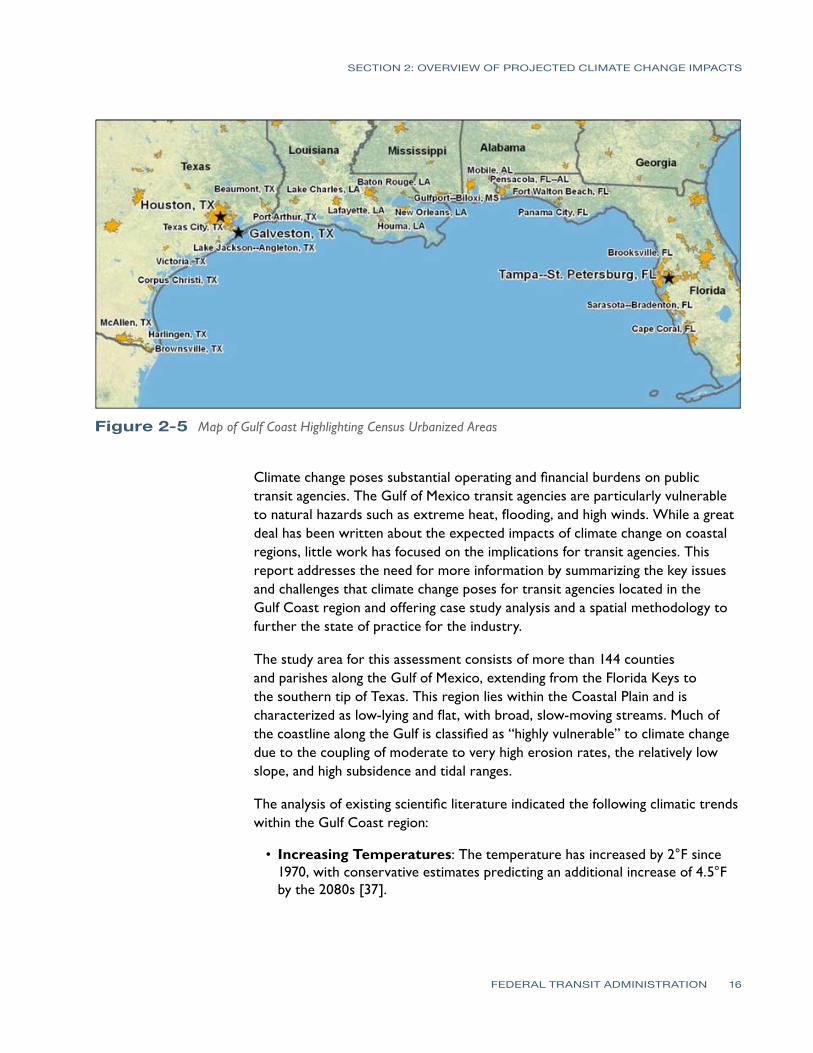
Summary of Transit Servicesand Climate Impacts along the Gulf Coast Thirty-two urban transit agencies provide transit service and have headquarters within 100 miles of the Gulf of Mexico coastline. Numerous rural transit agencies provide service in non-urbanized areas along the coast and extending inland. Figure 2-5 depicts the distribution of the 2010 Census Urbanized Areas in the southeastern United States (black stars mark agencies actively involved in the study).
FEDERAL TRANSIT ADMINISTRATION 15
SECTION 2: OVERVIEW OF PROJECTED CLIMATE CHANGE IMPACTS
Figure 2-5 Map of Gulf Coast Highlighting Census Urbanized Areas
Climate change poses substantial operating and financial burdens on public transit agencies. The Gulf of Mexico transit agencies are particularly vulnerable to natural hazards such as extreme heat, flooding, and high winds. While a great deal has been written about the expected impacts of climate change on coastal regions, little work has focused on the implications for transit agencies. This report addresses the need for more information by summarizing the key issues and challenges that climate change poses for transit agencies located in the Gulf Coast region and offering case study analysis and a spatial methodology to further the state of practice for the industry.
The study area for this assessment consists of more than 144 counties and parishes along the Gulf of Mexico, extending from the Florida Keys to the southern tip of Texas. This region lies within the Coastal Plain and is characterized as low-lying and flat, with broad, slow-moving streams. Much of the coastline along the Gulf is classified as “highly vulnerable” to climate change due to the coupling of moderate to very high erosion rates, the relatively low slope, and high subsidence and tidal ranges.
The analysis of existing scientific literature indicated the following climatic trends within the Gulf Coast region:
•Increasing Temperatures: The temperature has increased by 2°F since 1970, with conservative estimates predicting an additional increase of 4.5°F by the 2080s [37].
FEDERAL TRANSIT ADMINISTRATION 16

SECTION 2: OVERVIEW OF PROJECTED CLIMATE CHANGE IMPACTS
•Increasing Precipitation Extremes: Heavy rainfall events and droughts have increased; this trend is expected to continue with longer dry days between rainfall events [30].
•Increasing Hurricane and Tropical Storm Intensity: Although trends in hurricane intensity and frequency are still unclear, there is strong evidence showing a historical increase in damage with likely increases in future storm intensities as the oceans warm [30].
•Rising Sea Level: The Gulf of Mexico coastline has experienced significantly higher rates of sea-level rise than the global average, primarily due to land subsidence, and is projected to rise by 2 ft, to nearly 7 ft in some areas, by the end of the century. This rise in sea level would effectively increase storm surge to 33 ft or more [6,7].
The projected changes in climatic patterns during the 21st century are likely to have numerous implications for Gulf Coast transportation systems. There is very little existing research that comprehensively describes Gulf Coast transportation infrastructure vulnerability, the potential extent of that exposure, or the potential damage costs. Despite this limitation, some salient figures were found within the literature that add to our understanding of these vulnerabilities:
• Thirty-seven percent of the U.S. population lives within the Gulf Coast region, and that number is expected to increase an estimated 15 percent by 2020, with substantial implications for hurricane-, surge-, and flood-related damages.
• Seven of the 10 largest ports are located on the Gulf Coast, which provide nearly 30 percent of the nation’s crude oil production and 20 percent of its natural gas production, all of which are extremely vulnerable to storm surge.
• An estimated 2,400 miles of major roadway and 246 miles of freight rail lines are projected to be at risk of permanent flooding within the coming decades as a result of sea-level rise.
• Forty-five percent of the country’s flood maps are based on outdated precipitation; as a result, the 100-year flood now occurs much more frequently than expected.
•More frequent and intense heat waves will not only lead to an increase in energy consumption but may also pose a public health concern to vulnerable populations.
There are many obstacles and constraints that must be confronted by transportation decision-makers due to the impacts of climate change. These include, but are not limited to:
• An extraordinarily diverse and decentralized set of public and private actors.
• A common perception that climate change will happen very slowly over time and is thus ignored even in long-range plans, despite the fact that impacts are already occurring.
FEDERAL TRANSIT ADMINISTRATION 17

SECTION 2: OVERVIEW OF PROJECTED CLIMATE CHANGE IMPACTS
• The high degree of uncertainty regarding climate change, which makes it difficult to accommodate the potential impacts through planning and design of transportation systems.
• Transportation planners and engineers have typically used historical data to forecast future trends and conditions that have resulted in an incremental approach to adaptation without acknowledging that the past may not be a reliable guide for making future policy decisions.
Survey of Gulf Coast Transit Agencies about Climate Impacts Researchers surveyed Gulf Coast transit agencies to ascertain the intensity and frequency of the extreme weather events that impact transit agencies and services. The information was used to identify two focus areas for further case study analysis—street flooding due to heavy rainfall and hurricane/tropical storm recovery. Appendix A contains full survey responses from each transit agency. This section synthesizes findings for the Gulf Coast region.
Purpose and Approach Researchers sent a survey to 32 urban transit agencies with headquarters within 100 miles of the Gulf of Mexico coastline. Twenty of these 32 agencies responded to the survey (63%), including at least one agency from each Gulf Coast state. Figure 2-6 depicts the geographic distribution of the responding agencies, and Table 2-1 lists the respondent agencies.
Figure 2-6 Map of Survey Respondents
FEDERAL TRANSIT ADMINISTRATION 18

SECTION 2: OVERVIEW OF PROJECTED CLIMATE CHANGE IMPACTS
Table 2-1 List of Survey Respondents
State Common Name Agency
AL Wiregrass Transit SEARP&DC Wiregrass Transit Authority
FL Citrus Connection Lakeland Area Mass Transit District
FL HART Hillsborough Area Regional Transit
FL LeeTran Lee County Transit
FL PCPT Pasco County Public Transportation
LA CATS Capital Area Transit System
LA Good Earth Transit Terrebonne Parish Consolidated Government
LA LTS Lafayette Transit System
LA RTA New Orleans Regional Transit Authority
MS CTA Coast Transit Authority
TX B Metro Brownsville Metro
TX Connect Transit Gulf Coast Center
TX GCRPC Golden Crescent Regional Planning Commission
TX Island Transit City of Galveston
TX METRO Metropolitan Transit Authority of Harris County
TX PAT Port Arthur
TX Valley Metro Lower Rio-Grande Valley Development Council
Climate Impact on Service Delivery and Physical Assets Researchers asked Gulf Coast transit agencies a series of questions about the intensity and frequency of the extreme weather events that impact delivery of transit service and capital assets of an agency:
•What has been the severity of the impacts of flooding due to heavy rains on different aspects of your agency operations?
•What has been the severity of the impact of a warning of a tropical storm or hurricane on different aspects of your agency operations?
•What was the severity of the impacts of a strike by a tropical storm or hurricane on different aspects of your agency operations?
•What is the severity of the impacts of extreme heat on different aspects of your agency operations?
•What is the severity of the impacts of drought on different aspects of your agency operations?
•What is the severity of the impacts of high winds on different aspects of your agency operations?
In response to each question, respondents used a scale of “0 = No Impact” to “5 = Severe/Catastrophic Impact” to rate impact on the following characteristics of their agency:
FEDERAL TRANSIT ADMINISTRATION 19

SECTION 2: OVERVIEW OF PROJECTED CLIMATE CHANGE IMPACTS
• Bus transit service delivery
• Rail operations
• Vehicle maintenance and repair
• Passenger comfort
• Passenger safety
• Employee safety
• Passenger facilities
• Operations and maintenance facilities
• Fixed-guideway right-of-way
Table 2-2 details the results using an average rating between 0 and 5 (lower numbers indicate lower impact). Hurricane and tropical storm strikes and warnings have the most intense impact; the third most intense impact on agencies is extreme heat.
Table 2-2 Intensity of Extreme Weather Events
Agency Aspects Flood
Warning of Tropical Storm or Hurricane
Hurricane or Tropical Storm
Extreme Heat Drought High
Wind Average # of Respondents
Bus Transit Service Delivery 2.29 3.06 4.50 2.29 0.40 1.92 14
Rail Operations 1.60 1.00 2.50 1.00 0.00 2.00 4
Vehicle Maintenance and Repair 1.46 2.38 2.77 3.00 0.30 1.17 13
Passenger Comfort 2.60 2.38 3.75 3.36 1.73 2.00 13
Passenger Safety 2.44 2.35 3.38 2.43 0.82 2.38 14
Employee Safety 2.27 2.38 3.23 2.43 0.82 1.92 13
Passenger Facilities 2.06 2.06 2.92 2.38 1.00 2.31 14
Operations/ Maintenance Facilities
1.40 1.94 3.38 2.38 1.08 1.46 14
Fixed-Guideway Right-of-Way 2.17 2.33 3.50 1.33 0.83 1.33 5
Average Rating Across Aspects 2.03 2.21 3.33 2.29 0.78 1.83
Average # of Respondents 13 14 11 11 10 10
Notes:
1. The total number of respondents was 20 but varies because agencies marked “Not Applicable” to questions that did not apply to their services.
2. Color coding indicates relative ranking of importance of cells based on survey responses; green = least intense, red = most intense.
FEDERAL TRANSIT ADMINISTRATION 20

SECTION 2: OVERVIEW OF PROJECTED CLIMATE CHANGE IMPACTS
Climate Impact on Other Aspects of Agency Business Researchers also asked Gulf Coast transit agencies a series of questions regarding other impacts of extreme weather events:
•What has been the severity of the impacts of flooding due to heavy rains on other aspects of your agency’s business?
•What has been the severity of the impact of a warning of a tropical storm or hurricane on other aspects of your agency’s business?
•What was the severity of the impacts of a strike by a tropical storm or hurricane on other aspects of your agency operations?
•What is the severity of the impacts of extreme heat on other aspects of your agency operations?
•What is the severity of the impacts of drought on other aspects of your agency operations?
•What is the severity of the impacts of high winds on other aspects of your agency operations?
In response to each question, respondents used a scale of “0 = No Impact” and “5 = Severe/Catastrophic Impact” to rate impact on the following characteristics of their agency’s business practices or services:
• Emergency management team
•Public information and communications
• Planning and/or scheduling
•Evacuation of vulnerable populations
Table 2-3 details the results using an average rating between 0 and 5 (lower numbers indicate lower impact). Again, the results of the survey reveal that the greatest impact comes from hurricane and tropical storm events; however, in this case, the third-most impact is flooding and not extreme heat.
FEDERAL TRANSIT ADMINISTRATION 21

SECTION 2: OVERVIEW OF PROJECTED CLIMATE CHANGE IMPACTS
Table 2-3 Impact on Agency Operation Aspects
Operational Aspects Flood
Warning of Tropical Storm or Hurricane
Hurricane or Tropical Storm
Extreme Heat Drought High
Wind Average # of Respondents
Emergency Management Team
1.88 2.63 3.64 1.64 0.55 0.82 14
Public Information and Communications
2.00 2.71 3.71 1.92 0.82 1.62 14
Planning and/or Scheduling
2.00 3.06 3.71 1.69 0.60 1.15 14
Evacuation of Vulnerable Populations
1.69 2.59 3.57 1.15 0.64 0.40 13
Average Rating Across Aspects 1.89 2.74 3.66 1.60 0.65 1.00
Average Number of Respondents
16 17 14 13 11 12
Notes:
1. The total number of respondents was 20 but varies because agencies marked “Not Applicable” to questions which did not apply to their services.
2. Color coding indicates relative ranking of importance of cells based on survey responses; green = least intense, red = most intense.
Frequency of Extreme Weather Event Impacts The 20 responding agencies also answered questions about how frequently they experience the effects of various types of extreme weather events (including flooding, extreme heat, drought, and high wind). Respondents chose from the following answer choices to indicate how frequently each weather event affects the responding agency:
• Less frequently than once each year
• 1–5 days each year
• 6–10 days each year
• 11–20 days each year
• More than 20 days per year
Figure 2-7 displays the responses about frequency of events. Darker colors indicate more frequent impacts per year.
FEDERAL TRANSIT ADMINISTRATION 22
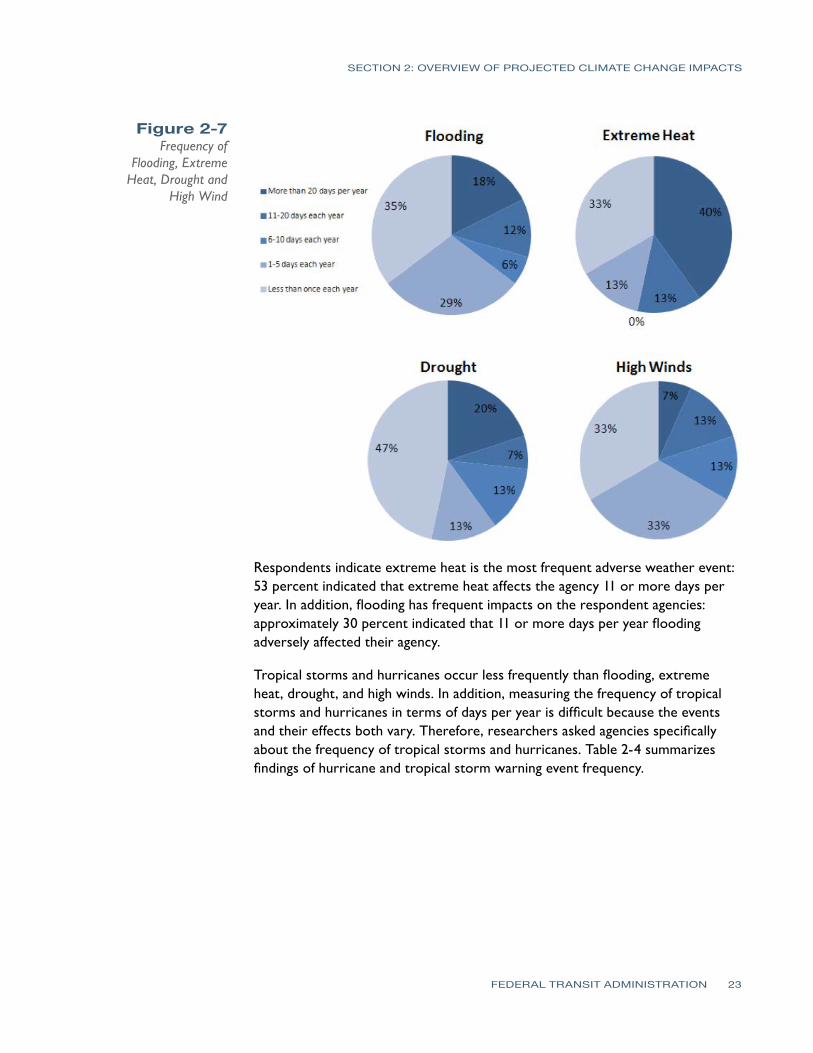
Figure 2-7
Frequency of Flooding, Extreme
Heat, Drought and High Wind
SECTION 2: OVERVIEW OF PROJECTED CLIMATE CHANGE IMPACTS
Respondents indicate extreme heat is the most frequent adverse weather event: 53 percent indicated that extreme heat affects the agency 11 or more days per year. In addition, flooding has frequent impacts on the respondent agencies: approximately 30 percent indicated that 11 or more days per year flooding adversely affected their agency.
Tropical storms and hurricanes occur less frequently than flooding, extreme heat, drought, and high winds. In addition, measuring the frequency of tropical storms and hurricanes in terms of days per year is difficult because the events and their effects both vary. Therefore, researchers asked agencies specifically about the frequency of tropical storms and hurricanes. Table 2-4 summarizes findings of hurricane and tropical storm warning event frequency.
FEDERAL TRANSIT ADMINISTRATION 23

SECTION 2: OVERVIEW OF PROJECTED CLIMATE CHANGE IMPACTS
Table 2-4 Frequency of Hurricane
and Tropical Storm Warnings
Frequency of Warnings of Tropical Storms and Hurricanes Response Percent
Less than once each year 25.0%
1 time per year 25.0%
2 times per year 12.5%
3 times per year 18.8%
4 or more times per year 18.8%
Table 2-4 indicates that 75 percent of the responding agencies experience at least one warning of a tropical storm or hurricane each year. When asked a yes/ no question about tropical storm and hurricane landfalls since 2001, 87 percent indicated they were affected by at least one strike since 2001. Figure 2-8 provides a map of all of the tropical storms and hurricane landfalls since 2001. Some storms make multiple landfalls; every individual landfall is displayed in the figure. Since 2001, there have been 22 tropical storms and 12 hurricanes along the Gulf Coast.
Figure 2-8 Tropical Storm and Hurricane Landfalls
FEDERAL TRANSIT ADMINISTRATION 24

SECTION 2: OVERVIEW OF PROJECTED CLIMATE CHANGE IMPACTS
Summary of Literature Review, Climate Impacts, andSurvey Findings The following list summarizes the results of the literature review, research of historical and projected climate impacts, and the Gulf Coast agency survey:
•Impacts of tropical storms and hurricanes are less frequent than extreme heat and flooding, but are more severe.
• Relevant literature suggests that storms are likely to increase in intensity as a result of warming waters in the Gulf Coast.
•Survey respondents rated tropical storm and hurricane impacts as especially severe as they impact:
- Bus transit service delivery
- Passenger comfort
- Public information and communications
- Planning and/or scheduling
• Both literature review and survey findings suggest that extreme heat and flooding occur frequently now and are likely to increase frequency in the future.
•Survey response indicated extreme heat impacts severe for:
- Vehicle maintenance and repair
- Passenger comfort
- Public information and communications
- Planning and/or scheduling
• A majority of survey respondents indicated flooding impact is severe for:
- Passenger comfort
- Passenger safety
- Public information and communications
- Planning and/or scheduling
-
FEDERAL TRANSIT ADMINISTRATION 25

SECTION
3
Conceptual Frameworkfor AddressingClimate Change
There are many methods of adjusting to climate change impacts. Every transit agency along the Gulf Coast experiences, on occasion, extreme weather events of one type or another. Some years seem mild and may lull agencies into a false sense of safety and low risk. Other years may bring several extreme weather events that stir an agency into action to minimize damage to services and assets.
What is to be done? How can Gulf Coast transit agencies evaluate their potential losses and risks due to gradual climate changes? Climate change occurs over decades and may result in unexpected outcomes, such as magnifying the impacts of infrequent, extreme weather events (e.g., hurricanes) and simultaneously changing the frequency of mild but common impactful weather events (e.g., heavy rainfall or extreme heat). Climate change may alter the frequency and intensity of weather events in unexpected ways.
Section 3 is a conceptual framework for addressing climate change and includes information organized into five sections:
• Evaluating Risk: Exposure, Vulnerability, Resilience, and Adaptation
• Adaptation Assessment Steps
• Adaptation Strategies
• Transportation and Land Use Planning
• Opportunities for Building Adaptive Capacity
Evaluating Risk: Exposure, Vulnerability, Resilience, andAdaptation There are four major factors concerning climate change in transportation: exposure, vulnerability, resilience, and adaptation. In this case, exposure “is the combination of stress associated with climate change,” such as sea-level rise, changes in temperature, and frequency of intense storm surge, with the probability that these stressors will affect transportation infrastructure [15]. Vulnerability is the “potential for loss” due to exposure to a certain hazard. In the context of climate change, resilience refers to the speed of response and
FEDERAL TRANSIT ADMINISTRATION 26

SECTION 3: PRIORITIZING CLIMATE CHANGE IMPACTS AND SERVICES
recovery to system elements, mitigation efforts, and adaptation efforts; this generally encompasses the biogeophysical, social, and political factors. Adaptation in reference to climate change is the natural or anthropogenic adjustment response to actual or expected climate projections [16].
There are several types of exposure but, in the case of climate change effects on the Gulf Coast, only two types are applicable: perceived and predicted. For the central Gulf Coast region, certain environmental impacts appear to be the most relevant, depending on the location and specific component of the infrastructure affected: sea-level rise with its historical patterns and projected ranges, temperature range with distribution functions, precipitation ranges with distribution functions and intensity, and storm surge with intensities and distribution frequencies.
Vulnerability of a system or facility depends on the level of exposure. When determining vulnerability to a transportation system, the magnitude, range of climate exposure, system’s sensitivity, and its adaptive capacity must be considered [16]. On the Gulf Coast, climate change vulnerability will involve assessing structural strength of assets, the integrity of the systems or facilities, and the disruption to the transportation services. Crucial factors for determining an infrastructure’s vulnerability are age of the infrastructure, condition of the infrastructure, proximity to other infrastructures, and the level of service.
Resilience applies to climate change in terms of regenerative capacity. Resilience for a transportation network can be used to maintain adequate performance levels for mobility of goods and services through redundant infrastructure and services. If one component is out of service, it may not be critical that it be fixed immediately if other methods of transportation are available. Factors to consider with resilience are repairing and the cost to repair structures, economic and social resources, and the system level. Transportation planners already use these factors of resilience when building, but further planning for resilience must be implemented.
Adaptation to climate change requires a transportation system and associated human resources to adjust to changing conditions. Adaptive strategies can be divided into three possible alternatives: protect, accommodate, and retreat. Protection refers to placing hard structures (seawalls) or soft structures (natural wetlands) near the coast to prevent flooding during intense storm surges or precipitation. Accommodation may refer to the preparation for evacuation during floods or intense storms. Retreat refers to complete abandonment of a structure under certain conditions.
FEDERAL TRANSIT ADMINISTRATION 27

SECTION 3: PRIORITIZING CLIMATE CHANGE IMPACTS AND SERVICES
Adaptation Assessment Steps The New York Panel on Climate Change produced a technical document in 2010 titled “Adaptation Assessment Guidebook” and included it as an appendix in their report “Climate Change Adaptation in New York City: Building Risk Management Response” [17]. This document discusses a multi-step process intended to help stakeholders and decision-makers identify their at-risk infrastructure and develop adaptation strategies to address those identified risks. The steps are designed to be incorporated into the risk management, maintenance and operations, and capital planning processes of the agencies and organizations that manage and operate critical infrastructure. These steps are summarized below.
Step 1. Identify current and future climate hazards. The first step that must happen when creating an adaptation plan is to identify the potential impacts of climate change. This should take into account the observed climate and existing vulnerabilities that currently affect infrastructure and operations as well as the projections; however, projections should be revised regularly as data become available and as climate science progresses.
Step 2. Conduct inventory of transit assets. The goal of this step is to assess how climate change might impact transit infrastructure and to begin to incorporate climate change information into existing operational and capital planning processes. During this step, inventories on infrastructures that are potentially at risk to climate change are assembled. These inventories should include existing information of infrastructure that has been made available while considering what types of weather events are already affecting them physically and operationally. The inventory should be reassessed as appropriate to reflect changes in environmental conditions, climate change science, adaptation technologies, operations, and/or the physical condition of an asset.
Step 3. Characterize risk of climate change impacts. This step takes the probability of a particular risk from climate change occurring and multiplies it by the magnitude of the impact. This information is collected in a risk matrix (Figure 3-1) that is used to determine the priority of developing and implementing climate adaptation strategies. The matrix outlines the:
• Likelihood of Impact Occurrence—the likelihood that a given climate variable will result in infrastructure impacts over its useful lifespan.
• Magnitude of Consequence—the combined impact of the occurrence should a given hazard occur.
FEDERAL TRANSIT ADMINISTRATION 28

SECTION 3: PRIORITIZING CLIMATE CHANGE IMPACTS AND SERVICES
Figure 3-1 Two-Dimensional Risk
Matrix [17]
Section 4 contains two vulnerability matrix tools (i.e., handouts) for use by Gulf Coast transit agencies at this step of the process.
Step 4. Develop initial adaptation strategies. In this stage, transit agencies and partners develop and assess strategies to reduce the vulnerability of transit assets and operations to climate impacts. Adaptation strategies should be evaluated based on cost and timing. Costs should include the general costs to implement the strategy and the savings from avoided impacts. The timing of implementation should be considered relative to the timing of the impacts (i.e., if the timing of the impact is comparable to the time required for implementation, there is an immediate need for considerations). Once completed, this step will provide the information needed to categorize strategies by transit agency function (i.e., maintenance and operation, capital investments, and regulation) and evaluate the order in which they should be implemented.
Step 5. Identify opportunities for coordination. Adaptation planning must not be done in isolation. For an adaptation plan to be successful, it must include and leverage the knowledge across sectors and disciplines. Coordination can yield many benefits that include, but are not limited to, lowering of costs, more focused implementation on strategies that could benefit multiple stakeholders, the avoidance of politically charged issues, and the maximization of resources and knowledge. Coordination is especially important for transit decisions due to the complexity and interconnectivity of its infrastructure.
Step 6. Link strategies to organizational structures and activities. Climate change will likely affect the full range of transit agency departments and activities, which include operations, maintenance, planning, environmental
FEDERAL TRANSIT ADMINISTRATION 29
SECTION 3: PRIORITIZING CLIMATE CHANGE IMPACTS AND SERVICES
review, design, construction, and emergency preparedness [18]. This means that particular attention must be paid to streamlining climate adaptation strategies and promoting awareness throughout an agency’s department so as to avoid the duplication of efforts and improve efficiency. An effective way to do this is to embed the climate adaptation plan within the agency’s asset management system, which will help integrate climate adaptation with capital plans, rehabilitation cycles, and budgets [18].
Step 7. Prepare and implement adaptation plans. At this point, transit agencies should compile the identified strategies into a fully-developed comprehensive adaptation plan that includes timeframes for implementation and identification of opportunities for coordination. Plans typically include, but are not limited to:
• adaptation strategies
• specifics necessary to implement strategies
• resources committed to implement the strategies
• timeline for implementation
• metrics to measure success
Project planning may also include economic cost-benefit analyses, financial analysis, environmental impact statements, and equity and environmental justice considerations.
Step 8. Monitor and reassess. Transit agencies must regularly monitor, reassess, and update the adaptation plan to assure that it is meeting the intended objectives and to re-examine key factors affecting it. Factors that need to be considered when monitoring and reassessing include:
• Availability of improved climate data
• New information on infrastructure impacts
• New information on changing asset conditions
• New adaptation measures
• Changing demographic factors [17]
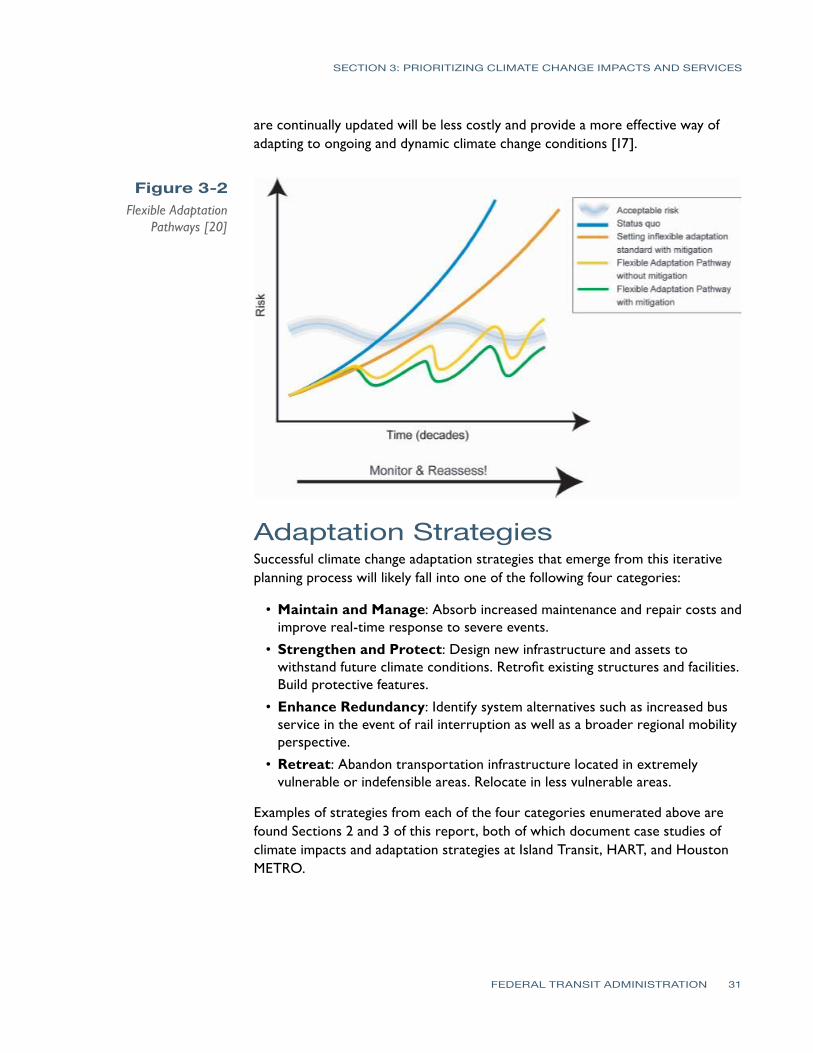
Flexible Adaptation Pathway These steps should result in the creation of a flexible adaptation pathway that acknowledges and defines strategies in terms of acceptable risk levels, and is re-evaluated over time, rather than using an approach that sets inflexible standards prematurely. Figure 3-2 illustrates how climate change adaptation results in one of several flexible adaptation pathways. Flexible standards that
FEDERAL TRANSIT ADMINISTRATION 30
SECTION 3: PRIORITIZING CLIMATE CHANGE IMPACTS AND SERVICES
are continually updated will be less costly and provide a more effective way of adapting to ongoing and dynamic climate change conditions [17].
Figure 3-2 Flexible Adaptation
Pathways [20]
Adaptation Strategies Successful climate change adaptation strategies that emerge from this iterative planning process will likely fall into one of the following four categories:
•Maintain and Manage: Absorb increased maintenance and repair costs and improve real-time response to severe events.
•Strengthen and Protect: Design new infrastructure and assets to withstand future climate conditions. Retrofit existing structures and facilities. Build protective features.
•Enhance Redundancy: Identify system alternatives such as increased bus service in the event of rail interruption as well as a broader regional mobility perspective.
•Retreat: Abandon transportation infrastructure located in extremely vulnerable or indefensible areas. Relocate in less vulnerable areas.
Examples of strategies from each of the four categories enumerated above are found Sections 2 and 3 of this report, both of which document case studies of climate impacts and adaptation strategies at Island Transit, HART, and Houston METRO.
FEDERAL TRANSIT ADMINISTRATION 31

SECTION 3: PRIORITIZING CLIMATE CHANGE IMPACTS AND SERVICES
Transportation and Land Use Planning The most effective approach to limit the impact of climate change is to avoid placing people and infrastructure in vulnerable places (e.g., coastal areas). As mentioned, the Gulf Coast has experienced, and will continue to experience, development pressures despite the increased risk of flooding and damage from surge and hurricanes. Development and infrastructure are difficult to remove once they are in place. The inflexibility of infrastructural systems poses serious issues within the context of climate change, especially with regard to emergency planning. As development continues in vulnerable areas, more communities and businesses will be at risk, thus increasing the challenges associated with evacuation from major storms [21]. Transportation planners often fail to consider development patterns when making investment decisions. This is because public sector transportation planners typically model future travel demand and the need for new facilities by forecasting expected land use patterns over a 25- to 30-year period [22].
This process does not recognize the external consequences of building such facilities, with very few cases of planners considering the effects of climate change on facility location and the resulting land development [23]. Governance structure is one of the main reasons there exists a disconnect between transportation investment decisions and land use planning. Large-scale transportation infrastructure investments are the responsibility of states, regional authorities, and the private sector, whereas land use decisions are made by local governments and a few states (e.g., Florida and California) through comprehensive plans and zoning [24]. Local governments, more often than not, have a far too limited perspective to plan for climate change due to their primary interest in job creation and economic development. As a result, many local governments are constantly grappling with the problems associated with uncontrolled growth (e.g., crowded schools and roads). Some localities have begun to integrate transportation and land use planning in light of smart growth policies, which recognize the feedback loops between transportation investments and regional development and economic growth. Unfortunately, this method of planning is very uncommon [21].
Opportunities for BuildingAdaptive Capacity A report by the National Research Council (NRC) [21] provides a comprehensive list and discussion of ways to improve adaptive capacity for transportation decision-makers. The following is a summary.
FEDERAL TRANSIT ADMINISTRATION 32

SECTION 3: PRIORITIZING CLIMATE CHANGE IMPACTS AND SERVICES
Operational Responses As the climate changes and weather events become more extreme, operational responses will become more routine and proactive than they are today. This will primarily underscore the importance of emergency response plans in vulnerable locations and require transportation providers to work closely with weather forecasters and emergency planners. Such a process will increase the importance of more accurate and real-time weather prediction and communication of storm warnings. Better information will not only help with the evacuation of vulnerable populations, but will also aid transit agencies in providing the personnel and equipment necessary to protect their own assets.
Design Strategies Operational responses address near-term impacts of climate change, whereas design strategies (e.g., rehabilitation or retrofitting) require transportation planners and engineers to consider the impacts of climate change 50 or more years into the future. These types of strategies will require reevaluation, development, and continual updating of design standards that will guide infrastructure design. Leadership by the scientific community and professional associations, along with a federally-sponsored research program, will be essential in developing these standards in a timely manner.
An example of this process occurred in the wake of Hurricane Katrina The Federal Highway Administration (FHWA) recognized the inadequacy of current design standards for coastal highway bridges and approved and shared in the cost of rebuilding damaged bridges to a higher design standard. Moreover, it recommended the development of bridge design standards more appropriate for coastal environments by taking into account storm surge and wave action. The American Association of State Highway and Transportation Officials (AASHTO) is leading the effort to develop a new consensus standard.
Scenario Planning Scenario planning provides “envelopes” of possible outcomes, allowing planners to better understand best case/worst case scenarios and respective probabilities. At the local level, some metropolitan planning organizations (MPOs) have begun to adopt this scenario analysis in developing their long-range transportation investment plans. This enabled them to provide local communities with a framework within which “to better understand the impacts of growth and the difficult trade-offs among social, economic, and environmental goals in planning future transportation investments.” At the end of the process, one scenario, or a combination of them, is chosen as the desirable option.
Scenario planning, coupled with the use of a geographic information system (GIS), can be leveraged to analyze the impacts of potential climate change on regional
FEDERAL TRANSIT ADMINISTRATION 33
SECTION 3: PRIORITIZING CLIMATE CHANGE IMPACTS AND SERVICES
transportation infrastructure. An example of this might include the overlaying of maps showing current elevations and projected sea-level rise to illustrate the risks of existing infrastructure and allowing development to continue in vulnerable coastal area. Climate scientists and regional experts could help the planning process by identifying plausible impact scenarios.
Technological Advancement More accessible, advanced, and usable technology would enable transportation decision-makers to monitor climate change and receive advance warnings of potential failures due to external forces that exceed what the infrastructure was designed to withstand. This type of approach provides an alternative to preventive retrofitting and costly reconstruction of some facilities. Other types of technological advancements in sectors such as material engineering will likely complement monitoring. For example, heat-resistant materials could help prevent pavements from failing under prolonged exposure to heat.
The use and development of “smart” devices will continue to become a very promising way to monitor changing climate conditions and communicate results to transit agencies as future advances occur. Moreover, better materials will enable the development of new transportation infrastructures that have higher stress thresholds.
Spatial Analysis and Decision-Support Tools Obtaining relevant and sufficiently-detailed climate change information and data are critical for transportation decision-makers to take appropriate actions in a timely manner. There is strong scientific consensus and understanding of climate change; however, techniques for using this knowledge to support decision-making and formulate mitigation and adaptation strategies is much less developed. Most projections regarding climate change are collected and compiled at the global level; however, transportation planners and agencies will need data at much higher spatial and temporal resolutions to see how climate change will impact transit assets at a regional and local level.
The NRC acknowledged the following as being necessary tools for decision-makers [21]:
• Accurate digital elevation maps in coastal areas for forecasting the effects of flooding and storm surge heights.
•GIS that can be used to map the locations of critical transportation infrastructure overlaid with information on climate change effects (e.g., sea-level rise, warming temperatures).
• Greater use of scenarios that include climate change in the development of long-range transportation plans to pinpoint likely vulnerabilities and ways to address them.
FEDERAL TRANSIT ADMINISTRATION 34

SECTION 3: PRIORITIZING CLIMATE CHANGE IMPACTS AND SERVICES
• Better transportation network models for examining the system-wide effects of the loss of critical transportation infrastructure links.
Institutional Arrangements and Collaboration The impacts of climate change do not follow political or jurisdictional boundaries; however, most decision-making is structured around them. Thus, existing institutional arrangements are not well-suited to address climate change. Arrangements that are cross-jurisdictional and more closely reflect the scale of impact are necessary to address adverse effects, such as sea-level rise, drought, and hurricanes. The NRC states that “incentives incorporated in federal and state legislation should be considered as a means of addressing and mitigating the impacts of climate change through regional and multistate efforts” [21]. Such incentives would ensure the development of such organizational arrangements. One suggestion from the NRC is the use of Floodplain Insurance Rate Maps (FIRMs) to identify geographic areas vulnerable to climate change and formulate policies for restricting the development of transportation infrastructure in the identified areas [21].
FEDERAL TRANSIT ADMINISTRATION 35

SECTION
4
Tools for Assessing Climate Change Impact
Section 3 provided information about a conceptual framework for an eight-step process to address climate change:
1. Identify current and future climate hazards.
2. Conduct inventory of transit assets.
3. Characterize risk of climate change impacts.
4. Develop initial adaptation strategies.
5. Identify opportunities for coordination.
6. Link strategies to organizational structures and activities.
7. Prepare and implement adaptation plans.
8. Monitor and reassess [17].
This section, Section 4, provides two types of tools to Gulf Coast transit agencies: (1) a set of two vulnerability matrix evaluation instruments and (2) sets of exploratory questions by subject. The vulnerability matrices apply in steps 1 and 3 of the eight-step process listed above. The exploratory questions by subject may prove useful to Gulf Coast agencies at any step, but especially steps 2, 4, 5, and 6.
Part Four of this report contains a detailed methodology to assess climate change vulnerability using GIS data and analysis, which is useful during steps 1, 2, and 3 of the eight-step process.
Climate Change VulnerabilityAssessment Matrices Transit agencies along the Gulf of Mexico coastline share some common geographic and climatic traits. Transit agency staff work in varying departments and possess unique perspectives about the impact of climate on the agency. Peer comparison is an important part of the adaptation process for the transit industry. Researchers reviewed numerous examples of tools and graphics used by other industries and some transit agencies to assess vulnerability to the impacts of climate change.
FEDERAL TRANSIT ADMINISTRATION 36

SECTION 4: STRENGTHENING RESILIENCE THROUGH ADAPTATION
The following several pages contain two Climate Change Vulnerability Assessment Tools for transit agencies to use to begin to explore their vulnerability to climate change:
• Agency system-wide evaluation
• Specific assets, services, or rider category
Agency System-wide Evaluation Use the form provided in Figure 4-1 as part of an exercise with agency staff to create an initial evaluation of your agency’s vulnerability to extreme weather events in the past and present. For best results, distribute the form to staff from a variety of departments, complete individually, and then discuss the results as a group.
1. Think about each type of weather event while considering the following questions:
- “What is the likelihood of this event affecting our agency?”
- “How much of an overall impact would an occurrence have on our agency?”
2. Find the 0 to 5 rating for both likelihood and impact and record them in the form.
3. Calculate your agency’s vulnerability rating by adding the likelihood and impact ratings.
It is important for transit agencies to engage members of varying internal departments and key stakeholder groups to evaluate the relative importance of planning to mitigate and adapt to varying types of extreme weather events. The blank lines at the bottom of the form are present for a purpose; ideas for additional event types, or maybe gradual occurrences, include land subsidence, sea-level rise, etc. What other types of events or climate changes impact your agency? Add them to the list and rate their likelihood and impact.
Figure 4-2 is an example of one completed worksheet based on discussion between the authors and management at Island Transit in Galveston. The Microsoft Excel file of Figure 4-1 can be found here.
FEDERAL TRANSIT ADMINISTRATION 37

Figure 4-1 Agency Vulnerability
Snapshot Tool
SECTION 4: STRENGTHENING RESILIENCE THROUGH ADAPTATION
FEDERAL TRANSIT ADMINISTRATION 38

Figure 4-2 Agency Vulnerability
Snapshot Tool— Island Transit
Example
SECTION 4: STRENGTHENING RESILIENCE THROUGH ADAPTATION
FEDERAL TRANSIT ADMINISTRATION 39

SECTION 4: STRENGTHENING RESILIENCE THROUGH ADAPTATION
Specific Assets, Services, or Rider Category The next step after assessing climate change vulnerability is to take a closer look at core assets, services, or rider categories. Taking a closer look at aspects of a transit agency’s business is important to begin to understand the fiscal and social capital vulnerability. Researchers encourage Gulf Coast transit agencies to use the form provided in Figure 4 3 as part of a process to evaluate climate change vulnerability of core aspects of their agency.
1. Think about each type of weather event while considering the following questions:
a. “How likely is this weather event to occur and affect this [subject]?”
b. “How severe are the consequences of this climate event on this [subject]?”
2. Find the 0 to 5 rating for both frequency/likelihood and impact and record them in the form.
3. Calculate the [subject]’s vulnerability rating by adding the two 0–5 ratings and recording it.
The blank lines at the bottom of the form are present for a purpose—ideas for additional event types, or maybe gradual occurrences, include land subsidence, sea-level rise, etc. What other types of events or climate changes affect the [subject] at your agency? Add them to the list and rate their frequency/likelihood and impact.
Figure 4-4 is an example of a completed worksheet based on discussion between the authors and management at Island Transit about their trolley maintenance facility that was damaged by Hurricane Ike when a high storm surge inundated the structure and vehicles stored on-site (previously thought to be safe from storm surge). The Microsoft Excel file of Figure 4-3 can be found here.
FEDERAL TRANSIT ADMINISTRATION 40
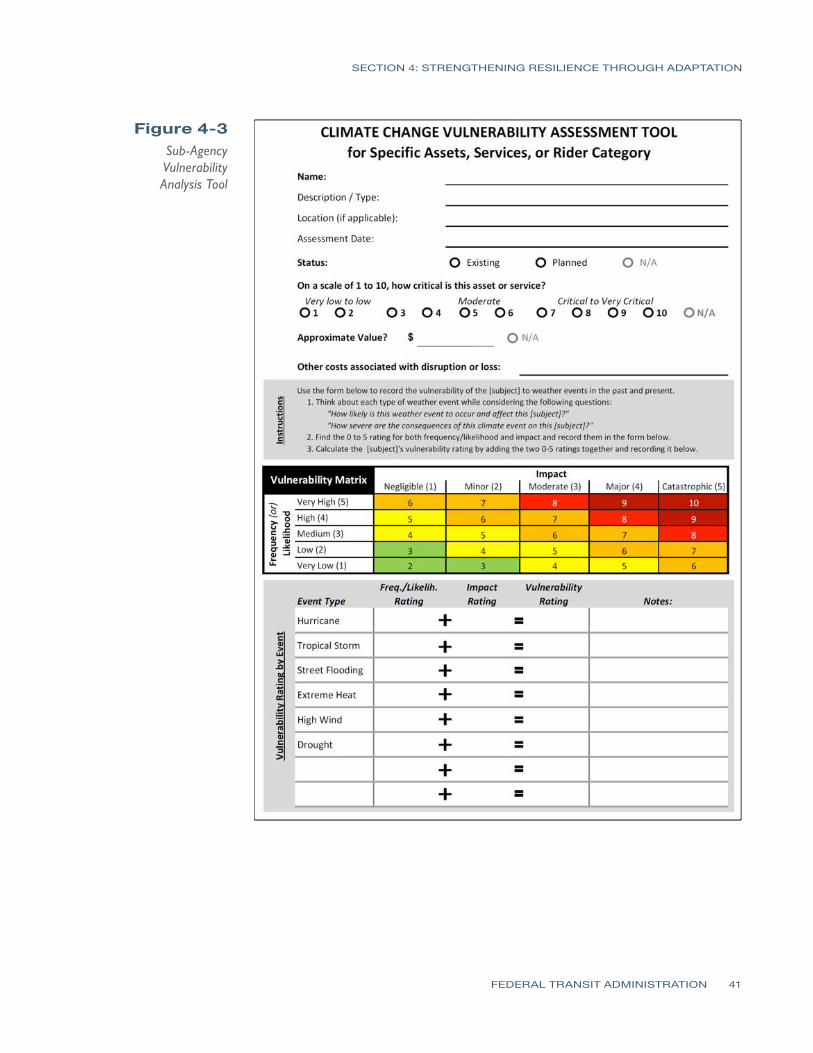
SECTION 4: STRENGTHENING RESILIENCE THROUGH ADAPTATION
Figure 4-3 Sub-Agency Vulnerability Analysis Tool
FEDERAL TRANSIT ADMINISTRATION 41

SECTION 4: STRENGTHENING RESILIENCE THROUGH ADAPTATION
Figure 4-4 Sub-Agency Vulnerability
Analysis Tool— Island Transit
Example
FEDERAL TRANSIT ADMINISTRATION 42
SECTION 4: STRENGTHENING RESILIENCE THROUGH ADAPTATION
Baseline Assessment Questions by Subject Area Transit agencies have inadvertently included planning for climate impacts for decades as transit service planners respond to storms, as risk managers seek to limit financial or legal exposure, and as cities and regions plan for natural disasters and evacuations. Evaluating climate change vulnerability is applying that expertise to evaluate agency-wide vulnerabilities and then vulnerabilities at specific key sites, services, etc. Climate change vulnerability and adaptation look at both the impact of finite weather phenomena and dynamic long-term climate patterns. Few, if any, transit agencies in the Gulf Coast will be flush with dollars to mitigate vulnerabilities that require significant capital investment. Such investments require planning to ensure effective use of resources and that all necessary stakeholder partnerships are in place. Consider the following questions while thinking about climate change vulnerability (i.e., weather events, sea-level rise, storm intensity change):
• “How are we doing right now?”
• “What more can we do with available resources?”
• “What should our agency do first?”
Transit agencies mitigate the impacts of climate change as they incorporate climate considerations into all areas of their agency’s operation. This is not to say that climate change is the only important consideration—far from it. Climate change and extreme weather events should be one purpose for planning and adaptation; examples of other purposes may include safety, security, comfort, convenience, service utility, congestion mitigation, access to education, etc. Common types of plans or documents that do or can pertain to climate change adaptation at Gulf Coast transit agencies include, but are not limited to, the following:
• Emergency management plans
• Risk improvement plans
• Catastrophe risk analysis
• Sustainability plans
• Continuity of operations plans
• Food service disaster plans
• Metropolitan transportation plans
• Corridor alternatives analysis
• Local or regional flood plain management plans
FEDERAL TRANSIT ADMINISTRATION 43

SECTION 4: STRENGTHENING RESILIENCE THROUGH ADAPTATION
The following sections provide examples of the types of questions agency staff and stakeholders might consider or use while seeking to reduce vulnerability to climate change and extreme weather events. Researchers used these questions, and others, to gather information from the three partner transit agencies when conducting the case study analysis detailed in Parts 2 and 3 of this report. The questions listed on the next few pages are not the only potential, important questions to consider, but they may be valuable in aiding transit agencies of the Gulf Coast to establish a baseline from which to delve deeper into their local circumstances and needs. For example, if your agency is looking to evaluate vulnerability for specific types of climate change impacts based on vulnerability matrix brainstorming results, then it would be prudent to begin by assessing “How are we doing right now?”
The research team sought information from partner agencies specifically for street flooding and hurricane/tropical storm recovery; questions may inadvertently focus on those two areas. Questions are presented for the following aspects of transit service delivery and management (order is not significant):
• Service planning
• Service delivery, maintenance, and operations
• Facilities and infrastructure
• Communications
• Police, security, safety, and risk management
Service Planning • What is the planning department’s role in the recovery effort (during and
after) [_____]?
• In current planning documents, what was incorporated based on lessons learned from prior [_____]?
• How did your agency handle the before, during, and after of the one or two most recent extreme weather events in your area?
• How do you manage staffing needs during [_____]?
• Do you estimate the cost of reroutes and decreases in passengers (e.g., loss of fare revenue or additional person-hours)?
• Have you identified priority routes and services to re-establish first? How did you identify those routes and services?
• How does your agency assess damages? Who conducts the assessment? If a team, does the team include members from all pertinent departments? Does the team make the assessment as a unit or do individual departments make their own assessment?
FEDERAL TRANSIT ADMINISTRATION 44

SECTION 4: STRENGTHENING RESILIENCE THROUGH ADAPTATION
•Do you possess necessary data to understand operational and cost implications of climate impacts, such as a tropical storm or street flooding?
• What routes are impacted the most by [_____]?
• Has planning looked at revising routes entirely due to frequent risk of [_____]?
•How do extreme impacts, such as disruptions to service, affect data reporting accuracy and performance measurement?
• How does your agency use passenger amenities to alleviate the impacts of [_____]?
Service Delivery, Maintenance, and Operations • What is maintenance staff role in the recovery effort (during and after)
[_____]?
• How are staff used during [_____] events or afterward during recovery?
• Do all relevant departments understand their role during [_____] events or afterward during recovery?
• How are assets tracked or monitored (e.g., with vehicles being moved to different locations of the area)?
• How are activities/expenses documented and reported for FEMA reimbursement?
• How are contractor vehicles/maintenance monitored? Are there requirements in the contract for recovery procedures?
• Do you have a spare ratio set in place specifically for natural disasters?
•Historically, what level of maintenance (both in terms of cost and time) has been needed after [_____]?
• Advance announcement of a reroute vs. unanticipated street flooding where normal route is underwater—who, how, what happens, and who communicates with whom? What are the policies for determining when drivers should reroute during street flooding events?
• What is your agency’s policy or practice during days of heavy rainfall?
• How does [_____] affect each type of service your agency operates?
•Who assesses conditions and determines when and how services are restored to partial and then normal operation?
• What are policies/practices for Americans with Disabilities (ADA) passengers whose home or location is not accessible due to high water?
• How does your agency support stakeholders during an evacuation?
• Does your agency use a vehicle maintenance information system?
• Can you isolate damage or mechanical failures resulting from [_____]?
• Does your agency have contingency funds for costs due to unexpected impacts?
FEDERAL TRANSIT ADMINISTRATION 45
SECTION 4: STRENGTHENING RESILIENCE THROUGH ADAPTATION
• What are the preventive maintenance procedures? Do these procedures require inspection of items that could have been negatively impacted by [_____]?
Communications • What is the communications department’s role during [_____]? During
recovery?
• What staffing level does the communications department maintain? During recovery? Are additional labor hours tracked and reported to FEMA?
• What is the primary method for communicating the transit services information to the public? During inclement weather?
• How does the communications department use social media? Other mediums?
• Think about the several most recent [_____]. What lessons were/can be learned?
• Has your agency ever asked riders about their preferred method of receiving information about service disruptions/changes (e.g., as part of an onboard survey)?
• What are the formal criteria or informal guidelines for when your agency decides to announce service disruption?
• What is the chain of command when communicating to the public on changes in service schedules as a result of [_____]?
• For customer service lines, what is the call volume during [_____]?
• What are some of the known barriers for communicating to passengers during changes in service, especially during flooding or other weather events?
Facilities and Infrastructure • How are your facilities prepared for [_____]?
• How are facilities used during the recovery process? Has there historically been enough space? How does the length of the impact from [_____] affect facilities (i.e., employees staying overnight)?
• Have any facilities sustained damage during the last few [_____]? How and when were damages reported and later on repaired? Was information recorded such that FEMA reimbursed the expense? How were repairs managed (e.g., for passenger amenities)? How did you dispose of damaged material and other refuse?
• What specific actions does your agency take to secure (safeguard) facilities?
• How are site flooding and sea-level rise/storm surge included in your facility planning process? Are the measures adequate long-term?
• How is the facilities department structured? Are there separate divisions within the facilities department—folks responsible for bus operations facilities, folks responsible for employee office space facilities,
FEDERAL TRANSIT ADMINISTRATION 46

SECTION 4: STRENGTHENING RESILIENCE THROUGH ADAPTATION
folks responsible for bus shelters, stops, benches? In the past, has the organizational structure proven conducive to preparing for and recovering from [_____]?
Police, Security, Safety, and Risk Management • What is the organizational structure for police/security forces and the risk
management staff? How are duties disseminated throughout the department?
• What is the police department and risk management staffs’ role in the preparation and recovery process?
• What activities/expenses are documented and reported for FEMA reimbursement? Who is responsible for this?
• Are police officers on-board transit vehicles during the partial recovery phase (i.e., for first few routes put back in service)?
• How does the police department determine role and protocol during evacuation and recovery?
• Does the police department communicate or act as the liaison to emergency management services on behalf of the transit agency?
• What is the role of Safety and Security departments during days of inclement weather?
• Have passengers or staff been at risk during previous [_____] events?
• Does your agency track/evaluate incidents and accidents specifically during [_____] events? If so, how has your agency used this information to assess policies and practices?
• How well does your agency understand the process for FEMA documentation and reimbursement procedures? Is it clear who is responsible for this process?
How to Use the Rest of This Report The intent of this FTA-sponsored research project was to develop a resource to assist Gulf Coast transit agencies to consider climate change impacts and start adapting to reduce vulnerability and risk. Thus far, this report has:
• Introduced climate change
• Described climate change impacts on Gulf Coast transit agencies
• Summarized the results of a survey of Gulf Coast agency experience/opinion about climate impacts
• Detailed an eight-step conceptual framework to address climate change
• Provided two vulnerability matrices for agency self-assessment
•Listed potential baseline evaluation questions used by researchers to case study three agencies
FEDERAL TRANSIT ADMINISTRATION 47
SECTION 4: STRENGTHENING RESILIENCE THROUGH ADAPTATION
Much of the rich information found in Part One is from public literature and from researchers working with three partner agencies, including:
• City of Galveston Island Transit (Island Transit), TX
• Metropolitan Transit Authority of Harris County (METRO), Houston, TX
• Hillsborough Area Regional Transit (HART), Tampa, FL
Parts Two and Three contain case study examinations. The three partner agencies graciously shared their experience with their Gulf Coast peers with the hope that others may learn from their policies and practices. The partner agencies do not assume their way is the best way, but simply that they might prove useful as examples of one way to do something. Read through Parts Two and Three thoughtfully considering your agency’s policies and practices. Then proceed to Part Four and review the methodology for a more scientific method of evaluating vulnerability long-term using GIS analysis. Conclude by studying the summary of the report in Part Five—observations, conclusions, and recommendations.
FEDERAL TRANSIT ADMINISTRATION 48
PART TWO: Practices and Adaptations for Street Flooding
Part Two (Sections 5–6) documents case study analysis of two transit agencies that frequently manage the impacts of heavy rainfall that causes street and/or site flooding.
FEDERAL TRANSIT ADMINISTRATION 49

SECTION
5
Case Study of Island Transit, Galveston
The city of Galveston, Texas, is located on Galveston Island, a barrier island along the coast of Texas southeast of Houston. The island is about 27 miles (43.5 km) long and no more than 3 miles (4.8 km) wide at its widest point. The island is oriented generally northeast-southwest, with the Gulf of Mexico on the east and south, West Bay on the west, and Galveston Bay on the north (see Figure 5-1). The island's main access point from the mainland is the Interstate Highway 45 causeway that crosses West Bay on the northeast side of the island. As of Census 2000, the island population was 57,247 people, and Galveston was thus eligible to receive FTA Section 5307 formula funds for an urbanized area (population over 50,000) and state funds from the Texas Department of Transportation (TxDOT) for an urban transit district. The City of Galveston has operated Island Transit since the mid-1960s.
Figure 5-1 Urban-Rural Situation of
Galveston Island
FEDERAL TRANSIT ADMINISTRATION 50

SECTION 5: INTEGRATING ADAPTATION INTO AGENCY PROCESSES
As an island in the Gulf of Mexico, Galveston has experienced several severe storms during its long history of trade and commerce. The most recent storm, Hurricane Ike, was a Category 2 hurricane that struck on September 13, 2008. Ike advanced the greatest storm surge ever seen with a Category 2 hurricane. The flooding from the storm surge devastated residential areas of the island, and many residents relocated to the mainland, temporarily or permanently. While some residents had returned home two years later, Census 2010 reported the population of Galveston as 47,743 people and classified the island as an urban cluster (urban population less than 50,000 people). As an urban cluster, Galveston Island is part of the non-urbanized (rural) area of Galveston County, eligible for FTA Section 5311 funds for non-urbanized areas and state transit funds for rural transit districts.
The change in funding for Island Transit due to the change in classification from an urbanized area to a non-urbanized (rural) area is significant. Table 5-1 documents urban funding to the City of Galveston in 2012 (based on Census 2000) and rural funding to Galveston County in 2013 (based on Census 2010).
Table 5-1 Hurricane Ike Impact on Island Transit Funding
Federal (FTA) and State (TxDOT) Funds City of Galveston
Urban Transit District
Galveston County Rural
Transit District
Source Category FY2012 FY2013
Federal 5307 Urban Formula Funds (Small Urban) $1,324,705
Federal 5307 Small Transit Intensive City Funds $131,515
Federal 5311 TxDOT Allocation FTA 5311 Funds $779,002
Total Federal Funds $1,456,220 $779,002
Change in Federal Funds -47%
State Funds TxDOT Formula Funds (Urban) $442,807
State Funds TxDOT Formula Funds (Rural) $598,662
State Funds TxDOT Funds (Census Impact) $326,000
Total State Funds $442,807 $924,662
Change State Funds 109%
TOTAL Federal and State Funds $1,899,027 $1,703,664
Change in Total Federal and State Funds -10%
Source: FTA and TxDOT
FEDERAL TRANSIT ADMINISTRATION 51

SECTION 5: INTEGRATING ADAPTATION INTO AGENCY PROCESSES
From 2012 to 2013, FTA transit funds decreased 47 percent due to the change in funding source from Section 5307 to Section 5311. State funds increased 109 percent. TxDOT allocated formula funds for the rural transit district and discretionary funds to mitigate the Census impact on federal funds. The net impact in funding from federal and state sources was a 10 percent decrease.
The change from urban transit district to rural transit district also meant a change in the use of the funds. The 2013 funding allocations are to the Galveston County Rural Transit District; however, the Galveston County Transit District does not operate transit services. Gulf Coast Center operates transit services on the mainland and Island Transit serves Galveston Island. Federal and state funds to the Galveston County Rural Transit District must fund transit services for both rural Galveston County on the mainland (operated by Gulf Coast Center) and Island Transit.
Prior to Hurricane Ike in 2008, Island Transit operated fixed bus routes, complementary paratransit, and a heritage streetcar system known as the Galveston Island Trolley. The City suspended trolley operation in September 2008 due to heavy damage from Hurricane Ike to the track bed, rail cars, and rail maintenance facility. The current transit services operated by Island Transit include seven fixed bus routes and complementary paratransit service on the island. In 2012, Island Transit collaborated with Gulf Coast Center to establish park-and-ride transit service between the mainland and Galveston Island. GCC contracts with Island Transit to provide the commuter service.
Although hurricanes and tropical storms are the most severe weather events that impact Galveston, heavy rainfall events that cause localized, disruptive street flooding occur more frequently and negatively impact transit services.
Historical Impacts of Flooding on Island Transit When street flooding events occur that are not related to a storm with a mandatory evacuation, Island Transit must adapt services to provide the highest level of service possible despite adverse climate impacts. Three bus routes tend to be most affected by heavy rainfall events and resulting flash flooding. The maps in Figures 5-2, 5-3, and 5-4 depict the routes that experience occasional street flooding at one or more points along the route. The following discussion centers on the operational impacts and current practices of Island Transit during these events.
FEDERAL TRANSIT ADMINISTRATION 52

SECTION 5: INTEGRATING ADAPTATION INTO AGENCY PROCESSES
Figure 5-2 Route 1: 71st via Market & Broadway (most affected by flooding) [25]
Figure 5-3 Route 5: Ave S–Stewart Road (occasionally affected by flooding) [25]
Figure 5-4 Route 6: 61st via Ave O (occasionally affected by flooding) [25]
FEDERAL TRANSIT ADMINISTRATION 53
SECTION 5: INTEGRATING ADAPTATION INTO AGENCY PROCESSES
Overview of Island Transit Policies and Practices for Flooding When street flooding that affects bus route operations occurs, Island Transit dispatch staff use their experience and knowledge to attempt to reroute buses around known high-water locations. Agency polices allow for continued service if vehicles are able to safely use alternate routes within two blocks of the official route. Galveston Island typically has grid street-network with relatively short, walkable blocks (two-block reroute is not a long distance). Island Transit relies on the City of Galveston Public Information Officer to use, free-of-charge, public announcement tools such as local radio and television channel 16 to communicate changes and information with residents concerning reroutes or other operational changes. Vehicle operators are instructed to avoid high water to avoid incurring extra maintenance expenses; operators also slow vehicle speeds to avoid forcing water up onto private property. Operational impacts of high water reroutes means that Island Transit occasionally experiences increased labor expenses due to disrupted schedules and responding to service requests less efficiently (e.g., continuing to operate some routes even though expected ridership is nil). Heavy rainfall and street flooding also negatively influence Island Transit’s complementary paratransit services, which sometimes must cancel trips if origin, required route, or destinations typically experience street flooding during heavy rainfall.
On rainy days with no flooding, ridership typically drops to 50 percent of normal. Days with rain and street flooding along several key routes see ridership decline to about 10 percent of normal. Many Island Transit passengers are experienced riders and know that if they see water on the road, the bus will be one or two blocks away on the pre-determined reroute. In fact, the route brochure maps for routes most often affected by street flooding depict the typical reroute using a dashed line of the same color as the route’s solid line (see Figure 5-5).
FEDERAL TRANSIT ADMINISTRATION 54
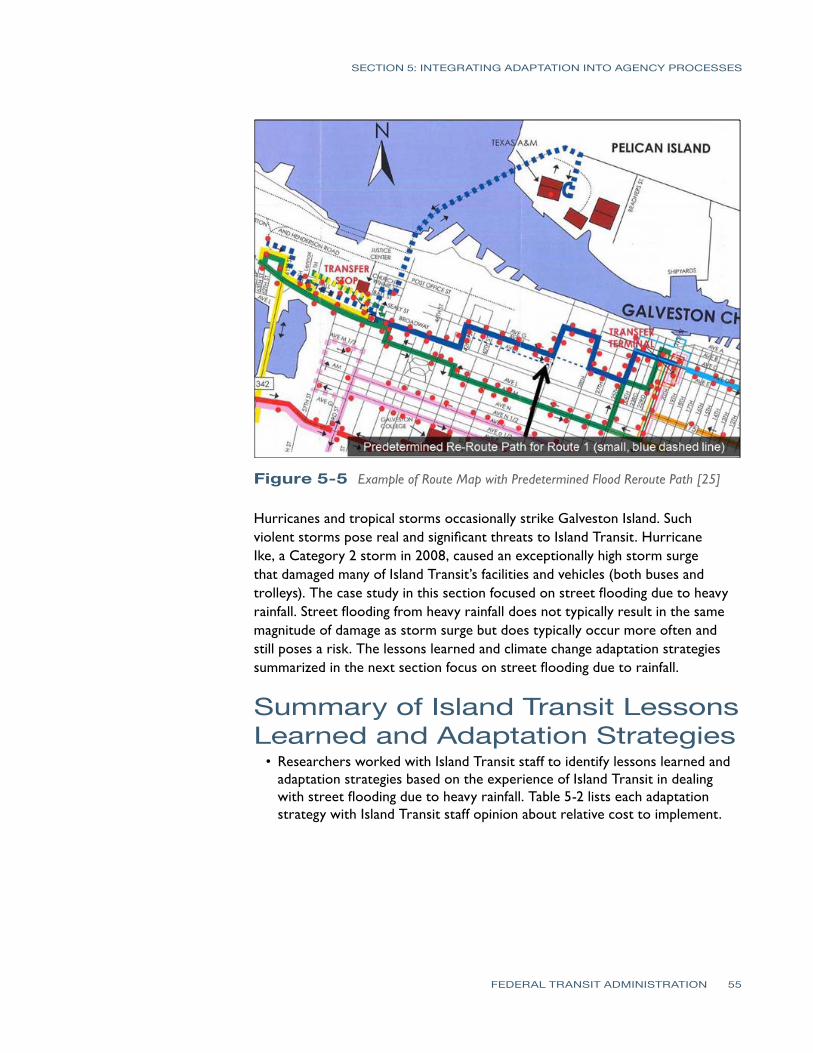
SECTION 5: INTEGRATING ADAPTATION INTO AGENCY PROCESSES
Figure 5-5 Example of Route Map with Predetermined Flood Reroute Path [25]
Hurricanes and tropical storms occasionally strike Galveston Island. Such violent storms pose real and significant threats to Island Transit. Hurricane Ike, a Category 2 storm in 2008, caused an exceptionally high storm surge that damaged many of Island Transit’s facilities and vehicles (both buses and trolleys). The case study in this section focused on street flooding due to heavy rainfall. Street flooding from heavy rainfall does not typically result in the same magnitude of damage as storm surge but does typically occur more often and still poses a risk. The lessons learned and climate change adaptation strategies summarized in the next section focus on street flooding due to rainfall.
Summary of Island Transit LessonsLearned and Adaptation Strategies
•Researchers worked with Island Transit staff to identify lessons learned and adaptation strategies based on the experience of Island Transit in dealing with street flooding due to heavy rainfall. Table 5-2 lists each adaptation strategy with Island Transit staff opinion about relative cost to implement.
FEDERAL TRANSIT ADMINISTRATION 55

SECTION 5: INTEGRATING ADAPTATION INTO AGENCY PROCESSES
Table 5-2 Island Transit: Adaptation Strategies and Relative Cost
Adaptation Strategy/Practice Relative Cost to Implement (Low, Medium, or High?)
Ensure all new operations/vehicle maintenance facilities are outside 100-year floodplain or at another higher level of flood resistance, such as 500-year floodplain.
Low (not always feasible, depends
on jurisdiction, alternative is to move vehicles)
If not possible to construct key facilities in naturally-safe locations, transit agency should design site plan with buildings raised sufficiently high as to avoid all foreseeable flood risk.
High
Work with public works departments from local jurisdictions to ensure that storm sewers for flood prone areas are kept clear; transit operators can help to spot problems early as they have more eyes on street.
Low
Use agency and management operations experience to identify flood-prone route segments and then identify standard/ preferred alternatives or procedures.
Low
When possible, educate riders about typical reroutes or agency procedures using route brochures, public service announcements, and operator/rider dialogue.
Low
Identify standard operating procedures to reduce impact of street flooding on vehicle maintenance (i.e., slow speeds, avoid known trouble areas), agency property (i.e., passenger amenities), private property (i.e., reducing vehicle speed to limit forcing water up onto/into private property).
Medium
Establish method of recording useful information to quantify impacts of street flooding on facilities, vehicle maintenance, and operating costs to inform future decisions.
Medium
Note. Island Transit views approximate dollar value of cost ratings as follows:
Low – less than $100,000Medium – between $100,000 and $250,000High –more than $250,000
Please note that the lessons learned and adaptation strategies above are often practices already in use by Island Transit and other Gulf Coast transit agencies. However, they are included because it is also true that even small changes will reduce vulnerability and result in significant long-term benefits for a transit agency.
Island Transit management shared other thoughts about climate change adaptation and transit service provision:
• FTA could investigate a way to create a funding source specifically for assisting agencies to lease vehicles during recovery periods (i.e., immediately after hurricane or tropical storm strikes), the intent being to tide over agencies while they work with FEMA on claims.
• FTA and FEMA could partner to create a detailed, practical guidebook for transit agencies to use to deal with insurance companies and FEMA; the guidebook could discuss best-practices to prepare before a storm in terms of documentation/policies and then also discuss best practices for during recovery (such as explanations of expectations for documentation).
FEDERAL TRANSIT ADMINISTRATION 56
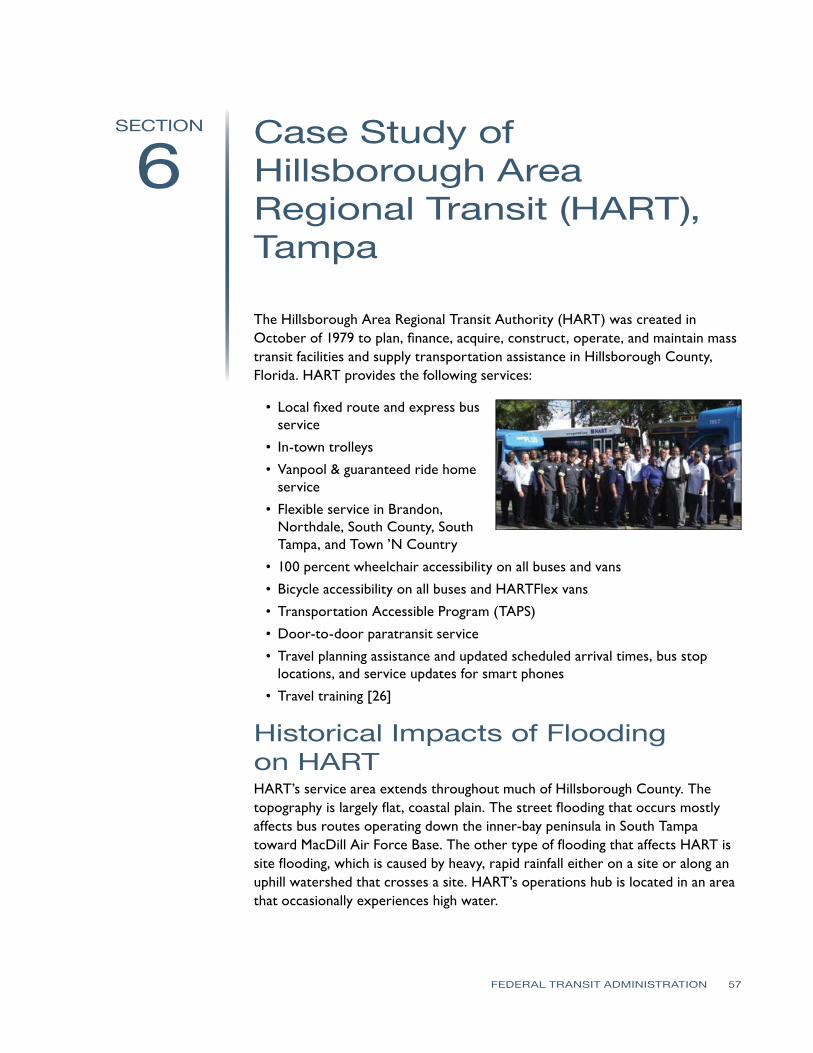
SECTION
6
Case Study of Hillsborough AreaRegional Transit (HART),Tampa
The Hillsborough Area Regional Transit Authority (HART) was created in October of 1979 to plan, finance, acquire, construct, operate, and maintain mass transit facilities and supply transportation assistance in Hillsborough County, Florida. HART provides the following services:
• Local fixed route and express bus service
• In-town trolleys
• Vanpool & guaranteed ride home service
•Flexible service in Brandon, Northdale, South County, South Tampa, and Town ’N Country
•100 percent wheelchair accessibility on all buses and vans
•Bicycle accessibility on all buses and HARTFlex vans
• Transportation Accessible Program (TAPS)
• Door-to-door paratransit service
• Travel planning assistance and updated scheduled arrival times, bus stop locations, and service updates for smart phones
• Travel training [26]
Historical Impacts of Flooding on HART HART’s service area extends throughout much of Hillsborough County. The topography is largely flat, coastal plain. The street flooding that occurs mostly affects bus routes operating down the inner-bay peninsula in South Tampa toward MacDill Air Force Base. The other type of flooding that affects HART is site flooding, which is caused by heavy, rapid rainfall either on a site or along an uphill watershed that crosses a site. HART’s operations hub is located in an area that occasionally experiences high water.
FEDERAL TRANSIT ADMINISTRATION 57

SECTION 6: CONCLUSION AND NEXT STEPS
When street flooding events occur, even when not related to a storm with mandatory evacuation, HART adapts services to provide the highest level of service possible despite adverse climate impacts. Not all rainfall events cause street flooding. When flooding does occur, it may adversely affect bus route alignments as well as HART’s operations hub. The routes most likely to be impacted by street flooding are routes 4, 19, 36, 24X, and 25X—meaning that 3 of 37 weekday local bus routes and 2 of 14 commuter express bus routes experience street flooding that affect normal route operation. One strategy to protect sensitive materials and equipment from flooding at the operations hub is to fill buses with the materials of concern and then raise the vehicles on lifts in the maintenance facility. Figure 6-1 depicts the general extent of HART’s bus routes in the region.
FEDERAL TRANSIT ADMINISTRATION 58
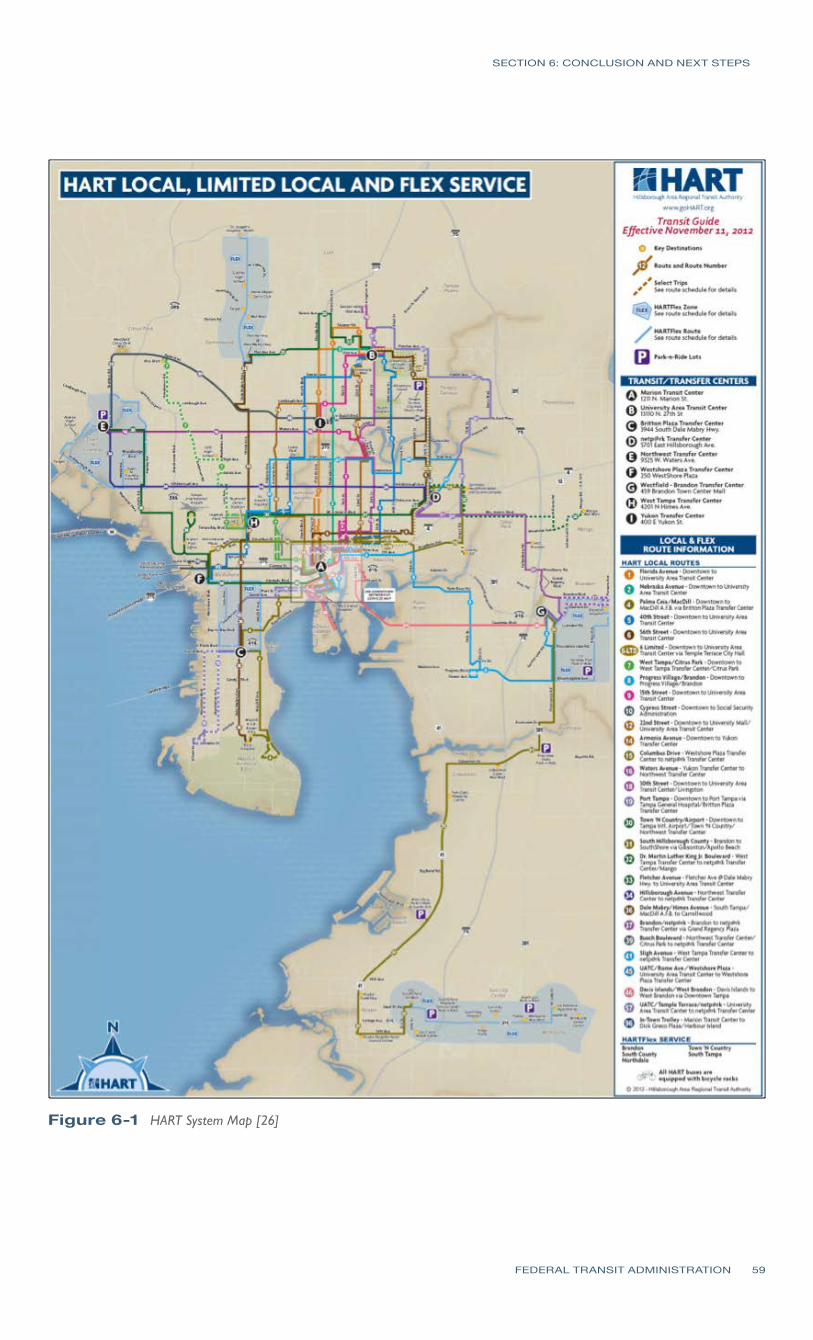
SECTION 6: CONCLUSION AND NEXT STEPS
Figure 6-1 HART System Map [26]
FEDERAL TRANSIT ADMINISTRATION 59
SECTION 6: CONCLUSION AND NEXT STEPS
Overview of HART Policies and Practices for Flooding The following five sections summarize the experience and practices of HART in regard to street or site flooding in five areas of the agency: operations, communications, maintenance, safety and security, and service planning.
Operations Policies for dispatch/operators to follow when encountering street flooding in the field are not set firmly; dispatchers and operations management generally know where impacts occur. The HART process to respond to street flooding is:
1. Operators radio into Dispatch with location and description of street flooding.
2. HART sends a supervisor to observe flooding.
3. The supervisor on-site determines necessary reroute, informs Dispatch, Dispatch informs affected operators.
4. The supervisor waits until the reroute is active to make a sweep past the affected bus stops to ensure that no rider is left at a stop (stops may or may not flood at the same time as the adjacent roadway).
HART’s experience with street flooding is that the speed of rainfall influences street flooding more than the amount of rain a storm deposits. The speed of rainfall accumulation is difficult to forecast and, consequently, so is street flooding. HART instructs all operators to slow down at least 5 mph during rainfall. They also advise operators to avoid causing wakes in curbside puddles that will impact riders at bus stops or potentially splash into buildings.
HART finds that heavy rainfall and street flooding affects on-time performance to some degree, but that many times such events result in fewer riders, so operators are able to move through routes with fewer stops—attenuating some of the negative impacts. One cost-saving practice that HART employs during inclement weather is to anticipate lower ridership and, therefore, send home extra-board paratransit operators (normally kept on-duty in case of unexpected, additional trips that do not occur during storms). HART typically has 35–50 of 400 total paratransit trips late-cancel due to heavy rainfall days (about 11% of trips for the day). It is the policy of HART to suspend operations when sustained wind speed exceeds 35 mph or the Emergency Operations Center (EOC) determines a need to shut down. HART has no policy or practice to handle a situation where a paratransit rider’s home is not accessible due to high water; such a situation has not yet occurred. During serious storms that require evacuation, HART uses Flex vans to pick up ADA complementary paratransit riders. A rough estimate of the impact of a typical street flooding event is about
FEDERAL TRANSIT ADMINISTRATION 60

SECTION 6: CONCLUSION AND NEXT STEPS
15–20 additional hours of labor for HART. During a major, forecasted event (tropical storm or hurricane) HART will bring in extra staff on weekend days or maintain normal staffing levels during weekdays.
Sinkholes are a problem in Florida. HART instructs all operators: “If you [the driver] can’t see the roadway, don’t drive through the water.” In addition, if an operator notices a place in the road that he/she believes is becoming a sinkhole, he/she reports it to Dispatch, Dispatch reports to an operations supervisor, and the supervisor drives to the location to assess the issue and then reports to the City of Tampa.
Communications The Communications department anticipates the severity of the storm based on weather reports. Sometimes there is no warning, so operators must communicate to Dispatch and dispatchers communicate to supervisors. Supervisors determine when a detour is necessary. Communications uses ConstantContact to get the word out via informative emails to clients and stakeholders; Twitter and Facebook are also used to message subscribed users. People may also call HART to learn about route detours. Call volume increases during flooding events. HART does not currently record the nature of each customer service call. During regional emergency events, such as a hurricane, HART takes a top-down decision-making approach. However, during rainfall flooding events, the agency typically responds with a bottom-up approach.
Maintenance HART uses vehicle maintenance software to manage vehicle maintenance records for each vehicle in the agency’s fleet. The agency does not use the software to record the impacts of specific weather events or types of weather events. The agency conducts regular and comprehensive preventive maintenance to prolong the life of every vehicle. HART’s local buses have a plywood floor and are low-floor vehicles to make boarding and alighting easier for riders. In recent years, the agency replaced floors of two older buses, but it is not sure if the floors needed replacement due to normal wear and tear or due to street or operations center flooding. Maintenance personnel do not know if there is a direct or severe relationship between flooding and vehicle maintenance issues. The main impact of high-water on fleet maintenance is a higher rate of wheel bearing wear and tear.
Safety and Security Street flooding due to heavy rainfall, not from hurricanes and tropical storms, does not require special support from HART safety and security personnel. Traffic usually slows down during rain. A higher rate of traffic accidents occurs, but the speeds are slower. During regional emergencies HART’s chief executive
FEDERAL TRANSIT ADMINISTRATION 61

SECTION 6: CONCLUSION AND NEXT STEPS
officer or another authorized person issues orders for safety and security personnel. HART is a central player in the region’s EOC.
Service Planning HART daily ridership averages just over 45,000 passenger trips. On August 27, 2012, street flooding affected some routes and generally heavy rain reduced ridership to about 27,000 trips. An earlier heavy-rainfall, street-flooding event on June 25, 2012, resulted in daily ridership of about 36,000 trips. HART experiences seasonal variation in ridership, as do many transit agencies. The exact impact of street flooding on ridership is difficult to measure. Street flooding has not had enough or measurable impacts such that HART service planners have explored new route alignments to avoid flood-prone areas.
Summary of HART Lessons Learned and Adaptation Strategies Researchers worked with HART staff to identify lessons learned and adaptation strategies based on the experience of HART in dealing with street flooding due to heavy rainfall; some are identical to the case study of Island Transit. Table 6-1 lists each adaptation strategy with HART staff opinion about relative cost to implement.
FEDERAL TRANSIT ADMINISTRATION 62

SECTION 6: CONCLUSION AND NEXT STEPS
Table 6-1 HART: Adaptation Strategies and Relative Cost
Adaptation Strategy/Practice Relative Cost to Implement (Low, Medium, or High?)
Facilities should have at least one access/egress route not prone to flooding. Medium
Participate in local and regional planning processes for flood mitigation projects when project lists may impact agency’s drainage at facilities.
Low
Use agency and management operations experience to identify flood-prone route segments and then identify standard/ preferred alternatives or procedures.
Low
Educate riders about agency policies using public service announcements and operator/ rider dialogue.
Low
Identify standard operating procedures to reduce impact of street flooding on vehicle maintenance (i.e., slow speeds, avoid known trouble areas), agency property (i.e., passenger amenities), private property (i.e., reducing vehicle speed to limit forcing water up onto/into private property).
Low
Think about local occurrences, such as sinkholes in Florida, and create similar mantras as HART has: “If you can’t see the road through the standing water, don’t drive across it.”Establish a method of recording useful information to quantify impacts of site/street flooding on facilities, vehicle maintenance, and operating costs to inform future decisions (i.e., such as deciding between plywood floors vs. water resistant material).
Low
Establish method of recording useful information to quantify impacts of street flooding on facilities, vehicle maintenance, and operating costs to inform future decisions.
Low
Note. HART views approximate dollar value of cost ratings as follows:
Low – less than $100,000Medium – between $100,000 and $500,000High – more than $500,000
Please note that the lessons learned and adaptations above are often practices already in use by HART and other Gulf Coast transit agencies. However, they are included because it is often true that even small changes will reduce vulnerability and result in significant long-term benefits for a transit agency.
FEDERAL TRANSIT ADMINISTRATION 63

PART THREE: Practices and Adaptations for Hurricane or Tropical StormRecovery
Part Three (Section 7) describes the impacts of hurricane/tropical storm activity on Houston METRO and provides a case study of practices and adaptations related to hurricane/tropical storm recovery.
FEDERAL TRANSIT ADMINISTRATION 64

SECTION
7
Case Study of HoustonMETRO
Overview of METRO The Metropolitan Transit Agency of Harris County (METRO) is the largest public transit agency in the Gulf Coast region and provides transit services within a 1,285 square mile area to a population of more than 3 million people. The METRO service area includes the incorporated cities of Houston, Bellaire, Bunker Hill Village, El Lago, Hedwig Village, Hillshire Village, Humble, Hunters Creek, Katy, Missouri City, Piney Point, Southside Place, Spring Valley, Taylor Lake Village, West University Place, and unincorporated areas of Harris, Montgomery, and Fort Bend counties. METRO Services include bus, METRORail, METROLift (paratransit), HOV/HOT lanes, park-and-ride lots, and transit centers. Figure 7-1 depicts METRO’s service area.
Figure 7-1 Houston METRO Service Area
FEDERAL TRANSIT ADMINISTRATION 65

SECTION 7: CASE STUDY OF HOUSTON METRO
Summary of Storm Impacts onMETRO: Hurricane Ike (Category 2, 2008) Hurricane Ike made landfall near Galveston on September 13, 2008, as a strong Category 2 storm. With tropical-storm-force winds spread more than 500 miles across, Ike was about 70 percent larger than an average hurricane, causing unusually heavy damage along the coast from Texas to Louisiana. In preparation for Hurricane Ike, evacuation orders were issued for residents of Galveston and Houston areas expected to be in its path. Due to high winds and a storm eye that passed directly through Houston, downtown buildings suffered major damage due to window glass breaking and rain water destroying the inside.
METRO's Emergency Operations Center (EOC) was Houston TranStar; previously, METRO’s administration building at 1900 Main Street contained an EOC on the 14th floor but it is no longer in use. METRO was also impacted by Ike due to METRO’s major involvement in evacuation operations and disruption of its normal service caused by fallen trees, flooding, power failures, and damage to its facilities, fleet, and roadway infrastructure. As per METRO’s emergency plan, after the passage of the storm during its recovery phase, METRO prepared a damage assessment report. Based on this report’s estimate, METRO suffered damage of $4.4 million to its facilities and bus shelters. In addition, service disruption caused loss of revenue and difficulties for transit users and transit-dependent populations. According to an insurance claim filed by METRO, transit services were affected for a total of 11 days starting on September 12, with no service for two days and then resuming partial service on September 15 and bringing it to normal operations incrementally on September 23.
Organizational Preparation for Hurricanes and Tropical Storms METRO has adopted an emergency management plan (EMP) that provides general guidance to METRO management and employees who are responsible for the planning of mitigation, preparation, response, and recovery from any emergency including hurricanes and tropical storms. METRO’s EMP complies with the federally-required National Incident Management System. The EMP describes the organization structure and assigns responsibilities for various emergency tasks to specific departments or personnel. Overall, the plan accounts for addressing all four phases of emergency management: mitigation, preparedness, response, and recover.
FEDERAL TRANSIT ADMINISTRATION 66

SECTION 7: CASE STUDY OF HOUSTON METRO
Mitigation Mitigation activities are designed to eliminate or reduce the probability of a hazard occurring or to minimize the impact of a hazard. From the perspective of hurricanes and tropical storms, METRO decides to move its non-essential fleet to safer locations before the decision to suspend service is made. In preparation for a storm, vehicles are moved from Kashmere and Hiram Clark Bus Operations Facility (BOF) to West and Fallbrook BOF. Some buses from Fallbrook BOF are moved to the Kuykendahl park-and-ride facility. METRO documents which buses go where, and the operators that move the bus are responsible for moving the vehicle back. A pre-assigned employee keeps track of where all vehicles are moved.
Preparedness Preparation activities are designed to develop and improve the capabilities to prevent, protect, respond, and recover in the event of an emergency. METRO has developed procedures to safeguard its assets in the event of tropical storms and hurricanes. Its standard operating procedures instruct its bus drivers to not drive the transit vehicles if the water level on the roadways is at door level.
Figure 7-2 depicts the relationship between METRO’s hurricane emergency plans for the Service Delivery Department in relation to other key stakeholders.
Essential personnel (a large portion of METRO staff) must remain on duty during a storm. Staff are allowed to get their families to a safe location but then are expected to return. METRO has set up contracts with local hotels and certain food establishments such that employees have a place to rest, sleep, and eat. Employees are also allowed to sleep at bus operating facilities (BOFs). All facilities have nonperishable food supplies, and some of the BOFs have catered meals as well. METRO restocks emergency food and fuel supplies every year prior to the beginning of hurricane season. The food and fuel supplies allow METRO personnel to stay on duty at various emergency operation locations when normal businesses are closed due to evacuations and emergency threats. METRO Police has a good faith agreement with the University of Houston downtown to park vehicles in garages to protect them from the storm. METRO has plans for staff assignments during hurricanes by department. Figure 7-3 is an example of the essential staffing plan for METRO’s Maintenance Department.
FEDERAL TRANSIT ADMINISTRATION 67

Figure 7-2 METRO and Stakeholders Conceptual Hurricane Timeline
FEDERAL TRANSIT ADMINISTRATION 68
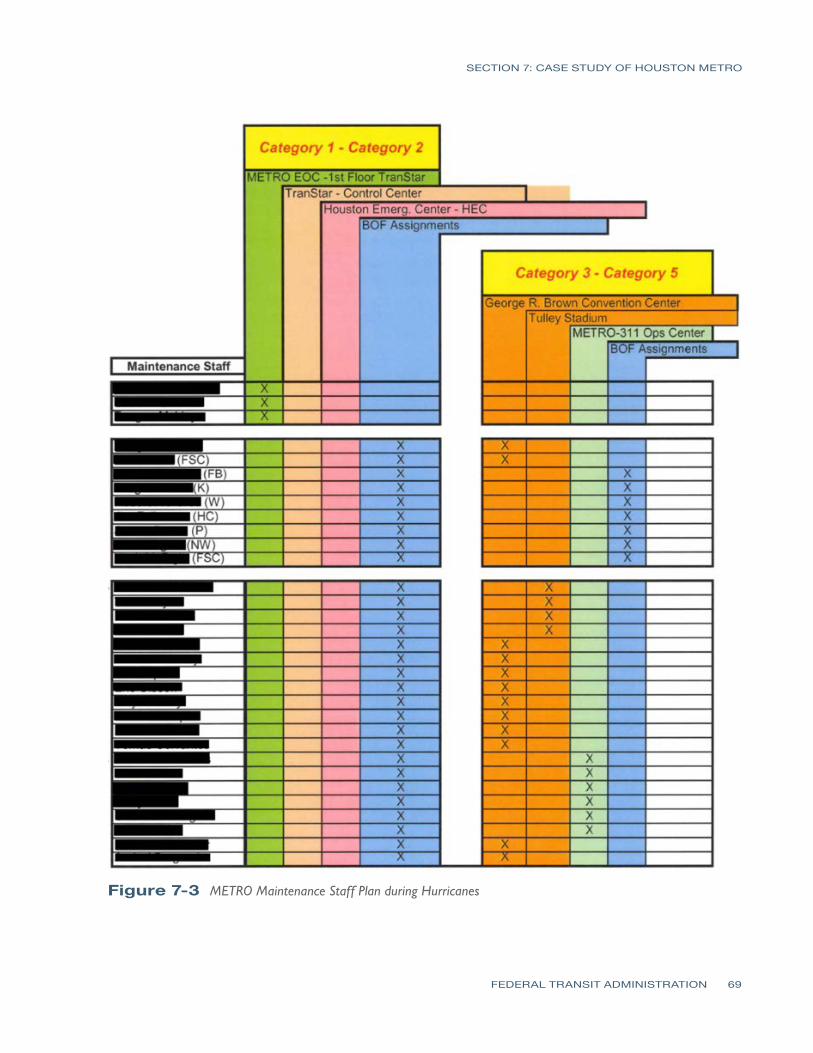
SECTION 7: CASE STUDY OF HOUSTON METRO
Figure 7-3 METRO Maintenance Staff Plan during Hurricanes
FEDERAL TRANSIT ADMINISTRATION 69
SECTION 7: CASE STUDY OF HOUSTON METRO
Response METRO’s response activities begin when the emergency occurs or when warning signs indicate an emergency is imminent. Based on the level of emergency event and a conceptual timeline of the predicted tropical storm/hurricane, the agency uses an eight-phase response for emergency management at Houston TranStar that includes the following:
1. Notifying personnel, response partners, transit passengers, media, and the public of an immediate or potential emergency. METRO can use radios, HyperAlert, PIER System, and Dynamic Message Signs along Houston freeways to communicate emergency information to the public and its personnel.
2. Activation of METRO’s EOC as needed based on the level of emergency.
3. Mobilization of METRO’s Emergency Management Team to Houston TranStar and City of Houston 3-1-1/METRO Operations Center.
4. Coordination with METRO personnel working at various locations set up for emergency operations.
5. Operations to implement the incident action plan using METRO and response partner members of the incident management team. Some examples of tactical operations during hurricanes include emergency evacuation of at-risk and special needs populations and Bus Bridge to substitute buses in lieu of light rail service that is interrupted.
6. Communications of updated and confirmed emergency information to key stakeholders. Communications channels include HyperAlert, PIER System, METRO’s blog, Human Resources Information System (for METRO employees), a regional reverse 9-1-1 system, media outlets, and METRO Responds webpage. Coordination, operations, and communications continue to repeat until the incident is over.
7. Demobilization of response and emergency team members after the incident is over requires submission of all required documentation (such as completed timesheets, expenses, reports), check-in of any equipment/resources, and debriefings with supervisors. All FEMA-reimbursable expenses are compiled and submitted to METRO’s Risk Management department and ultimately submitted to FEMA.
8. An After Action Review and Report is conducted to identify strengths, weaknesses, and opportunities to improve performance, procedures, and the emergency management plan. Results are summarized in a written After Action Report.
FEDERAL TRANSIT ADMINISTRATION 70
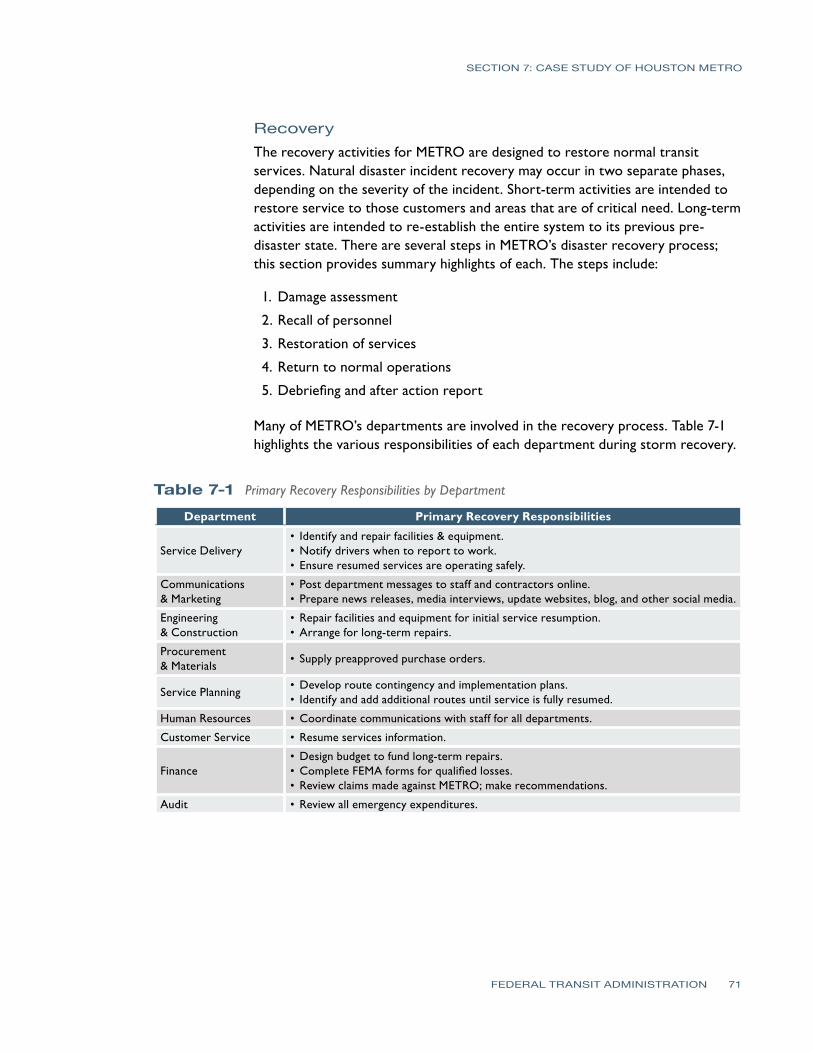
SECTION 7: CASE STUDY OF HOUSTON METRO
Recovery The recovery activities for METRO are designed to restore normal transit services. Natural disaster incident recovery may occur in two separate phases, depending on the severity of the incident. Short-term activities are intended to restore service to those customers and areas that are of critical need. Long-term activities are intended to re-establish the entire system to its previous pre-disaster state. There are several steps in METRO’s disaster recovery process; this section provides summary highlights of each. The steps include:
1. Damage assessment
2. Recall of personnel
3. Restoration of services
4. Return to normal operations
5. Debriefing and after action report
Many of METRO’s departments are involved in the recovery process. Table 7-1 highlights the various responsibilities of each department during storm recovery.
Table 7-1 Primary Recovery Responsibilities by Department
Department Primary Recovery Responsibilities
Service Delivery • Identify and repair facilities & equipment. • Notify drivers when to report to work. • Ensure resumed services are operating safely.
Communications & Marketing
• Post department messages to staff and contractors online. • Prepare news releases, media interviews, update websites, blog, and other social media.
Engineering & Construction
• Repair facilities and equipment for initial service resumption. • Arrange for long-term repairs.
Procurement & Materials
• Supply preapproved purchase orders.
Service Planning • Develop route contingency and implementation plans. • Identify and add additional routes until service is fully resumed.
Human Resources • Coordinate communications with staff for all departments.
Customer Service • Resume services information.
Finance • Design budget to fund long-term repairs. • Complete FEMA forms for qualified losses. • Review claims made against METRO; make recommendations.
Audit • Review all emergency expenditures.
FEDERAL TRANSIT ADMINISTRATION 71
SECTION 7: CASE STUDY OF HOUSTON METRO
Aspects of Recovery from Hurricanes and Tropical Storms There are many aspects to recovering from the effects of hurricanes and tropical storms. The purpose of this document is not to be a long, comprehensive how-to guide for this single, important, and complex subject. However, researchers worked with METRO to identify key aspects to recovery, practices for managing each, and lessons/adaptation strategies learned along the way. The following are the other aspects of recovery based on METRO’s experience (order does not necessarily reflect a strict timeline of recovery effort):
• Damage assessment
• Recalling personnel
•Restoration of services
• Returning METRO to normal operations
• Debriefing and after action report
•FEMA reimbursement
Damage Assessment When the incident is over, safe, and under control, METRO’s Damage Assessment Team is dispatched to assess damages to the facilities, vehicles, and other fixed assets. The team assessing the routes uses a Route Hazard Analysis Form. For clearance of routes, METRO has a standby contract with KBR that was used during Ike in 2008.
The Assessment Team is made up of representatives from several departments, including Audit, Engineering & Construction, Finance, Service Delivery, and METRO Police. METRO’s emergency management coordinator appoints a team leader who is responsible for the following:
•Coordinate with the City of Houston, Harris County, State of Texas, and cities within the METRO Service Area to conduct a damage assessment and determine accessibility of streets and roadways utilized by METRO vehicles.
•Evaluate all bus routes and rail lines used by METRO.
•Determine the condition of all METRO facilities.
• Determine the availability and condition of METRO rolling stock.
• Assess the availability of mechanics and parts needed to repair damage.
•Assess the availability of operators, supervisors, and other personnel needed to resume service.
•Consider any other factors that would impact METRO’s ability to resume partial or full service to the METRO service area.
FEDERAL TRANSIT ADMINISTRATION 72

SECTION 7: CASE STUDY OF HOUSTON METRO
Once this information has been obtained, the Damage Assessment Team reports to the Emergency Management Coordinator and the Emergency Management Director with recommendations on the steps necessary to restore partial/full service to the METRO service area and the timeline for accomplishing that goal (METRO, EMP).
Recalling Personnel The department heads of respective areas identify the staff and number of staff needed to resume operations. The Human Resources and Diversity Department maintains and periodically updates contact information for employees. The Human Resources and Diversity department is responsible for coordinating communications with all departments. A number of communication methods, as appropriate to the situation, may be used, including the METRO Employee Hotline, posting messages on the Internet, HyperAlert/PIER System, and phone/ email. In addition, Communications and Marketing posts department messages to staff and contractors via a specific website, MetroResponds.org.
Restoration of Services Staff work to develop a schedule for resuming service, and it must be approved by the Emergency Management Director. The Service Delivery department has developed a list of prioritized Core Routes to restore service in three phases. Phase 1 routes are deemed most important, as these provide connectivity to major hospitals; providing Bus Bridges if light rail service is interrupted is also included in Phase 1 of service restoration. The Continuity of Operations Plan describes the total number of buses and operators needed to restore service for each route included in the Core Routes. Figure 7-4 depicts the 14 core routes on which METRO focuses to restore to service as soon as safely possible after a hurricane or tropical storm.
FEDERAL TRANSIT ADMINISTRATION 73

SECTION 7: CASE STUDY OF HOUSTON METRO
Figure 7-4 Map of METRO Core Routes
FEDERAL TRANSIT ADMINISTRATION 74

SECTION 7: CASE STUDY OF HOUSTON METRO
The Engineering and Construction department makes arrangements with construction contractors to perform essential repairs and restoration activities to accelerate the return to service for these Core Routes. The Procurement and Materials department provides preapproved blank emergency purchase orders for the purposes of resuming service as quickly as possible.
Management coordinators for the cities and counties within the METRO service area determine how well the mission critical routes can begin operating. The coordinators address the following areas (METRO, EMP):
• Arranging for clearing debris from streets, roadways, railways, and transit facilities
• Restoring power and dealing with downed power lines
• Locating and retrieving all METRO equipment affected by the emergency
• Repairing damaged vehicles and/or acquiring replacements (temporary or permanent)
• Testing equipment that may have been affected by the incident
• Verifying that transit operations can be safely conducted in the areas in which service is to be resumed
Upon completion of repairs and testing, the Emergency Management Director authorizes return to service on core routes, and Service Delivery then notifies drivers to report to work. The Communications and Marketing department prepares and distributes media releases, updates the METRO website and blog, and uses other communication systems to convey necessary information on the scope and resumption of service to transit passengers and public.
Returning METRO to Normal Operations Service Delivery evaluates the services running and makes adjustment recommendations to the Emergency Management Coordinator and Director. If service is not fully operating, the department will identify and add the appropriate additional services.
Debriefing and After Action Report METRO conducts an extensive After Action Review of the mitigation, preparedness, response, and recovery efforts, looking at how to continually improve the process. The respective departments work together to essentially conduct a SWOT (strengths, weaknesses, opportunities, and threats) analysis of the agency efforts. The agency considers the following items in the After Action Review:
• Vehicle, facility, and equipment use
• Necessary repairs and/or maintenance
FEDERAL TRANSIT ADMINISTRATION 75

SECTION 7: CASE STUDY OF HOUSTON METRO
• Records of activities of all departments during response and recovery operations
• The effectiveness of Mitigation and Preparedness plans
• Identification of problem areas and lessons learned
All of the information, including the SWOT analyses, topics discussed with staff in the debriefings, and evaluations, are included in the After Action Report to better improve future emergency response plans. Should any deficiencies be identified, a Corrective Action/Improvement Plan is developed by the Emergency Management Coordinator for future reference.
FEMA Reimbursement METRO has property insurance and construction standards that adhere to the organization’s insurance provider’s recommendations to lower deductibles and premiums. These improvements are coordinated with Facilities.
In addition, METRO has an annual risk improvement plan that is meant to reduce exposure. In an effort to streamline FEMA reimbursements in the future, METRO has reorganized its departments such that Safety has been moved out of the METRO Police department and risk management is no longer a part of the Finance department. This has improved communication among key individuals responsible for FEMA submittal processes. In addition, METRO is planning to contract with a third party to handle FEMA submittals and reimbursements. This contract would be with an organization that understands the “ins and outs” of the process and what expenses FEMA will and will not reimburse.
Summary of Lessons Learned and Adaptation Strategies Having experienced several hurricanes, tropical storms, and other emergency events, METRO’s preparedness for emergency events and recovery includes considerations in several areas, each of which is summarized below:
• Clear communications regarding service cutoff times
• Contracts in place
• Bank accounts
• Community support
• Fuel availability and procurement
• Interoperable communications
• Order of succession and delegation of authority
FEDERAL TRANSIT ADMINISTRATION 76

SECTION 7: CASE STUDY OF HOUSTON METRO
Please note that for each adaptation strategy METRO staff provided a relative rating of cost to implement. Most adaptation strategies for storm recovery are planning focused and do not include large capital investments. The cost rating for each strategy is in the blue, right-hand column. METRO views the approximate dollar value of cost ratings as low being less than $50,000, medium between $50,000 and $250,000, and high more than $250,000.
According to Michael Leonard, Manager of Service Planning at METRO, “Planning for a disaster is not a one-time deal, it’s every day … The key is keeping track of everything going on.”
FEDERAL TRANSIT ADMINISTRATION 77
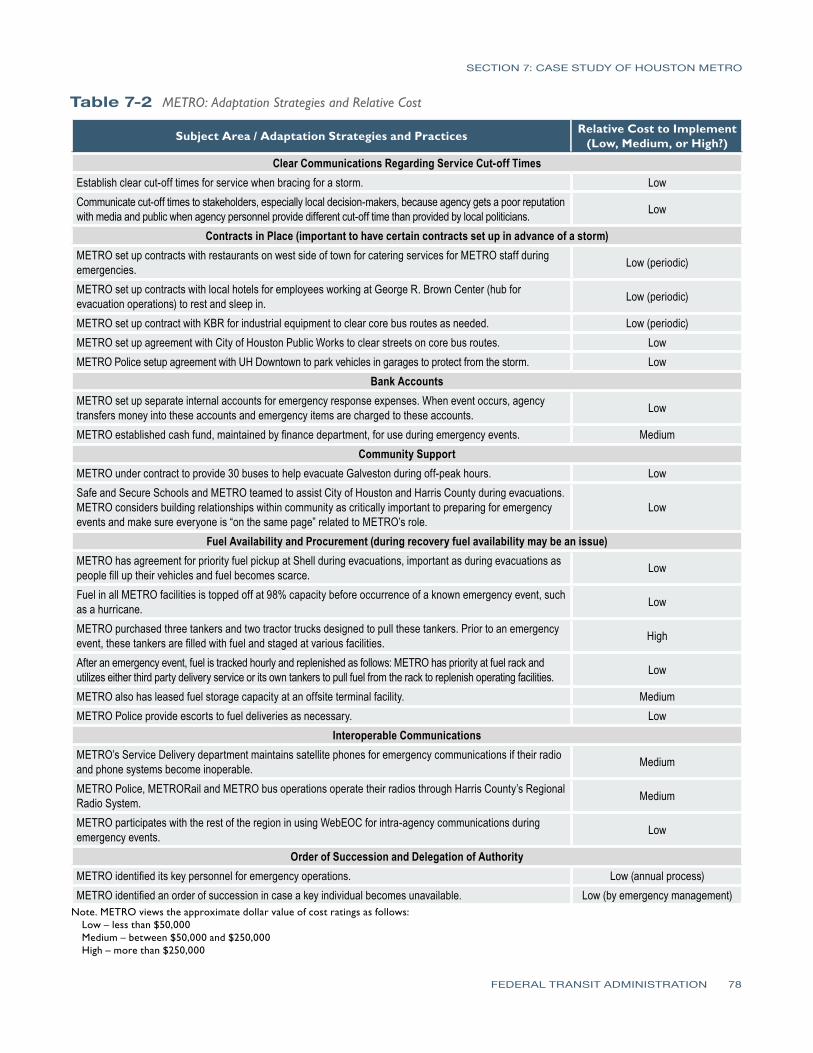
Table 7-2 METRO: Adaptation Strategies and Relative Cost
SECTION 7: CASE STUDY OF HOUSTON METRO
Subject Area / Adaptation Strategies and Practices Relative Cost to Implement (Low, Medium, or High?)
Clear Communications Regarding Service Cut-off Times Establish clear cut-off times for service when bracing for a storm. Low Communicate cut-off times to stakeholders, especially local decision-makers, because agency gets a poor reputation with media and public when agency personnel provide different cut-off time than provided by local politicians. Low
Contracts in Place (important to have certain contracts set up in advance of a storm) METRO set up contracts with restaurants on west side of town for catering services for METRO staff during emergencies. Low (periodic)
METRO set up contracts with local hotels for employees working at George R. Brown Center (hub for evacuation operations) to rest and sleep in. Low (periodic)
METRO set up contract with KBR for industrial equipment to clear core bus routes as needed. Low (periodic) METRO set up agreement with City of Houston Public Works to clear streets on core bus routes. Low METRO Police setup agreement with UH Downtown to park vehicles in garages to protect from the storm. Low
Bank Accounts METRO set up separate internal accounts for emergency response expenses. When event occurs, agency transfers money into these accounts and emergency items are charged to these accounts. Low
METRO established cash fund, maintained by finance department, for use during emergency events. Medium Community Support
METRO under contract to provide 30 buses to help evacuate Galveston during off-peak hours. Low Safe and Secure Schools and METRO teamed to assist City of Houston and Harris County during evacuations. METRO considers building relationships within community as critically important to preparing for emergency events and make sure everyone is “on the same page” related to METRO’s role.
Low
Fuel Availability and Procurement (during recovery fuel availability may be an issue) METRO has agreement for priority fuel pickup at Shell during evacuations, important as during evacuations as people fill up their vehicles and fuel becomes scarce. Low
Fuel in all METRO facilities is topped off at 98% capacity before occurrence of a known emergency event, such as a hurricane. Low
METRO purchased three tankers and two tractor trucks designed to pull these tankers. Prior to an emergency event, these tankers are filled with fuel and staged at various facilities. High
After an emergency event, fuel is tracked hourly and replenished as follows: METRO has priority at fuel rack and utilizes either third party delivery service or its own tankers to pull fuel from the rack to replenish operating facilities. Low
METRO also has leased fuel storage capacity at an offsite terminal facility. Medium METRO Police provide escorts to fuel deliveries as necessary. Low
Interoperable Communications METRO’s Service Delivery department maintains satellite phones for emergency communications if their radio and phone systems become inoperable. Medium
METRO Police, METRORail and METRO bus operations operate their radios through Harris County’s Regional Radio System. Medium
METRO participates with the rest of the region in using WebEOC for intra-agency communications during emergency events. Low
Order of Succession and Delegation of Authority METRO identified its key personnel for emergency operations. Low (annual process) METRO identified an order of succession in case a key individual becomes unavailable. Low (by emergency management)
Note. METRO views the approximate dollar value of cost ratings as follows: Low – less than $50,000 Medium – between $50,000 and $250,000 High – more than $250,000
FEDERAL TRANSIT ADMINISTRATION 78
PART FOUR: A Spatial Approach to Assess Climate Change Vulnerability ofTransit Assets
Part Four (Sections 8–10) details a spatial approach to assess climate change vulnerability of transit assets.
FEDERAL TRANSIT ADMINISTRATION 79
SECTION
8
Need for Spatially-Oriented Analysis
Problem Statement This section summarizes the key issues and challenges transit agencies must address when dealing with potential climate change impacts. First, it clarifies the current scientific understanding of climate change impacts relevant to transit agency decision-makers. Second, it identifies scientific, organizational, and planning challenges the agencies will face as they address problems related to climate change. Third, it sets forth a spatial analytical process to determine transit locations with the highest risk of impact from potential climate change. Combining methods for multiple-criteria decision-making (MCDM) and spatial decision support systems (SDSS), researchers developed an evaluation approach that can systematically identify transit asset vulnerabilities along the Gulf Coast.
Specifically, the researchers used (1) GIS to measure and map a range of climate change impacts, and (2) spatial statistical analysis vulnerability scores based on overlapping risk values to identify vulnerability hot spots for existing transit assets. Results provide insights on how transit agencies can use SDSS to consider multiple climate change impacts when developing adaptation strategies for their transit assets.
The study area consists of more than 144 coastal counties and parishes along the Gulf of Mexico extending from the Florida Keys westward to the southern tip of Texas and includes jurisdictions from Florida, Georgia, Alabama, Mississippi, Louisiana, and Texas. The Gulf of Mexico provides an ideal area in which to study transit vulnerability to climate change-related events. First, this low-lying coastal margin is extremely vulnerable to the adverse effects of climate change, particularly associated with meteorological events. Second, jurisdictions fringing the Gulf of Mexico have a legacy of rapid population growth and development of transportation systems and associated infrastructure. Across the study area, high-intensity, older urban cores of Houston, New Orleans, and Tampa contrast with more recent sprawling suburbs around these city centers. Finally, the Gulf study area is a principle target for national policy and planning initiatives to reduce the potential adverse impacts of climate change. Decision-makers can, therefore, directly use the results of our assessment as they work to reduce transit-related vulnerabilities along the coast.
FEDERAL TRANSIT ADMINISTRATION 80

SECTION 8: NEED FOR SPATIALLY-ORIENTED ANALYSIS
Climate Change Impacts onTransportation Systems Changes in temperature, precipitation, and sea level that are projected during the 21st century are likely to have numerous implications for the Gulf Coast transportation system. There is very little literature that comprehensively describes Gulf Coast transportation infrastructure vulnerable to climate change impacts, the potential extent of that exposure, or the potential damage costs [27]. However, some salient figures can be put together to better understand these vulnerabilities. For example, 37 percent of the United States’ population lives in the Gulf Coast region, which comprises only 25 percent of the land area. The Gulf Coast region has experienced a 109 percent increase in population since 1970, compared to a 52 percent increase for the U.S. as a whole [3]. This population, in most areas, swells during summer months during the high season for tourism [28]. The Gulf Coast region is projected to experience continued development pressures, with an estimated 15 percent growth in population by 2020 [3]. Many of the most populous coastal counties in south Florida and Texas (namely Harris County) are expected to grow rapidly in the coming decades [29]. More demand for transportation infrastructure will be generated as the population increases, further complicating climate change adaptation for transportation services [27].
Sea-level rise, in combination with expected population growth, will make low-lying coastal areas more vulnerable to extensive flooding and high storm surges. An estimated 2,400 miles of major roadway and 246 miles of freight rail lines are projected to be at risk of permanent flooding within the coming decades [30]. Many of these highways currently have a double function as evacuation routes during hurricanes and other coastal storms as well as barriers to sea intrusion. Highways are not the only mode of transportation at risk. Analysis of the central Gulf Coast region found that changes in climate change over the next 50 to 100 years are likely to have the largest impact on highways, ports, and rail, particularly through sea-level rise and storm surge [30]. Increased energy consumption for refrigerated storage as well as rail and highway maintenance is expected due to temperature extremes. Changes in peak stream flow as a result of extreme precipitation events and sea-level rise will likely affect bridge across multiple modes [30].
Coastal areas also tend to be major centers of economic activity due to their ability to leverage multiple modes of transportation. The Gulf Coast with its large transportation network that connects it with the rest of the country is undoubtedly a large economic driver for the U.S. Seven of the 10 largest ports (by tons of traffic) [31] are located in the Gulf Coast, whose vulnerability was demonstrated during the 2005 tropical storm season [27]. The Gulf Coast is also home to the U.S. oil and gas industries, which provide nearly 30 percent of
FEDERAL TRANSIT ADMINISTRATION 81

SECTION 8: NEED FOR SPATIALLY-ORIENTED ANALYSIS
the nation’s crude oil production and approximately 20 percent of its natural gas production [32]. Much of the infrastructure required to transport the oil and gas to the rest of the country is vulnerable to storm surge and high winds from tropical storm events. Hurricanes Katrina and Rita, for example, disrupted nearly 20 percent of the nation’s refinery capacity and closed oil and gas pipelines [33].
Need for Spatially-Oriented Procedure for UnderstandingAsset Vulnerability The most effective way to limit the impact of climate change is to avoid placing people and infrastructure in vulnerable places (e.g., coastal areas). The Gulf Coast has experienced, and will likely continue to experience, development pressures despite the increased risk of flooding and damage from surge and hurricanes. Developments and infrastructure are difficult to change once they are in place. The inflexibility of infrastructural systems poses serious issues within the context of climate change, especially with regard to emergency planning. As development continues in vulnerable areas, more communities and businesses will be at risk, thus increasing the challenges associated with evacuation from major storms [34]. Transportation planners often fail to consider development patterns when making investment decisions. This is because public-sector transportation planners typically model future travel demand and, thus, the need for new facilities by forecasting expected land use patterns over a 25- to 30-year period [22]. This process does not recognize the external consequences of building such facilities, with very few cases of planners considering the effects of climate change on facility location and the resulting land development [23].
Obtaining relevant and sufficiently-detailed climate change information is critical for transportation decision-makers to make appropriate actions in a timely manner. There is strong scientific consensus and understanding of climate change; however, the use of that knowledge to support decision-making and formulate mitigation and adaptation strategies is much less developed. Most projections and data regarding climate change are collected and compiled at the global level; however, transportation planners and agencies will need much higher spatial and temporal resolutions to better understand how climate change will impact traffic assets at a regional and local level.
The NRC [34] in 2008 acknowledged the following as being necessary tools for decision-makers:
• Accurate digital elevation maps in coastal areas for forecasting the effects of flooding and storm surge heights
FEDERAL TRANSIT ADMINISTRATION 82
SECTION 8: NEED FOR SPATIALLY-ORIENTED ANALYSIS
•GIS that can be used to map the locations of critical transportation infrastructure overlaid with information on climate change effects (e.g., sea-level rise, warming temperatures, etc.)
• Greater use of scenarios that include climate change in the development of long-range transportation plans to pinpoint likely vulnerabilities and ways to address them
• Better transportation network models for examining the system-wide effects of the loss of critical transportation infrastructure links
The impacts of climate change do not follow political or jurisdictional lines; however, most decision-making is structured around these boundaries. For this reason, existing institutional arrangements are not well-suited to address climate change. Policy arrangements that are cross-jurisdictional and more closely reflect the scale of impact are necessary to address impacts such as sea-level rise, drought, and hurricanes. The NRC states that “incentives incorporated in federal and state legislation should be considered as a means of addressing and mitigating the impacts of climate change through regional and multi-state efforts” [34]. One example the NRC gave in 2008 was the use of FIRMs to identify geographic areas vulnerable to climate change and formulate policies for restricting the development of transportation infrastructure in the identified areas [34]. Even though there has been some effort to better align transit agency governance arrangements with climate change-related phenomena, much more work needs to focus on a methodology to assess transportation system vulnerabilities to the potential impacts of climate change. The purpose of this part of the report is, thus, to create a methodology to examine the vulnerabilities of coastal transportation systems to climate-change-related impacts. The results of the study assist Gulf Coast transit agencies in the development of more robust climate change adaptation plans.
FEDERAL TRANSIT ADMINISTRATION 83

SECTION
9
Contributing Factors of Climate ChangeVulnerability along theGulf Coast
Hurricanes and Tropical Storms The magnitude of impact that climate change will have on tropical storms and hurricanes at a global level is still very uncertain; however, it is fairly likely that the intensity of hurricanes making landfall in the Gulf Coast study area will increase [30]. There are three aspects of tropical storms that relate to transportation: precipitation, winds, and wind-induced storm surge. Strong storms intensify these aspects because of their increased periods of precipitation, wind damage occurring through high wind speeds, and wind-induced storm surge with intense wave action, all of which can have devastating effects to land and transportation systems [35].
Recent simulations of storm surge for major hurricanes of Category 3 or greater at today’s elevations and sea levels have demonstrated a 22 to 24 foot surge potential for the Gulf Coast. Hurricane Katrina proved that even these levels might be conservative as its storm surge exceeded these heights in some locations [30]. Hurricanes of this magnitude have the potential to cause serious damage and loss of life in low-lying areas. Storm surge and wave action displaced highway and rail bridge decks during recent hurricanes along the Gulf Coast. Moreover, hurricanes leave debris on roads and rail lines, which can cause damage and interrupt shipments of goods. Shipping routes and schedules are also often disrupted because of diverted freight shipments. Barges can be damaged because of their inability to move out of the storm path, and harbor infrastructure is particularly vulnerable to waves and storm surge [36].
The effects of tropical storms and hurricanes on the transportation network go beyond the impacts of storm surge. More extensive emergency evacuations are likely with an increase in hurricane intensity, placing more demand on highway infrastructure.
Transportation infrastructure and facilities that are vulnerable to hurricanes will likely incur structural damage and may be rendered inoperable. Restoring transportation system performance requires considerable time and investment
FEDERAL TRANSIT ADMINISTRATION 84

SECTION 9: RESEARCH AND EVALUATION
on the part of facility owners. The secondary economic impacts to businesses and communities who rely on these transportation networks could be considerable as well, depending on the time required to restore system performance [30].
Spatial Indicators for Hurricanes and Tropical Storms For this study, increased hurricane frequency was measured by a number of indicators including floodplains, surge zones, property damage, distances to coasts and floodplains, wetland area cover, and stream distance to the floodplain zone. Floodplains were measured by the proportion of jurisdiction containing the 100-year floodplain. The V-zones, flood insurance rates within the 500- and 100-year floodplains, were measured by the percentage within the 100-year floodplain for this study. The data for both of these measurements were provided by FEMA. The surge zone data measured the number of surge events per jurisdiction during the study period. Data for this indicator were provided by Spatial Hazard Events and Losses Database for the United States (SHELDUS). Property damage data was collected from the National Flood Insurance Program (NFIP) and measured by the number of insurance claims in the study area. The distance to the coast was measured by the distance (in meters) from the respondent address to the nearest point on streams. Data for this indicator were provided by NOAA. The presence of wetlands was measured as the percentage of area change in wetland coverage. Distances to streams were measured by the distance (in feet) from the respondent address to the nearest point on a local stream.
Temperature Changes and Drought Land transportation comprises rail, pipelines, and highways. Projected increasing temperatures will affect all of these modes. As the number of days above 90°F— rising in the next century to as much as 115 days per year from the current level of 77 days [37]—stress will increase on both the infrastructure itself and on the people who use and provide transportation services [30]. Excessive summer heat can potentially increase wildfires, threatening surrounding communities and infrastructures, and bringing down rails and roads [38]. Extended periods of increasing heat can result in softening of the pavement and an increase of ruts in the pavement.
Increasing temperatures will inevitably lead to an increase in the consumption of energy for cooling. This applies particularly to freight, train, and truck operations, which require a significant amount of energy for refrigeration. Air-conditioning requirements for passenger vehicles can also be expected to increase, which will likely lead to a need for additional infrastructure at terminal facilities. This increase in energy consumption resulting from higher mean
FEDERAL TRANSIT ADMINISTRATION 85

SECTION 9: RESEARCH AND EVALUATION
temperatures has both environmental and economic costs and may pose a public health concern to vulnerable populations during heat wave conditions [30].
Public transit impacts from increasing temperatures have the potential to be widespread and extremely damaging. The buckling of rails due to overheating can cause derailments, which are avoided by local speed restrictions during hot weather. Rail systems, which rely heavily on an extensive and complex array of electrical train controls and communications systems, are also very sensitive to overheating. During intense heat waves, rail ventilation systems have proven to be inadequate [19]. Other potentially severe impacts could include the failure of air conditioning systems, an increase in maintenance costs by an amount proportional to the number of high temperature days [18], and threats to customer and worker health and safety.
Spatial Indicators for Temperature Changes and Drought The temperature change indicator used in this study was measured as the projected change in temperature based on the Hadley Projection Model scenarios. There are three prediction scenarios, each measuring the projected population growth, gross domestic product (GDP) growth, energy use, land-use changes, resource availability and introduction of new technologies. Scenario A2 predicts a high population growth, medium GDP growth, high energy use, medium to high land-use changes, low resource availability, and slow development of new technologies. Scenario B1 predicts low population growth, high GDP growth, low energy use, high land-use changes, low resource availability, and medium introduction of new technologies. Scenario A1B predicts low population growth, very high GDP growth, very high energy use, low land-use change, medium resource availability, and rapid production of new technologies. Data for this indicator were from the National Center for Atmospheric Research (NCAR). The data set includes historical data beginning from 1895 and then projects the data monthly to the year 2100. The data were projected with a spatial resolution of 1.40625 decimal degrees. Temperature change was measured in degrees Celsius.
Sea-Level Rise and Storm Surge Sea-level rise and storm surge will increase the risk of coastal transportation infrastructures, including both temporary and permanent flooding of airports, roads, rail lines, and tunnels. Rising sea levels are likely to lead to direct losses, such as equipment damage from flooding or erosion, and indirect effects, such as the costs of raising vulnerable assets to higher levels or building new facilities farther inland, increasing transportation costs [39]. A projected rise in sea level in the range of 4 ft within 50 to 100 years is estimated to put 2,400 miles of major roadway and 246 miles of freight rail lines at permanent risk of flooding in the central Gulf Coast region alone [30]. Moreover, service disruption risks are
FEDERAL TRANSIT ADMINISTRATION 86

SECTION 9: RESEARCH AND EVALUATION
likely to be even greater since coastal transportation networks (especially in the Gulf Coast) are interdependent and often rely on minor roads and other low-lying infrastructure.
The Gulf Coast area is also a major center for economic activity, which could exacerbate the negative impacts of climate change. The region contains 7 of the 10 largest ports (by tons of traffic) and is home to the U.S. oil and gas industry with roughly two-thirds of all U.S. oil imports flowing through this region [31]. Sea-level rise and surge would likely affect commercial transportation activities valued in the hundreds of billions of dollars annually through the inundation of area roads, railroads, airports, seaports, and pipelines [30]. Moreover, sea-level rise will increase the frequency of inundation and interruption in travel along the Gulf Coast. More frequent evacuations can be expected due to severe storm surges. Many coastal cities along the Gulf have tunnels, parking lots, and other transportation infrastructure below ground, which will also experience more frequent and severe flooding as a result of sea-level rise. High sea levels, storm surges, and the loss of coastal wetlands and barrier islands will also increase the vulnerability of road bases to erosion and compromise the structural integrity of bridge supports [36].
Storm surges pose huge threats to transit infrastructures as many of the region’s major roads, railroads, and airports have been constructed on land surfaces at elevations below 16 ft [30]. The damage inflicted upon transportation facilities includes immediate flooding of infrastructure, damage caused by the force of water, and secondary damage caused by collisions with debris.
Spatial Indicators for Sea-Level Rise and Storm Surge Storm surge and sea-level rise data are interrelated for this indicator. The eustatic and local sea-level rise rates were determined to project future storm surge data. Global sea-level rise are presented as a range dependent on the type of Hadley Projection scenario used in the data analysis. The ranges were projected by the Intergovernmental Panel on Climate Change (IPCC). The Coastal Vulnerability Index data provided the local levels of sea-level rise. Data for storm surges zones were from NOAA.
Elevation and Subsidence The majority of the study area lies below 100 ft in elevation [8] and, as a consequence, is prone to flooding during heavy rainfall events, hurricanes, and tropical storms. Moreover, the impact of flooding is compounded in areas experiencing subsidence. Many of the areas within the Gulf Coast are experiencing subsidence, which has resulted in an apparent increase in sea level.
FEDERAL TRANSIT ADMINISTRATION 87

SECTION 9: RESEARCH AND EVALUATION
Recent geological and geophysical studies suggest that subsidence is occurring more rapidly than previously thought along the Gulf Coast. That said, the rate of subsidence varies across the area and is driven primarily by differences in geological and human activity [6]. Parts of Alabama, Texas, and Louisiana are experiencing subsidence rates that are much higher than the 20th-century rate of global sea-level rise of 1–2 mm/year [7]. For example, the rate of subsidence in the New Orleans area between 1950 and 1995 was about 5 mm/year [5], with some levees, roads, and artificial-fill areas sinking at rates that exceed 25 mm/ year [9]. Due to subsidence, the forced drainage of highly organic soils, and other human development activity, most of the city of New Orleans is below sea level.
The Houston-Galveston region is another area where subsidence, primarily driven by groundwater pumping and oil and gas extraction, has had an adverse impact. Most of the extraction occurred between the 1940s and 1970s, which was marked by an era of rapid growth in the development of groundwater extraction driven primarily by the expansion of the petrochemical industry. As a result, by the end of the 1970s, up to 10 ft of subsidence had occurred, and almost 3,200 square miles had subsided by more than 1 foot. The growing awareness of subsidence and its associated impacts and increases in coastal flooding resulted in the creation of the Harris-Galveston Coastal Subsidence District, which was authorized as the regulatory agency to restrict groundwater withdrawal and to promote water conservation programs [10].
Increases in flood damage, caused in part by subsidence, FEMA created new Base Flood Elevations maps in 2007. However, the rates of subsidence are so high within the study area that many of these flood maps can be outdated within just a few years, yet it is these maps which form the basis for establishing flood control systems [11].
Spatial Indicators for Elevation and Subsidence Sea-level rise indicators for this study required consideration of both eustatic and local sea-level rise levels. Global sea-level rise is presented as a range dependent on the type of Hadley Projection scenario used in the data analysis. The ranges were projected by the IPCC. Global sea-level rise was subtracted from the local sea level to determine the subsidence levels of the Gulf Coast. The elevation of the Gulf Coast also was used to determine the overall sea-level rise of the study area. The data set used was the NASA SRTM 30 digital elevation model.
Precipitation A recent study conducted in the central Gulf Coast region found that mean precipitation levels appear to have less impact on transportation than do sea-level rise, storm surge, and temperature extremes. That said, changes in
FEDERAL TRANSIT ADMINISTRATION 88

SECTION 9: RESEARCH AND EVALUATION
precipitation extremes are still likely, which would affect transportation network operations, safety, and storm water management infrastructure [30].
Heavy Precipitation Precipitation frequency, intensity, and duration impacts transportation in different ways and are often the drivers of design specifications. Heavy precipitation affects most transit sector activities [40] and is correlated to a higher incidence of crashes and delays, affecting both safety and mobility [30]. Heavy precipitation constitutes the most costly weather situation to railroad transportation [41]. Storms that produce rain of sufficient intensity can result in road submersion and flooded low-lying underpasses. Moreover, erosion from the combined effect of turbulent seas and heavy precipitation causes damage to coastal roads, pipelines [42], and bridges. Bridge construction will likely be impacted due to increasing flood heights as a result of the increasing frequency of the 100-year flood. Many bridges and roads can act as dams during heavy precipitation events, increasing the potential for flooding. For example, several people have drowned in their vehicles under highway underpasses in Texas and Louisiana during the past 15 years [8].
Buses that operate on streets that flood frequently will likely have to be rerouted or suspend service altogether during heavy precipitation events. Moreover, power outages, which frequently accompany intense rainfall events, can disable transit service. Other non-municipal transit providers can be impacted. Paratransit services can be disabled with serious consequences for users who have no alternative form of transportation [19]. Bus accident rates have also been known to increase as precipitation increases [43].
Non-Coastal Flooding While coastal flooding usually results from a combination of sea-level rise and storm surge, non-coastal flooding is a direct result of precipitation. The standard used to predict flood frequency is the 100-year floodplain, which predicts that there is a 1 percent chance of flood occurring of that magnitude any given year. The mapping of these floodplains is done by FEMA and is largely based on outdated analysis with about 45 percent of the country’s flood maps based on outdated precipitation data [44]. As a result, the design of many transportation structures does not meet the criteria for a 100-year storm calculated using more recent data. Runoff occurring from flooding inland often leads to increased peak stream flow, which will affect the sizing requirements for bridges and culverts.
Spatial Indicators for Precipitation Indicators representing increased precipitation include flooding, precipitation change, soil porosity, impervious surface, wetlands, distance streams, rainfall frequency, and property damage. Flooding was measured by insurance claims by
FEDERAL TRANSIT ADMINISTRATION 89

SECTION 9: RESEARCH AND EVALUATION
respondents within the 100-year floodplain. The precipitation change indicator was the projected change in precipitation based on the Hadley Projection Model scenarios. There are three prediction scenarios, each measuring the projected population growth, GDP growth, energy use, land-use changes, resource availability and introduction of new technologies. Scenario A2 predicts a high population growth, medium GDP growth, high energy use, medium to high land-use changes, low resource availability, and slow development of new technologies. Scenario B1 predicts low population growth, high GDP growth, low energy use, high land-use changes, low resource availability, and medium introduction of new technologies. Scenario A1B predicts low population growth, very high GDP growth, very high energy use, low land-use change, medium resource availability, and rapid production of new technologies. Data for this indicator are from the National Center for Atmospheric Research. The data set includes historical data beginning from 1895 and then projects the data monthly to the year 2100. The data were projected with a spatial resolution of 1.40625 decimal degrees.
Soil infiltration was measured by an infiltration rate of inches per hour. Data for this indicator were provided by the Soil Survey Geographic database (SSURGO). Effects on impervious surfaces will be determined by proportion of jurisdiction covered by impervious surfaces. The wetland indicator was measured by the percentage of change to the wetland cover area. The Coastal Change and Analysis Program at NOAA and Landsat Imagery provided the data for these indicators. Distance to streams was determined by distance (in feet) from the respondent’s address to the nearest location point by local streams. Data were provided by National Hydrography Dataset. Rainfall frequency was measured in inches per hour. Data were provided by NCDC-NOAA (National Climatic Data Center-National Oceanic Atmospheric Administration). Property damage was determined by the total property damage caused by a flood event as inventoried. Data were courtesy of SHELDUS.
FEDERAL TRANSIT ADMINISTRATION 90

SECTION
10
How to Use GIS to Assess Transit Asset Vulnerability to Climate Change
Climate Change Vulnerability Index(CCVI) Methodology The CCVI methodology consists of the following three primary tasks, each of which is described in more detail:
• Identify the study area or facility.
• Calculate the CCVI rating(s).
• Analyze findings to evaluate vulnerability.
Identify Study Area or Facility The study area consists of more than 144 coastal counties and parishes along the Gulf of Mexico, extending from the Florida Keys westward to the southern tip of Texas, and includes jurisdictions from Florida, Georgia, Alabama, Mississippi, Louisiana, and Texas (see Figure 10-1).
Figure 10-1 Coastal Watersheds and Counties that Make Up the Gulf Coast [3]
FEDERAL TRANSIT ADMINISTRATION 91

SECTION 10: HOW TO USE GIS TO ASSESS TRANSIT ASSET VULNERABILITY TO CLIMATE CHANGE
Calculate the CCVI Rating(s) Researchers aggregated spatial data to form the following climate change dimensions (see Table 10-1) that are most likely to affect transit assets within the Gulf of Mexico region: 1) hurricanes, 2) rainfall, 3) sea-level rise, and 4) temperature change.
Each of these dimensions is a composite of multiple spatial data layers collected primarily from public agencies and widely accepted climate change models. For example, the hurricane dimension consists of spatial indicators such as floodplains, surge zones, and distance to coast to assess the vulnerability of a transit asset to hurricane damage. However, assessing only static variables will not suffice given the temporally dynamic nature of climate change. Where possible, the researchers used existing climate models to predict future changes in a dimension. The A1B scenario from the Hadley Centre for Climate Prediction was used for the projected data. If no data could be found to predict future changes for a given dimension, then historic estimates were used to calculate a rate of change. For example, historic damage estimates for hurricanes can be used to predict a rate of change over time. The climate change dimensions and their corresponding spatial data layers are listed and described in Table 10-1. The indicators for each climate change dimension and the spatial data layers are not intended to be an exhaustive list, but were selected as the representative set of weather phenomena most likely to affect transit assets on the Gulf Coast as a result of climate change [27].
FEDERAL TRANSIT ADMINISTRATION 92

SECTION 10: HOW TO USE GIS TO ASSESS TRANSIT ASSET VULNERABILITY TO CLIMATE CHANGE
Table 10-1 Climate Change Dimensions and Spatial Data Layers
Dimension Spatial Indicator Description
1. Hurricanes Floodplains Distance to FEMA-designated 100-year floodplain boundaries.
Surge Zones Distance to NOAA designated Category 5 surge risk zone.
Property Damage FEMA insured losses from 1998 to 2009.
Distance to Coast Distance to coastline using Bay/Inlet and Sea/Ocean layers from the National Hydrological Dataset.
Wetlands Distance to any wetland type as designated by NOAA’s 2006 land cover dataset.
Distance to Streams Distance to perennial streams as designated by the National Hydrological Dataset.
2. Rainfall Floodplains Distance to FEMA-designated 100-year floodplain boundaries.
Wetlands Distance to any wetland type, as designated by NOAA’s 2006 land cover dataset.
Precipitation Change NCAR projected rate of change in precipitation from 2012 to 2050.
Soil Porosity Measured using SSURGO’s soil hydraulic conductivity field.
Impervious Surfaces Percent imperviousness calculated using NOAA’s 2006 land cover dataset.
Distance to Streams Distance to perennial streams, as designated by the National Hydrological Dataset.
Property Damage FEMA-insured losses from 1998 to 2009.
3. Sea-Level Rise
Coastal Vulnerability Index
Calculated by Thieler and Hammar-Klose’s [12] assessment of sea-level rise (SLR) vulnerability.
Elevation Calculated using NASA’s SRTM30 Digital Elevation Model.
Distance to Coast Distance to coastline using Bay/Inlet and Sea/Ocean layers from the National Hydrological Dataset.
4. Temperature Change
Expected Increase NCAR 2000 to 2100 projected temperature increase.
All spatial data were assembled into a GIS as raster layers. A standardized score was calculated for each cell within the raster. Each indicator layer within its associated dimension was summarized to provide a value score that ranged from 0 to 100 for each dimension. Because the number of spatial data layers comprising a dimension varied, researchers normalized the final value score by dividing it by the total number of spatial data layers.
Finally, the numeric scores for each climate change dimension were summed to derive a Climate Change Vulnerability Index (CCVI) for each transit asset. A mean CCVI score of all of the cells within the service area boundary of each transit asset was then calculated. A lower CCVI indicates for a transit asset a greater degree of vulnerability to climate-change impacts. Thus, for the purpose of this study, researchers recommend prioritizing transit asset adaptation efforts according to their associated climate change index value.
To limit the degree of computational complexity and potential for interpretation bias of results, no weight or scale for individual spatial data layers was used in the formulation of an index. An alternative approach could be to weight each dimension by its asset-risk profile (i.e., the magnitude of the impact for a given asset multiplied by the likelihood of the impact occurring during the asset’s
FEDERAL TRANSIT ADMINISTRATION 93

SECTION 10: HOW TO USE GIS TO ASSESS TRANSIT ASSET VULNERABILITY TO CLIMATE CHANGE
useful life). However, the form and scale of the data will likely not permit such a detailed analysis. Transit agencies may choose to weight the spatial data layers by their relative importance—the research team did not weight variables to avoid introducing a level of subjectivity into the analysis without input from Gulf Coast stakeholders. Even then, the problem of separating perceived risks from actual risks remains a major issue given the timescales and dynamic nature of climate change. In any case, the range of alternative statistical and computation techniques available for examining stakeholder values should not be ignored and may provide guidance for future studies in transit asset vulnerability to climate change.
Analyze Findings to Evaluate Vulnerability The data were analyzed in a series of steps. The first step was to calculate descriptive statistics for each spatial indicator across the entire study area and use their corresponding z-scores to calculate each climate change dimension value. The second step was to map and graphically analyze each climate change dimension using a two-standard deviation stretch symbology to assess the variation of climate change vulnerability. The third step was to extract the values of the each dimension raster to the asset’s service area boundary to measure asset specific climate change dimension values as well as the asset’s CCVI.
Case Study Application of CCVI Methodology to HART Operations Facility Researchers applied the CCVI methodology to one case study site—HART’s operations facility at 4305 East 21st Avenue in Tampa. The facility is HART’s primary operations facility and, as such, is home to its administrative, planning, maintenance, vehicle storage, and all other agency functions. The site was selected for case study analysis as it is occasionally indirectly or directly affected by street flooding. Figure 10-2 depicts the relative location of the site in the Tampa Bay region.
FEDERAL TRANSIT ADMINISTRATION 94

SECTION 10: HOW TO USE GIS TO ASSESS TRANSIT ASSET VULNERABILITY TO CLIMATE CHANGE
Figure 10-2 Location of HART’s Operations Facility (with half-mile buffer)
Figure 10-3 is an aerial image of the operations facility. The white-top vehicles are motor-coaches and low-floor transit buses used primarily for park-and-ride and fixed-route services. The smaller, blue-top vehicles are those used for complementary paratransit service. Employee and visitor parking are located in the parking lot adjacent to 21st Avenue on the northern edge of the site. Planning and administrative functions are located in the building primarily to the east of the personal vehicle parking area on the northeastern portion of the site. Vehicle maintenance and fueling occur in the two buildings in the southern half of the site.
FEDERAL TRANSIT ADMINISTRATION 95

SECTION 10: HOW TO USE GIS TO ASSESS TRANSIT ASSET VULNERABILITY TO CLIMATE CHANGE
Source: Google, 2013
Figure 10-3 Aerial Image of HART Operations Facility
Researchers applied the CCVI methodology and found that HART’s operations facility had a CCVI score of 45 on a 100-point scale (see Figure 10-4). A score of 0 indicates extreme high vulnerability to climate change impacts. A score of 100 indicates extreme low vulnerability to climate change impacts. All scores are a rating of vulnerability (i.e., risk) based on comparing the HART site to the Gulf Coast as a region.
What does this mean? A score of 100 represents the lowest possible climate change vulnerability score within the Gulf Coast; it does not mean there is no vulnerability to climate change. The hurricane dimension (14 out of 100) and sea-level rise dimension (35 out of 100) had the lowest scores and are the two most serious areas of vulnerability. Rainfall (69 out of 100) and temperature (64 out of 100) are the two least serious areas of potential vulnerability.
FEDERAL TRANSIT ADMINISTRATION 96
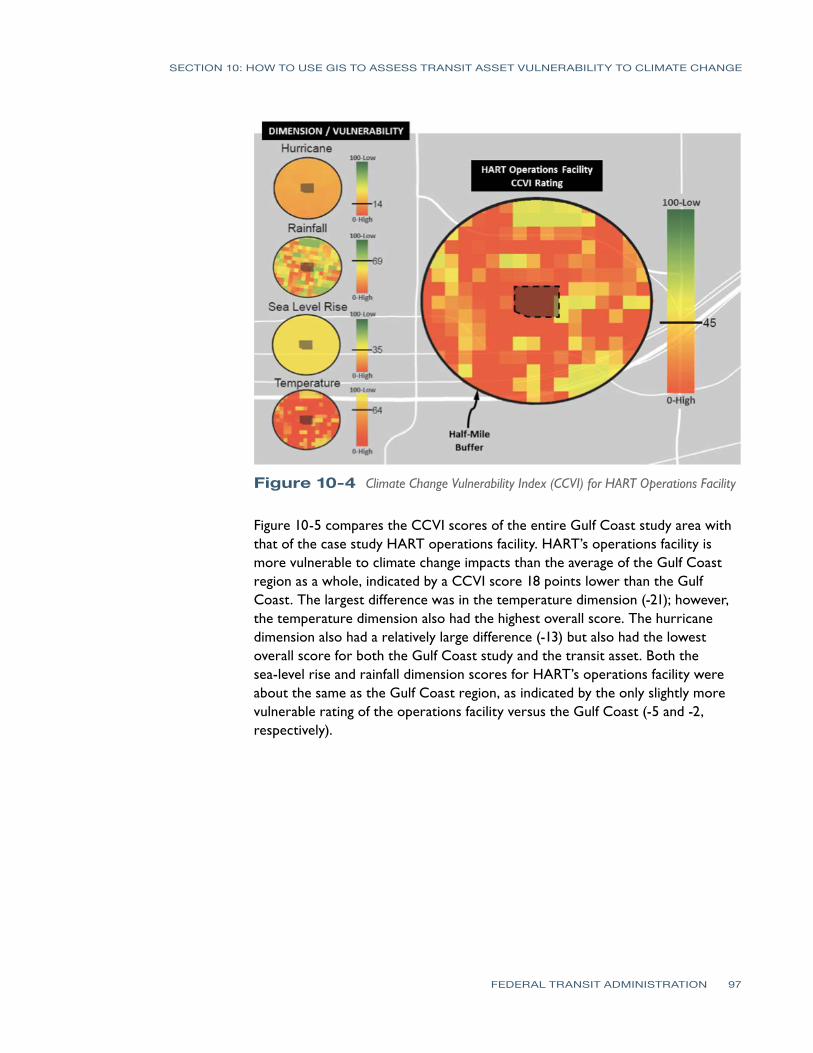
SECTION 10: HOW TO USE GIS TO ASSESS TRANSIT ASSET VULNERABILITY TO CLIMATE CHANGE
Figure 10-4 Climate Change Vulnerability Index (CCVI) for HART Operations Facility
Figure 10-5 compares the CCVI scores of the entire Gulf Coast study area with that of the case study HART operations facility. HART’s operations facility is more vulnerable to climate change impacts than the average of the Gulf Coast region as a whole, indicated by a CCVI score 18 points lower than the Gulf Coast. The largest difference was in the temperature dimension (-21); however, the temperature dimension also had the highest overall score. The hurricane dimension also had a relatively large difference (-13) but also had the lowest overall score for both the Gulf Coast study and the transit asset. Both the sea-level rise and rainfall dimension scores for HART’s operations facility were about the same as the Gulf Coast region, as indicated by the only slightly more vulnerable rating of the operations facility versus the Gulf Coast (-5 and -2, respectively).
FEDERAL TRANSIT ADMINISTRATION 97

SECTION 10: HOW TO USE GIS TO ASSESS TRANSIT ASSET VULNERABILITY TO CLIMATE CHANGE
Figure 10-5 Comparison of
HART Facility and Gulf Coast Region
Discussion of Case Study Findings Visual and descriptive statistical analyses of each climate change dimension within a half-mile buffer of a selected transit asset (HART’s operations facility) vary in their potential to generate exposure to climate change. This variation is due to the ranges in the values of each spatial indicator identified in Table 10-1. Overall, HART’s operations facility is more vulnerable to climate change relative to the Gulf Coast study area, as indicated by the difference in their corresponding CCVIs. This should only add emphasis, if not a degree of urgency, for the implementation of climate-change adaptation plans, as the Gulf Coast is already experiencing the impacts of climate change-related events. Understanding which dimensions influence the CCVI score the most will help prioritize mitigation strategies.
The dimension values for the asset indicate that the bus barn has the highest degree of vulnerability to hurricanes and sea-level rise. Moreover, the hurricane dimension has the second largest difference when compared to the Gulf, which already has a high degree of hurricane exposure. Hurricane exposure is complicated by the fact that sea-level rise and hurricanes have synergistic effects. The asset’s proximity to the coast, as well as its low elevation, are the spatial indicators that influenced sea-level rise exposure the most. Over time, as the sea level rises, the impacts of hurricanes on this particular asset will likely increase primarily due to increased surge levels and the likelihood of inundation.
Although the temperature and rainfall dimensions scored much higher than sea-level rise and hurricane dimensions, they still greatly contributed (especially
FEDERAL TRANSIT ADMINISTRATION 98

SECTION 10: HOW TO USE GIS TO ASSESS TRANSIT ASSET VULNERABILITY TO CLIMATE CHANGE
temperature) to the operations facility’s overall CCVI rating. The temperature dimension for the case study site differed the most from the Gulf Coast average, indicating that warming trends will likely have a stronger impact on HART’s operations facility than the impact of temperature change will across the entire Gulf Coast region. This is due, in large part, to the amount of impervious surface near the operations facility, which will cause a localized heating phenomenon referred to as the “Urban Heat Island.” Heat is of particular concern as it poses specific issues for the operation and maintenance of transit vehicles.
The rainfall dimension scored the highest for the asset and was most similar to the Gulf Coast average vulnerability rating. This result may make the rainfall dimension seem like the lowest priority initially, but that would be inaccurate, especially when considering that its benchmark (the Gulf Coast) contains some of the nation’s most flood vulnerable areas (e.g., New Orleans and Houston). Moreover, HART has occasionally experienced site or near-site flooding due to heavy rainfall storms.
The integration of the data and analyses generated by this report with asset specific knowledge will be critical in determining which specific climate change strategies to prioritize. However, adaptation should not stop at merely focusing on specific hazards and prioritizing mitigation strategies accordingly. As the literature has shown, much attention must be given to addressing climate change in a systematic fashion by acknowledging the synergies and interactions between climate change dimensions and in working to mitigate long-term impacts by collaborating with stakeholders in many sectors of the economy.
Overall Conclusions from CCVI Methodology Development Using GIS to identify and map areas of climate change vulnerability can inform transit agencies on how to adapt to future change. Indeed, this part of the pilot study report tested a methodology to assess climate change vulnerability was on a single transit asset in Florida at HART. Gulf Coast transit agencies can use replicate methodology to assess the vulnerability of all transit assets within the service area to the impacts of climate change. The methodology is not meant to replace existing transit asset hazard mitigation plans but, instead, provides a model for how multiple hazard related spatial indicators could be leveraged to help prioritize climate change adaptation strategies—augmenting existing and future emergency and risk planning processes.
The methodology and case study findings can provide useful information for transit agencies; however, no study is without limitations and this one is no exception. First, the range of value proxies for spatial indicators is not fully representative of all the possible variables that could affect each climate change
FEDERAL TRANSIT ADMINISTRATION 99
SECTION 10: HOW TO USE GIS TO ASSESS TRANSIT ASSET VULNERABILITY TO CLIMATE CHANGE
dimension. This study selected four dimensions with their associated spatial indicators (Table 10-1) as an initial analysis to test the efficacy of the mapping technique. Second, differences in the specificity of spatial data layers are a limiting factor in measuring value proxies. For example, although imperviousness is calculated at a 30 × 30 meter grid, the same level of specificity is not available for precipitation changes. Third, combining spatial data layers with different levels of specificity and from different sources compounds spatial error. Spatial data, in all cases, are merely representations of reality and no data are free of error [72]. Fourth, the impact of several values, such as floodplains, wetlands, and imperviousness, might extend beyond our pre-determined buffer. Future research should accommodate this by generating variables that describe the relevant spatial indicators at a more appropriate scale (i.e., the watershed). Fifth, this study is based on the assumption that all variables have the same amount of influence on their respective dimension. However, it is likely the case that some of the spatial indicators have a stronger influence on true climate vulnerability for an agency than others. Future research should focus on ways to weight each spatial indicator in a scientific, unbiased fashion. Sixth, many of the spatial indicators are based on past values measured at a single point in time. In reality, values shift over time with changing biophysical and development conditions; the static nature of much of the spatial data does limit the usefulness of our results for policymaking in the future (i.e., can reassess only infrequently). Finally, the calculation of dimension scores was based on the best available data and information. Analyses were limited to existing publicly available spatial data layers. Use of additional data would enhance the reliability of the results. For example, additional and current spatial information on surge zones and sea-level rise would improve the quality of the findings.
This report provides a first step in identifying the degree of climate change vulnerability within existing transit asset buffers and/or service areas based on multiple spatial indicators. First, the methodology uses relatively simple methods for measuring the climate change dimension values by summarizing the standardized score of relevant spatial indicators. More sophisticated methods for scaling and weighting spatial data would refine the measurement of climate change vulnerability. For example, stakeholder surveys could be used to create weights of importance to assign to specific values. Finally, and most importantly, the methods described in this report need to be applied in an actual planning exercise where planner and transit agencies use the vulnerability maps to guide the adaptation process. Only then can the effectiveness of using GIS to identify potential conflict be fully explored.
FEDERAL TRANSIT ADMINISTRATION 100
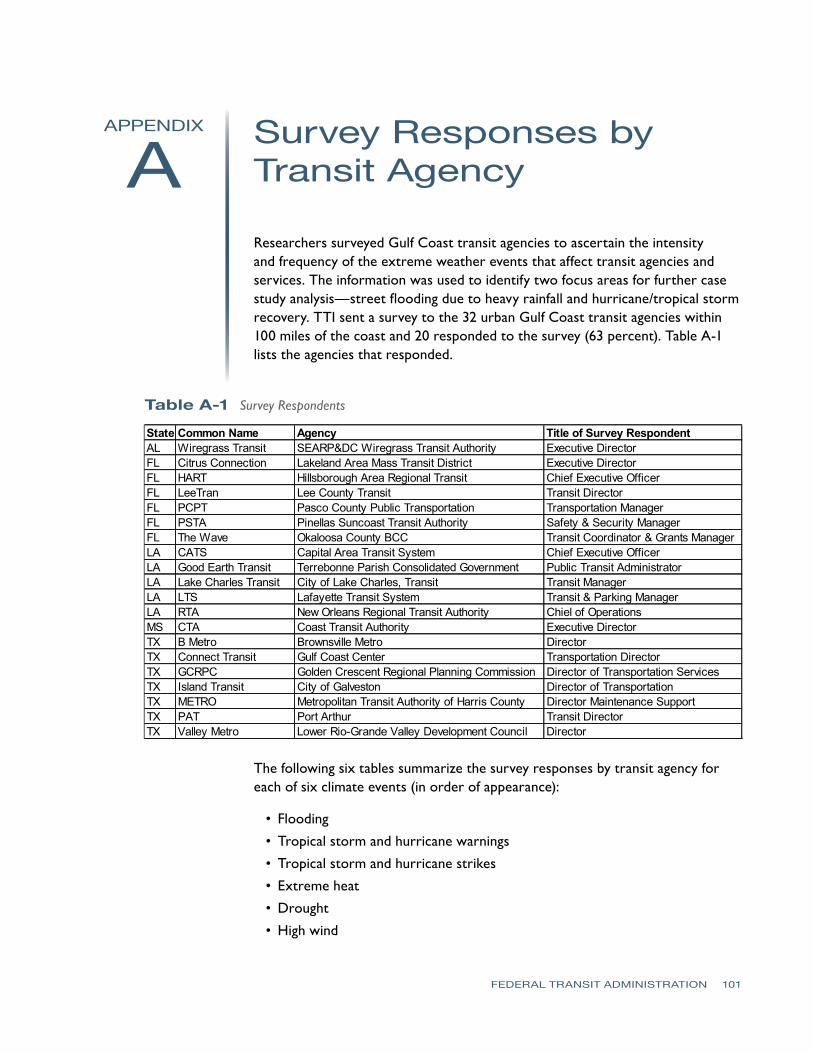
APPENDIX
FEDERAL TRANSIT ADMINISTRATION 101
A
Survey Responses byTransit Agency
Researchers surveyed Gulf Coast transit agencies to ascertain the intensity and frequency of the extreme weather events that affect transit agencies and services. The information was used to identify two focus areas for further case study analysis—street flooding due to heavy rainfall and hurricane/tropical storm recovery. TTI sent a survey to the 32 urban Gulf Coast transit agencies within 100 miles of the coast and 20 responded to the survey (63 percent). Table A-1 lists the agencies that responded.
Table A-1 Survey Respondents
State Common Name Agency Title of Survey Respondent AL Wiregrass Transit SEARP&DC Wiregrass Transit Authority Executive Director FL Citrus Connection Lakeland Area Mass Transit District Executive Director FL HART Hillsborough Area Regional Transit Chief Executive Officer FL LeeTran Lee County Transit Transit Director FL PCPT Pasco County Public Transportation Transportation Manager FL PSTA Pinellas Suncoast Transit Authority Safety & Security Manager FL The Wave Okaloosa County BCC Transit Coordinator & Grants Manager LA CATS Capital Area Transit System Chief Executive Officer LA Good Earth Transit Terrebonne Parish Consolidated Government Public Transit Administrator LA Lake Charles Transit City of Lake Charles, Transit Transit Manager LA LTS Lafayette Transit System Transit & Parking Manager LA RTA New Orleans Regional Transit Authority Chiel of Operations MS CTA Coast Transit Authority Executive Director TX B Metro Brownsville Metro Director TX Connect Transit Gulf Coast Center Transportation Director TX GCRPC Golden Crescent Regional Planning Commission Director of Transportation Services TX Island Transit City of Galveston Director of Transportation TX METRO Metropolitan Transit Authority of Harris County Director Maintenance Support TX PAT Port Arthur Transit Director TX Valley Metro Lower Rio-Grande Valley Development Council Director
The following six tables summarize the survey responses by transit agency for each of six climate events (in order of appearance):
• Flooding
• Tropical storm and hurricane warnings
• Tropical storm and hurricane strikes
• Extreme heat
• Drought
• High wind

Table A-2 Flooding: Survey Responses
APPENDIX A: A SURVEY RESPONSES BY TRANSIT AGENCY
AL FL FL FL FL FL FL LA LA LA LA LA MS TX TX TX TX TX TX TX Wire-grass Transit
Citrus Conn. HART LeeTran PCPT PSTA
The Wave CATS
Good Earth Transit
Lake Charles Transit LTS RTA CTA B Metro
Connect Transit GCRPC
Island Transit METRO PAT
Valley Metro
Since 2001, what is the approximate frequency in which flooding due to heavy rain impacts your agency?
Less frequently than once each year
11-20 days each year
More than 20 days per year
More than 20 days per year
1-5 days each year
Less frequently than once each year
Less frequently than once each year
11-20 days each year
1-5 days each year
Less frequently than once each year
1-5 days each year
1-5 days each year
6-10 days each year
Less frequently than once each year
1-5 days each year
1-5 days each year
Less frequently than once each year
1-5 days each year
More than 20 days per year
1-5 days each year
What has been the severity of the impacts of flooding due to heavy rains on different aspects of your agency operations? (0 = no impact, 5 = severe/catastrophic) Bus Transit Service Delivery 1 5 4 1 2 3 0 3 2 0 4 2 4 1 1 2 2 3 2 4 Rail Operations 0 N/A 4 N/A N/A N/A 0 N/A N/A N/A N/A 2 0 N/A N/A N/A 4 2 N/A N/A Vehicle Maintenance and Repair 0 5 3 2 0 0 0 1 0 0 N/A 0 1 1 N/A 3 1 N/A 3 Passenger Comfort 2 5 4 3 2 0 0 5 4 0 3 4 4 1 1 N/A 2 2 N/A 5 Passenger Safety 3 4 3 0 0 3 3 4 1 0 3 1 3 N/A 1 2 2 2 4 3 Employee Safety 3 4 4 1 0 1 4 3 1 0 0 1 3 N/A 1 2 2 4 3 Passenger Facilities 1 4 5 1 0 4 1 2 1 0 0 1 4 1 1 2 3 2 N/A 3 Operations and Maintenance Facilities 0 4 4 1 0 2 0 1 0 0 0 1 1 2 1 N/A 2 2 N/A 3 Fixed Guideway Right-of-Way 0 N/A 4 N/A N/A N/A 0 N/A N/A N/A N/A 3 0 N/A N/A N/A 4 2 5 N/A
What has been the severity of the impacts of flooding due to heavy rains on other aspects of your agency business? (0 = no impact, 5 = severe/catastrophic) Emergency Management Team 1 4 3 1 2 0 2 1 3 0 4 2 2 0 1 2 0 2 5 3 Public Information and Communications 1 4 5 1 2 0 2 3 3 0 0 1 2 0 1 2 1 2 5 4 Planning and/or Scheduling 2 4 3 1 2 3 2 3 3 0 0 0 3 0 1 N/A 0 3 3 4 Evacuation of Vulnerable Populations 0 4 2 1 2 3 2 0 3 0 0 1 3 1 1 N/A 0 2 4 3
FEDERAL TRANSIT ADMINISTRATION 102

Table A-2 Flooding: Survey Responses (cont'd.)
APPENDIX A: A SURVEY RESPONSES BY TRANSIT AGENCY
What aspects of your agency assets and/or services are most vulnerable to flooding? What adaptation strategies has your agency undertaken to address the impacts of flooding? AL Wiregrass Transit Public transit operations Safety training and reinforcement FL Citrus Connection ADA Paratransit Evacuate ADA sites prior to storms
FL HART 60% of service area is located in flood zones Established SOPs for equipment, fleet relocation, emergency evacuation of staff and population, and for facility shutdown
FL LeeTran Service delivery Monitor risk, participate in Emergency Operations Incident Command FL PCPT Transit routing and adherence to schedules Re-route buses FL PSTA Bus yard Memorandum of Understanding (MOU) with school board FL The Wave LA CATS Buses, ultra-low floor
LA Good Earth Transit
Route detours due to street flooding impact riders. Most fixed assets are located on high ground less vulnerable to street flooding. During tropical storms and hurricanes all transit services cease and agency assists region to evacuate vulnerable populations.
We have precautionary strategy to prevent loss of mobile assets by relocating them to higher ground. The office and maintenance facility is located in an area that less vulnerable to storm flooding due to its higher elevation, however the roads providing access to the facility could be submerged during a hurricane storm surge.
LA Lake Charles Transit None LA LTS Bus stops and shelters Visual inspection of flooding areas and re-routing affected buses LA RTA Bus Service Plans in place for detours relative to low lying areas MS CTA Bus Operations Developed alternative routes TX B Metro Buses and some of the service area B Metro staff work with the Office of Emergency Management in preparation for events
TX Connect Transit Services - flooding impacts fixed route and demand response on-time performance by creating delays or cancellations. Assets - flooding can result in vehicle damages and create maintenance issues.
Our flooding issues typically are a result of tropical storms or hurricanes. We have arrangements with the Santa Fe ISD to park our buses at their high school parking lot as it is on a high ground and not prone to flooding.
TX GCRPC Southern Victoria prone to flooding fixed route and flex route bus stops are affected. Identified temporary bus stop locations TX Island Transit Routing Planned alternate routes TX METRO Local transit and park & ride service Re-route buses and communicated to customers
TX PAT A place to leave the fleet and equipment - no high ground in jurisdiction Broadcast alerts, follow emergency management practices as per FEMA and NIMS. Stakeholders use past experiences to prepare for and brace for storm impacts.
TX Valley Metro Fleet and passenger amenities Service reduction, alternative routing
FEDERAL TRANSIT ADMINISTRATION 103

Table A-3 Tropical Storm and Hurricane Warnings: Survey Responses
APPENDIX A: A SURVEY RESPONSES BY TRANSIT AGENCY
AL FL FL FL FL FL FL LA LA LA LA LA MS TX TX TX TX TX TX TX Wire-grass Transit
Citrus Conn. HART LeeTran PCPT PSTA
The Wave CATS
Good Earth Transit
Lake Charles Transit LTS RTA CTA B Metro
Connect Transit GCRPC
Island Transit METRO PAT
Valley Metro
Since 2001, what is the approximate frequency that a warning of a tropical storm or hurricane impacts your agency?
2 Times per year
4 or More Times per year
Less Frequent ly than once each year
4 or More Times per year
2 Times per year
4 or More Times per year
2 Times per year
Less Frequ ently than once each year
1 Time per year
Less Frequentl y than once each year
3 Times per year
2 Time s per year
1 Time per year
Less Frequentl y than once each year
1 Time per year
3 Times per year
Less Frequentl y than once each year
Less Frequen tly than once each year
3 Times per year
1 Time per year
What has been the severity of the impact of a warning of a tropical storm or hurricane on different aspects of your agency operations? (0 = no impact, 5 = severe/catastrophic) Bus Transit Service Delivery 2 5 5 3 3 5 1 4 1 0 5 3 3 2 1 5 0 2 5 5 Rail Operations 0 N/A 5 N/A N/A N/A 0 N/A N/A 0 N/A 3 N/A N/A N/A 0 2 N/A N/A Vehicle Maintenance and Repair 1 4 5 1 1 5 1 1 0 0 5 0 3 2 1 5 1 2 N/A 3 Passenger Comfort 2 4 5 3 3 5 1 4 0 0 0 2 2 2 1 N/A 0 2 4 5 Passenger Safety 2 4 5 0 1 3 1 4 0 0 5 0 2 0 1 5 0 2 4 4 Employee Safety 2 4 5 2 1 3 1 3 0 0 5 0 3 0 1 5 0 2 4 Passenger Facilities 0 4 5 1 1 3 1 1 0 0 4 0 3 2 1 5 0 2 2 3 Operations and Maintenance Facilities 0 4 5 1 1 3 0 1 0 0 0 0 3 2 1 5 1 2 4 3 Fixed Guideway Right-of-Way 0 4 5 N/A N/A N/A 0 N/A N/A N/A N/A 0 N/A N/A N/A 0 2 5 N/A
What has been the severity of the impact of a warning of a tropical storm or hurricane on other aspects of your agency business? (0 = no impact, 5 = severe/catastrophic) Emergency Management Team 2 4 5 4 4 0 1 1 4 0 3 4 4 2 1 5 3 4 N/A 3 Public Information and Communications 2 4 5 4 4 0 1 3 3 0 1 4 4 2 1 5 3 4 5 3 Planning and/or Scheduling 2 4 5 4 4 5 1 3 2 0 4 0 4 2 1 5 3 4 4 3 Evacuation of Vulnerable Populations 0 4 5 4 4 0 1 2 2 0 4 0 4 1 1 5 3 4 5 3
FEDERAL TRANSIT ADMINISTRATION 104

Table A-3 Tropical Storm and Hurricane Warnings: Survey Responses (cont'd.)
APPENDIX A: A SURVEY RESPONSES BY TRANSIT AGENCY
What aspects of your agency assets and/or services are most vulnerable if there is a warning that a tropical storm or hurricane is a threat to your area?
What adaptation strategies has your agency undertaken to address the impacts of a warning that a tropical storm or hurricane may be a threat to your area?
AL Wiregrass Transit Threat of loss of communications and connectivity, Category 3+ affects services Development of an off site emergency operations plan, rely on communications and planning among internal staff and stakeholders
FL Citrus Connection bus service FL HART 90% of service area is in a hurricane threat area, including facilities and fleet Developed standard operating procedures (SOPs) FL LeeTran Vehicles providing service or evacuation assistance Coordination with incident command structure, mitigate loss of assets FL PCPT All services related to transit and paratransit Public announcements of any service changes. FL PSTA Evacuation necessary for storms C level and above MOU with School Board to relocate fleet and assets FL The Wave
LA CATS Flooded streets compounded by limited high ground and locations near levees, difficulty of getting word to customers Emergency preparedness training
LA Good Earth Transit Fixed route and paratransit bus service are most vulnerable due to storm warning due to the dedication of resources to evacaution planning - at that point.
We provide public information about possible tropical storms as early as possible to bus passengers; so they can be prepared in case of impacts in our area. Implement appropriate emergency operations plans based on threat level
LA Lake Charles Transit Evacuation LA LTS Bus service, stops and shelters Consultation with parish office of homeland security
LA RTA A warning itself has little impact until it reaches a certain level We have pre-hurricane season meetings to define annual hurricane plans: our plans include moving assets to high ground, evacuating vulnerable populations, and then evacuating staff teams as necessary
MS CTA Facilities and bus services Formal hurricane preparation and operation plan based on past experiences
TX B Metro Buses, maintenance facility and ability to provide service. During last 10 years 3 storms caused service interruptions of 1 to 3 days. B Metro staff cooperate with the Office of Emergency Management to prepare for events.
TX Connect Transit
Services - the threat of a tropical storm or hurricane can result in cancellation of services depending on the severity of the threat. Assets - our transit buses are the most vulnerable to the threat of a tropical storm or hurricane.
Park buses on high school grounds to avoid flooding during a tropical storm/hurricane (used during Hurricane Ike)
TX GCRPC Vehicles, shelters, and transit operations center potentially affected. Vehicles are fenced but not sheltered. We have had to cease services before, we also have assisted with emergency evacuations. We have a Severe Weather Plan that goes into place based on certain weather conditions.
TX Island Transit Service times Preperations TX METRO Bus and rail transit services Emergency mangement coordination TX PAT Vehicles, disrupted walking paths, building and anticipating rapid evacuation needs NOOA on public TV, Blackboard Connect and radio/Tv PR announcements TX Valley Metro Revenue service and fleet Public service announcements and service reductions
FEDERAL TRANSIT ADMINISTRATION 105

Table A-4 Tropical Storm and Hurricane Strikes: Survey Responses
APPENDIX A: A SURVEY RESPONSES BY TRANSIT AGENCY
AL FL FL FL FL FL FL LA LA LA LA LA MS TX TX TX TX TX TX TX Wire-grass Transit
Citrus Conn. HART LeeTran PCPT PSTA
The Wave CATS
Good Earth Transit
Lake Charles Transit LTS RTA CTA
B Metro
Connect Transit GCRPC
Island Transit METRO PAT
Valley Metro
Since 2001, has your agency experienced a strike by a tropical storm or hurricane?
Yes Yes No Yes Yes No Yes Yes Yes Yes Yes Yes Yes No Yes Yes Yes Yes Yes Yes
(A) Year (B) Name
2004 Ivan
2004 2004 Charlie
2004 Charley
2004 Ivan
2008 Gustav
2011 Lee
2005 Rita
2005 Rita
2005 Katrina
2005 Katrina
39692 Ike
2005 Rita
2008 Ike
2001 Allison
2005 Rita
2008
(B) Year (B) Name
2004 Francis
2005 Dennis
2008 Ike
2008 Gustav
1982 Alicia
2008 Ike
2008 Eduardo
2011
(C) Year (C) Name
2004 Jeanne
2008 Gustav
2009 Ike
2008 Gustav
(D) Year (D) Name
2005 Wilma
2005 Katrina
2008 Ike
Thinking about these events, what was the severity of the impacts of a strike by a tropical storm or hurricane on different aspects of your agency operations? (0 = no impact, 5 = severe/catastrophic) Bus Transit Service Delivery 4 5 4 4 5 5 5 2 5 5 5 3 5 5 5 5 5 Rail Operations 0 N/A N/A N/A N/A N/A N/A N/A N/A 5 N/A N/A 5 5 N/A N/A Vehicle Maintenance and Repair 2 4 1 2 N/A 3 0 2 0 5 5 1 5 4 3 4 5 Passenger Comfort 4 4 4 4 3 5 N/A 2 4 5 5 1 N/A 3 4 5 5 Passenger Safety 4 4 0 2 3 5 N/A 2 4 5 5 1 5 1 4 5 5 Employee Safety 4 4 2 2 3 5 N/A 2 0 5 5 1 5 1 3 5 5 Passenger Facilities 2 4 1 2 3 5 3 2 2 5 5 1 N/A 1 4 5 4 Operations and Maintenance Facilities 1 4 1 2 N/A 5 2 2 4 5 5 1 5 5 3 5 4 Fixed Guideway Right-of-Way 0 4 N/A N/A N/A N/A N/A N/A N/A 5 N/A N/A 5 4 5 N/A
Thinking about these events, what was the severity of the impacts of a strike by a tropical storm or hurricane on other aspects of your agency operations? (0 = no impact, 5 = severe/catastrophic) Emergency Management Team 2 4 4 4 5 5 3 1 4 5 5 3 5 4 4 2 4
Public Information and Communications 2 4 4 4 5 5 3 1 1 5 5 3 5 4 4 5 5 Planning and/or Scheduling 2 4 4 4 5 5 4 1 4 5 5 3 5 4 4 1 5 Evacuation of Vulnerable Populations 0 4 4 4 5 3 3 1 4 5 5 3 5 4 4 5 4
FEDERAL TRANSIT ADMINISTRATION 106

Table A-4 Tropical Storm and Hurricane Strikes: Survey Responses (cont'd.)
APPENDIX A: A SURVEY RESPONSES BY TRANSIT AGENCY
What aspects of your agency assets and/or services are most vulnerable if a tropical storm or hurricane strikes your area?
What adaptation strategies has your agency undertaken to address the impacts of a strike by a tropical storm or hurricane in your area?
AL Wiregrass Transit Loss of electrical power; loss of computer network and connectivity; loss of telephone service Development of an emergency off-site operations plan FL HART Facilties and fleet Developed standard operating procedures FL Citrus Connection FL LeeTran Operations and passenger facilities, vehicle fleet Mitigate potential losses to facilities & fleet FL PCPT All aspects of our services and assets Developed a Continuing Operational Plan FL PSTA FL The Wave LA CATS Streets and buses Emergency drills
LA Good Earth Transit Fixed assets are most vulnerable, of course transit service is no longer provided during severe tropical storm or hurricane events
Passenger Shelters and buildings were engineered to withstand 140mph hurricane wind loads and located on higher ground in our service area. We evacuate the mobile equipment after public evacuations have taken place and equipment is no longer needed in that capacity.
LA Lake Charles Transit LA LTS Bus stops and shelters LA RTA Streetcar fleet, facilities MS CTA Facilities Formal preparation and operations plan based on prior experiences TX B Metro TX Connect Transit Same as previously stated for warnings Same as previously stated for warnings TX GCRPC Vehicles and all services We follow internal plans and coordinate with the City of Victoria to implement their plan as well TX Island Transit TX METRO Bus and rail service Emergency management coordination TX PAT Practice drills and brochures TX Valley Metro Facilities, fleet, and revenue service Public service announcements and service cancelation
FEDERAL TRANSIT ADMINISTRATION 107
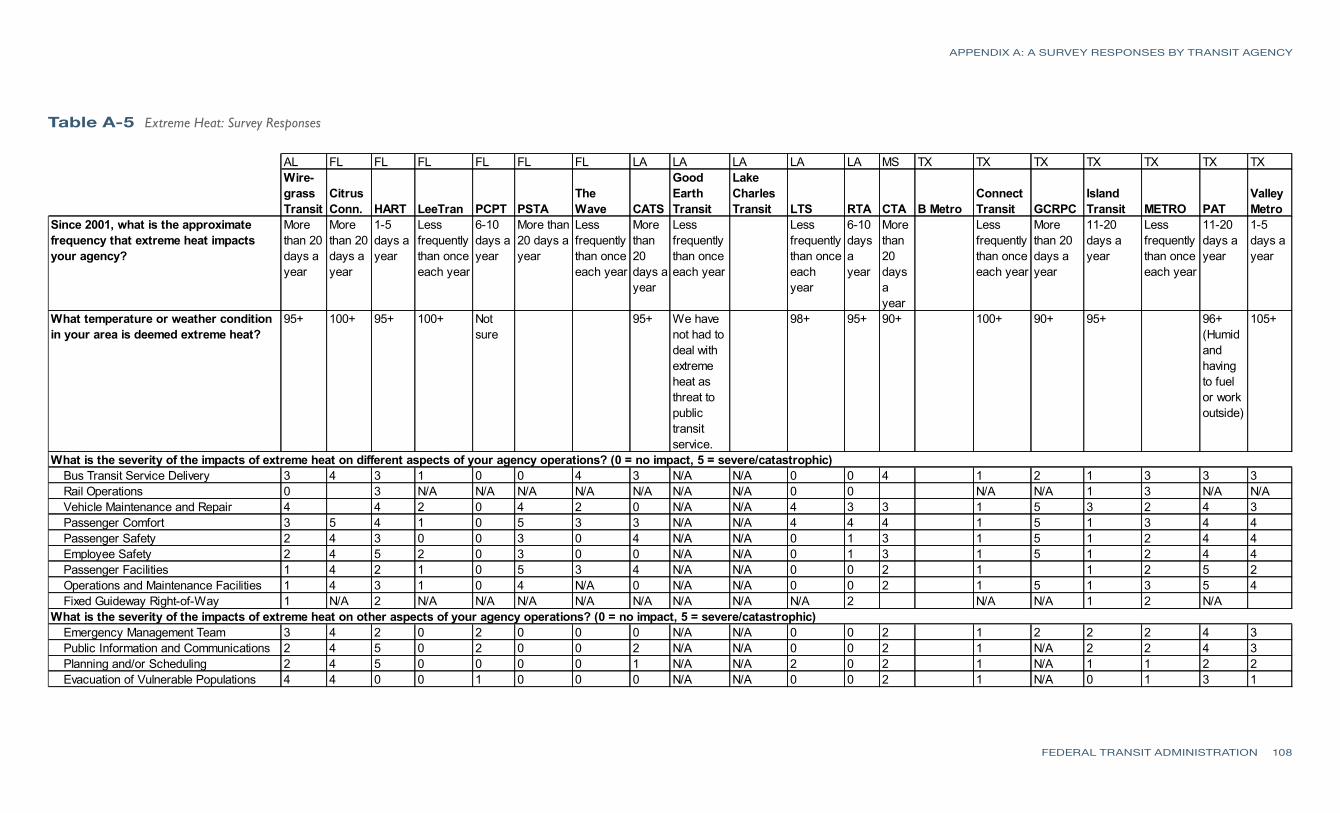
Table A-5 Extreme Heat: Survey Responses
APPENDIX A: A SURVEY RESPONSES BY TRANSIT AGENCY
AL FL FL FL FL FL FL LA LA LA LA LA MS TX TX TX TX TX TX TX Wire-grass Transit
Citrus Conn. HART LeeTran PCPT PSTA
The Wave CATS
Good Earth Transit
Lake Charles Transit LTS RTA CTA B Metro
Connect Transit GCRPC
Island Transit METRO PAT
Valley Metro
Since 2001, what is the approximate frequency that extreme heat impacts your agency?
More than 20 days a year
More than 20 days a year
1-5 days a year
Less frequently than once each year
6-10 days a year
More than 20 days a year
Less frequently than once each year
More than 20 days a year
Less frequently than once each year
Less frequently than once each year
6-10 days a year
More than 20 days a year
Less frequently than once each year
More than 20 days a year
11-20 days a year
Less frequently than once each year
11-20 days a year
1-5 days a year
What temperature or weather condition in your area is deemed extreme heat?
95+ 100+ 95+ 100+ Not sure
95+ We have not had to deal with extreme heat as threat to public transit service.
98+ 95+ 90+ 100+ 90+ 95+ 96+ (Humid and having to fuel or work outside)
105+
What is the severity of the impacts of extreme heat on different aspects of your agency operations? (0 = no impact, 5 = severe/catastrophic) Bus Transit Service Delivery 3 4 3 1 0 0 4 3 N/A N/A 0 0 4 1 2 1 3 3 3 Rail Operations 0 3 N/A N/A N/A N/A N/A N/A N/A 0 0 N/A N/A 1 3 N/A N/A Vehicle Maintenance and Repair 4 4 2 0 4 2 0 N/A N/A 4 3 3 1 5 3 2 4 3 Passenger Comfort 3 5 4 1 0 5 3 3 N/A N/A 4 4 4 1 5 1 3 4 4 Passenger Safety 2 4 3 0 0 3 0 4 N/A N/A 0 1 3 1 5 1 2 4 4 Employee Safety 2 4 5 2 0 3 0 0 N/A N/A 0 1 3 1 5 1 2 4 4 Passenger Facilities 1 4 2 1 0 5 3 4 N/A N/A 0 0 2 1 1 2 5 2 Operations and Maintenance Facilities 1 4 3 1 0 4 N/A 0 N/A N/A 0 0 2 1 5 1 3 5 4 Fixed Guideway Right-of-Way 1 N/A 2 N/A N/A N/A N/A N/A N/A N/A N/A 2 N/A N/A 1 2 N/A
What is the severity of the impacts of extreme heat on other aspects of your agency operations? (0 = no impact, 5 = severe/catastrophic) Emergency Management Team 3 4 2 0 2 0 0 0 N/A N/A 0 0 2 1 2 2 2 4 3 Public Information and Communications 2 4 5 0 2 0 0 2 N/A N/A 0 0 2 1 N/A 2 2 4 3 Planning and/or Scheduling 2 4 5 0 0 0 0 1 N/A N/A 2 0 2 1 N/A 1 1 2 2 Evacuation of Vulnerable Populations 4 4 0 0 1 0 0 0 N/A N/A 0 0 2 1 N/A 0 1 3 1
FEDERAL TRANSIT ADMINISTRATION 108

Table A-5 Extreme Heat: Survey Responses (cont'd.)
APPENDIX A: A SURVEY RESPONSES BY TRANSIT AGENCY
What aspects of your agency assets and/or services are most vulnerable to extreme heat? What adaptation strategies has your agency undertaken to address extreme heat? AL Wiregrass Transit Bus vehicle overheating, failure of engines, air conditioners etc. For Transit Operations, regular maintenance and daily checks of fluid levels on buses FL Citrus Connection AC units on vehicles FL HART Facilties and fleet Developed standard operating procedures FL LeeTran Vehicle maintenance Prepare AC systems in advance of summer FL PCPT None to date None to date FL PSTA IT computer network Generators and uninterruptible power supply (UPS) for IT network FL The Wave LA CATS Lack of shelters Trying to purchase additional shelters
LA Good Earth Transit
We have not been forced to curtail service due to heat. I understand that some passengers carry umbrellas to provide localized shade if they are particulary vulnerable to heat or sunlight while waiting at some bus stops.
LA Lake Charles Transit None LA LTS Vehicle AC systems None LA RTA Catenary, rail expansions Constant monitoring of rail and catenary; installed shelters for passengers MS CTA Bus operations TX B Metro TX Connect Transit Biggest threat is impact to fleet - such as overheating and AC issues. None as it is not a threat we have faced.
TX GCRPC All Services effected, especially paratransit Keep AC systems on buses in working condition, remove vehicles from service if no AC. Also, drivers are expected to keep hydrated throughout their work day.
TX Island Transit Older vehicles Charge AC systems earlier TX METRO Bus and rail service Cooling centers for buses and the public
TX PAT Operations with clients, maintenance with open doors (facility is old and requires much heat and air conditioning Asking parents to ride with children; taking care to bring adequate water and shade
TX Valley Metro Bus stops, fleet and maintenance facility None
FEDERAL TRANSIT ADMINISTRATION 109

Table A-6 Drought: Survey Responses
APPENDIX A: A SURVEY RESPONSES BY TRANSIT AGENCY
AL FL FL FL FL FL FL LA LA LA LA LA MS TX TX TX TX TX TX TX Wire-grass Transit
Citrus Conn. HART LeeTran PCPT PSTA
The Wave CATS
Good Earth Transit
Lake Charles Transit LTS RTA CTA
B Metro
Connect Transit GCRPC
Island Transit METRO PAT
Valley Metro
Since 2001, what is the approximate frequency that drought has an impact on your agency?
More than 20 days per year
Less frequency than once each year
More than 20 days per year
1-5 days per year
6-10 days per year
Less frequency than once each year
1-5 days per year
Less frequency than once each year
Less frequency than once each year
6-10 days per year
Less frequenc y than once each year
Less frequen cy than once each year
Less frequency than once each year
More than 20 days per year
Less frequency than once each year
More than 20 days per year
11-20 days per year
1-5 days per year
What is the severity of the impacts of drought on different aspects of your agency operations? (0 = no impact, 5 = severe/catastrophic) Bus Transit Service Delivery 1 0 1 0 0 0 0 N/A N/A 0 0 0 N/A 0 1 N/A 2 Rail Operations 0 0 N/A N/A N/A 0 N/A N/A N/A N/A 0 N/A N/A 0 1 N/A N/A Vehicle Maintenance and Repair 0 0 0 0 0 0 0 N/A N/A 0 0 0 N/A 0 3 N/A 3 Passenger Comfort 2 0 2 0 1 0 0 N/A N/A 4 0 0 5 0 3 N/A 5 Passenger Safety 1 0 0 0 0 0 0 N/A N/A 0 0 0 5 0 3 N/A 3 Employee Safety 1 0 0 0 0 0 0 N/A N/A 0 0 0 5 0 3 N/A 3 Passenger Facilities 0 0 0 0 1 0 0 N/A N/A 0 0 0 5 0 2 4 2 Operations and Maintenance Facilities 1 0 0 0 0 0 0 N/A N/A 0 0 0 5 0 2 4 3 Fixed Guideway Right-of-Way 0 0 N/A N/A N/A 0 0 N/A N/A N/A 0 N/A N/A 0 2 5 N/A
What is the severity of the impacts of drought on other aspects of your agency operations? (0 = no impact, 5 = severe/catastrophic) Emergency Management Team 1 0 0 2 0 0 0 N/A N/A 0 0 0 1 1 3 1
Public Information and Communications 0 0 0 2 0 0 0 N/A N/A 0 0 0 1 1 5 3 Planning and/or Scheduling 1 0 1 2 0 0 N/A N/A 0 0 0 1 1 2 1 Evacuation of Vulnerable Populations 1 0 2 1 0 0 0 N/A N/A 0 0 0 0 0 3 1
FEDERAL TRANSIT ADMINISTRATION 110

Table A-6 Drought: Survey Responses (cont'd.)
APPENDIX A: A SURVEY RESPONSES BY TRANSIT AGENCY
What aspects of your agency assets and/or services are most vulnerable to drought? What adaptation strategies has your agency undertaken to address drought? AL Wiregrass Transit Little or none None FL Citrus Connection FL HART None None FL LeeTran Service delivery (smoke & fire risk is largest threat) Monitor risks FL PCPT None to date None to date FL PSTA FL The Wave LA CATS LA Good Earth Transit We have not had an issue with drought in this area, that would affect the transit service. LA Lake Charles Transit LA LTS LA RTA MS CTA TX B Metro
TX Connect Transit We had severe drought in 2011 but there was no impact on our agency or service other than the loss of trees and grass on some properties. None
TX GCRPC We had the worst drought ever last year, which resulted in water rationing and extreme heat conditions. TX Island Transit None None TX METRO Facilities operations and bus & rail HVAC systems Facility operations and water conservation efforts TX PAT Facilties due to foundation problems Alternative watering days, recycled water and reclaim water from facilities TX Valley Metro Bus stops, fleet and facilities None
FEDERAL TRANSIT ADMINISTRATION 111

Table A-7 High Wind: Survey Responses
APPENDIX A: A SURVEY RESPONSES BY TRANSIT AGENCY
AL FL FL FL FL FL FL LA LA LA LA LA MS TX TX TX TX TX TX TX Wire-grass Transit
Citrus Conn. HART LeeTran PCPT PSTA
The Wave CATS
Good Earth Transit
Lake Charles Transit LTS RTA CTA
B Metro
Connect Transit GCRPC
Island Transit METRO PAT
Valley Metro
Since 2001, what is the approximate frequency in which high winds impact your agency?
1-5 days per year
Less frequently than once each year
11-20 days per year
Less frequently than once each year
More than 20 days each year
1-5 days per year
1-5 days per year
Less frequently than once each year
Less frequently than once each year
Less frequently than once each year
1-5 days per year
11-20 days per year
Less frequently than once each year
1-5 days per year
6-10 days per year
1-5 days per year
6-10 days per year
1-5 days per year
What is the severity of the impacts of high winds on different aspects of your agency operations? (0 = no impact, 5 = severe/catastrophic) Bus Transit Service Delivery 1 2 3 0 2 0 2 N/A N/A 0 1 3 1 3 1 0 N/A 5 Rail Operations 0 5 N/A N/A N/A N/A N/A N/A N/A N/A 1 N/A N/A 1 1 N/A N/A Vehicle Maintenance and Repair 0 2 1 0 1 0 0 N/A N/A 0 0 1 1 N/A 0 0 5 3 Passenger Comfort 1 3 3 0 2 0 3 N/A N/A 0 2 3 N/A 0 0 N/A 5 Passenger Safety 1 3 2 0 4 0 3 N/A N/A 0 2 3 1 3 1 2 5 5 Employee Safety 1 4 2 0 4 0 0 N/A N/A 0 2 2 1 3 1 2 N/A 5 Passenger Facilities 0 2 2 0 4 0 3 N/A N/A 5 0 1 1 3 0 0 4 5 Operations and Maintenance Facilities 0 3 2 0 2 0 0 N/A N/A 0 0 1 1 3 0 0 4 3 Fixed Guideway Right-of-Way 0 4 N/A N/A N/A N/A N/A N/A N/A N/A 0 N/A N/A 0 2 N/A N/A
What is the severity of the impacts of high winds on other aspects of your agency operations? (0 = no impact, 5 = severe/catastrophic) Emergency Management Team 1 1 1 1 0 0 0 N/A N/A 0 2 2 1 N/A 1 2 N/A 2
Public Information and Communications 1 4 3 1 0 0 0 N/A N/A 0 0 1 1 3 1 2 4 3 Planning and/or Scheduling 1 1 2 1 0 0 0 N/A N/A 0 0 1 1 3 0 2 3 3 Evacuation of Vulnerable Populations 0 0 1 1 0 0 N/A N/A 0 0 1 1 N/A 0 0 N/A 1
FEDERAL TRANSIT ADMINISTRATION 112

Table A-7 High Wind: Survey Responses (cont'd.)
APPENDIX A: A SURVEY RESPONSES BY TRANSIT AGENCY
What aspects of your agency assets and/or services are most vulnerable to high wind? What adaptation strategies has your agency undertaken to address high wind? AL Wiregrass Transit Transit operations; communications equipment None FL Citrus Connection FL HART Right of way Cease Service FL LeeTran Service delivery, facilites & vehicles Monitor risk, discontinue service at 40 MPH sustained wind speed FL PCPT None to date None to date FL PSTA IT/Communications Underground cabling FL The Wave LA CATS
LA Good Earth Transit Outside of thunderstorms or other intermittent localized events, high winds have not been a factor which has impacted the transit system's ability to deliver service.
LA Lake Charles Transit LA LTS Bus benches Turning benches over to prevent being blown by high winds LA RTA MSCTA Bus operations TX B Metro TX Connect Transit We have only had high wind issues related to tropical storms or hurricanes. As previously stated, move vehicle fleet to high ground at high school TX GCRPC Just the safety aspect Follow our emergency plan concerning high winds while operating service TX Island Transit Not applicable (N/A) Not applicable (N/A) TX METRO Rail Catenaries Emergency Management Coordination
TX PAT Shelters and antenna due to obstacle breakage and others falling down. Winds are common due to nearby seas; so we build for 120mph or more wind resistance. Stablize with cable and clamps and place more strategically
TX Valley Metro Bus stops, fleet and facilities Service reduction
FEDERAL TRANSIT ADMINISTRATION 113
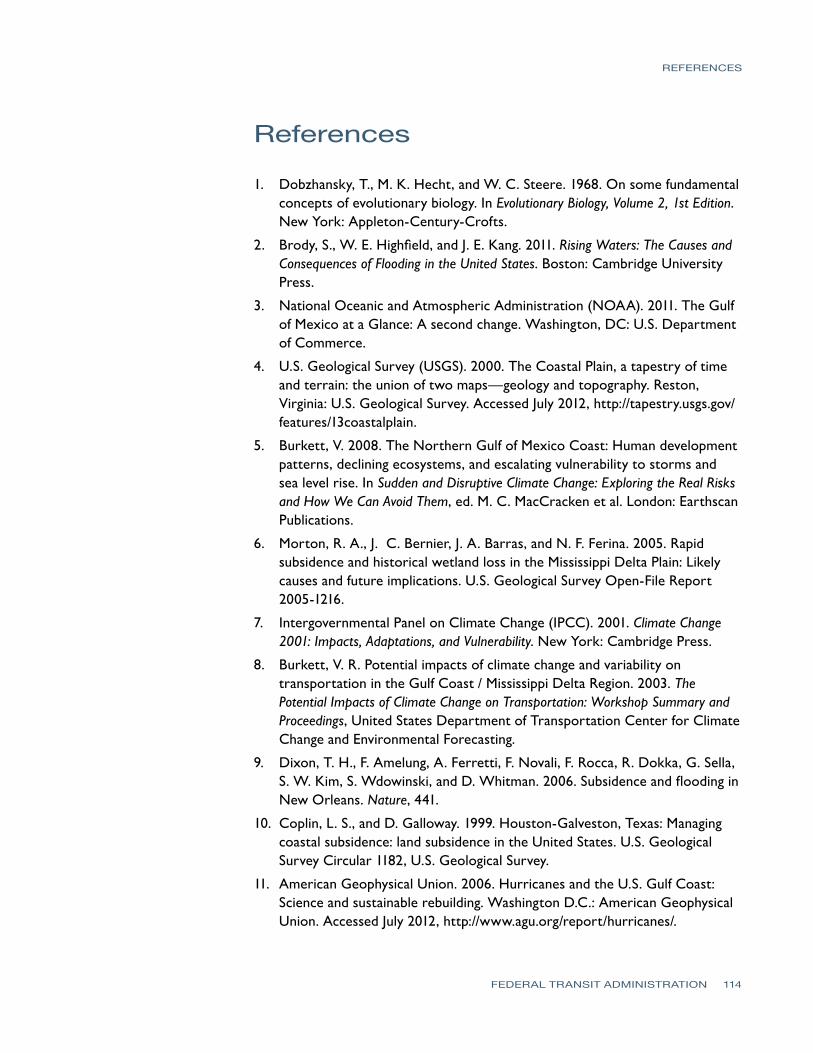
REFERENCES
References
1. Dobzhansky, T., M. K. Hecht, and W. C. Steere. 1968. On some fundamental concepts of evolutionary biology. In Evolutionary Biology, Volume 2, 1st Edition. New York: Appleton-Century-Crofts.
2. Brody, S., W. E. Highfield, and J. E. Kang. 2011. Rising Waters: The Causes and Consequences of Flooding in the United States. Boston: Cambridge University Press.
3. National Oceanic and Atmospheric Administration (NOAA). 2011. The Gulf of Mexico at a Glance: A second change. Washington, DC: U.S. Department of Commerce.
4. U.S. Geological Survey (USGS). 2000. The Coastal Plain, a tapestry of time and terrain: the union of two maps—geology and topography. Reston, Virginia: U.S. Geological Survey. Accessed July 2012, http://tapestry.usgs.gov/ features/13coastalplain.
5. Burkett, V. 2008. The Northern Gulf of Mexico Coast: Human development patterns, declining ecosystems, and escalating vulnerability to storms and sea level rise. In Sudden and Disruptive Climate Change: Exploring the Real Risks and How We Can Avoid Them, ed. M. C. MacCracken et al. London: Earthscan Publications.
6. Morton, R. A., J. C. Bernier, J. A. Barras, and N. F. Ferina. 2005. Rapid subsidence and historical wetland loss in the Mississippi Delta Plain: Likely causes and future implications. U.S. Geological Survey Open-File Report 2005-1216.
7. Intergovernmental Panel on Climate Change (IPCC). 2001. Climate Change 2001: Impacts, Adaptations, and Vulnerability. New York: Cambridge Press.
8. Burkett, V. R. Potential impacts of climate change and variability on transportation in the Gulf Coast / Mississippi Delta Region. 2003. The Potential Impacts of Climate Change on Transportation: Workshop Summary and Proceedings, United States Department of Transportation Center for Climate Change and Environmental Forecasting.
9. Dixon, T. H., F. Amelung, A. Ferretti, F. Novali, F. Rocca, R. Dokka, G. Sella, S. W. Kim, S. Wdowinski, and D. Whitman. 2006. Subsidence and flooding in New Orleans. Nature, 441.
10.Coplin, L. S., and D. Galloway. 1999. Houston-Galveston, Texas: Managing coastal subsidence: land subsidence in the United States. U.S. Geological Survey Circular 1182, U.S. Geological Survey.
11. American Geophysical Union. 2006. Hurricanes and the U.S. Gulf Coast: Science and sustainable rebuilding. Washington D.C.: American Geophysical Union. Accessed July 2012, http://www.agu.org/report/hurricanes/.
FEDERAL TRANSIT ADMINISTRATION 114

REFERENCES
12.Thieler, R. R., and E. S. Hammar-Klose. 2001. National assessment of coastal vulnerability to sea-level rise: Preliminary results for the U.S. Gulf of Mexico Coast. Washington DC: U.S. Geological Survey Open-File Report 00-179.
13.Barras, J. A. 2006. Land area change in Coastal Louisiana after the 2005 hurricanes—A series of three maps. Washington DC: U.S. Geological Survey Open-File Report 2006-1274.
14.Stone, G. W., J. P. Morgan, A. Sheremet, and X. Zhang. 2003. Coastal land loss and wave-surge predictions during hurricanes in Coastal Louisiana: Implications for the oil and gas industry. Baton Rouge: Coastal Studies Institute, Louisiana State University.
15.Watson, R. T. (ed.). 2001. Climate Change 2001: Synthesis Report. Contribution of Working Group I, II, and III to the Third Assessment Report of the Intergovernmental Panel on Climate Change. Cambridge, UK: Cambridge University Press.
16.Tobin, G. A., and B. E. Montz. Natural Hazards: Explanation and Integration. New York: The Guilford Press, 1997.
17. Major, D., and M. O’Grady. 2010. Adaptation assessment guidebook. Climate change Adaptation in New York City: Building a risk management response. New York City Climate Change Adaptation Task Force. New York: Annals of the New York Academy of Science.
18.U.S. Department of Transportation. Impacts of climate change and variability on transportation systems and infrastructure: Gulf Coast Study. Washington, DC: United States Department of Transportation, 2008.
19.Hodges, T. 2011. Flooded Bus Barns and Buckled Rails: Public Transportation and Climate Change Adaption. Washington, DC: Office of Budget and Policy, Federal Transit Administration, United States Department of Transportation.
20.Lowe, J., T. Reeder, K. Horsburgh, and V. Bell. 2009. Using the new TE2100 science scenarios. London, UK: Environment Agency of the United Kingdom of Great Britain and Northern Ireland.
21. Deen, T. B., National Research Council (NRC). 2006. Preliminary remarks outline, Rapporteur. Conference on Climate Change Impacts on U.S. Transportation. Washington, DC: Transportation Research Board and Division on Earth and Life Studies.
22. Meyer, M., and E. Miller. 2001. Urban Transportation Planning: A Decision-Oriented Approach. New York: McGraw-Hill.
23.Amekudzi, A., and M. Meyer. 2005. NCHRP Report 541, Consideration of environmental factors in transportation systems planning. Washington, DC: National Academies Press.
24.Meyer, M. D. 2006. Design Standards for U.S. Transportation Infrastructure: The Implications of Climate Change. Washington, DC: Transportation Research Board.
FEDERAL TRANSIT ADMINISTRATION 115

REFERENCES
25.Images and route maps for City of Galveston Island Transit. Accessed March 2013, http://www.islandtransit.net/main.htm.
26.Image and route maps for Hillsborough Area Regional Transit Authority. Accessed March 2013, http://www.gohart.org.
27.Blessing R., A. Stiles, and S. Brody. 2012. Understanding the implications of climate change on transportation systems within the Gulf of Mexico Coastal Region: A literature review. Galveston: Center for Texas Beaches and Shores, Texas A&M University.
28.Douglass, S. L., J. M. Richards, J. Lindstrom, and J. Shaw. 2005. An estimate of the extent of U.S. coastal highways. Presentation to the Committee on Hydraulics, Hydrology, and Water Quality. Washington, DC: 84th Annual Meeting of the Transportation Research Board.
29.Crossett, K. M., T. J Culliton, P. C. Wiley, and T. R. Goodspeed. 2004. Population trends along the coastal United States: 1980–2008. Washington, DC: National Oceanic and Atmospheric Administration.
30.Kafalenos, R. S. , K. J. Leonard, D. M. Beagan, V. R. Burkett, B. D. Keim, A. Meyers, D. T. Hunt, R. C. Hyman, M. K. Maynard, B. Fritsche, R. H. Henk, E. J. Seymour, L. E. Olson, J. R. Potter, and M. J. Savonis. 2008. What are the Implications of climate change and variability for Gulf Coast transportation? In Impacts of Climate Change and Variability on Transportation Systems and Infrastructure: Gulf Coast Study, Phase I, edited by M. J. Savonis et al. Washington, DC: United States Department of Transportation, 2008.
31.Bureau of Transportation Statistics. 2007. Transportation Statistics Annual Report 2007. Washington, DC: Research and Innovative Technology Administration, United States Department of Transportation.
32.Felmy, J. 2005. Statement of the American Petroleum Institute before joint hearing of House Transportation and Infrastructure Subcommittees on Water Resources and Environment, Economic Development, Public Buildings, Emergency Management, Transportation and Infrastructure. Joint Hearing on a Vision and Strategy for Rebuilding New Orleans. Washington, DC: United States House of Representatives, October 18.
33.Congressional Budget Office. 2006. The Budget and Economic Outlook: Fiscal Years 2007–2016. Washington, DC: United States Congressional Budget Office, January. Accessed July 2012, http://www.disastersrus.org/katrina/ CBO%20Reports/01-26-BudgetOutlook.pdf.
34.National Research Council. 2008. Potential impacts of climate change on U.S. Transportation: Special report 290. Washington, DC: Transportation Research Board.
35.Landsea, C. W. 1993. A climatology of intense (or major) Atlantic hurricanes. Monthly Weather Review 121(6): 1710–1713.
FEDERAL TRANSIT ADMINISTRATION 116

REFERENCES
36.Karl, T. R., J. M. Melillo, and T. C. Peterson (eds.). 2009. Global Climate Change Impacts in the United States. New York: U.S. Global Change Research Program, Cambridge University Press.
37. Intergovernmental Panel on Climate Change. 2007. Climate Change 2007. Impacts, Adaptations, and Vulnerability. New York: Cambridge University Press.
38.Rossetti, M. A. 2002. Potential impacts of climate change on railroads. In The Potential Impacts of Climate Change on Transportation, Summary and Discussion Papers, Federal Research Partnership Workshop. Washington, DC: Brookings Institution.
39.Bull, S. R., D. E. Bilello, J. Ekmann, M. J. Sale, and D. K. Schmalzer. 2007. Effects of climate change on energy production and distribution in the United States. In Effects of Climate Change on Energy Production and Use in the United States. Edited by T. J. Wilbanks et al. Washington, DC: Synthesis and Assessment Product 4.5, U.S. Climate Change Science Program.
40.Peterson, T. C., M. McGuirk, T. G. Houston, A. H. Horvitz, and M. F. Wehner. 2008. Climate Variability and Change with Implications for Transportation. Washington, DC: National Research Council.
41.Changnon, S. A. 2006. Railroads and Weather: From Fogs to Floods and Heat to Hurricanes, the Impacts of Weather and Climate on American Railroading. Boston: American Meteorological Society.
42.du Vair, P. D. Wickizer, and M. Burer. 2002. Climate Change and the potential implications for California’s transportation system. In The Potential Impacts of Climate Change on Transportation: Workshop Summary. Washington, DC: United States Department of Transportation, October 1–2. Accessed July 2012, http://climate.volpe.dot.gov/workshop1002/.
43.Yang, C., and Y. David. 2007. Trends in transit bus accidents and promising collision countermeasures. Journal of Public Transportation 10(3).
44.Bonnin, G. M., B. Lin, and T. Parzybok. 2003. Updating NOAA/NWS rainfall frequency atlases. Symposium on Observing and Understanding the Variability of Water in Weather and Climate. Long Beach, Calif.: February 9–13.
45.Jankowski, P. 1995. Integrating geographical information systems and multiple criteria decision-making methods. International Journal of Geographic Information Systems 9(3): 251–273.
46.Voogd, H. 1983. Multi-Criteria Evaluation for Urban and Regional Planning. Amsterdam: Pion, Ltd.
47.Elmes, G. A., and T. M. Harris. 1996. Industrial restructuring and the United States Coal-Energy System, 1972–1990: Regulatory change, technological fixes, and corporate control. Annals of the Association of American Geographers 86(3).
FEDERAL TRANSIT ADMINISTRATION 117

REFERENCES
48.Jankowski, P., and L. Richard. 1994. Integration of GIS-based suitability analysis and multi-criteria evaluation in a spatial decision support system for route selection. Environmental Planning B: Planning Design 21(3).
49.Berry, M., J. Comiskey, and K. Minser. 1994. Parallel analysis of clusters in landscape ecology. Computational Science & Engineering IEEE 1(2).
50.Hämäläinen, R. P., E. Kettunen, M. Marttunen, and H. Ehtamo. 2001. Evaluating a framework for multi-stakeholder decision support in water resources management. Group Decision and Negotiation 10.
51.Agrell, P. J., B. J. Lence, and A. Stam. 1998. An interactive multi-criteria decision model for multipurpose reservoir management: The Shellmouth Reservoir. Journal of Multi-criteria Decision Analysis 7.
52.Hämäläinen, R. P., M. Lindstedt, and K. Sinkko. 2000. Multi-attribute risk analysis in nuclear emergency management. Risk Analysis, 20.
53.Hipel, K. W., D. M. Kilgour, L. Fang, et al. 1997. The decision support system GMCR in environmental conflict management. Applied Mathematical Computation 83.
54.Ridgley, M. A., D. C. Penn, and L. Tran. 1997. Multicriteria decision support for a conflict over stream diversion and land-water reallocation in Hawaii. Applied Mathematical Computation 83.
55.Tecle, A., B. P. Shrestha, and L. Duckstein. 1998. A multi-objective decision support system for multi-resource forest management. Group Decision and Negotiation 7.
56.Susskind, L., and J. Cruikshank. 1987. Breaking the Impasse; Consensual Approaches to Resolving Public Disputes. New York: Basic Brooks.
57.Cooke, D. F. 1992. Spatial decision support systems: Not just another GIS. Geographic Information Systems, 2.
58.Cowen, D. 1988. GIS versus CAD versus DBMS: What are the differences? Photogrammet Engineering Remote Sensing 54.
59.Padgett, D. A. 1994. Technological methods for improving citizen participation in locally unacceptable land use (LULU) decision-making. Computers, Environment and Urban Systems 17.
60.Armstrong, M. P. 1993. Perspectives on the development of group decision support systems for locational problem-solving. Geographic Systems, 1.
61.Carver, S. 1991. Integrating multicriteria evaluation with GIS. International Journal of Geographic Systems, 5.
62.Faber B., W. Wallace, and J. Cuthbertson. 1995. Advances in collaborative GIS for land resource negotiation. Proceedings of GIS ’95, Volume 1, Ninth Annual Symposium on Geographic Information Systems. Vancouver: GIS World Inc.
FEDERAL TRANSIT ADMINISTRATION 118

REFERENCES
63.Godschalk, D. R., G. McMahon, A. Kaplan, et al. 1992. Using GIS for computer-assisted dispute resolution. Photogrammetry and Remote Sensing 58(8).
64.Jankowski, P., and T. Nyerges. 2001. GIS-supported collaborative decision making: Results of an experiment. Annual Association of American Geographers 9.
65.Jankowski, P., T. Nyerges, A. Smith, et al. 1997. Spatial group choice: A SDSS tool for collaborative spatial decision-making. International Journal of Geographic Information Systems 11.
66.Malczewski, J. 1999. GIS and Multi-criteria Decision Analysis. New York: Wiley.
67.Thill, J. C. (ed.). 2009. Spatial Multi-criteria Decision Making and Analysis: A Geographic Information Science Approach. Aldershot, UK: Ashgate.
68.MachEachren, A. M. 2000. Cartography and GIS: Facilitating collaboration. Progress in Human Geography 24.
69.Villa, F., M. Ceroni, and A. Mazza. 1996. A GIS-based method for multi-objective evaluation of park vegetation. Landscape Urban Planning 35.
70.Villa, F., L. Tunesi, and T. Agardy. 2002. Zoning marine protected areas through spatial multiple-criteria analysis: The case of the Asinara Island National Marine Reserve of Italy. Conservation Biology 16(2).
71.Brody, S. D., W. Highfield, S. Arlikatti, et al. 2004. Conflict on the Coast: Using geographic information systems to map potential environmental disputes in Matagorda Bay, Texas. Environmental Management 34(1).
72.Openshaw, S. 1989. Learning to live with spatial databases. In The Accuracy of Spatial Databases, edited by M. Goodchild and S. Gopal. London: Taylor and Francis.
FEDERAL TRANSIT ADMINISTRATION 119

U.S. Department of Transportation Federal Transit Administration
East Building 1200 New Jersey Avenue, SE
Washington, DC 20590 http://www.fta.dot.gov/research