Guide to the Labour Force Survey
79
Catalogue no. 71-543-G Guide to the Labour Force Survey 2014
Transcript of Guide to the Labour Force Survey

Catalogue no. 71-543-G
Guide to the LabourForce Survey
2014
How to obtain more information
Specific inquiries about this product and related statistics or services should be directed to: Labour Force Survey Program, LabourStatistics Division, Statistics Canada, Ottawa, Ontario, K1A 0T6 (telephone: 613-951-4090, toll free number: 1-866-873-8788,fax: 613-951-2869 or by e-mail address: [email protected]).
For information about this product or the wide range of services and data available from Statistics Canada, visit our website,www.statcan.gc.ca.
You can also contact us by
e-mail at [email protected]
telephone, from Monday to Friday, 8:30 a.m. to 4:30 p.m., at the following toll-free numbers:• Statistical Information Service 1-800-263-1136• National telecommunications device for the hearing impaired 1-800-363-7629• Fax line 1-877-287-4369
Depository Services Program• Inquiries line 1-800-635-7943• Fax line 1-800-565-7757
To access this product
This product, Catalogue no. 71-543-G, is available free in electronic format. To obtain a single issue, visit our website,www.statcan.gc.ca and browse by “Key resource” > “Publications.”
Standards of service to the public
Statistics Canada is committed to serving its clients in a prompt, reliable and courteous manner. To this end, this agencyhas developed standards of service that its employees observe. To obtain a copy of these service standards, please contactStatistics Canada toll-free at 1-800-263-1136. The service standards are also published at www.statcan.gc.ca under “About us” >“The agency” > “Providing services to Canadians.”

Statistics CanadaLabour Statistics DivisionLabour Force Survey Program
Guide to the Labour Force Survey2014
Published by authority of the Minister responsible for Statistics Canada
© Minister of Industry, 2014
All rights reserved. Use of this publication is governed by the Statistics CanadaOpen License Agreement.
http://www.statcan.gc.ca/reference/licence-eng.html
May 2014
Catalogue no. 71-543-G
ISSN 1704-8842
Frequency: Annual
Ottawa
Cette publication est également disponible en français.
Note of appreciation
Canada owes the success of its statistical system to a long-standing partnership betweenStatistics Canada, the citizens of Canada, its businesses, governments and otherinstitutions. Accurate and timely statistical information could not be produced withouttheir continued cooperation and goodwill.

Guide to the Labour Force Survey
User information
Symbols
The following standard symbols are used in Statistics Canada publications:
. not available for any reference period
.. not available for a specific reference period
... not applicable
0 true zero or a value rounded to zero
0s value rounded to 0 (zero) where there is a meaningful distinction between true zero and the value that wasrounded
p preliminary
r revised
x suppressed to meet the confidentiality requirements of the Statistics Act
E use with caution
F too unreliable to be published
* significantly different from reference category (p < 0.05)
2 Statistics Canada – Catalogue no. 71-543-G
Guide to the Labour Force Survey
Table of contentsSection 1 Background and objectives 5
1.1 Introduction 5
1.2 Background and objectives 5
Section 2 Determining labour force status 7
2.1 Labour force classification 8
Section 3 Dictionary of concepts and definitions 10
Section 4 Survey methodology 19
4.1 Population coverage 19
4.2 Sample design and sample size for the provinces 19
4.3 Sample rotation for the provinces 20
4.4 Selection of household members for the provinces 20
4.5 Differences in survey methodology between the North and the provinces 21
Section 5 Data collection 22
5.1 Interviewing for the LFS 22
5.2 Supervision and quality control 22
5.3 Non-response to the LFS 22
Section 6 Data processing 23
6.1 Data capture 23
6.2 Editing 23
6.3 Industry and occupation coding 23
6.4 Creation of derived variables 23
6.5 Weighting 24
6.6 Seasonal adjustment: LFS procedures 24
6.7 Procedures 24
6.8 Adjustment for reference-week effect 25
6.9 Adjustment for holiday effects on actual hours worked 25
6.10 Revisions every year 25
Statistics Canada – Catalogue no. 71-543-G 3
Guide to the Labour Force Survey
Table of contents – continued
Section 7 Data quality 26
7.1 Non-sampling errors 26
7.2 Sampling errors 26
7.3 Release criteria 31
Section 8 Comparing the Survey of employment, payrolls and hours and the Labour Force Survey 32
8.1 Comparing employment trends from the two surveys 34
8.2 Sampling error in the LFS 35
8.3 Worker classification in the LFS 35
8.4 ‘Off the books’ employment 35
8.5 Estimates by province 35
8.6 Payroll estimates and detailed industry data 35
8.7 Release schedule differences 35
8.8 Revision schedule 36
Section 9 Products and Services 37
9.1 Catalogued publications 37
Related products 40
Appendix
A Sub-provincial geography descriptions 50
B Labour Force Survey questionnaire 57
Charts
8.1 SEPH and LFS employment levels, January 2001 to December 2013, seasonally adjusted 32
4 Statistics Canada – Catalogue no. 71-543-G

Guide to the Labour Force Survey
Section 1
Background and objectives
1.1 Introduction
The Labour Force Survey (LFS) is a household surveycarried out monthly by Statistics Canada. Since itsinception in 1945, the objectives of the LFS have beento divide the working-age population into three mutuallyexclusive classifications - employed, unemployed, andnot in the labour force - and to provide descriptiveand explanatory data on each of these categories.Data from the survey provide information on majorlabour market trends such as shifts in employmentacross industrial sectors, hours worked, labour forceparticipation and unemployment rates.
1.2 Background and objectives
The Canadian Labour Force Survey was developedfollowing the Second World War to satisfy a needfor reliable and timely data on the labour market.Information was urgently required on the massivelabour market changes involved in the transition froma war-time to a peace-time economy. The surveywas designed to provide estimates of employment byindustry and occupation at the regional as well as thenational level.
A quarterly survey initially, the LFS became a monthlysurvey in 1952. In 1960, the InterdepartmentalCommittee on Unemployment Statistics recommendedthat the LFS be designated the source of theofficial measure of unemployment in Canada. Thisendorsement was followed by a demand for a broaderrange of labour market statistics, in particular moredetailed regional data. The information generated bythe survey has expanded considerably over the yearswith a major redesign of the survey content in 1976 andagain in 1997, and provides a rich and detailed pictureof the Canadian labour market.
The LFS is the only source of monthly estimates oftotal employment, including the self-employed, fulland part-time employment, and unemployment. Itpublishes monthly standard labour market indicatorssuch as the unemployment rate, the employmentrate and the participation rate. The LFS is a majorsource of information on the personal characteristicsof the working-age population, including age, sex,marital status, educational attainment, and familycharacteristics.
Employment estimates include detailed breakdowns bydemographic characteristics, industry and occupation,job tenure, and usual and actual hours worked. Thesurvey incorporates questions permitting analyses ofmany topical issues, such as involuntary part-timeemployment, multiple job-holding, and absencefrom work. Since January 1997, it also providesmonthly information on the wages and union statusof employees, as well as the number of employeesat their workplace and the temporary or permanentnature of their job.
Starting in late 2003 in Alberta, and then inApril 2004 for the rest of western Canada, the LFSadded questions to identify Aboriginal respondentswith the goal of producing provincial labour marketstatistics for the off-reserve Aboriginal population.According to the 2011 National Household Survey,the off-reserve Aboriginal population accounted forapproximately 75% of all Aboriginal people aged 15 andover living in private households in the provinces.
The Aboriginal group questions have also been askedin the territories starting in 2004. As of January 2007,these questions have been extended to all provinces.Labour market data for the Aboriginal population havebeen available since the fall of 2008.
Statistics Canada – Catalogue no. 71-543-G 5

Guide to the Labour Force Survey
In January 2006, there were also five questions addedto the LFS to identify the immigrant population. Morespecifically, questions were added to identify thecountry of birth of the respondent, whether or not therespondent was a "landed immigrant", the month andyear he/she became a landed immigrant, and thecountry where the respondent received his/her highestlevel of education. These questions are comparableto those used in the Census questionnaire. Labourmarket data for the immigrant population have beenavailable since the fall of 2007.
Unemployment estimates are produced bydemographic group, duration of unemployment,
and activity before looking for work. Information onindustry and occupation, and reason for leaving lastjob is also available for persons currently unemployedor not in the labour market with recent labour marketinvolvement.
In addition to providing national, provincial andterritorial estimates, the LFS also releases estimatesof labour force status for sub-provincial areas such asEconomic Regions and Census Metropolitan Areas.
6 Statistics Canada – Catalogue no. 71-543-G
Guide to the Labour Force Survey
Section 2
Determining labour force statusThe concepts of employment and unemployment arederived from the theory of the supply of labour as afactor of production. The production referred to is in turndefined as those goods and services included in theSystem of National Accounts. For this reason, unpaidhousework and volunteer work are not counted as workby the survey, although these activities need not differfrom paid work, either in purpose or in the nature of thetasks completed.
While the logical and precise unit of measurement oftotal labour supply is person-hours, the conceptualterms of reference for the survey require that individualmembers of the population be classified as employed,unemployed, or not in the labour force. Accordingly,persons who are supplying services in the referenceperiod, regardless of the quantity supplied, areclassified as employed, while those who provideevidence that they are offering their labour services tothe market (again regardless of quantity) are classifiedas unemployed. The remainder of the population,those neither currently supplying nor offering theirlabour services, are referred to as persons not in thelabour force.
The concepts and definitions of employment andunemployment adopted by the survey are basedon those endorsed by the International LabourOrganisation (ILO).
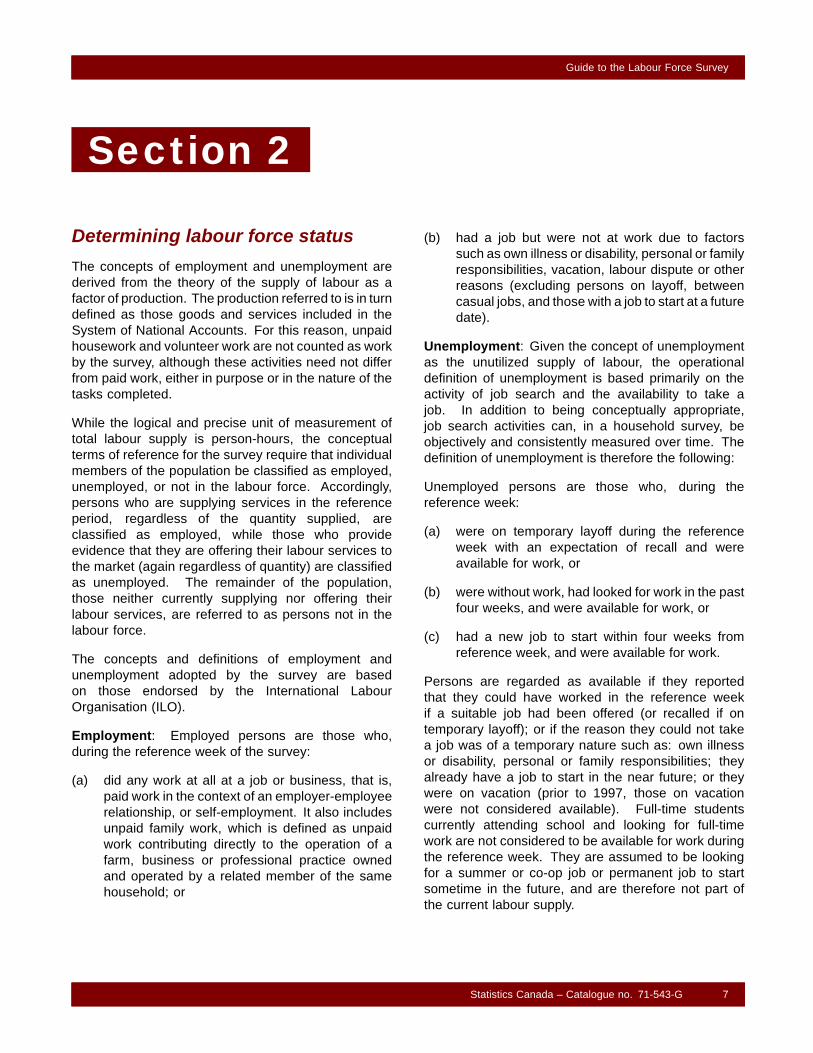
Employment: Employed persons are those who,during the reference week of the survey:
(a) did any work at all at a job or business, that is,paid work in the context of an employer-employeerelationship, or self-employment. It also includesunpaid family work, which is defined as unpaidwork contributing directly to the operation of afarm, business or professional practice ownedand operated by a related member of the samehousehold; or
(b) had a job but were not at work due to factorssuch as own illness or disability, personal or familyresponsibilities, vacation, labour dispute or otherreasons (excluding persons on layoff, betweencasual jobs, and those with a job to start at a futuredate).
Unemployment: Given the concept of unemploymentas the unutilized supply of labour, the operationaldefinition of unemployment is based primarily on theactivity of job search and the availability to take ajob. In addition to being conceptually appropriate,job search activities can, in a household survey, beobjectively and consistently measured over time. Thedefinition of unemployment is therefore the following:
Unemployed persons are those who, during thereference week:
(a) were on temporary layoff during the referenceweek with an expectation of recall and wereavailable for work, or
(b) were without work, had looked for work in the pastfour weeks, and were available for work, or
(c) had a new job to start within four weeks fromreference week, and were available for work.
Persons are regarded as available if they reportedthat they could have worked in the reference weekif a suitable job had been offered (or recalled if ontemporary layoff); or if the reason they could not takea job was of a temporary nature such as: own illnessor disability, personal or family responsibilities; theyalready have a job to start in the near future; or theywere on vacation (prior to 1997, those on vacationwere not considered available). Full-time studentscurrently attending school and looking for full-timework are not considered to be available for work duringthe reference week. They are assumed to be lookingfor a summer or co-op job or permanent job to startsometime in the future, and are therefore not part ofthe current labour supply.
Statistics Canada – Catalogue no. 71-543-G 7

Guide to the Labour Force Survey
Note that in the above definition there are two groupsfor which job search is not required: persons ontemporary layoff and persons with a job to start ata definite date in the future. Persons on temporarylayoff are included among the unemployed on thegrounds that their willingness to supply labour servicesis apparent in their expectation of returning to work.A similar argument is applied for persons who will bestarting at a new job in four weeks or less.
Finally, for the purposes of measuring job search aspart of the identification of the unemployed, the LFSuses a four-week search period although the referenceperiod for identifying the employed is that of one week.The justification for the difference is that delays inherentin job search (for example, periods spent awaiting theresults of earlier job applications) require that the activeelement of looking for work be measured over a periodgreater than one week if a comprehensive measure ofjob search is to be obtained.
Not in the labour force: Persons not in the labourforce are those who, during the reference week, wereunwilling or unable to offer or supply labour servicesunder conditions existing in their labour markets, thatis, they were neither employed nor unemployed.
Note on international comparisons: Mostindustrialized countries, including Canada and theUnited States, subscribe to guidelines establishedby the International Labour Office for definingand measuring labour market status, includingunemployment. However, the guidelines are, bydesign, rather imprecise, so that individual countriescan interpret them within the context of their ownlabour markets. As a result, unemployment rates arenot strictly comparable across all countries. The LFShas investigated in detail the measurement differencesbetween the US and Canadian unemployment rates.Adjusting the Canadian unemployment rate to USmeasurement differences lowers it by approximatelyone percentage point.
2.1 Labour force classification
A labour force status classification (including employed,unemployed, and not in the labour force) is assignedto each respondent aged 15 and over, according totheir responses to a number of questions during theinterview. The following decision table illustrates howthe classification is derived.
8 Statistics Canada – Catalogue no. 71-543-G

Guide to the Labour Force Survey
Figure 2.1
Labour Force Classification
Worked last week?
Yes No Permanently Unable to Work
A C
Had job but did not work?
Yes No
Why absent from work?Worked within the last year,
laid off because of business conditions and expects
Not Temporary Layoff, Seasonal Temporary Layoff to return? Seasonal Layoff or Layoff or Casual Job Casual Job
Yes NoA
Date of return or indication will be recalled within6 months, and layoff is less than a year ago?
Yes No
Looked for work in the past 4 weeks?
Yes No
Full-time student looking for Job to start within 4 weeks? full-time job?
Yes No Yes No
C C
Available for work?
Yes No
B
Labour Force Classification Reason is “going to school” or “other”?
Legend: A EmployedB UnemployedC Not in the labour force Yes No
C B
Statistics Canada – Catalogue no. 71-543-G 9

Guide to the Labour Force Survey
Section 3
Dictionary of concepts anddefinitionsThe LFS dictionary provides users with definitions ofterms and variables associated with the survey. Whereappropriate, changes to definitions through time aredocumented.
Aboriginal group: Includes persons who reportedbeing an Aboriginal person, that is, First Nations (NorthAmerican Indian), Métis or Inuk (Inuit).Excluded fromthe LFS coverage are persons living on reserves andother Aboriginal settlements in the provinces.In theLFS, a person may report more than one Aboriginalgroup: for example, a respondent could report beingboth First Nations and Métis.
Absence from work (hours lost): A distinctionis made between those who lose hours from workbecause they missed part of the work week or the fullwork week. Reasons for the absence are collected forboth situations.
(a) Part-week absence: Collected for employeesonly. Reasons for absence include: own illnessor disability, personal or family responsibilities,maternity or parental leave, vacation, weather,labour dispute, job started or ended duringreference week, holiday, working short time, andother reasons.
(b) Full-week absence: Collected for all employedpersons. Reasons for absence include:own illness or disability, personal or familyresponsibilities, maternity or parental leave,vacation, labour dispute, work schedule,self-employed (no work available), seasonalbusiness (self-employed), other reasons.The number of full weeks absent from workare recorded. In addition, employees andself-employed with an incorporated business areasked if they received wages or salary for anytime off in reference week.
Activity prior to unemployment: Main activity beforelooking for work. Distinguishes between those who
were working (that is, job leavers, job losers andtemporary layoffs) and those who were not in thelabour force but were keeping house, going to school,or involved in some other type of activity.
Actual hours worked: Number of hours actuallyworked by the respondent during the reference week,including paid and unpaid hours. These hours reflecttemporary decreases or increases in work hours (forexample, hours lost due to illness, vacation or holidaysor more hours worked due to overtime).
Age: Age is collected for every household memberin the survey, and the information on labour marketactivity is collected for all persons aged 15 and over.Prior to 1966, information on labour market activity wascollected for persons aged 14 and over. BeginningJanuary 1997, date of birth is collected to ensureinclusion of respondents who turn 15 during their sixmonth rotation in the survey.
Availability: Persons are regarded as available if theyreported that they could have worked in the referenceweek if a suitable job had been offered (or recalledif on temporary layoff); or if they could not take a jobbecause of their own illness or disability, personal orfamily responsibilities, because they already have ajob to start in the near future, or because of vacation(prior to 1997, those on vacation were not consideredavailable). Full-time students currently attendingschool and looking for full-time work are not consideredto be available for work during the reference week.They are assumed to be looking for a summer or co-opjob or permanent job to start sometime in the future.
Average hours worked: Average number of hoursworked per week, usual or actual, is calculated bydividing total hours by the total number of employedpersons. Also available is the average number ofactual hours worked per week calculated by excludingpersons who were not at work during the referenceweek.
Born in Canada: Anyone born in Canada, regardlessof citizenship.
10 Statistics Canada – Catalogue no. 71-543-G

Guide to the Labour Force Survey
Census metropolitan area (CMA) and Censusagglomeration (CA): Large urban areas (known asurban cores) together with adjacent urban and ruralareas (known as urban and rural fringes) that havea high degree of social and economic integrationwith the urban cores. A CMA has an urban corepopulation of at least 100,000 and a CA has an urbancore population between 10,000 and 99,999 based onthe 2006 census.
The following areas distinguish between central andperipheral urban and rural areas within CMAs and CAs:
(a) Urban core is a large urban area within aCMA or a CA that must have a populationof at least 100,000 in the case of a CMA, orbetween 10,000 and 99,999 in the case of a CAbased on the 2006 census and have a populationdensity of at least 400 per square kilometre. Inaddition, this category includes the secondaryurban core.
(b) Urban fringe is the urban area within a CMA orCA that is not contiguous to the urban core. It hasa minimum population concentration of 1,000 anda population density of at least 400 per squarekilometre, based on the 2006 census populationcounts.
(c) Rural fringe is all territory within a CMA or CA notclassified as urban core or urban fringe.
Class of worker: There are two broad categoriesof workers: those who work for others (employees)and those who work for themselves (self-employed).The first group is subdivided into two classes: publicsector employees and private sector employees.See Public/private sector employment andSelf-employment.
Country of birth: The country of birth of therespondent. This is based on current geographicnames and boundaries at the time of collection.
Country of highest education: Identifies the countryin which the respondent obtained their highest degree,certificate or diploma. This information is only availablefor those who are now, or have ever been landedimmigrants to Canada and who have educationalattainment above high school.
Discouraged searcher: (also called Discouragedworker) Since 1997, discouraged searchers are
defined as those persons who reported wanting towork at a job or business during reference week andwere available but who did not look for work becausethey believed no suitable work was available. Prior toJanuary 1997, the definition of discouraged searcherwas limited to those who looked for work within theprevious 6 months but not during the last 4 weeksalthough they were available, and did not look becausethey believed no suitable work was available. Thechange in concept and question wording results in acomplete break in the series.
Duration of joblessness: Number of months or yearselapsed since persons who are not currently employedlast worked, provided that they worked at some time inthe past.
Duration of unemployment: Number of continuousweeks during which a person has been on temporarylayoff or without work and looking for work.Respondents are required to look for work at leastonce every four weeks, they are not required toundertake job search activities each week in order tobe counted as unemployed. The LFS measures theduration of incomplete spells of unemployment, sincethe information is collected only from those currentlyunemployed. A spell of unemployment is interruptedor completed by any period of work or withdrawal fromthe labour force.
Dwelling: Any set of living quarters that is structurallyseparate and has a private entrance outside thebuilding or from a common hall or stairway inside thebuilding.
Earnings: See Wages.
Economic region: LFS economic regions (ERs) havebeen established at each decennial sample redesignin consultation with the provinces. The regionsgenerally correspond to regions used by the provincefor administrative and statistical purposes. The LFSERs coincide with the official Sub provincial Regions(SPRs) defined by Standards Division in consultationwith the provinces, for use in dissemination of subprovincial data by Statistics Canada.
Educational attainment: Highest level of schoolingcompleted. Questions relating to educationalattainment were changed in 1990, to better capturethe relationship between educational attainment andlabour market outcomes.
Statistics Canada – Catalogue no. 71-543-G 11

Guide to the Labour Force Survey
From 1976 to 1989: data on primary and secondaryeducation reflected the number of years of primaryand secondary education completed. In the case ofthose whose highest level was grades 11 through 13,no attempt was made to determine if the respondenthad actually graduated. However, post-secondaryeducation was limited to the education whichnormally requires high school graduation. In addition,information on type of post-secondary was limitedto three categories: 1) some post-secondary; 2)post-secondary certificate or diploma; 3) universitydegree.
Beginning January 1990: data on primary andsecondary education reflect the highest gradecompleted. This provides a more consistent measurefor those who accelerate or fail a grade than did years ofschool. A question on high school graduation has alsobeen added since it is generally believed that personswho have never completed their secondary educationhave greater difficulty competing in the labour market.With the new questions, any education that could becounted towards a degree, certificate or diploma froman educational institution is taken as post-secondaryeducation. The change allows more persons into thepost-secondary education category. For example,trades programs offered through apprenticeship,vocational schools or private trade schools do notalways require high school graduation. Such educationis now considered as post-secondary, while onlyprimary or secondary would have been recognisedprior to 1990. Finally, more information is collectedon the type of post-secondary education: 1) somepost-secondary; 2) trades certificate or diploma from avocational or apprenticeship training; 3) Non-universitycertificate or diploma from a community college,CEGEP, school of nursing, etc.; 4) University certificatebelow bachelor’s degree; 5) Bachelor’s degree; and 6)University degree or certificate above bachelor’sdegree.
Employee: A person who works for others. Employeescan be subdivided into public sector employees andprivate sector employees. See Public/private sectoremployment.
Note: The definition of a paid worker may varydepending on the nature of the analysis. Thoseconcerned with estimating the number of workersassociated with total labour income usually include bothemployees and the self-employed with an incorporatedbusiness in estimates of paid workers. In contrast,most labour market analysts include only employees in
paid worker estimates, while incorporated owners aregrouped with the rest of the self-employed.
Employment: Employed persons are those who,during the reference week did any work for pay orprofit, or had a job and were absent from work. (SeeSection 2: Determination of labour force status formore detail.)
Employment rate (employment/population ratio):Number of employed persons expressed as apercentage of the population 15 years of age andover. The employment rate for a particular group(age, sex, marital status, province, etc.) is the numberemployed in that group expressed as a percentage ofthe population for that group.
Establishment size: Beginning January 1997, thenumber of employees at the location of employment(building or compound) is collected from employees.Responses are recorded according to the followingsize groups: less than 20, 20 to 99, 100 to 500, morethan 500. The concept of location of employmentapproximates the concept of establishment used bymany Statistics Canada business surveys.
Family: The LFS identifies families according to thecriteria for "Economic families": a group of two or morepersons who live in the same dwelling and who arerelated by blood, marriage (including common-law) oradoption. A person living alone or who is related tono one else in the dwelling where he or she lives isclassified as an unattached individual.
Firm size: Beginning January 1998, the numberof employees at all locations of the employeris collected from employees. Responses arerecorded according to the following size groups:less than 20, 20 to 99, 100 to 500, more than 500.
Flows into unemployment: Characterises theunemployed in terms of their activity immediately priorto looking for work. See Job leavers, Job losers,Re-entrants and New entrants.
Full-time employment: See Type of work.
Future starts: Persons who did not have a job duringthe survey reference week and did not search for workwithin the previous four weeks, but were available towork and had a job to start within the next four weeks.These persons are classified as unemployed, despitethe lack of job search within the previous four weeks,since it is apparent that they are part of the currentsupply of labour. In contrast, those with jobs to start at
12 Statistics Canada – Catalogue no. 71-543-G

Guide to the Labour Force Survey
a later time than the next four weeks are designated aslong-term future starts and are classified as not in thelabour force since they are not part of current laboursupply.
Goods-producing industries (or goods sector, orgoods industries): Includes agriculture; forestry,fishing, mining, and oil and gas extraction; utilities(electric power, gas and water); construction; andmanufacturing.
Government sector: See Public/Private sector.
Head of family: See Reference person.
Hours: See Actual hours worked; Usual hoursworked; Average hours worked; Overtime hours.
Hours lost: See Absence from work.
Household: Any person or group of persons living in adwelling. A household may consist of any combinationof: one person living alone, one or more families, agroup of people who are not related but who share thesame dwelling.
Immigrant: Refers to a person who is or has everbeen a landed immigrant or permanent resident.This person has been granted the right to live inCanada permanently by immigration authorities. Someimmigrants have resided in Canada for a numberof years, while others have arrived recently. Someimmigrants are Canadian citizens, while others are not.
Immigrant status: See Born in Canada, Immigrant,Non-immigrant, Other non-immigrant.
Industry: General nature of the business carried outin the establishment where the person worked (mainjob only), based on the 2007 North American IndustryClassification System (NAICS). If a person did not havea job during the survey reference week, the informationis collected for the last job held, provided the personworked within the previous twelve months.
Involuntary part-time rate: The rate of involuntarypart-time workers can be derived in different ways.Published rates are based on all involuntary part-timeworkers, whether they looked for full-time work ornot. The rates can be presented as the number ofinvoluntary part-timers as a share of the labour force;as a share of the total employed or as a share of thepart-time employed, depending on one’s analyticalpreference.
Involuntary part-time workers: Also referred to asunderemployed, these respondents work part-timebecause they could not find work with 30 or morehours or due to business conditions, whether or notthey looked for full-time work. This group generallyrepresents one-quarter to one-third of the total numberof part-time workers, depending on current economicconditions. This is the most widely inclusive and useddefinition of involuntary part-time workers.
Another, more restricted definition would be to onlyinclude those involuntary part-time workers who alsolooked for full-time work during the past four weeks.They generally represent less than a third of allinvoluntary part-time workers.
Job leavers: Persons currently not employed, wholast worked within the previous year and left thatjob voluntarily. That is, the employer did not initiatethe termination. Detailed reasons collected are:own illness, personal or family responsibilities, goingto school, no specific reason, changed residence,dissatisfied with job, retired. Since 1997, further detailis available, including business sold or closed down(self-employed only), pregnancy.
Job losers: Persons currently not employed, wholast worked within the previous year and left thatjob involuntarily (employer initiated job terminationbecause of business conditions, downsizing etc.).Prior to 1997, this category was broken down intothose on temporary layoff and those laid off on apermanent basis. Since January 1997, more detailfor reason for permanent layoff is available: end ofseasonal job; end of temporary, term or contract job;casual job, no work; company moved; company wentout of business; laid off due to business conditions withno expectation of recall; dismissal by employer; otherreasons.
Job permanency: Beginning January 1997,information is collected to allow the classificationof paid jobs as either permanent or temporary. Thisclassification is based on the intentions of the employer,and characteristics of the job, rather than the intentionsof the employee. If a job that was formerly consideredpermanent is ending in the near future because ofdownsizing or closure, it is still regarded as permanent.
(a) Permanent: A permanent job is one that isexpected to last as long as the employee wantsit, given that business conditions permit. That is,there is no pre-determined termination date.
Statistics Canada – Catalogue no. 71-543-G 13
Guide to the Labour Force Survey
(b) Temporary: A temporary job has apredetermined end date, or will end as soon asa specified project is completed. Informationis collected to allow the sub-classification oftemporary jobs into four groups: seasonal;temporary, term or contract, including work donethrough a temporary help agency; casual job;and other temporary work.
Job search: See Methods of job search.
Job security: See Job permanency.
Job tenure: The number of consecutive monthsor years a person has worked for the current (or, ifemployed within the previous twelve months, the mostrecent) employer. The employee may have worked inone or more occupations or in one or more locations,or have experienced periods of temporary layoff withrecall and still be considered to have continuous tenureif the employer has not changed. But if a person hasworked for the same employer over different periodsof time, job tenure measures the most recent period ofuninterrupted work.
Labour force: Civilian non-institutionalpopulation 15 years of age and over who, duringthe survey reference week, were employed orunemployed. Prior to 1966, persons aged 14 and overwere covered by the survey.
Labour force by industry or occupation: SeeUnemployment by industry or occupation.
Labour force status: Designates the status of therespondent vis-à-vis the labour market: a member ofthe non-institutional population 15 years of age andover is either employed, unemployed, or not in thelabour force. See Section 2: Determining labourforce status.
Main job: When a respondent holds more than one jobor business, the job or business involving the greatestnumber of usual hours worked is considered to be themain job. The full or part-time status and industry andoccupation information available from the survey referto the main job, as does information for employees onwages, union status, job permanency, and workplacesize.
Marital status: Refers to the marital status reportedby the respondent. No differentiation is made betweenmarried and common-law relationships, both areclassified as married in the survey. The classificationof single is reserved for those who have never
married, otherwise, respondents are classified aseither widowed or separated/divorced.
Methods of job search: Identifies the various methodsof job search activities undertaken by unemployedpersons in the previous four weeks. If more thanone method is used, each one is recorded. Searchmethods include: checked with public employmentagency, private employment agency, union, employersdirectly, friends or relatives, placed or answered ads,looked at job ads, other methods.
Month of immigration: Refers to the month in whichthe immigrant obtained landed immigrant status.The month of immigration is available only for thoseimmigrants who landed in Canada within the 5-yearperiod prior to the year of the birth interview.
Multiple jobholders: Persons who, during thereference week, were employed in two or more jobssimultaneously. This group is sometimes referred toas "Moonlighters".
New entrants: Persons entering the labour force insearch of their first job (unemployed).
Non-immigrant: A concept used by the Census andthe National Household Survey, a non-immigrant refersto a person who is a Canadian citizen by birth. Sincethe LFS does not include questions on citizenship, thiscategory cannot be produced. It is comprised of twogroups: Born in Canada and other non-immigrants.
Not in the labour force: See Section 2: Determininglabour force status.
Occupation: Refers to the kind of work personswere doing during the reference week, as determinedby the kind of work reported and the description ofthe most important duties. For those not currentlyemployed, information on occupation is collectedfor the most recent job held within the previousyear. Occupational classification is based onthe 2006 National Occupational Classification forStatistics (NOC-S).
Other job: (See also Main job) Information collectedon the second job of multiple job holders and the oldjob of those who changed jobs during reference week islimited to: usual hours, actual hours worked, and statusin employment.
Other non-immigrant: Refers to a person who iseither a Canadian citizen by birth who was born outsideof Canada, or is a non-permanent resident. Since theLFS does not include questions on citizenship, these
14 Statistics Canada – Catalogue no. 71-543-G

Guide to the Labour Force Survey
two groups cannot be separated. A non-permanentresident refers to a person from another countrywho has a work permit (i.e. temporary foreignworkers), study permit or who is a refugee claimant,and any non-Canadian-born family member livingin Canada with them.In 2013, other non-immigrantsrepresented 2% of the total employed population.
Overtime hours (extra hours worked): The numberof hours worked during the reference week in excess ofthe usual hours reported in main job. It includes all extrahours, whether the work was done at a premium orregular wage rate, or without pay. Since January 1997,extra hours are collected from employees only, in theform of 2 questions: number of paid overtime hoursworked in reference week, and number of extra hoursworked without pay.
(a) Paid overtime: includes any hours workedduring the reference week over and abovestandard or scheduled paid hours, for overtimepay or compensation (including time off in lieu).
(b) Unpaid overtime: refers to time spent directlyon work or work-related activities over and abovescheduled paid hours. These must be extrahours worked for which the respondent receivedno additional compensation.
Participation rate: Total labour force expressed asa percentage of the population aged 15 years andover. The participation rate for a particular group (forexample, women aged 25 years and over) is the labourforce in that group expressed as a percentage of thepopulation for that group.
Part-time employment: See Type of work andReason for working part-time.
Permanent job: See Job permanency.
Personal or family responsibilities: BeginningJanuary 1997, more detail is collected on the personalor family reasons for the following data items: reasonfor absence from work, reason for leaving last job,reason for working part-time, and reason for notlooking for work. The greater detail includes a) caringfor own children; b) caring for elder relative, and c)other personal or family reasons. Pregnancy is alsoincluded in the response list for the question on reasonfor leaving last job, and maternity or parental leave isincluded in the response list for the question on reasonfor absence from work.
Population: The target population covered by thesurvey corresponds to all persons aged 15 years andover residing in the provinces of Canada, with theexception of the following: persons living on Indianreserves, full-time members of the regular ArmedForces, and persons living in institutions (for example,inmates of penal institutions and patients in hospitalsor nursing homes who have resided in the institutionfor more than six months).
Public/private sector employment:
(a) The public sector includes employees in publicadministration at the federal, provincial, territorial,municipal, First Nations and other Aboriginallevels as well as in Crown corporations, liquorcontrol boards and other government institutionssuch as schools (including universities), hospitalsand public libraries.
(b) The private sector comprises all other employeesand self-employed owners of businesses(including unpaid family workers in thosebusinesses), and self-employed persons withoutbusinesses.
The definition was changed in January 1999 in order toharmonize LFS data for the public and private sectorsto the System of National Accounts standard. Priorto January 1999, "ownership" rules were used as thebasis for classification of health care institutions anduniversities to the public sector by the LFS. SinceJanuary 1999, "funding" rules are used. As a result,all employees in universities and hospitals are nowclassified in the public sector. All historical data wererevised to reflect this new definition. Thus, there is nobreak in public and private sector series.
Reason for leaving last job: Asked of all personsclassified as unemployed or not in the labour force wholast worked within the previous year. See Job Losersand Job Leavers for detailed reasons.
Reason for not looking for work: BeginningJanuary 1997, asked of those who were not employedand did not search for work, but said they wantedwork during reference week. Prior to 1997, asked ofpersons who had looked for work in the previous sixmonths but not during the past four weeks. See alsoDiscouraged searchers.
Reason for time lost/absence from work: SeeAbsence from work.
Statistics Canada – Catalogue no. 71-543-G 15

Guide to the Labour Force Survey
Reason for working part-time (see also Type ofwork): Beginning January 1997 with the redesignof the LFS, all respondents who usually worked lessthan 30 hours per week at their main or only job areasked if they want to work more or less than 30 hoursat a (single) job or business. Depending on theresponse, the main reason for working part-time iscollected. For those who respond that they wantto work less than 30 hours, the main reason for notwanting to work 30 or more hours per week is collected.Responses include: own illness, personal or familyresponsibilities, going to school, personal preference,other.
For those who respond that they want to work 30 ormore hours per week, the main reason for workingless than 30 hours is collected. Responses include:own illness, personal or family responsibilities, goingto school, business conditions, could not find workwith 30 or more hours, other. Those whose response is"business conditions" or "could not find work with 30 ormore hours" are further asked if they looked for workwith 30 or more hours during the past four weeks. SeeInvoluntary part-time rate or Involuntary part-timeworkers.
Prior to January 1997, the question on reason forworking part-time was asked of all persons whosetotal usual work hours at all jobs or businesses werebelow 30 per week as opposed to their main or onlyjob. Reasons included: own illness, personal orfamily responsibilities, going to school, could only findpart-time work, did not want full-time work, other, andfull-time work under 30 hours. This last category ofrespondents were redefined as full-time workers andnot counted in any part-time estimates.
The change in concepts and definitions introduced inJanuary 1997 has resulted in a complete break in theseries on reason for working part-time and involuntarypart-time work. Estimates prior to 1997 are availableupon request.
Re-entrants: Persons currently unemployed who hadworked in the past and were out of the labour force forsome time following separation from their last job.
Reference person: At the time of interview therespondent designates a reference person for thefamily. The reference person is normally an adult withresponsibility for the care or support of the family. Therelationship of each family member to that reference
person is recorded. See also Relationship to familyreference person.
Reference week: The entire calendar week (fromSunday to Saturday) covered by the Labour ForceSurvey each month. It is usually the week containingthe 15th day of the month. The interviews areconducted during the following week, called the SurveyWeek, and the labour force status determined is thatof the reference week.
Relationship to family reference person:Relationship of each family member to the personwho has been identified as the reference person(for example, someone with responsibility for thecare or support of the family). Relationships include:self, spouse, son or daughter, grandchild, son ordaughter-in-law, foster child, parent, parent-in-law,brother or sister, other relative.
Retirement age: The Labour Force Survey askspeople who are not working, and who have left theirlast job within the year prior to being surveyed, why theyleft this job. One of the response categories is "retired."The average or median retirement age is calculatedfrom this variable. For a complete description of whois represented and how the age is calculated, pleaserefer to the article "Defining retirement" in Perspectiveson Labour and Income, catalogue number 75-001-X,February 2007 issue on the Statistics Canada website(www.statcan.gc.ca).
Returning students: Since a majority of students arenot attending school during the summer, supplementaryquestions are asked from May to August to identifythose who are on summer break so that theirlabour market situation can be monitored. Youths(aged 15 to 24) are given the status of "returningstudent" if they reported that they were attendingschool full-time in the previous March and intend toreturn to school full-time in the fall. Information is alsoavailable on those who were full-time students in theprevious March but do not intend to return to schoolfull-time or are unsure of their intentions.
Rural and small town areas: Areas outside thecommuting zone of Census Metropolitan Areas(CMAs) and Census Agglomerations (CAs). Thisincludes:
(a) Rural areas, which are sparsely populated landslying outside small towns, villages and otherpopulated places, with less than 1,000 populationaccording to the 2006 census.
16 Statistics Canada – Catalogue no. 71-543-G
Guide to the Labour Force Survey
(b) Small towns, which are urban areas with apopulation of 1,000 to 9,999 and with a populationdensity of 400 inhabitants per square kilometre,based on the 2006 census.
School attendance: Establishes whether or not arespondent is attending an educational establishment.For those who are students, information is collectedon the type of school, and whether enrolment isfull or part-time, as designated by the educationalestablishment.
Seasonal adjustment: Fluctuations in economic timeseries are caused by seasonal, cyclical and irregularmovements. A seasonally adjusted series is one fromwhich seasonal movements have been eliminated.Seasonal movements are defined as those which arecaused by regular annual events such as climate,holidays, vacation periods and cycles related to crops,production and retail sales associated with Christmasand Easter. It should be noted that the seasonallyadjusted series contain irregular as well as longer-termcyclical fluctuations.
The seasonal adjustment program is a complexcomputer program which differentiates between theseseasonal, cyclical and irregular movements in a seriesover a number of years and, on the basis of pastmovements, estimates appropriate seasonal factorsfor current data. On an annual basis, the historicalseries of seasonally adjusted data are revised in light ofthe most recent information on changes in seasonality.
Self-employment: Working owners of an incorporatedbusiness, farm or professional practice, or workingowners of an unincorporated business, farm orprofessional practice. The latter group also includesself-employed workers who do not own a business(such as babysitters and newspaper carriers).Self-employed workers are further subdivided bythose with or without paid help. Also included amongthe self-employed are unpaid family workers. Theyare persons who work without pay on a farm or in abusiness or professional practice owned and operatedby another family member living in the same dwelling.They represented less than 1% of the self-employedin 2012.
Seniority: See Job tenure.
Service-producing industries (or service sector orservice industries): Includes trade; transportationand warehousing; finance, insurance, real estate
and leasing; professional, scientific and technicalservices; business, building and other supportservices; educational services; health care andsocial assistance; information, culture and recreation;accommodation and food services; other services; andpublic administration.
Student: See School attendance and Returningstudents.
Temporary layoff: Persons on temporary layoff areemployees who did not work during the reference weekbecause they had been temporarily released by theiremployer due to business conditions (not enough work,drop in orders or sales, retooling etc.). They musthave a definite date to return to work, or an indicationfrom their employer that they will be recalled in thefuture, and they must be available for work during thereference week. Persons on temporary layoff are notrequired to undertake any job search in order to becounted as unemployed.
Prior to January 1997, the wording and structure of thequestionnaire was such that it was likely that a numberof persons on temporary layoff were not identifiedas such, and were classified as "not in the labourforce" rather than "unemployed". The 1997 redesignaddressed this problem, resulting in a higher numberof identified persons on temporary layoff. Thesechanges result in a break in the temporary layoffseries. Since those on temporary layoff account for asmall proportion of the unemployed (less than 10%) theimpact of these changes on the overall unemploymentrate is negligible.
Temporary work: See Job permanency.
Type of work: Full-time or part-time work schedule.Full-time employment consists of persons who usuallywork 30 hours or more per week at their main or onlyjob. Part-time employment consists of persons whousually work less than 30 hours per week at theirmain or only job. This information is available forthose currently employed or who last worked withinthe previous year. Note: prior to 1996, full-time andpart-time had been defined according to usual hours atall jobs, and those who considered their work scheduleof less than 30 hours per week to be full-time workwere classified as full-time workers. In January 1996,when the definition was revised, all historical data andrecords were adjusted to reflect this new definition.Thus, there is no break in part-time and full-time dataseries.
Statistics Canada – Catalogue no. 71-543-G 17

Guide to the Labour Force Survey
Type of work sought: Identifies whether a jobsearcher is looking for full-time or part-time work.Unemployed persons on temporary layoff are classifiedas looking for full or part-time on the basis of theirusual hours at their former job. This information isnot available for non-searchers who are classified asunemployed because they have a job to start in thenext four weeks (future-starts).
Unattached individuals: Persons who live alone orwho are not related to anyone else in the household.They are excluded from the family member counts.
Unemployment: Unemployed persons are those who,during reference week, were available for work andwere either on temporary layoff, had looked for workin the past four weeks or had a job to start within thenext four weeks. See Section 2: Determining labourforce status for more details.
Unemployment by industry/occupation: The LFSproduces data on the number of unemployed, theunemployment rate and the labour force by industryand occupation. The basis for these categories isindustry or occupation of last job for those currentlyunemployed who held a job in the previous year. It isimportant to note that no data are collected on industryor occupation of job search. Thus, these data shouldbe interpreted with caution. For example, a recentgraduate of law school looking for work as a lawyer ina law firm, may have last held a job as a waiter in arestaurant. For this person, unemployment is attributedto the accommodation and food services industry andthe services occupation.
Unemployment rate: Number of unemployed personsexpressed as a percentage of the labour force. Theunemployment rate for a particular group (for example,age, sex, marital status) is the number unemployed inthat group expressed as a percentage of the labourforce for that group. For a note on internationalcomparisons, see Section 2: Determining labourforce status.
Union status: Beginning January 1997, employeesare classified as to their union status: a) union member;
b) not a member but covered by a union contract orcollective agreement; or c) non-unionized.
Unpaid family workers: Persons who work withoutpay on a farm or in a business or professional practiceowned and operated by another family member livingin the same dwelling.
Usual hours worked: Prior to January 1997, usualhours were the number of hours usually worked by therespondent in a typical week, regardless of whetherthey were paid. Beginning January 1997, usual hoursfor employees refers to their normal paid or contracthours, not counting any overtime. However, thedefinition of usual hours remains unchanged for theself-employed and unpaid family workers.
Variable hours: Beginning January 1997, informationis collected to determine if the number of hours workedvaries from week to week. In these cases, usual hoursworked are calculated as the average of the hoursworked in the last 4 weeks.
Wages: Beginning January 1997, information iscollected on the usual wages or salary of employeesat their main job. Respondents are asked to reporttheir wage/salary before taxes and other deductions,and include tips and commissions. Weekly and hourlywages/salary are calculated in conjunction with usualpaid work hours per week. Average hourly wages,average weekly wages, and wage distributions canthen be cross-tabulated by other characteristics suchas age, sex, education, occupation, and union status.Those who are paid on an hourly basis are alsoidentified.
Work: Includes any work for pay or profit, that is,paid work in the context of an employer-employeerelationship, or self-employment. It also includes workperformed by those working in family business withoutpay (unpaid family workers).
Year of immigration: Refers to the year in whichthe immigrant obtained landed immigrant status byimmigration authorities.
18 Statistics Canada – Catalogue no. 71-543-G

Guide to the Labour Force Survey
Section 4
Survey methodology
4.1 Population coverage
The LFS is a monthly household survey of a sampleof individuals who are representative of the civilian,non-institutionalized population 15 years of ageor older. It is conducted nationwide, in both theprovinces and the territories. Excluded from thesurvey’s coverage are: persons living on reservesand other Aboriginal settlements in the provinces;full-time members of the Canadian Forces and theinstitutionalized population. These groups togetherrepresent an exclusion of approximately 2% of thepopulation aged 15 and over.
National Labour Force Survey estimates are derivedusing the results of the LFS in the provinces. TerritorialLFS results are not included in the national estimates,but are published separately.
Why the territories are excluded from the nationaltotal
Difficulties exist with respect to reaching smallcommunities in the territories, and there are areas ofthe territories that are excluded. As well, since thesample design, rotation pattern and reliability criteriaare different from those in the ten provinces, estimatesfor the territories are not included with the provincialtotals, but rather they are calculated and reportedseparately.
The LFS in the territories started as a pilot project, firstin Yukon beginning in 1991 and then in the NorthwestTerritories and Nunavut starting in 2000. Giventhe special difficulties in collecting data in northernareas, and associated data quality issues at theoutset of collection, data are available since 1992 forYukon, 2001 for the Northwest Territories and 2004 forNunavut.
Details on the survey methodology for the North canbe found in the sub-section Differences in surveymethodology between the North and the provinces.
Other exclusions from the Labour Force Survey
Indian reserves have historically been excluded fromthe LFS due to the serious challenges in contacting andinterviewing potential respondents, with many of themliving in remote locations not easily accessible to LFSinterviewers given the short data collection period eachmonth, and the large effort and cost associated withtraveling to these locations.
The LFS also excludes residents of institutions (forexample, inmates of penal institutions and patients inhospitals or nursing homes who have resided in theinstitution for more than six months) for conceptualreasons; the LFS is designed to measure the labourforce participation in the current labour market.Residents of institutions are for the most part notable to participate in the labour market and are noteconomically active. There would also be difficultiesassociated with the practical implications of samplingand interviewing residents of institutions (for example,access within prisons or interviewing people who arevery ill) that would make their inclusion operationallyproblematic.
There would also be practical difficulties associatedwith sampling and interviewing full-time members ofthe armed forces, since many of these persons live inlocations that are not accessible for the purposes ofconducting the LFS, such as naval vessels, militarycamps and barracks. Many of them may be stationed inother countries. While not included in the Labour Forcesurvey, the monthly numbers of employed full-timemembers of the Canadian Forces are available fromadministrative sources, such as the Department ofNational Defence.
4.2 Sample design and sample sizefor the provinces
Canada’s population lives in various geographic areassuch as provinces and regions within provinces. Forthe purposes of sampling, the population in these areas
Statistics Canada – Catalogue no. 71-543-G 19
Guide to the Labour Force Survey
is further partitioned into strata, in order to maximize thereliability of the estimates while keeping collection costsat a minimum. Dwellings in strata are not selecteddirectly. Small well-defined areas called clustersare mapped across all parts of the 10 provinces.Each cluster contains approximately 200 householdsaccording to the 2006 Census. These clusters areused as the unit for stratification, as well as the unit forsample selection within stratum. A sample of clusters isselected in each stratum. All dwellings within selectedclusters are listed and a sample of dwellings is chosenfrom each list. Chosen in this fashion, the sample isrepresentative of the population.
The number of households sampled across thecountry has varied over the years as a result ofvarying levels of funding, and improvements in thesurvey design. Recently, the sample size has beenapproximately 56,000 households. The sample isallocated to provinces and strata within provincesin the way that best meets the need for reliableestimates at various geographic levels. These includenational, provincial, census metropolitan areas (largecities), economic regions, and employment insuranceregions. The following guidelines were used in sampleallocation:
• Canada and provinces: estimates of unemploymentshould not have a CV (standard error relative tothe estimate) greater than 2 percent for Canada,and 4 to 7 percent for the provinces. (See section7 for explanation of sampling error and CVs[Coefficients of variation]).
• Census Metropolitan Areas (CMAs)/EmploymentInsurance Regions: CVs of 15 percent or lessfor 3 month average estimates of unemployed.
• Economic Regions (ERs): CVs of 25 percent or lessfor 3 month average estimates of unemployed.
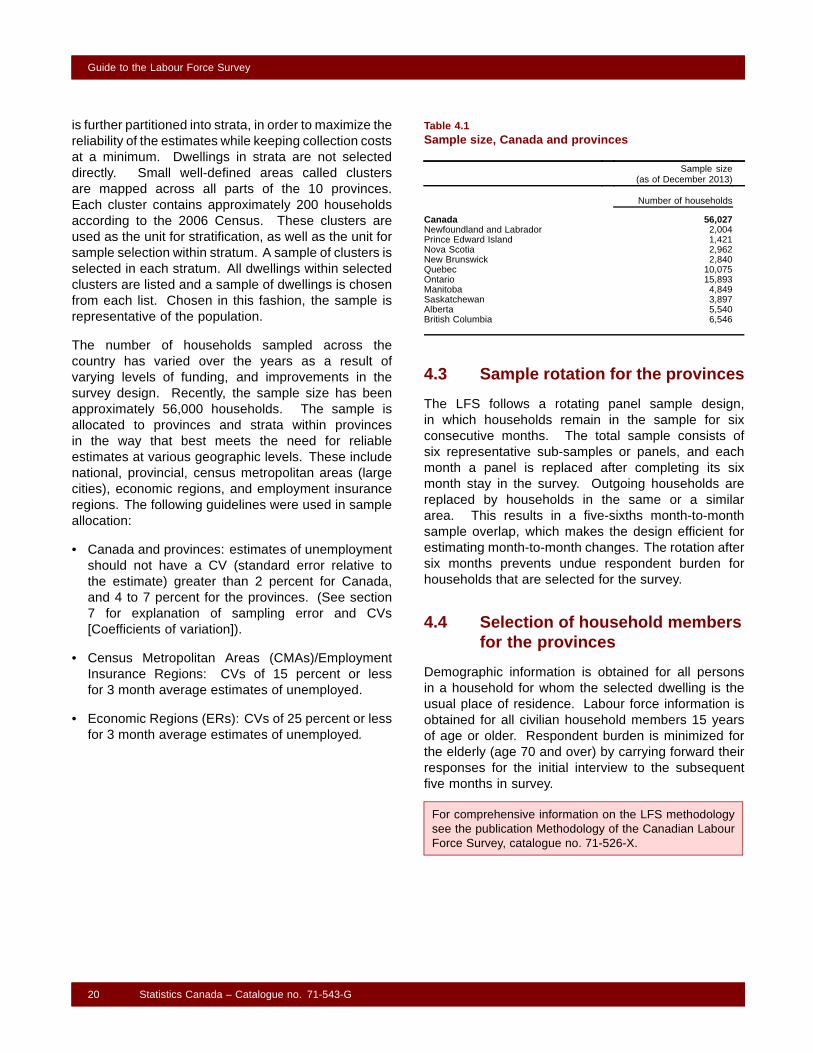
Table 4.1Sample size, Canada and provinces
Sample size(as of December 2013)
Number of households
Canada 56,027Newfoundland and Labrador 2,004Prince Edward Island 1,421Nova Scotia 2,962New Brunswick 2,840Quebec 10,075Ontario 15,893Manitoba 4,849Saskatchewan 3,897Alberta 5,540British Columbia 6,546
4.3 Sample rotation for the provinces
The LFS follows a rotating panel sample design,in which households remain in the sample for sixconsecutive months. The total sample consists ofsix representative sub-samples or panels, and eachmonth a panel is replaced after completing its sixmonth stay in the survey. Outgoing households arereplaced by households in the same or a similararea. This results in a five-sixths month-to-monthsample overlap, which makes the design efficient forestimating month-to-month changes. The rotation aftersix months prevents undue respondent burden forhouseholds that are selected for the survey.
4.4 Selection of household membersfor the provinces
Demographic information is obtained for all personsin a household for whom the selected dwelling is theusual place of residence. Labour force information isobtained for all civilian household members 15 yearsof age or older. Respondent burden is minimized forthe elderly (age 70 and over) by carrying forward theirresponses for the initial interview to the subsequentfive months in survey.
For comprehensive information on the LFS methodologysee the publication Methodology of the Canadian LabourForce Survey, catalogue no. 71-526-X.
20 Statistics Canada – Catalogue no. 71-543-G

Guide to the Labour Force Survey
4.5 Differences in surveymethodology between theNorth and the provinces
While survey coverage in the provinces is fullyrepresentative of the working-age population,LFS coverage in the territories excludes somecommunities. Survey coverage in Northwest Territoriesis about 96%, and the Yukon has about 92%coverage. From 2008 to present, Nunavut’s surveycoverage is approximately 92%, and was 70%between 2004 and 2007.
The northern sample includes both Aboriginal andnon-Aboriginal communities, while persons living onreserves and other Aboriginal settlements are notincluded in the sample for the provinces.
In order to get a representative sample of the targetpopulation for each territory, the sample for threeconsecutive months are added. For this reason,estimates for the North are only available as 3 monthmoving averages.
Table 4.2Sample size, territories
Quarterlysample size
(Q4 2013)
Number of households
Yukon 690Northwest Territories 693Nunavut 669
The following guidelines were used in sample allocationfor the territories:
• CVs of 25 percent or less for 3 month averageestimates of unemployed. (See section 7 forexplanation of sampling error and CVs [Coefficientsof variation]).
Like the provinces, the northern sample design is alsobased on a rotating panel but at different intervals.Selected householders in the North are interviewedeight times, once every three months over a two-yearperiod. For example, if a household was first selectedfor the month of January 2010, household members willbe interviewed again every three months (for example,
April, July, and October 2010, January, April, July andOctober 2011). After eight interviews, the householdis replaced by another from the same community orfrom another community in the same stratum. Eachquarter, one-eighth of the sampled households areexperiencing their first interview.
The same Labour Force Survey questions are asked inthe territories as in the provinces, with a few exceptions.The rent questions are not asked in the territories norare there any supplements to LFS in the North.
Like the provinces, survey operations are conducted byStatistics Canada staff. The first contact is generallyin person and most of the other interviews are doneover the phone (where possible). Data collection andprocessing for the North is otherwise the same as forthe provinces.
The community boundaries are usually basedon 2006 Census geography. The communitiesincluded on the frame and eligible to be sampled are:
Yukon– The Census agglomeration of Whitehorseand communities of Dawson and Watson Lake arealways in sample; plus one community is selected fromCarmacks, Mayo, Haines Junction or Teslin; and onecommunity from Pelly Crossing, Ross River, Carcrossor Faro. Watson Lake includes the small neighbouringvillages of Upper Liard, Two Mile Village and Two andOne-Half Mile Village.
Northwest Territories– Yellowknife, Norman Wells,Hay River and Inuvik are always in sample; onecommunity from Fort Smith or Fort Simpson isselected; plus one community from Behchokò, FortLiard, Fort Providence or Fort Resolution; onecommunity from Tuktoyaktuk, Fort McPherson orAklavik; one community from Fort Good Hope, Délineor Tulita; one community from Hay River Dene 1 orDetah; and one community from Wha Ti, Wekweti,Gamèti, Lutselk’e, Tsiigehtchic or Wrigley.
Nunavut– Iqaluit, Rankin Inlet, Cambridge Bay andKugluktuk are always in sample. One community fromeach of the following groups are also selected: BakerLake or Arviat; Igloolik or Pond Inlet; Cape Dorsetor Pangnirtung; Taloyoak, Gjoa Haven or Kugaaruk;Coral Harbour or Repulse Bay; Qikiqtarjuaq, ArcticBay, Hall Beach or Clyde River.
Statistics Canada – Catalogue no. 71-543-G 21
Guide to the Labour Force Survey
Section 5
Data collection
5.1 Interviewing for the LFS
Data collection for the LFS is carried out each monthduring the week following the LFS reference week.The reference week is normally the week containingthe 15th day of the month.
Statistics Canada interviewers are employeeshired and trained to carry out the LFS and otherhousehold surveys. Each month they contact thesampled dwellings to obtain the required labour forceinformation.
LFS interviews are conducted by telephone byinterviewers working out of a regional office CATI(Computer Assisted Telephone Interviews) site or bypersonal visit from a field interviewer. Since 2004,dwellings new to the sample in urban areas arecontacted by telephone if the telephone number isavailable from administrative files, otherwise thedwelling is contacted by a field interviewer. Theinterviewer first obtains socio-demographic informationfor each household member and then obtains labourforce information for all members aged 15 and overwho are not members of the regular armed forces.The majority of subsequent interviews are conductedby telephone. In subsequent monthly interviewsthe interviewer confirms the socio-demographicinformation collected in the first month and collects thelabour force information for the current month.
In each dwelling, information about all householdmembers is usually obtained from one knowledgeablehousehold member. Such ’proxy’ reporting, whichaccounts for approximately 65% of the informationcollected, is used to avoid the high cost and extendedtime requirements that would be involved in repeatvisits or calls necessary to obtain information directlyfrom each respondent.
If, during the course of the six months that a dwellingnormally remains in the sample, an entire householdmoves out and is replaced by a new household,information is obtained about the new household forthe remainder of the six-month period.
5.2 Supervision and quality control
All LFS interviewers are under the supervision of a staffof senior interviewers who are responsible for ensuringthat interviewers are familiar with the concepts andprocedures of the LFS and its many supplementarysurveys, and also for periodically monitoring theirinterviewers. The senior interviewers are, in turn,under the supervision of the LFS program managers.
5.3 Non-response to the LFS
Non-response to the LFS tends to average about 10%of eligible households. Interviewers are instructed tomake all reasonable attempts to obtain LFS interviewswith members of eligible households. For individualswho at first refuse to participate in the LFS, a letteris sent from the Regional Office to the dwellingaddress stressing the importance of the survey andthe household’s co-operation. This is followed by asecond call (or visit) from the interviewer. For casesin which the timing of the interviewer’s call (or visit) isinconvenient, an appointment is arranged to call backat a more convenient time. For cases in which there isno one home, numerous call backs are made. Underno circumstances are sampled dwellings replaced byother dwellings for reasons of non-response.
Each month, after all attempts to obtain interviewshave been made, a small number of non-respondinghouseholds remain. For households non-respondingto the LFS, a weight adjustment is applied to accountfor non-responding households.
22 Statistics Canada – Catalogue no. 71-543-G
Guide to the Labour Force Survey
Section 6
Data processing
6.1 Data capture
Since 1994, responses to survey questions arecaptured directly by the interviewer at the time ofthe interview using a computerized questionnaire ona lap-top or desktop computer. The computerizedquestionnaire reduces processing time and costsassociated with data entry, transcription errors, anddata transmission. The response data are encryptedto ensure confidentiality and sent electronically to theappropriate Statistics Canada Regional Office. Fromthere they are transmitted over a secure line to Ottawafor further processing. Prior to the introduction ofcomputer assisted interviewing (CAI), information wasrecorded by the interviewer on a paper questionnaire,which was then sent for data capture in the RegionalOffice before transmission to Ottawa.
6.2 Editing
Some editing is done directly at the time of interview.Where the information entered is out of range (toolarge or small) of expected values, or inconsistent withprevious entries, the interviewer is prompted, throughmessage screens on the computer, to modify theinformation. However, interviewers have the option ofbypassing the edits, and of skipping questions if therespondent does not know the answer or refuses toanswer. Therefore, the response data are subjected tofurther edit and imputation processes once they arrivein head office.
The editing and imputation phases of processinginvolve the identification of logically inconsistent ormissing information items, and the modification ofsuch conditions. Since the true value of each entryon the questionnaire is not known, the identificationof errors can be done only through recognition ofobvious inconsistencies (for example, a 15 year-oldrespondent who is recorded as having last workedin 1940). If a value is suspicious but reasonable,
the erroneous value will find its way into the monthlystatistics. For that reason emphasis must be placed onquality controls and interviewer training to ensure thaterrors are both minimal in number and non-systematicin nature.
Where errors or omissions are detected, the erroneousor missing items are replaced by the imputation oflogically consistent values. Such changes are madeautomatically by the edit and imputation system orthrough intervention of experts. These changes arebased on pre-specified criteria, and may involve theinternal logic of the questionnaire, reference to earliermonth’s information (if available), or the use of similarrecords to impute one or more values. In all cases,editing changes are recorded and this information isused to assess various aspects of survey performance.These records of errors are also used to adviseinterviewers of mistakes made in the past in order toavoid repetition of these mistakes in the future.
6.3 Industry and occupation coding
In this process, industry and occupation codes areassigned using the respondent’s job description onthe questionnaire. The first step is an attempt tocode each record using a computerized procedure.If this is unsuccessful, the coding is performedmanually. In both cases, codes assigned are basedon the classifications described in the North AmericanIndustry Classification System (NAICS 2007) andthe National Occupational Classification for Statistics(NOC-S, 2006) manuals.
6.4 Creation of derived variables
A number of data items (variables) on the microdata fileare derived by combining items on the questionnaireaccording to classification rules. For example, labourforce status is derived from specific combinations ofresponses to a number of survey questions regardingwork activity, status in employment, job search,availability, etc.
Statistics Canada – Catalogue no. 71-543-G 23
Guide to the Labour Force Survey
6.5 Weighting
The sample data are weighted to enable tabulationsof estimates at national, provincial, and sub-provinciallevels of aggregation.
The sample design determines a certain number ofweighting factors to be used in the calculation of theindividual weights. The main component is the inverseof the probability of selection, known as the basicweight. For example, in an area where 2 percent of thehouseholds are sampled, each household would beassigned a basic weight of 1/.02=50. The basic weightis then adjusted for any sub-sampling due to growththat may have occurred in the area. This weight is thenadjusted for non-response and coverage error.
In the LFS, some survey non-response is compensatedfor by carrying forward last month’s data if theyare available and appropriate. Any remainingnon-response is accounted for by adjusting theweights for the responding households in the samearea. This non-response adjustment assumes thatthe characteristics of the responding households arenot significantly different than the non-respondinghouseholds. To the extent that this assumption is true,non-response will not be a source of bias in the LFSestimates. The weights derived after the non-responseadjustments are applied are called the subweights.The final adjustment to the weight is made to correctfor coverage errors. The subweights are comparedto independently derived estimates of population andadjusted so that the survey estimates of populationconform to these control totals. These final weights areused in the LFS tabulations.
6.6 Seasonal adjustment: LFSprocedures
Most estimates associated with the labour market aresubject to seasonal variation, that is, annually-recurringfluctuations attributable to climate and regularinstitutional events such as vacations, and holidayseasons. Seasonal adjustment is used to removethese seasonal variations from more than 3,000 seriesfrom the LFS, in order to facilitate analysis of short-termchange for major indicators such as employment andunemployment by age and sex, employment by
industry, and employment by class of worker (publicand private employee or self-employed). Many of theseindicators are adjusted at national and provincial levels.Main labour force status estimates are also seasonallyadjusted for Census Metropolitan Areas (CMAs), andpublished as three-month moving averages to reduceirregular movements caused by relatively small samplesizes.
6.7 Procedures
The program being used for seasonal adjustment isX-12-ARIMA, as implemented in SAS (version 9.2) ProcX12.
Seasonally adjusted estimates of overall employmentand unemployment for Canada are derived bysumming adjusted estimates for major age/sex groups(men aged 15 to 24, 25 to 54 and 55+; womenaged 15 to 24, 25 to 54 and 55+). The resultingoverall estimate is used as a benchmark for otherseasonally adjusted series. For example, employmentestimates by industry and class of worker are adjustedindependently and then increased or decreasedproportionately so that their total sums to the overallbenchmark. This procedure is known as raking.Starting in January 2010, Statistics Canada’s in houseSAS Proc TSRaking program has been used for thispurpose.
Overall employment and unemployment estimates forthe provinces are also derived by summing adjustedestimates for major age/sex groups (men 15 to 24, 25+;women aged 15 to 24, 25+). However, prior to thesummation, the estimate for each age/sex group israked to the corresponding national estimate. Similarly,estimates of employment by industry are raked to theprovincial employment total.
Seasonally adjusted estimates of labour force for anyparticular group are derived by adding the seasonallyadjusted estimates of employment and unemploymentfor that group. Similarly, seasonally adjusted rates(for example, unemployment rate) are calculated bydividing the seasonally adjusted numerator by theseasonally adjusted denominator. In the case ofthe participation rate and employment rate, only thenumerator is seasonally adjusted.
24 Statistics Canada – Catalogue no. 71-543-G

Guide to the Labour Force Survey
6.8 Adjustment for reference-weekeffect
The definition of the LFS reference week (usually theweek with the 15th day of the month) implies that theactual dates of the week vary from year to year. Thisvariability may impact on the month-to-month changein major labour market estimates. For example,more students may have finished exams and enteredthe labour market before the end of reference weekin years when the 15th day of June falls near thebeginning of the week, than is the case in years whenthe 15th falls near the end of reference week. Thereference week effects are removed from the series sothat the underlying trend is easier to interpret. Theseadjustments compensate for early or late referenceweeks.
These effects are estimated by the seasonaladjustment program X-12-ARIMA using a regressionmodel with ARIMA residuals.
6.9 Adjustment for holiday effects onactual hours worked
In addition, actual hours of work are particularlyaffected by variability in the dates of the reference weekcombined with the presence of fixed (Thanksgiving,Remembrance Day) or moving holidays (Easter) duringthe reference week in some years but not in others.Similarly, fluctuations can also occur in July, dependingon the timing of the reference week relative to the usualvacation period which tends to peak in the latter half ofJuly. This variability introduces significant fluctuationin estimates of actual hours worked and is thereforeremoved from the series prior to seasonal adjustment.
Starting in January 2010, a method used by the Systemof National Accounts labour statistics was adopted.
Permanent prior adjustments are now generated byadding back the hours lost due to the holiday asreported by respondents of the Labour Force Survey.The historical series have been revised using this newmethod. The holidays that may fall in reference weekand are adjusted (adding back the hours lost) includeFamily day (for certain provinces), March break (forcertain provinces), Easter Friday or Easter Monday,the July construction holiday in Quebec, Thanksgivingand Remembrance day.
Since holiday effects on actual hours worked varya great deal from industry to industry depending onthe characteristics of each regarding the observanceof holidays and summer vacation practices, prioradjustments are calculated and performed separatelyfor each major industry group.
6.10 Revisions every year
Each year, the Labour Force Survey revises itsestimates for the previous three years, using the latestseasonal factors.
Seasonal adjustment requires data from the past,the current and future values. As new data becomesavailable, various time series components can bebetter estimated which lead to revised and moreaccurate seasonally adjusted estimates.
Seasonal adjustment models and options for eachseries are also reviewed each year. When appropriate,updated options will be used to produce the revisedseasonally adjusted estimates (and the on-goingseasonal adjusted estimates on a monthly basis for theyear to come). Revised seasonally adjusted estimatesare published on an annual basis, for the last threeyears.
Statistics Canada – Catalogue no. 71-543-G 25

Guide to the Labour Force Survey
Section 7
Data quality
7.1 Non-sampling errors
Errors, which are not related to sampling, may occur atalmost every phase of a survey operation. Interviewersmay misunderstand instructions, respondents maymake errors in answering questions, the answers maybe incorrectly entered and errors may be introduced inthe processing and tabulation of the data. These areall examples of non-sampling errors.
Over a large number of observations, randomlyoccurring errors will have little effect on estimatesderived from the survey. However, errors occurringsystematically will contribute to biases in thesurvey estimates. Quality assurance measuresare implemented at each step of the data collectionand processing cycle to monitor the quality of thedata. These measures include the use of highly skilledinterviewers, extensive training of interviewers withrespect to the survey procedures and questionnaire,observation of interviewers to detect problemsof questionnaire design or misunderstanding ofinstructions, edits to ensure that data entry errors areminimized and coding and edit quality checks to verifythe processing logic.
7.2 Sampling errors
The Labour Force Survey collects information froma sample of households. Somewhat different figuresmight have been obtained if a complete censushad been taken using the same questionnaires,interviewers, supervisors, processing methods, etc.as those actually used in the Labour Force Survey.The difference between the estimates obtained fromthe sample and those that would give a completecount taken under similar conditions is called thesampling error of the estimate, or sampling variability.
Approximate measures of sampling error accompanyLabour Force Survey products and users are urged tomake use of them while analysing the data.
Three interpretation methods can be used to evaluatethe precision of the estimates: the standard error,and two other methods also based on standard error:confidence intervals and coefficients of variation.
7.2.1 Interpretation using standard error
The sampling error, or standard error, is a measurethat quantifies how different the sample estimate mightbe from the census value. It is based on the idea ofselecting several samples, although in a survey onlyone sample is drawn and information is collected onunits in that sample. Using the same sampling plan,if a large number of samples were to be drawn fromthe same population, then about 68% of the sampleswould produce a sample estimate that is within onestandard error of the census value and in about 95%of the samples it will be within two standard errors ofthe census value.
When looking at changes, for example month to monthchanges, two thirds of the time (68%) a change greaterthan the sampling error indicates a real change. Thelarger the change compared to the standard error, thebetter the chance that we are observing a real change,as opposed to a change due to sampling variability. Atthe 95% confidence level, the change in the estimatemust be greater than twice the sampling error in orderto ensure that change is real.
Movements in estimates that are smaller than thesampling error are less likely to reflect a real changeand more likely to be due to sampling variability.While the above is true for monthly movements, onecan have more confidence in a series of consecutivemovements in the same direction, even though someof the monthly movements may be smaller than thesampling error.
26 Statistics Canada – Catalogue no. 71-543-G
Guide to the Labour Force Survey
To illustrate, let us say that between two months thepublished estimate for total employment increasesby 40,000, and that the associated standard error forthe movement estimate is 28,600. Since the increase islarger than the standard error, the probability is at leasttwo out of three (68%) that the increase of 40,000 inemployment is a real change. To reach a 95%confidence level, the standard error has to be doubled.Because the increase of 40,000 in employment issmaller than twice the standard error (57,200), it isimpossible to state with a 95% confidence level thatthere was an increase in employment.
7.2.2 Interpretation using confidenceintervals
Confidence intervals provide another way of looking atthe variability inherent in estimates of sample surveys.To illustrate how to calculate the confidence interval,let us say that one month the published estimate fortotal employment rose by 16,000 to reach 16,500,000.The associated standard error for the movementestimate is 27,200. Using the standard error to buildthe confidence intervals, we can say that:
• There are approximately two chances in three(68%) that the real value of the movement betweenthe two months falls within the range -11,200 to+43,200 (16,000 + or – one standard error).
• There are approximately nine chances in ten (90%)that the real value of the movement betweenthe two months falls within the range -27,520 to+59,520 (16,000 + or – 1.6 times the standard error).
• There are approximately nineteen chances in twenty(95%) that the real value of the movement betweenthe two months falls within the range -38,400 to+70,400 (16,000 + or – two standard errors).
7.2.3 Interpretation using coefficient ofvariation
Sampling variability can also be expressed relative tothe estimate itself. The standard error as a percentageof the estimate is called the coefficient of variation (CV)or the relative standard error. The CV is used to givean indication of the uncertainty associated with theestimates. For example, if the CV is 7%, then in 68%of the samples the census value will lie within plus orminus 7% or one CV and in 95% of the samples the
census value will lie within plus or minus 14% or twotimes the CV of the estimate.
Small CV’s are desirable because they indicate thatthe sampling variability is small relative to the estimate.The CV depends on the size of the estimates, thesample size the estimate is based on, the distributionof the sample, and the use of auxiliary information inthe estimation procedure. The size of the estimatesis important because the CV is the sampling errorexpressed as a percentage of the estimate. Thesmaller the estimate, the larger the CV (all other thingsbeing equal). For example, when the unemploymentrate is high, the CV may be small. If the unemploymentrate falls due to improved economic conditions, thenthe corresponding CV will become larger. Typically,of similar estimates, the one with largest sample sizewill yield the smaller CV. This is because the samplingerror is smaller.
Also, estimates referring to characteristics that aremore clustered will have a higher CV. For example,persons employed in forestry, fishing, mining, oil andgas in Canada are more clustered geographically thanemployed women aged 55 to 64 years in Ontario. Thelatter will have a smaller sampling variability althoughthe estimates are of approximately the same size.
Finally, estimates referring to age and sex are usuallymore reliable than other similar estimates because theLFS sample is calibrated to post-censal populationprojections of various age and sex groupings.Continuing the previous example, persons employedpart-time in Alberta will have a larger samplingvariability than employed men aged 35 to 44 years inBritish Columbia although the estimates are of similarsize.
7.2.4 Variability of monthly estimates
To look up an approximate measure of the CV of anestimate of a monthly total, please consult table 7.1,which gives the size of the estimate as a functionof the geography and the CV. The rows give thegeographic area of the estimate, while the columnsindicate the resulting level of accuracy in terms of theCV, given the size of the estimate. To determine theCV for an estimate of size X in an area A, look acrossthe row for area A, find the first estimate that is lessthan or equal to X. Then the title of the column willgive the approximate CV. For example, to determinethe sampling error for an estimate of 33.3 thousandunemployed in Newfoundland and Labrador in
Statistics Canada – Catalogue no. 71-543-G 27

Guide to the Labour Force Survey
August 2012, we find the closest but smaller estimateof 25.0 thousand giving a CV of 5%. Therefore, theestimate of 33,300 unemployed in Newfoundland andLabrador has a CV of roughly 5%.
Table 7.1 is supplied as a rough guide to the samplingvariability. The sampling variability is modeled so that,given an estimate, approximately 75% of the actual CVswill be less than or equal to the CVs derived from thetable. There will, however, be 25% of the actual CVsthat will be somewhat higher than the ones given bythe table.
Table 7.1 can also be used with either seasonallyadjusted estimates, or with estimates that have notbeen seasonally adjusted. Studies have shown thatLFS standard errors for seasonally adjusted data areclose to those for unadjusted data.
The CV values given in table 7.1 are derivedfrom models based on LFS sample data forthe 48-month period from January 2009 throughDecember 2012 inclusive. It is important to bear inmind that these values are approximations.
7.2.5 Variability of annual estimates
To look up an approximate measure of the CV of anestimate of an annual average, please consult table7.2, which gives the size of the estimate as a functionof the geography and the CV. The rows give thegeographic level of the estimate, while the columnsindicate the resulting level of accuracy in terms of theCV, given the size of the estimate. To determine theCV for an estimate of size X in an area A, look acrossthe row for area A, find the first estimate that is less
than or equal to X. Then the title of the column willgive the approximate CV. For example, to determinethe sampling error for an annual average estimateof 32.8 thousand unemployed in Newfoundland andLabrador in 2012, we find the closest but smallerestimate of 19.0 thousand giving a CV of 2.5%.Therefore, the estimate of 32,800 unemployed inNewfoundland and Labrador has a CV of roughly 2.5%.
Table 7.2 is supplied as a rough guide to the samplingvariability. The sampling variability is modeled so that,given an estimate, approximately 75% of the actual CVswill be less than or equal to the CVs derived from thetable. There will, however, be 25% of the actual CVsthat will be somewhat higher than the ones given bythe table.
The CV values given in table 7.2 are derived from amodel based on LFS sample data for the 5-year periodfrom 2008 to 2012. It is important to bear in mind thatthese values are approximations.
7.2.6 Sampling variability tables for theterritories
The CV values for the three-month moving averagesgiven in table 7.3 for the Yukon and NorthwestTerritories are derived from models based onLFS sample data for the 48-month period ofJanuary 2009 through December 2012 inclusive.The CV values for the annual averages given in thesame table are derived from models based on LFSsample data for the 5-year period of 2008 to 2012 forthe Yukon and Northwest Territories. For Nunavut,they are based on LFS sample data for the 4-yearperiod of 2009 to 2012.
Table 7.1CVs for estimates of monthly totals for Canada and the provinces
Coefficient of variation
1.0% 2.5% 5.0% 7.5% 10.0% 16.5% 20.0% 25.0% 33.3%
Canada 1,268.1 374.5 162.8 94.7 54.8 29.6 21.3 15.5 10.9Newfoundland and Labrador 221.3 61.8 25.1 14.2 8.4 4.3 3.1 2.2 1.5Prince Edward Island 68.4 20.4 8.8 5.1 3.0 1.6 1.2 0.9 0.6Nova Scotia 223.9 67.4 29.8 17.5 10.1 5.6 4.0 2.9 2.1New Brunswick 200.3 59.3 25.7 15.0 8.7 4.7 3.4 2.5 1.7Quebec 1,097.4 317.4 135.1 77.8 45.1 24.0 17.2 12.5 8.7Ontario 1,282.5 366.4 154.6 88.6 51.0 27.0 19.3 13.9 9.6Manitoba 167.0 52.1 24.6 14.8 8.2 4.8 3.4 2.5 1.8Saskatchewan 166.6 51.0 23.5 14.0 7.8 4.4 3.2 2.3 1.7Alberta 559.6 173.3 81.5 49.0 27.0 15.6 11.1 8.1 5.9British Columbia 760.6 221.1 95.9 55.5 31.5 17.0 12.1 8.8 6.1
Note(s): Estimates are in thousands.
28 Statistics Canada – Catalogue no. 71-543-G
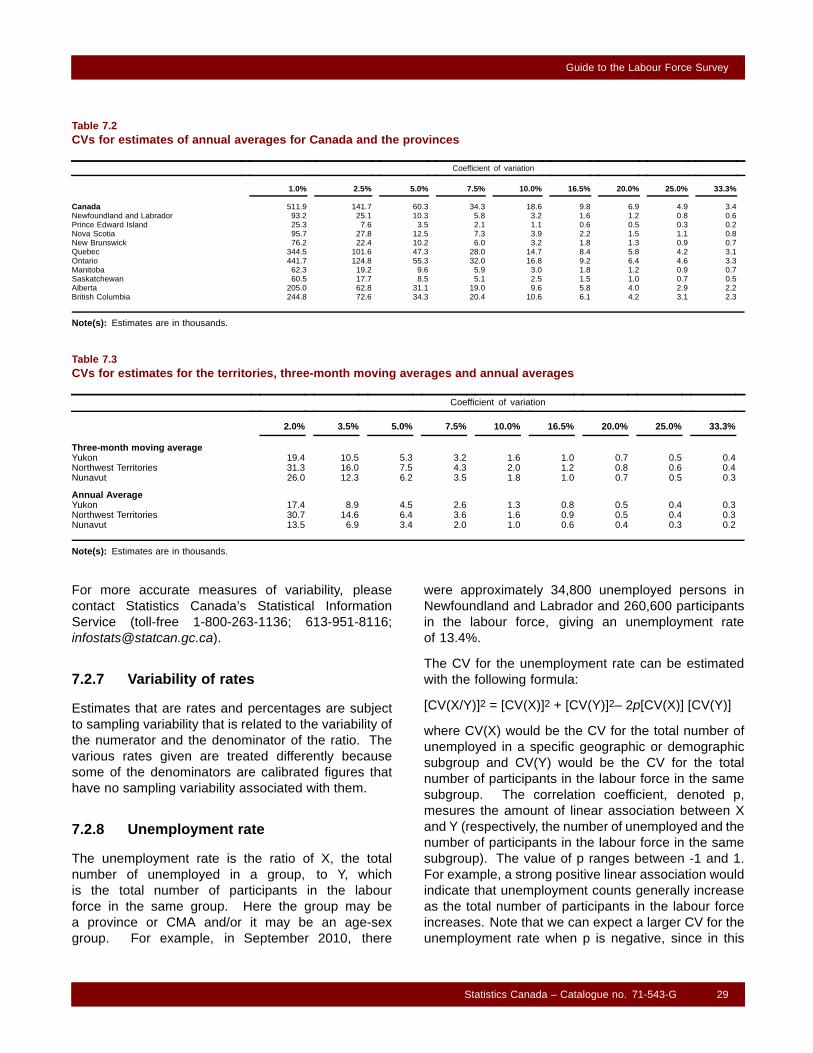
Guide to the Labour Force Survey
Table 7.2CVs for estimates of annual averages for Canada and the provinces
Coefficient of variation
1.0% 2.5% 5.0% 7.5% 10.0% 16.5% 20.0% 25.0% 33.3%
Canada 511.9 141.7 60.3 34.3 18.6 9.8 6.9 4.9 3.4Newfoundland and Labrador 93.2 25.1 10.3 5.8 3.2 1.6 1.2 0.8 0.6Prince Edward Island 25.3 7.6 3.5 2.1 1.1 0.6 0.5 0.3 0.2Nova Scotia 95.7 27.8 12.5 7.3 3.9 2.2 1.5 1.1 0.8New Brunswick 76.2 22.4 10.2 6.0 3.2 1.8 1.3 0.9 0.7Quebec 344.5 101.6 47.3 28.0 14.7 8.4 5.8 4.2 3.1Ontario 441.7 124.8 55.3 32.0 16.8 9.2 6.4 4.6 3.3Manitoba 62.3 19.2 9.6 5.9 3.0 1.8 1.2 0.9 0.7Saskatchewan 60.5 17.7 8.5 5.1 2.5 1.5 1.0 0.7 0.5Alberta 205.0 62.8 31.1 19.0 9.6 5.8 4.0 2.9 2.2British Columbia 244.8 72.6 34.3 20.4 10.6 6.1 4.2 3.1 2.3
Note(s): Estimates are in thousands.
Table 7.3CVs for estimates for the territories, three-month moving averages and annual averages
Coefficient of variation
2.0% 3.5% 5.0% 7.5% 10.0% 16.5% 20.0% 25.0% 33.3%
Three-month moving averageYukon 19.4 10.5 5.3 3.2 1.6 1.0 0.7 0.5 0.4Northwest Territories 31.3 16.0 7.5 4.3 2.0 1.2 0.8 0.6 0.4Nunavut 26.0 12.3 6.2 3.5 1.8 1.0 0.7 0.5 0.3
Annual AverageYukon 17.4 8.9 4.5 2.6 1.3 0.8 0.5 0.4 0.3Northwest Territories 30.7 14.6 6.4 3.6 1.6 0.9 0.5 0.4 0.3Nunavut 13.5 6.9 3.4 2.0 1.0 0.6 0.4 0.3 0.2
Note(s): Estimates are in thousands.
For more accurate measures of variability, pleasecontact Statistics Canada’s Statistical InformationService (toll-free 1-800-263-1136; 613-951-8116;[email protected]).
7.2.7 Variability of rates
Estimates that are rates and percentages are subjectto sampling variability that is related to the variability ofthe numerator and the denominator of the ratio. Thevarious rates given are treated differently becausesome of the denominators are calibrated figures thathave no sampling variability associated with them.
7.2.8 Unemployment rate
The unemployment rate is the ratio of X, the totalnumber of unemployed in a group, to Y, whichis the total number of participants in the labourforce in the same group. Here the group may bea province or CMA and/or it may be an age-sexgroup. For example, in September 2010, there
were approximately 34,800 unemployed persons inNewfoundland and Labrador and 260,600 participantsin the labour force, giving an unemployment rateof 13.4%.
The CV for the unemployment rate can be estimatedwith the following formula:
[CV(X/Y)]2 = [CV(X)]2 + [CV(Y)]2– 2p[CV(X)] [CV(Y)]
where CV(X) would be the CV for the total number ofunemployed in a specific geographic or demographicsubgroup and CV(Y) would be the CV for the totalnumber of participants in the labour force in the samesubgroup. The correlation coefficient, denoted p,mesures the amount of linear association between Xand Y (respectively, the number of unemployed and thenumber of participants in the labour force in the samesubgroup). The value of p ranges between -1 and 1.For example, a strong positive linear association wouldindicate that unemployment counts generally increaseas the total number of participants in the labour forceincreases. Note that we can expect a larger CV for theunemployment rate when p is negative, since in this
Statistics Canada – Catalogue no. 71-543-G 29

Guide to the Labour Force Survey
case, the third term on the right side of the equationabove becomes positive.
When p is not available, the most conservativeapproach is to take p = -1, which leads to the simplifiedformula:
CV(X/Y) = CV(X) + CV(Y)
Note that this will likely lead to an overestimation of theCV(X/Y).
In the previous example, the CVs of the monthlyestimates for the unemployment count and thetotal number of participants in the labour force inNewfoundland and Labrador are respectively 5%and 1.0% from Table 7.1. An approximation of the CVfor the unemployment rate of 13.4% using the aboveformula would be:
5.0% + 1.0% = 6.0%
7.2.9 Participation rate and employmentrate
The participation rate represents the number of personsin the labour force expressed as a percentage of thetotal population size. The employment rate is the totalnumber of employed divided by the total populationsize. For both the above rates, the numerator andthe denominator represent the same geographic anddemographic group.
For Canada, the provinces, CMAs and some age-sexgroups the LFS population estimates are not subjectto sampling variability because they are calibrated toindependent sources. Therefore, in the case of theparticipation rate and the employment rate of thesegeographic and demographic groups, the CV is equalto that of the contributing numerator.
Subgroups of Canada, the provinces and age-sexgroups are called domains; for example, personsemployed in agriculture in Manitoba are a domain. Todetermine the CV of rates in the case of domains, thevariability of both the numerator and the denominatorhave to be taken into account because the denominatoris no longer a controlled total and is subject tosampling variability. Therefore, for participation ratesand employment rates of domains, the CV can bedetermined similar to the unemployment rate. Thetotals in the numerator and denominator for the relevantrate should reflect the same domain or subgroup.
7.2.10 Variability of estimate of change
The difference of estimates from two time periodsgives an estimate of change that is also subject tosampling variability. An estimate of year-to-year ormonth-to-month change is based on two sampleswhich may have some households in common. Hence,the CV of change depends on the CV of the estimatesfor both periods and the sample overlap, p, betweenthe periods.
The value of p ranges between -1 and 1, with 1 beingthe perfect positive linear association. One cangenerally use the sample overlap to approximate thecorrelation coefficient as follows:
• For the provinces: use p = 5/6 for month-to-monthchanges, and p = 0 for year-to-year changes.
While the CV and the standard error are part ofthe same formula, the former is used to assess thevariability of the estimate levels, and the latter is usedto assess the variability of the difference between theseestimates. The standard error of the change betweenestimates can be derived from the following formula:
)(
)()(1)(
12
22
22
21
21
12YY
YCVYYCVYYYCV
−+
−=− ρ
where Y1 and Y2 are the estimates for the two periods.The value of p is the correlation coefficient between Y1and Y2.
When multiplying the CV obtained from this formulaby the estimate change (y2 - y1), we obtain thestandard error. (The CVs should be in decimals for thiscalculation.)
With the standard error, we can see which changes(differences between estimates) are statisticallysignificant and which are not. If the standard error ofy2 - y1 is higher than the value of y2 - y1, then the latteris not statistically significant.
Note: For the change between estimates (y2 - y1), theCVs can be very high and sometimes negative (whichis expected when y2 - y1 is negative).
Empirical studies at Statistics Canada have shownthat for the provinces, a p value equal to 5/6 is a goodapproximation for estimates of employment, but forestimates of unemployment, a p value of 0.45 wouldyield a better approximation for month-to-monthchanges.
30 Statistics Canada – Catalogue no. 71-543-G

Guide to the Labour Force Survey
When comparing the annual averages of two years,the CV of the annual estimates (table 7.2) shouldbe used. For month-to-month change, seasonallyadjusted estimates should be used in conjunction withthe CVs of the monthly estimates from table 7.1. Notethat the above formula gives approximate estimates ofthe sampling variability associated to an estimate ofchange.
7.2.11 Guidelines on data reliability
Household surveys within Statistics Canada generallyuse the following guidelines and reliability categoriesin interpreting CV values for data accuracy and in thedissemination of statistical information.
Category 1 - If the CV is ≤ 16.5% - no releaserestrictions: data are of sufficient accuracy that nospecial warnings to users or other restrictions arerequired.
Category 2 - If the CV is > 16.5% and ≤ 33.3% -release with caveats: data are potentially useful forsome purposes but should be accompanied by awarning to users regarding their accuracy.
Category 3 - If the CV > 33.3% - not recommendedfor release: data contain a level of error that makesthem so potentially misleading that they should notbe released in most circumstances. If users insist oninclusion of Category 3 data in a non-standard product,
even after being advised of their accuracy, the datashould be accompanied by a disclaimer. The usershould acknowledge the warnings given and undertakenot to disseminate, present or report the data, directlyor indirectly, without this disclaimer.
7.3 Release criteria
Statistics Canada is prohibited by law from releasingany data which would divulge information obtainedunder the Statistics Act that relates to any identifiableperson, business or organization without the priorknowledge or the consent in writing of that person,business or organization. Various confidentialityrules are applied to all data that are released orpublished to prevent the publication or disclosure ofany information deemed confidential. If necessary,data are suppressed to prevent direct or residualdisclosure of identifiable data.
The LFS produces a wide range of outputs that containestimates for various labour force characteristics. Mostof these outputs are estimates in the form of tabularcross-classifications. Estimates are rounded to thenearest hundred and a series of suppression rules areused so that any estimate below a minimum level isnot released.
The LFS suppresses estimates below the levelspresented in the table 7.4.
Table 7.4Minimum size for release, Canada, provinces and territories
Minimumsize forrelease
thousands
Canada 1.5Newfoundland and Labrador 0.5Prince Edward Island 0.2Nova Scotia 0.5New Brunswick 0.5Quebec 1.5Ontario 1.5Manitoba 0.5Saskatchewan 0.5Alberta 1.5British Columbia 1.5Yukon 0.2Northwest Territories 0.2Nunavut 0.2
Statistics Canada – Catalogue no. 71-543-G 31

Guide to the Labour Force Survey
Section 8
Comparing the Survey ofemployment, payrolls and hoursand the Labour Force SurveyStatistics Canada has two monthly programs thatmeasure employment levels and trends: the LabourForce Survey (LFS), referred to here as the householdsurvey, and the Survey of Employment, Payroll andHours (SEPH), referred to here as the payroll orestablishment survey.
The LFS provides the first timely picture of overalllabour market conditions, with total employment,unemployment and unemployment rate, as well asinformation on which groups of Canadians are mostaffected by changes in the labour market.
Approximately two months later, the SEPH providesadditional detail of the same month by industry, alongwith estimations of earnings and hours worked.
Statistics from both the household and businesspayroll surveys, along with those from the EmploymentInsurance program and the Job Vacancy program allcontribute to understanding the supply and demandcomponents of the labour market.
The household survey (LFS) provides a broader pictureof employment, including employment in agricultureand the number of self employed. The payroll survey(SEPH) provides a highly reliable gauge of monthlychange in non-farm payroll employment.
Because the LFS has a broader definition ofemployment than the SEPH, the LFS employment level(grey line in chart), exceeds the SEPH employmentlevel (red line).
Chart 8.1SEPH and LFS employment levels, January 2001 to December 2013, seasonally adjusted
12,000
13,000
14,000
15,000
16,000
17,000
18,000
D D D D D D D D D D D D D
SEPH LFS LFS adjusted to SEPH concepts
thousands
Source: Statistics Canada, Labour Force Survey (LFS) and Survey of Employment, Payroll and Hours (SEPH).
2001 200420032002 2008200720062005 2009 2010 2011 2012 2013
32 Statistics Canada – Catalogue no. 71-543-G

Guide to the Labour Force Survey
For comparability purposes, an adjusted LFS series(black line) was added to be more similar in conceptand definition to SEPH employment. This adjustedseries is created by subtracting agriculture, fishing andhunting employment, non-agricultural self-employed,unpaid family, and private household workers, andworkers absent without pay from their jobs, and thenadding non-agricultural wage and salary multiple jobholders.
The employee measure from the LFS tracks muchmore closely with the SEPH measure; nonetheless,
trend discrepancies occur occasionally. For example,during the 2008–2009 employment downturn, thedecline was more pronounced in the LFS than theSEPH.
Some of the discrepancies are attributable toconceptual and measurement differences between thetwo surveys. The major features and distinctions of thetwo surveys are shown below.
Table 8.1Features of Labour Force Survey (LFS) and Survey of Employment, Payrolls and Hours (SEPH)
Comparison by LFS SEPH
Population Non-institutionalized civilian population aged 15and over
Non-farm wage and salary jobs
Type of survey Monthly sample survey of approximately 56,000households
Monthly census of businesses (from administrative data),plus a survey of 15,000 establishments for the earnings.
Major outputs Labour force, employment, unemployment, byprovince, and associated rates with demographicdetails
Employment, earnings and hours with industry andgeographic details
Reference period Calendar week that includes the 15th of the month 1 Last pay period of the month 2
Employment concept Estimate of employed persons (multiple jobholdersare counted only once). Includes individuals absentfrom work without pay.
Number of jobs (multiple jobholders counted for eachnon-farm payroll job). Includes only those receiving payfor the reference period.
Employment definition differences Includes the unincorporated self-employed, unpaidfamily workers, agriculture, forestry, fishing andhunting, religious organization workers, privatehousehold workers, international and other extraterritorialpublic administration and workers absent without pay.
Excludes all of the groups listed in the column to theleft, except for forestry, logging and support activitiesfor forestry.
Size of month-to-month change inemployment for a statisticallysignificant movement
+/- 47,000 for 90% confidence (updated twice a year). Based on a census, so there is no statistical uncertaintyassociated with the employment estimates.
Benchmark adjustment to surveyresults
No direct benchmark for employment. Adjustment tounderlying population every 5 years to the CanadianCensus.
No benchmark adjustment.
1. Except for November and December, when the reference week is often one week earlier.2. In fact, there is a mix of different periods, since pay period lengths and dates vary between employers and even between groups of employees working for the
same employer. In all cases, the information for the most recent pay period is used in processing the administrative data.
Statistics Canada – Catalogue no. 71-543-G 33

Guide to the Labour Force Survey
8.1 Comparing employment trendsfrom the two surveys
The LFS is the only survey conducted by StatisticsCanada designed to provide the official unemploymentrate every month, with a monthly sample size ofapproximately 56,000 households. It is the earliestand most timely indicator of the pulse of the labourmarket in Canada. The sample size makes it a veryreliable source for different geographic levels. Itprovides a complete picture as it includes employees,self-employed people, as well as unemployed.Characteristics of all three groups, including age, sexand occupation are also available.
The SEPH, also a monthly survey, is designed toprovide data on payroll employment as well as average
earnings and hours worked. It is a census of all payrollemployees in Canada. Consequently, the SEPH doesnot survey the self-employed or the unemployed.However, the employment payrolls data are availableat a detailed industry level.
As mentioned earlier, SEPH and LFS estimates trackwell over the long term but discrepancies in trendsoccur occasionally. These discrepancies might bemore common for sub-groups, for example at theprovincial level or in a specific industry.
The following summarize some aspects to considerwhen comparing employment changes and trendsfrom the two sources of data.
Table 8.2Latest trends in SEPH and LFS employment
Referenceperiod
LFSemployment
AdjustedLFS
employment1
SEPHemployment
thousands, seasonally adjusted
Month-to-month change - November 2013 to December 2013 -44.0 2.9 -17.9Year-over-year change - December 2012 to December 2013 99.0 94.9 155.3Since the employment peak - October 2008 to December 2013 592.8 581.2 530.9Since the employment trough - July 2009 to December 2013 1024.1 1010.3 851.7
1. This is an internal series created from LFS employment to be more similar in concepts and definition to the SEPH employment. LFS employment is adjusted bysubtracting agriculture and related employment, non-agricultural self-employed, unpaid family and private household workers, and workers absent without payfrom their jobs, and then adding non-agricultural wage and salary multiple-job holders.
34 Statistics Canada – Catalogue no. 71-543-G

Guide to the Labour Force Survey
8.2 Sampling error in the LFS
The LFS is subject to sampling and non-samplingerror. While it is one of the largest sample surveysinternationally, reaching 56,000 households, it covers asmall portion of all employed persons. When looking atshort-term trends, especially over-the-month changes,it is therefore essential to assess the statisticalsignificance of the change.
Employment estimates from the SEPH, as they arederived from all the administrative payroll deductionforms submitted by employers to the Canada RevenueAgency, are not subject to sampling error. They are,however, subject to non-sampling error.
8.3 Worker classification in the LFS
An adjusted LFS employment series was created tobe more similar in concept and definition to the SEPHemployment series, as featured in Chart 8.1. Thisadjusted series is calculated by subtracting: agricultureand related employment; unpaid family and privatehousehold workers; workers absent without pay fromtheir job; military reservists; and adding wage andsalary multiple jobholders whose second job is eitheras an employee or as an incorporated self-employedwith employees. For the SEPH, employment data fromthe three northern territories are removed to make itcomparable to the LFS.
This adjustment process also has some limitations.For example, some independent contractors in LFSmay have mistakenly reported themselves as wageand salary workers, rather than self-employed. Thiscould lead to some overstatement in the adjusted LFSemployment estimates. Separately, the adjustment formultiple jobholders adds the number of workers whoseprimary job is non-agricultural wage and salary, but notnecessarily their secondary job. However, there areno adjustments to account for the number of multiplejobholders with three or more jobs; the adjustmentprocess presumes all multiple jobholders only hold twojobs. This introduces some understatement into theadjusted household survey employment. These typesof worker classifications issues limit the ability to fullyreconcile the two employment measures.
8.4 ‘Off the books’ employment
Workers may be working for pay but not necessarilydeclared in the SEPH (for example, ‘off-the-books’employment). The LFS could possibly include some ofthese workers, but it is not possible to determine theextent to which they might be reflected in the surveyestimates.
8.5 Estimates by province
Estimates from the LFS are based on where peopleusually reside. However, the SEPH counts employeesin the province or territory where they work. This doesnot affect comparability at the national level, but cancreate differences at the provincial/territorial level.
8.6 Payroll estimates and detailedindustry data
New businesses are included in the Statistics CanadaBusiness Register, which is used by the SEPH toobtain the industry information. However, there can bedelays before all new businesses are classified, whichcan mean temporary under-reporting in some of thedetailed industries data. Also, the Business Registerregularly reviews and updates the industry andprovincial classification of current establishments. Thiscan cause changes to employment levels of updatedindustries, not reflecting real growth or decline.
Employment industry data available from thehousehold survey are based on information providedby survey respondents when asked about the detailedcharacteristics of their employment. That informationis then processed, and an industrial classification codeis assigned by Statistics Canada.
8.7 Release schedule differences
The LFS interviews take place over the 10 daysimmediately following the reference week. Thisis followed by 9 days of processing and analysis,enabling the release of the estimates 19 days after theSaturday of the reference week. The release usuallytakes place the first Friday of the month.
Statistics Canada – Catalogue no. 71-543-G 35
Guide to the Labour Force Survey
Businesses have until the 15th of the following monthto file data from the last pay period of the referencemonth to the Canada Revenue Agency. These data,or approximately 1 million records, are provided toStatistics Canada at the beginning of the next month, orfive weeks after the reference period. This is followedby three and a half weeks of processing and analysis,bringing the release to eight and a half weeks after thereference period.
8.8 Revision schedule
Estimates from both surveys are revised accordingto different schedules. While this does not impactthe overall trends, it could affect the month-to-monthchange.
The seasonally adjusted LFS estimates are revisedyearly, going back three years and are publishedaround the end of January. Every five years, all theLFS estimates are revised historically over a longer
time span. At that time, population controls areupdated according to the latest census populationprojections, the latest classifications for industry,occupation and geography, and when seasonal factorsare updated. This exercise is called rebasing. Thenext LFS rebasing is scheduled for January 2015.
With the SEPH, monthly estimates are revised themonth after the estimates are first publicly released.So, for example, when estimates for May are released,estimates for April are revised.
Every year, at the end of March, the SEPH estimatesundergo a historical revision. The span and thebreadth of the revisions vary depending on theyear. The revisions to specific industries sometimesgo back as far as 2001; they can include updatesto new classification systems (e.g., moving fromNAICS 2007 to NAICS 2012), or sometimes will spanonly a few years, with minimal changes. At the sametime, seasonally adjusted data are revised back threeyears.
36 Statistics Canada – Catalogue no. 71-543-G

Guide to the Labour Force Survey
Section 9
Products and ServicesA broad range of tabulated data compiled from theLabour Force Survey (LFS) is contained in regularpublications and CANSIM (Statistics Canada’s on-lineelectronic database). Analytical articles based on LFSdata frequently appear in popular Statistics Canadaflagship publications listed below. However, the wealthof information that can be extracted from the survey,and the variety of questions that can be addressed,are far too vast for regular publication. In order tomeet particular analytical needs, and address issuesof current interest, the survey provides a customtabulation service on a cost-recovery basis. A publicuse microdata file is also available for clients wishingto do their own data extractions and analyses.
9.1 Catalogued publications
Monthly: Labour Force Information (catalogue no.71-001-X)
This publication is available at 8:30 a.m. on the dayof each monthly release. It contains an analysis ofthe latest labour market developments in the contextof recent trends, charts of major data series, and tablesof indicators for main demographic groups, industries,provincial and sub-provincial areas.
The timeliness and analytical content of this publicationcontribute to its popularity and use by the media,government, research institutions, and others whoneed quick reference to the latest labour markettrends. An Internet version available in PDF or HTMLon the Statistics Canada website (www.statcan.gc.ca)ensures timely delivery.
The analytical commentary contained in this publicationalso appears electronically on the Statistics Canadawebsite ( www.statcan.gc.ca) in "The Daily", then select"Labour Force Survey" under "Releases". It is updatedat 8:30 a.m. on the day of each monthly release.
Occasional: Labour Statistics: Research Papers(catalogue no. 75-004-M)
The papers in this series cover a variety of topics relatedto labour statistics. These more in-depth studies areintended to showcase recent or historical trends in thelabour market using data from Labour Statistics Divisionsurveys as well as other Statistics Canada sources.
Occasional: Insights on Canadian Society(catalogue no. 75-006-X)
This publication brings together and analyzes a widerange of data sources in order to provide informationon various aspects of Canadian society, includinglabour, income, education, social, and demographicissues, that affect the lives of Canadians. Thispublication replaces Perspectives on Labour andIncome (catalogue no. 75-001-X).
Monthly and quarterly: Perspectives on Labour andIncome (catalogue no. 75-001-X)
This publication brings together and analyzes a widerange of labour and income data. It covers topicssuch as youth in the labour market, pensions andretirement, work arrangements, education and training,and trends in the family income, to name a few. Thispublication also devotes sections to new products,surveys, research projects, conferences, and selecteddata from our extensive database of labour andincome statistical indicators. Statistics Canada hasdiscontinued Perspectives on Labour and Income.The last online edition of Perspectives was released inAugust 2012 and the last print edition was released onJune 14, 2012.
Monthly: Microdata File (catalogue no. 71M0001X)
This public use microdata file contains non-aggregateddata for a wide variety of variables collected fromthe Labour Force Survey (LFS). This product isfor users who prefer to do their own analysis byfocusing on specific subgroups in the populationor by cross-classifying variables that are not in ourcatalogued products.
Statistics Canada – Catalogue no. 71-543-G 37
Guide to the Labour Force Survey
This file contains both personal characteristics for allindividuals in the household and detailed labour forcecharacteristics for household members 15 years ofage and over. See section 3 of this publication fora detailed list of the variables in this product. Thesevariables are available by province and for the threelargest census metropolitan areas (Montreal, Toronto,Vancouver). This is a monthly file, and is availablegoing back to 1976.
Also included is the Labour Force Survey MicrodataUser Guide - which has been produced to facilitatethe manipulation of the microdata file of the survey.This guide provides detailed information coveringsuch topics as concepts and definitions; surveymethodology; data collection; data processing; dataquality; guidelines for tabulation, analysis and release;sampling variability tables and weighting. In addition,the questionnaire and record layouts for both thePublic Use Microdata File (PUMF) and the ConfidentialMaster File are included.
Occasional: Improvements to the Labour ForceSurvey (LFS) (catalogue no. 71F0031X)
This paper introduces and explains modifications madeto the Labour Force Survey estimates.
Occasional: Aboriginal Peoples Living Off-reservein Western Canada: Estimates from the LabourForce Survey (catalogue no. 71-587-X)
This paper provides information on Aboriginalemployment and unemployment, Aboriginal youths andthe impact of education on labour market performancein Manitoba, Saskatchewan, Alberta and BritishColumbia.
Occasional: The Aboriginal Labour Force AnalysisSeries (catalogue no. 71-588-X)
This series of analytical reports provides an overviewof the labour market conditions among the Aboriginaloff-reserve populations, based on estimates from theLabour Force Survey. These reports examine theAboriginal labour force characteristics by Aboriginalidentity, as well as diverse socio-economic andemployment characteristics.
Occasional: The Immigrant Labour Force AnalysisSeries (catalogue no. 71-606-X)
This series of analytical reports provides an overviewof the Canadian labour market experiences ofimmigrants to Canada, based on data from theLabour Force Survey. These reports examine thelabour force characteristics of immigrants, by reportingon employment and unemployment at the Canadalevel, for the provinces and large metropolitan areas.They also provide more detailed analysis by regionof birth, as well as in-depth analysis of other specificaspects of the immigrant labour market.
Occasional: Methodology of the Canadian LabourForce Survey (catalogue no. 71-526-X)
This publication offers an in-depth look at themethodological and operational aspects of the LFS,covering stratification, sampling, survey operations,weighting, estimation and data quality. This documentwould be of interest to those who would like morein-depth methodological information on the LabourForce Survey than provided by the Guide to the LabourForce Survey.
CANSIM
A large selection of high-demand LFS monthlyand annual average time series is available fromCANSIM, Statistics Canada’s electronic onlinedatabase (http://cansim2.statcan.gc.ca/ ). (Tables282-0001 to 282-0042, 282-0047 to 282-0051,282-0054, 282-0055, 282-0060 to 282-0063, 282-0069to 282-0089, 282-0092 to 282-0095, 282-0100 to282-0121 and 282-0200 to 282-0225.) See theRelated products section for a complete listing.
Custom tabulations
Custom tabulations can be arranged on an ad hoc orregular basis for a fee. This service enables usersto specify tables and time series to meet their ownrequirements. For example, users may wish to havelabour force estimates for age groups or educationallevels that differ from those used in LFS publications.Subject matter and tabulation expertise is also providedto ensure that the customized data package is accurateand appropriate.
38 Statistics Canada – Catalogue no. 71-543-G

Guide to the Labour Force Survey
Data tables
Each month, on the release day of LFS data, selectedtables (in HTML) are updated on the StatisticsCanada website http://www.statcan.gc.ca/, under the"Browse by Subject" tab, select "Labour", then select"Employment and unemployment, and then select"Summary tables".
General inquiries
For inquiries on any of these products and services,contact Statistics Canada’s Statistical InformationService (toll-free 1-800-263-1136; 613-951-8116;[email protected]).
Statistics Canada – Catalogue no. 71-543-G 39

Guide to the Labour Force Survey
Related productsSelected publications from Statistics Canada
71-001-X Labour Force Information
71-222-X The Canadian Labour Market at a Glance (2003, 2005, 2007)
71-526-X Methodology of the Canadian Labour Force Survey
71-544-X Labour Force Survey Products and Services
71-587-X Aboriginal Peoples Living Off-reserve in Western Canada: Estimates from the LabourForce Survey
71-588-X The Aboriginal Labour Force Analysis Series
71-606-X The Immigrant Labour Force Analysis Series
71F0031X Improvements to the Labour Force Survey (LFS)
71M0001X Labour Force Survey Microdata File
75-001-X Perspectives on Labour and Income (from 1989 to 2012)
75-004-M Labour Statistics: Research Papers
75-006-X Insight on Canadian Society
Selected CANSIM tables from Statistics Canada
282-0001 Labour force survey estimates (LFS), by sex and detailed age group, unadjusted forseasonality, monthly
282-0002 Labour force survey estimates (LFS), by sex and detailed age group, annual
282-0003 Labour force survey estimates (LFS), by educational attainment, sex and age group,unadjusted for seasonality, monthly
282-0004 Labour force survey estimates (LFS), by educational attainment, sex and age group,annual
282-0005 Labour force survey estimates (LFS), by full- and part-time students during school months,sex and age group, unadjusted for seasonality, monthly
282-0006 Labour force survey estimates (LFS), by students during summer months, sex and agegroup, unadjusted for seasonality, monthly
40 Statistics Canada – Catalogue no. 71-543-G
Guide to the Labour Force Survey
282-0007 Labour force survey estimates (LFS), by North American Industry Classification System(NAICS), sex and age group, unadjusted for seasonality, monthly
282-0008 Labour force survey estimates (LFS), by North American Industry Classification System(NAICS), sex and age group, annual
282-0009 Labour force survey estimates (LFS), by National Occupational Classification for Statistics(NOC-S) and sex, unadjusted for seasonality, monthly
282-0010 Labour force survey estimates (LFS), by National Occupational Classification for Statistics(NOC-S) and sex, annual
282-0011 Labour force survey estimates (LFS), employment by class of worker, North AmericanIndustry Classification System (NAICS) and sex, unadjusted for seasonality, monthly
282-0012 Labour force survey estimates (LFS), employment by class of worker, North AmericanIndustry Classification System (NAICS) and sex, annual
282-0013 Labour force survey estimates (LFS), part-time employment by reason for part-time work,sex and age group, unadjusted for seasonality, monthly
282-0014 Labour force survey estimates (LFS), part-time employment by reason for part-time work,sex and age group, annual
282-0015 Labour force survey estimates (LFS), by usual hours worked, main or all jobs, sex andage group, unadjusted for seasonality, monthly
282-0016 Labour force survey estimates (LFS), by usual hours worked, main or all jobs, sex andage group, annual
282-0017 Labour force survey estimates (LFS), by actual hours worked, main or all jobs, sex andage group, unadjusted for seasonality, monthly
282-0018 Labour force survey estimates (LFS), by actual hours worked, main or all jobs, sex andage group, annual
282-0019 Labour force survey estimates (LFS), by usual hours worked, class of worker, NorthAmerican Industry Classification System (NAICS) and sex, unadjusted for seasonality,monthly
282-0020 Labour force survey estimates (LFS), by usual hours worked, class of worker, NorthAmerican Industry Classification System (NAICS) and sex, annual
282-0021 Labour force survey estimates (LFS), by actual hours worked, class of worker, NorthAmerican Industry Classification System (NAICS) and sex, unadjusted for seasonality,monthly
282-0022 Labour force survey estimates (LFS), by actual hours worked, class of worker, NorthAmerican Industry Classification System (NAICS) and sex, annual
282-0023 Labour force survey estimates (LFS), by usual hours worked, class of worker, NationalOccupational Classification for Statistics (NOC-S) and sex, unadjusted for seasonality,monthly
Statistics Canada – Catalogue no. 71-543-G 41

Guide to the Labour Force Survey
282-0024 Labour force survey estimates (LFS), by usual hours worked, class of worker, NationalOccupational Classification for Statistics (NOC-S) and sex, annual
282-0025 Labour force survey estimates (LFS), by actual hours worked, class of worker, NationalOccupational Classification for Statistics (NOC-S) and sex, unadjusted for seasonality,monthly
282-0026 Labour force survey estimates (LFS), by actual hours worked, class of worker, NationalOccupational Classification for Statistics (NOC-S) and sex, annual
282-0027 Labour force survey estimates (LFS), by total and average usual and actual hours worked,main or all jobs, type of work, sex and age group, unadjusted for seasonality, monthly
282-0028 Labour force survey estimates (LFS), by total and average usual and actual hours worked,main or all jobs, type of work, sex and age group, annual
282-0029 Labour force survey estimates (LFS), average days lost for personal reasons per full-timeemployee by North American Industry Classification System (NAICS), sex and age group,annual
282-0030 Labour force survey estimates (LFS), average days lost for personal reasons per full-timeemployee by National Occupational Classification for Statistics (NOC-S), sex and agegroup, annual
282-0031 Labour force survey estimates (LFS), multiple jobholders by North American IndustryClassification System (NAICS), sex and age group, annual
282-0032 Labour force survey estimates (LFS), multiple jobholders by North American IndustryClassification System (NAICS), sex and age group, unadjusted for seasonality, monthly
282-0033 Labour force survey estimates (LFS), multiple jobholders by National OccupationalClassification for Statistics (NOC-S), sex and age group, unadjusted for seasonality,monthly
282-0034 Labour force survey estimates (LFS), multiple jobholders by National OccupationalClassification for Statistics (NOC-S), sex and age group, annual
282-0035 Labour force survey estimates (LFS), multiple jobholders by usual hours worked at mainand all jobs, unadjusted for seasonality, monthly
282-0036 Labour force survey estimates (LFS), multiple jobholders by usual hours worked at mainand all jobs, annual
282-0037 Labour force survey estimates (LFS), job tenure by type of work, sex and age group,unadjusted for seasonality, monthly
282-0038 Labour force survey estimates (LFS), job tenure by type of work, sex and age group,annual
282-0039 Labour force survey estimates (LFS), job tenure by National Occupational Classificationfor Statistics (NOC-S) and sex, unadjusted for seasonality, monthly
282-0040 Labour force survey estimates (LFS), job tenure by National Occupational Classificationfor Statistics (NOC-S) and sex, annual
42 Statistics Canada – Catalogue no. 71-543-G

Guide to the Labour Force Survey
282-0041 Labour force survey estimates (LFS), job tenure by North American Industry ClassificationSystem (NAICS) and sex, unadjusted for seasonality, monthly
282-0042 Labour force survey estimates (LFS), job tenure by North American Industry ClassificationSystem (NAICS) and sex, annual
282-0047 Labour force survey estimates (LFS), duration of unemployment by sex and age group,unadjusted for seasonality, monthly
282-0048 Labour force survey estimates (LFS), duration of unemployment by sex and age group,annual
282-0049 Labour force survey estimates (LFS), unemployment by type of work sought and searchmethod, sex and age group, unadjusted for seasonality, monthly
282-0050 Labour force survey estimates (LFS), unemployment by type of work sought and searchmethod, sex and age group, annual
282-0051 Labour force survey estimates (LFS), retirement age by class of worker and sex, annual
282-0054 Labour force survey estimates (LFS), by provinces and economic regions basedon 2006 Census boundaries, 3-month moving average, unadjusted for seasonality,monthly
282-0055 Labour force survey estimates (LFS), by provinces, territories and economic regionsbased on 2006 Census boundaries, annual
282-0060 Labour force survey estimates (LFS), employment by economic region and NorthAmerican Industry Classification System (NAICS), 3-month moving average, unadjustedfor seasonality, monthly
282-0061 Labour force survey estimates (LFS), employment by economic region and NorthAmerican Industry Classification System (NAICS), annual
282-0062 Labour force survey estimates (LFS), employment by economic region and NationalOccupational Classification for Statistics (NOC-S), 3-month moving average, unadjustedfor seasonality, monthly
282-0063 Labour force survey estimates (LFS), employment by economic region and NationalOccupational Classification for Statistics (NOC-S), annual
282-0069 Labour force survey estimates (LFS), wages of employees by type of work, NationalOccupational Classification for Statistics (NOC-S), sex and age group, unadjusted forseasonality, monthly
282-0070 Labour force survey estimates (LFS), wages of employees by type of work, NationalOccupational Classification for Statistics (NOC-S), sex and age group, annual
282-0071 Labour force survey estimates (LFS), wages of employees by type of work, NorthAmerican Industry Classification System (NAICS), sex and age group, unadjusted forseasonality, monthly
282-0072 Labour force survey estimates (LFS), wages of employees by type of work, NorthAmerican Industry Classification System (NAICS), sex and age group, annual
Statistics Canada – Catalogue no. 71-543-G 43

Guide to the Labour Force Survey
282-0073 Labour force survey estimates (LFS), wages of employees by job permanence, unioncoverage, sex and age group, unadjusted for seasonality, monthly
282-0074 Labour force survey estimates (LFS), wages of employees by job permanence, unioncoverage, sex and age group, annual
282-0075 Labour force survey estimates (LFS), employees by establishment size, North AmericanIndustry Classification System (NAICS), sex and age group, unadjusted for seasonality,monthly
282-0076 Labour force survey estimates (LFS), employees by establishment size, North AmericanIndustry Classification System (NAICS), sex and age group, annual
282-0077 Labour force survey estimates (LFS), employees by union coverage, North AmericanIndustry Classification System (NAICS), sex and age group, unadjusted for seasonality,monthly
282-0078 Labour force survey estimates (LFS), employees by union coverage, North AmericanIndustry Classification System (NAICS), sex and age group, annual
282-0079 Labour force survey estimates (LFS), employees by job permanency, North AmericanIndustry Classification System (NAICS), sex and age group, unadjusted for seasonality,monthly
282-0080 Labour force survey estimates (LFS), employees by job permanency, North AmericanIndustry Classification System (NAICS), sex and age group, annual
282-0081 Labour force survey estimates (LFS), employees working overtime (weekly) by NationalOccupational Classification for Statistics (NOC-S), sex and age group, unadjusted forseasonality, monthly
282-0082 Labour force survey estimates (LFS), employees working overtime (weekly) by NationalOccupational Classification for Statistics (NOC-S), sex and age group, annual
282-0083 Labour force survey estimates (LFS), employees working overtime (weekly) by NorthAmerican Industry Classification System (NAICS), sex and age group, unadjusted forseasonality, monthly
282-0084 Labour force survey estimates (LFS), employees working overtime (weekly) by NorthAmerican Industry Classification System (NAICS), sex and age group, annual
282-0085 Labour force survey estimates (LFS), supplementary unemployment rates by sex and agegroup, unadjusted for seasonality, monthly
282-0086 Labour force survey estimates (LFS), supplementary unemployment rates by sex and agegroup, annual
282-0087 Labour force survey estimates (LFS), by sex and age group, seasonally adjusted andunadjusted, monthly
282-0088 Labour force survey estimates (LFS), employment by North American IndustryClassification System (NAICS), seasonally adjusted and unadjusted, monthly
282-0089 Labour force survey estimates (LFS), employment by class of worker and sex, seasonallyadjusted and unadjusted, monthly
44 Statistics Canada – Catalogue no. 71-543-G

Guide to the Labour Force Survey
282-0092 Labour force survey estimates (LFS), actual hours worked by North American IndustryClassification System (NAICS), seasonally adjusted, monthly
282-0093 Labour force survey estimates (LFS), employment by National Occupational Classificationfor Statistics (NOC-S), seasonally adjusted, monthly
282-0094 Labour force survey estimates (LFS), by North American Industry Classification System(NAICS), Canada, seasonally adjusted, monthly
282-0095 Labour force survey estimates (LFS), by full- and part-time students during school months,sex and age group, annual
282-0100 Labour force survey estimates (LFS), by territories, sex and age group, 3-month movingaverage, seasonally adjusted and unadjusted, monthly
282-0101 Labour force survey estimates (LFS), by immigrant status, age group, Canada, regions,provinces and Montreal, Toronto, Vancouver census metropolitan areas, 3-month movingaverage, unadjusted for seasonality, monthly
282-0102 Labour force survey estimates (LFS), by immigrant status, age group, Canada, regions,provinces and Montreal, Toronto, Vancouver census metropolitan areas, annual
282-0103 Labour force survey estimates (LFS), by immigrant status, sex and detailed age group,Canada, 3-month moving average, unadjusted for seasonality, monthly
282-0104 Labour force survey estimates (LFS), by immigrant status, sex and detailed age group,Canada, annual
282-0105 Labour force survey estimates (LFS), by immigrant status, educational attainment, sexand age group, Canada, 3-month moving average, unadjusted for seasonality, monthly
282-0106 Labour force survey estimates (LFS), by immigrant status, educational attainment, sexand age group, Canada, annual
282-0107 Labour force survey estimates (LFS), by immigrant status, country of birth, sex and agegroup, Canada, 3-month moving average, unadjusted for seasonality, monthly
282-0108 Labour force survey estimates (LFS), by immigrant status, country of birth, sex and agegroup, Canada, annual
282-0109 Labour force survey estimates (LFS), by census metropolitan area based on 2006 censusboundaries, sex and age group, 3-month moving average, unadjusted for seasonality,monthly
282-0110 Labour force survey estimates (LFS), by census metropolitan area based on 2006 censusboundaries, sex and age group, annual
282-0111 Labour force survey estimates (LFS), employment by census metropolitan area basedon 2006 census boundaries and North American Industry Classification System(NAICS), 3-month moving average, unadjusted for seasonality, monthly
282-0112 Labour force survey estimates (LFS), employment by census metropolitan area basedon 2006 census boundaries and North American Industry Classification System (NAICS),annual
Statistics Canada – Catalogue no. 71-543-G 45
Guide to the Labour Force Survey
282-0113 Labour force survey estimates (LFS), employment by census metropolitan area basedon 2006 census boundaries and National Occupational Classification for Statistics(NOC-S), 3-month moving average, unadjusted for seasonality, monthly
282-0114 Labour force survey estimates (LFS), employment by census metropolitan area basedon 2006 census boundaries and National Occupational Classification for Statistics(NOC-S), annual
282-0115 Labour force survey estimates (LFS), by selected census agglomerations basedon 2006 census boundaries, annual
282-0116 Labour force survey estimates (LFS), by census metropolitan area based on 2006 censusboundaries, 3-month moving average, seasonally adjusted and unadjusted, monthly
282-0117 Labour force survey estimates (LFS), by Montréal, Toronto and Vancouver censusmetropolitan areas based on 2006 census boundaries, seasonally adjusted andunadjusted, monthly
282-0118 Labour force survey estimates (LFS), by urban and rural areas based on 2006 censusboundaries, sex and age group, unadjusted for seasonality, monthly
282-0119 Labour force survey estimates (LFS), by urban and rural areas based on 2006 censusboundaries, sex and age group, annual
282-0120 Labour force survey estimates (LFS), employment by urban and rural areas basedon 2006 census boundaries, class of worker and North American Industry ClassificationSystem (NAICS), unadjusted for seasonality, monthly
282-0121 Labour force survey estimates (LFS), employment by urban and rural areas basedon 2006 census boundaries, class of worker and North American Industry ClassificationSystem (NAICS), annual
282-0200 Labour force survey estimates (LFS), weekly wage distributions of employees by type ofwork, North American Industry Classification System (NAICS) and sex, unadjusted forseasonality, monthly
282-0201 Labour force survey estimates (LFS), weekly wage distributions of employees by type ofwork, North American Industry Classification System (NAICS) and sex, annual
282-0202 Labour force survey estimates (LFS), weekly wage distributions of employees by type ofwork, National Occupational Classification for Statistics (NOC-S) and sex, unadjusted forseasonality, monthly
282-0203 Labour force survey estimates (LFS), weekly wage distributions of employees by type ofwork, National Occupational Classification for Statistics (NOC-S) and sex, annual
282-0204 Labour force survey estimates (LFS), hourly wage distributions of employees by type ofwork, North American Industry Classification System (NAICS) and sex, unadjusted forseasonality, monthly
282-0205 Labour force survey estimates (LFS), hourly wage distributions of employees by type ofwork, North American Industry Classification System (NAICS) and sex, annual
46 Statistics Canada – Catalogue no. 71-543-G

Guide to the Labour Force Survey
282-0206 Labour force survey estimates (LFS), hourly wage distribution of employees by type ofwork, National Occupational Classification for Statistics (NOC-S) and sex, unadjusted forseasonality, monthly
282-0207 Labour force survey estimates (LFS), hourly wage distribution of employees by type ofwork, National Occupational Classification for Statistics (NOC-S) and sex, annual
282-0208 Labour force survey estimates (LFS), by educational degree, sex and age group,unadjusted for seasonality, monthly
282-0209 Labour force survey estimates (LFS), by educational degree, sex and age group, annual
282-0210 Labour force survey estimates (LFS), by family type and family age composition,unadjusted for seasonality, monthly
282-0211 Labour force survey estimates (LFS), by family type and family age composition, annual
282-0212 Labour force survey estimates (LFS), hours lost by employees by reason absent full andpart week and sex, unadjusted for seasonality, monthly
282-0213 Labour force survey estimates (LFS), hours lost by employees by reason absent full andpart week and sex, annual
282-0214 Labour force survey estimates (LFS), activity prior to unemployment by sex and age group,unadjusted for seasonality, monthly
282-0215 Labour force survey estimates (LFS), activity prior to unemployment, by sex and agegroup, annual
282-0216 Labour force survey estimates (LFS), reason for leaving job during previous year by sexand age group, unadjusted for seasonality, monthly
282-0217 Labour force survey estimates (LFS), reason for leaving job during previous year by sexand age group, annual
282-0218 Labour force survey estimates (LFS), reason for not looking for work, by sex and agegroup, unadjusted for seasonality, monthly
282-0219 Labour force survey estimates (LFS), reason for not looking for work, by sex and agegroup, annual
282-0220 Labour Force Survey estimates (LFS), employees by union status, sex and age group,Canada and provinces, annual
282-0221 Labour Force Survey estimates (LFS), employees by union status, sex, age group andeducation level, Canada, annual
282-0222 Labour Force Survey estimates (LFS), employees by union status and NationalOccupational Classification (NOC-S), Canada, annual
282-0223 Labour Force Survey estimates (LFS), employees by union status, North AmericanIndustry Classification System (NAICS) and sex, Canada, annual
282-0224 Labour Force Survey estimates (LFS), employees by union status, establishment size,job tenure, type of work and job permanency, Canada, annual
Statistics Canada – Catalogue no. 71-543-G 47

Guide to the Labour Force Survey
282-0225 Labour Force Survey estimates (LFS), average weekly earnings, average hourly wagerate and average usual weekly hours by union status and type of work, Canada andprovinces, annual
Selected surveys from Statistics Canada
3701 Labour Force Survey
Selected summary tables from Statistics Canada
• Labour force characteristics
• Employment by industry
• Days lost per worker due to illness or disability, by sex, by province
• Economic indicators, by province and territory (monthly and quarterly)
• Labour force and participation rates by sex and age group
• Labour force, employment and unemployment, levels and rates, by province
• Employment by industry and sex
• Full-time and part-time employment by sex and age group
• Labour force characteristics by age and sex
• Distribution of employed people, by industry, by province
• Labour force characteristics, population 15 years and older, by census metropolitan area
• Labour force characteristics, population 15 years and older, by economic region, by province
• Days lost per worker by reason, by provinces
• Days lost per worker by industry and sex
• People employed, by educational attainment
• Reasons for part-time work by sex and age group
• Self-employment, historical summary
• Employment by age, sex, type of work, class of worker and province (monthly)
• Employment by major industry group, seasonally adjusted, by province (monthly)
48 Statistics Canada – Catalogue no. 71-543-G

Guide to the Labour Force Survey
• Actual hours worked per week by industry, seasonally adjusted (monthly)
• Average hourly wages of employees by selected characteristics and occupation, unadjusted data, by province(monthly)
• Labour force characteristics, seasonally adjusted, by province (monthly)
• Labour force characteristics, unadjusted, by province (monthly)
• Labour force characteristics, seasonally adjusted, by census metropolitan area (3 month moving average)
• Labour force characteristics, unadjusted, by census metropolitan area (3 month moving average)
• Labour force characteristics, unadjusted, by economic region (3 month moving average)
• Labour force characteristics by immigrant status of population aged 25 to 54, by province
• Labour force characteristics by immigrant status of population aged 25 to 54, by educational attainment
• Labour force characteristics by immigrant status, by detailed age group
• Labour force characteristics by immigrant status of population aged 25 to 54, by country of birth
Statistics Canada – Catalogue no. 71-543-G 49
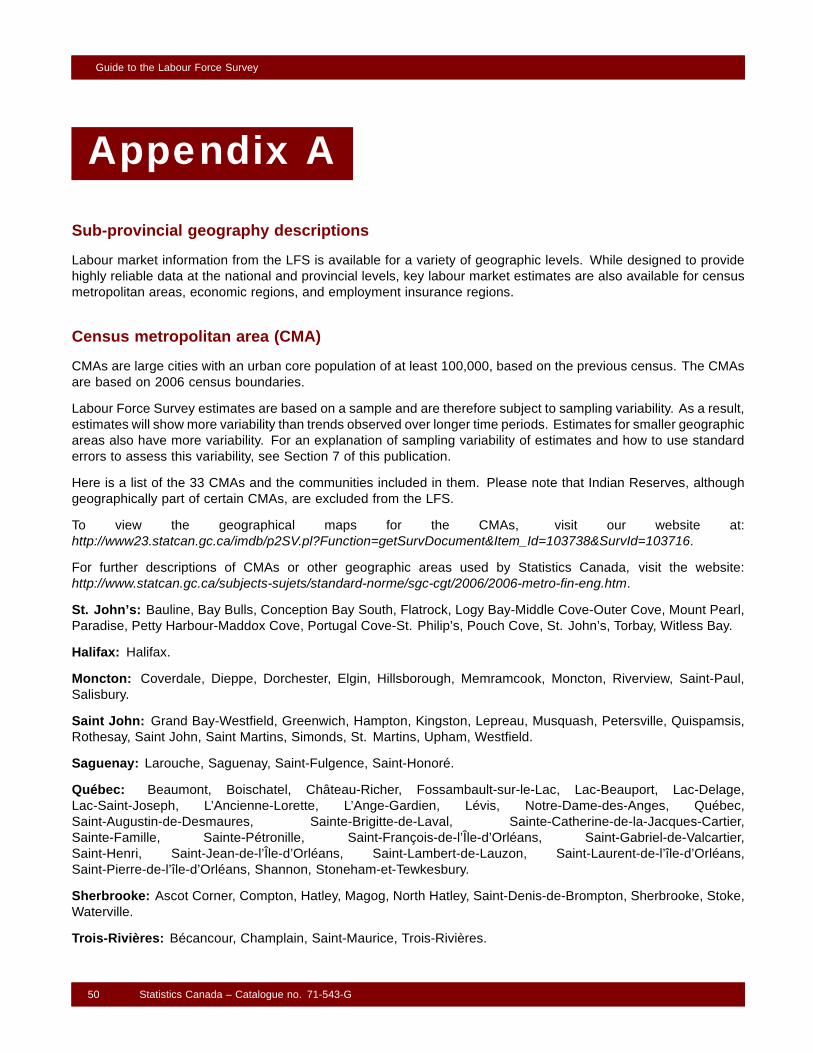
Guide to the Labour Force Survey
Appendix A
Sub-provincial geography descriptions
Labour market information from the LFS is available for a variety of geographic levels. While designed to providehighly reliable data at the national and provincial levels, key labour market estimates are also available for censusmetropolitan areas, economic regions, and employment insurance regions.
Census metropolitan area (CMA)
CMAs are large cities with an urban core population of at least 100,000, based on the previous census. The CMAsare based on 2006 census boundaries.
Labour Force Survey estimates are based on a sample and are therefore subject to sampling variability. As a result,estimates will show more variability than trends observed over longer time periods. Estimates for smaller geographicareas also have more variability. For an explanation of sampling variability of estimates and how to use standarderrors to assess this variability, see Section 7 of this publication.
Here is a list of the 33 CMAs and the communities included in them. Please note that Indian Reserves, althoughgeographically part of certain CMAs, are excluded from the LFS.
To view the geographical maps for the CMAs, visit our website at:http://www23.statcan.gc.ca/imdb/p2SV.pl?Function=getSurvDocument&Item_Id=103738&SurvId=103716.
For further descriptions of CMAs or other geographic areas used by Statistics Canada, visit the website:http://www.statcan.gc.ca/subjects-sujets/standard-norme/sgc-cgt/2006/2006-metro-fin-eng.htm.
St. John’s: Bauline, Bay Bulls, Conception Bay South, Flatrock, Logy Bay-Middle Cove-Outer Cove, Mount Pearl,Paradise, Petty Harbour-Maddox Cove, Portugal Cove-St. Philip’s, Pouch Cove, St. John’s, Torbay, Witless Bay.
Halifax: Halifax.
Moncton: Coverdale, Dieppe, Dorchester, Elgin, Hillsborough, Memramcook, Moncton, Riverview, Saint-Paul,Salisbury.
Saint John: Grand Bay-Westfield, Greenwich, Hampton, Kingston, Lepreau, Musquash, Petersville, Quispamsis,Rothesay, Saint John, Saint Martins, Simonds, St. Martins, Upham, Westfield.
Saguenay: Larouche, Saguenay, Saint-Fulgence, Saint-Honoré.
Québec: Beaumont, Boischatel, Château-Richer, Fossambault-sur-le-Lac, Lac-Beauport, Lac-Delage,Lac-Saint-Joseph, L’Ancienne-Lorette, L’Ange-Gardien, Lévis, Notre-Dame-des-Anges, Québec,Saint-Augustin-de-Desmaures, Sainte-Brigitte-de-Laval, Sainte-Catherine-de-la-Jacques-Cartier,Sainte-Famille, Sainte-Pétronille, Saint-François-de-l’Île-d’Orléans, Saint-Gabriel-de-Valcartier,Saint-Henri, Saint-Jean-de-l’Île-d’Orléans, Saint-Lambert-de-Lauzon, Saint-Laurent-de-l’île-d’Orléans,Saint-Pierre-de-l’île-d’Orléans, Shannon, Stoneham-et-Tewkesbury.
Sherbrooke: Ascot Corner, Compton, Hatley, Magog, North Hatley, Saint-Denis-de-Brompton, Sherbrooke, Stoke,Waterville.
Trois-Rivières: Bécancour, Champlain, Saint-Maurice, Trois-Rivières.
50 Statistics Canada – Catalogue no. 71-543-G

Guide to the Labour Force Survey
Montréal: Baie-d’Urfé, Beaconsfield, Beauharnois, Beloeil, Blainville, Boisbriand, Bois-des-Filion, Boucherville,Brossard, Candiac, Carignan, Chambly, Charlemagne, Châteauguay, Coteau-du-Lac, Côte-Saint-Luc,Delson, Deux-Montagnes, Dollard-des Ormeaux, Dorval, Gore, Hampstead, Hudson, Kirkland, LaPrairie, L’Assomption, Laval, Lavaltrie, L’Épiphanie, Léry, Les Cèdres, Les Coteaux, L’Île-Cadieux,L’Île-Dorval, L’Île-Perrot, Longueuil, Lorraine, Mascouche, McMasterville, Mercier, Mirabel, Montréal,Montréal-Est, Montréal-Ouest, Mont-Royal, Mont-Saint-Hilaire, Notre-Dame-de-l’Île-Perrot, Oka, OtterburnPark, Pincourt, Pointe-Calumet, Pointe-Claire, Pointe-des-Cascades, Repentigny, Richelieu, Rosemère,Saint-Amable, Saint-Basile-le-Grand, Saint-Bruno-de-Montarville, Saint-Colomban, Saint-Constant,Sainte-Anne-de-Bellevue, Sainte-Anne-des-Plaines, Sainte-Catherine, Sainte-Julie, Sainte-Marthe-sur-le-Lac,Sainte-Thérèse, Saint-Eustache, Saint-Isidore, Saint-Jérôme, Saint-Joseph-du-Lac, Saint-Lambert, Saint-Lazare,Saint-Mathias-sur-Richelieu, Saint-Mathieu, Saint-Mathieu-de-Beloeil, Saint-Philippe, Saint-Placide, Saint-Sulpice,Saint-Zotique, Senneville, Terrasse-Vaudreuil, Terrebonne, Varennes, Vaudreuil-Dorion, Vaudreuil-sur-le-Lac,Verchères, Westmount.
Ottawa – Gatineau - Ontario/Quebec: Cantley, Chelsea, Clarence-Rockland, Denholm, Gatineau, La Pêche,L’Ange-Gardien, Ottawa, Pontiac, Russell, Val-des-Monts.
Ottawa – Gatineau - Quebec part: Cantley, Chelsea, Denholm, Gatineau, La Pêche, L’Ange-Gardien, Pontiac,Val-des-Monts.
Ottawa – Gatineau - Ontario part: Clarence-Rockland, Ottawa, Russell.
Kingston: Frontenac Islands, Kingston, Loyalist, South Frontenac.
Peterborough: Cavan-Millbrook-North Monaghan, Douro-Dummer, Otonabee-South Monaghan, Peterborough,Smith-Ennismore-Lakefield.
Oshawa: Clarington, Oshawa, Whitby.
Toronto: Ajax, Aurora, Bradford West Gwillimbury, Brampton, Caledon, East Gwillimbury, Georgina, HaltonHills, King, Markham, Milton, Mississauga, Mono, New Tecumseth, Newmarket, Oakville, Orangeville, Pickering,Richmond Hill, Toronto, Uxbridge, Vaughan, Whitchurch-Stouffville.
Hamilton: Burlington, Grimsby, Hamilton.
St. Catharines – Niagara: Fort Erie, Lincoln, Niagara Falls, Niagara-on-the-Lake, Pelham, Port Colborne, St.Catharines, Thorold, Wainfleet, Welland.
Kitchener-Cambridge-Waterloo: Cambridge, Kitchener, North Dumfries, Waterloo, Woolwich.
Brantford: Brant, Brantford.
Guelph: Guelph, Guelph/Eramosa.
London: Adelaine Metcalfe, Central Elgin, London, Middlesex Centre, Southwold, St. Thomas, Strathroy-Caradoc,Thames Centre.
Windsor: Amherstburg, Lakeshore, LaSalle, Tecumseh, Windsor.
Barrie: Barrie, Innisfil, Springwater.
Greater Sudbury: Greater Sudbury.
Thunder Bay: Conmee, Gillies, Neebing, O’Connor, Oliver Paipoonge, Shuniah, Thunder Bay.
Winnipeg: East St. Paul, Headingley, Macdonald, Ritchot, Rosser, Springfield, St. Clements, St. François Xavier,Taché, West St. Paul, Winnipeg.
Regina: Balgonie, Belle Plaine, Buena Vista, Disley, Edenwold, Edenwold No. 158, Grand Coulee, Lumsden,Lumsden Beach, Lumsden No. 189, Pense, Pense No. 160, Pilot Butte, Regina, Regina Beach, Sherwood No. 159,White City.
Statistics Canada – Catalogue no. 71-543-G 51
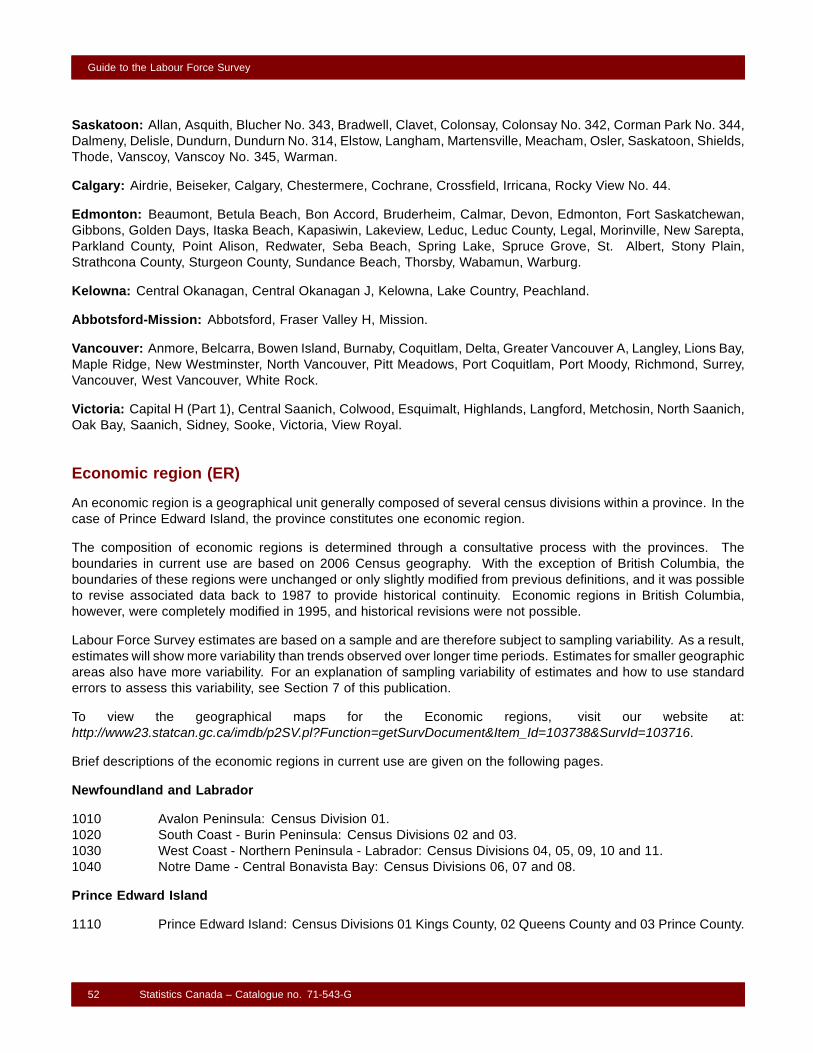
Guide to the Labour Force Survey
Saskatoon: Allan, Asquith, Blucher No. 343, Bradwell, Clavet, Colonsay, Colonsay No. 342, Corman Park No. 344,Dalmeny, Delisle, Dundurn, Dundurn No. 314, Elstow, Langham, Martensville, Meacham, Osler, Saskatoon, Shields,Thode, Vanscoy, Vanscoy No. 345, Warman.
Calgary: Airdrie, Beiseker, Calgary, Chestermere, Cochrane, Crossfield, Irricana, Rocky View No. 44.
Edmonton: Beaumont, Betula Beach, Bon Accord, Bruderheim, Calmar, Devon, Edmonton, Fort Saskatchewan,Gibbons, Golden Days, Itaska Beach, Kapasiwin, Lakeview, Leduc, Leduc County, Legal, Morinville, New Sarepta,Parkland County, Point Alison, Redwater, Seba Beach, Spring Lake, Spruce Grove, St. Albert, Stony Plain,Strathcona County, Sturgeon County, Sundance Beach, Thorsby, Wabamun, Warburg.
Kelowna: Central Okanagan, Central Okanagan J, Kelowna, Lake Country, Peachland.
Abbotsford-Mission: Abbotsford, Fraser Valley H, Mission.
Vancouver: Anmore, Belcarra, Bowen Island, Burnaby, Coquitlam, Delta, Greater Vancouver A, Langley, Lions Bay,Maple Ridge, New Westminster, North Vancouver, Pitt Meadows, Port Coquitlam, Port Moody, Richmond, Surrey,Vancouver, West Vancouver, White Rock.
Victoria: Capital H (Part 1), Central Saanich, Colwood, Esquimalt, Highlands, Langford, Metchosin, North Saanich,Oak Bay, Saanich, Sidney, Sooke, Victoria, View Royal.
Economic region (ER)
An economic region is a geographical unit generally composed of several census divisions within a province. In thecase of Prince Edward Island, the province constitutes one economic region.
The composition of economic regions is determined through a consultative process with the provinces. Theboundaries in current use are based on 2006 Census geography. With the exception of British Columbia, theboundaries of these regions were unchanged or only slightly modified from previous definitions, and it was possibleto revise associated data back to 1987 to provide historical continuity. Economic regions in British Columbia,however, were completely modified in 1995, and historical revisions were not possible.
Labour Force Survey estimates are based on a sample and are therefore subject to sampling variability. As a result,estimates will show more variability than trends observed over longer time periods. Estimates for smaller geographicareas also have more variability. For an explanation of sampling variability of estimates and how to use standarderrors to assess this variability, see Section 7 of this publication.
To view the geographical maps for the Economic regions, visit our website at:http://www23.statcan.gc.ca/imdb/p2SV.pl?Function=getSurvDocument&Item_Id=103738&SurvId=103716.
Brief descriptions of the economic regions in current use are given on the following pages.
Newfoundland and Labrador
1010 Avalon Peninsula: Census Division 01.1020 South Coast - Burin Peninsula: Census Divisions 02 and 03.1030 West Coast - Northern Peninsula - Labrador: Census Divisions 04, 05, 09, 10 and 11.1040 Notre Dame - Central Bonavista Bay: Census Divisions 06, 07 and 08.
Prince Edward Island
1110 Prince Edward Island: Census Divisions 01 Kings County, 02 Queens County and 03 Prince County.
52 Statistics Canada – Catalogue no. 71-543-G

Guide to the Labour Force Survey
Nova Scotia
1210 Cape Breton: Census Divisions 15 Inverness County, 16 Richmond County, 17 Cape Breton Countyand 18 Victoria County.
1220 North Shore: Census Divisions 10 Colchester County, 11 Cumberland County, 12 PictouCounty, 13 Guysborough County and 14 Antigonish County.
1230 Annapolis Valley: Census Divisions 05 Annapolis County, 07 Kings County and 08 Hants County.1240 Southern: Census Divisions 01 Shelburne County, 02 Yarmouth County, 03 Digby County, 04 Queens
County and 06 Lunenburg County.1250 Halifax: Census Division 09 Halifax County.
New Brunswick
1310 Campbellton - Miramichi: Census Divisions 09 Northumberland County, 14 Restigouche Countyand 15 Gloucester County.
1320 Moncton - Richibucto: Census Divisions 06 Albert County, 07 Westmorland County and 08 KentCounty.
1330 Saint John - St. Stephen: Census Divisions 01 Saint John County, 02 Charlotte County and 05 KingsCounty.
1340 Fredericton - Oromocto: Census Divisions 03 Sunbury County, 04 Queens County and 10 YorkCounty.
1350 Edmundston - Woodstock: Census Divisions 11 Carleton County, 12 Victoria Countyand 13 Madawaska County.
Quebec
2410 Gaspésie - Îles-de-la-Madeleine: Census Divisions 01 Les Îles-de-la-Madeleine, 02 LeRocher-Percé, 03 La Côte-de-Gaspé, 04 La Haute-Gaspésie, 05 Bonaventure and 06 Avignon.
2415 Bas-Saint-Laurent: Census Divisions 07 La Matapédia, 08 Matane, 09 LaMitis, 10 Rimouski-Neigette, 11 Les Basques, 12 Rivière-du-Loup, 13 Témiscouataand 14 Kamouraska.
2420 Capitale-Nationale: Census Divisions 15 Charlevoix- Est, 16 Charlevoix, 20 L’Île-d’Orléans, 21 LaCôte-de-Beaupré, 22 La Jacques-Cartier, 23 Québec and 34 Portneuf.
2425 Chaudière - Appalaches: Census Divisions 17 L’Îlet, 18 Montmagny, 19 Bellechasse, 25 Lévis, 26 LaNouvelle-Beauce, 27 Robert-Cliche, 28 Les Etchemins, 29 Beauce-Sartigan, 31 L’Amianteand 33 Lotbinière.
2430 Estrie: Census Divisions 30 Le Granit, 40 Asbestos, 41 Le Haut-Saint-François, 42 LeVal-Saint-François, 43 Sherbrooke, 44 Coaticook and 45 Memphrémagog.
2433 Centre-du-Québec: Census Divisions 32 L’Érable, 38 Bécancour, 39 Arthabaska, 49 Drummondand 50 Nicolet-Yamaska.
2435 Montérégie: Census Divisions 46 Brome-Missisquoi, 47 La Haute-Yamaska, 48 Acton, 53 LeBas-Richelieu, 54 Les Maskoutains, 55 Rouville, 56 Le Haut-Richelieu, 57 LaVallée-du-Richelieu, 58 Longueuil, 59 Lajemmerais, 67 Roussillon, 68 LesJardins-de-Napierville, 69 Le Haut-Saint-Laurent, 70 Beauharnois-Salaberryand 71 Vaudreuil-Soulanges.
2440 Montréal: Census Division 66 Montréal.2445 Laval: Census Division 65 Laval.2450 Lanaudière: Census Divisions 52 D’Autray, 60 L’Assomption, 61 Joliette, 62 Matawinie, 63 Montcalm
and 64 Les Moulins.2455 Laurentides: Census Divisions 72 Deux-Montagnes, 73 Thérèse-De Blainville, 74 Mirabel, 75 La
Rivière-du-Nord, 76 Argenteuil, 77 Les Pays-d’en-Haut, 78 Les Laurentides and 79 Antoine-Labelle.2460 Outaouais: Census Divisions 80 Papineau, 81 Gatineau, 82 Les Collines-de-l’Outaouais, 83 La
Vallée-de-la-Gatineau and 84 Pontiac.
Statistics Canada – Catalogue no. 71-543-G 53

Guide to the Labour Force Survey
2465 Abitibi-Témiscamingue: CensusDivisions 85 Témiscamingue, 86 Rouyn-Noranda, 87 Abitibi-Ouest, 88 Abitibi and 89 LaVallée-de-l’Or.
2470 Mauricie: Census Divisions 35 Mékinac, 36 Shawinigan, 37 Francheville, 51 Maskinongé and 90 LaTuque.
2475 Saguenay - Lac-Saint-Jean: Census Divisions 91 LeDomaine-du-Roy, 92 Maria-Chapdelaine, 93 Lac-Saint-Jean-Est and 94 Le Saguenay-et-son-Fjord.
2480 Côte-Nord: Census Divisions 95 La Haute-Côte-Nord, 96 Manicouagan, 97 Sept-Rivières -Caniapiscau and 98 Minganie - Basse-Côte-Nord.
2490 Nord-du-Québec: Census Division 99 Nord-du-Québec.
Ontario
3510 Ottawa: Census Divisions 01 Stormont, Dundas and Glengarry United Counties, 02 Prescott andRussell United Counties, 06 Ottawa Division, 07 Leeds and Grenville United Counties and 09 LanarkCounty.
3515 Kingston - Pembroke: Census Divisions 10 Frontenac Management board, 11 Lennox and AddingtonCounty, 12 Hastings County, 13 Prince Edward Division and 47 Renfrew County.
3520 Muskoka - Kawarthas: Census Divisions 14 Northumberland County, 15 PeterboroughCounty, 16 Kawartha Lakes Division, 44 Muskoka District Municipality and 46 Haliburton County.
3530 Toronto: Census Divisions 18 Durham Regional Municipality, 19 York RegionalMunicipality, 20 Toronto Division, 21 Peel Regional Municipality and 24 Halton Regional Municipality(excluding city of Burlington).
3540 Kitchener - Waterloo - Barrie: Census Divisions 22 Dufferin County, 23 WellingtonCounty, 30 Waterloo Regional Municipality and 43 Simcoe County.
3550 Hamilton - Niagara Peninsula: Census Divisions 24 Halton Regional Municipality (city of Burlingtononly), 25 Hamilton Division, 26 Niagara Regional Municipality, 28 Haldimand-Norfolk Divisionand 29 Brant Division.
3560 London: Census Divisions 32 Oxford County, 34 Elgin County and 39 Middlesex County.3570 Windsor - Sarnia: Census Divisions 36 Chatham-Kent Division, 37 Essex County and 38 Lambton
County.3580 Stratford - Bruce Peninsula: Census Divisions 31 Perth County, 40 Huron County, 41 Bruce County
and 42 Grey County.3590 Northeast: Census Divisions 48 Nipissing District, 49 Parry Sound District, 51 Manitoulin
District, 52 Sudbury District, 53 Greater Sudbury Division, 54 Timiskaming District, 56 CochraneDistrict and 57 Algoma District.
3595 Northwest: Census Divisions 58 Thunder Bay District, 59 Rainy River District and 60 Kenora District.
Manitoba
4610 Southeast: Census Divisions 01, 02 and 12.4620 South Central: Census Divisions 03 and 04.4630 Southwest: Census Divisions 05, 06, 07 and 15.4640 North Central: Census Divisions 08, 09 and 10.4650 Winnipeg: Census Divison 11.4660 Interlake: Census Divisions 13, 14 and 18.4670 Parklands: Census Divisions 16, 17 and 20.4680 North: Census Divisions 19, 21, 22 and 23.
Saskatchewan
4710 Regina - Moose Mountain: Census Disisions 01, 02 and 06.4720 Swift Current - Moose Jaw: Census Divisions 03, 04, 07 and 08.4730 Saskatoon - Biggar: Census Divisions 11, 12 and 13.
54 Statistics Canada – Catalogue no. 71-543-G

Guide to the Labour Force Survey
4740 Yorkton - Melville: Census Divisions 05, 09 and 10.4750 Prince Albert: Census Divisions 14, 15, 16 and 17.4760 Northern: Census Division 18.
Alberta
4810 Lethbridge - Medicine Hat: Census Divisions 01, 02 and 03.4820 Camrose - Drumheller: Census Divisions 04, 05, 07 and 10.4830 Calgary: Census Division 06.4840 Banff - Jasper - Rocky Mountain House: Census Divisions 09, 14 and 15.4850 Red Deer: Census Division 08.4860 Edmonton: Census Division 11.4870 Athabasca - Grande Prairie - Peace River: Census Divisions 13, 17, 18 and 19.4880 Wood Buffalo - Cold Lake: Census Divisions 12 and 16.
British Columbia
5910 Vancouver Island and Coast: Census Divisions 17 Capital Regional District, 19 CowichanValley Regional District, 21 Nanaimo Regional District, 23 Alberni-Clayoquot RegionalDistrict, 25 Comox-Strathcona Regional District, 27 Powell River Regional District, 43 MountWaddington Regional District and 45 Central Coast Regional District.
5920 Lower Mainland - Southwest: Census Divisions 09 Fraser Valley Regional District, 15 GreaterVancouver Regional District, 29 Sunshine Coast Regional District and 31 Squamish-LillooetRegional District.
5930 Thompson - Okanagan: Census Divisions 07 Okanagan-Similkameen RegionalDistrict, 33 Thompson-Nicola Regional District, 35 Central Okanagan Regional District, 37 NorthOkanagan Regional District and 39 Columbia-Shuswap Regional District.
5940 Kootenay: Census Divisions 01 East Kootenay Regional District, 03 Central Kootenay RegionalDistrict and 05 Kootenay Boundary Regional District.
5950 Cariboo: Census Divisions 41 Cariboo Regional District and 53 Fraser-Fort George Regional District.5960 North Coast: Census Divisions 47 Skeena-Queen Charlotte Regional District and 49 Kitimat-Stikine
Regional District.5970 Nechako: Census Divisions 51 Bulkley-Nechako Regional District and 57 Stikine Region.5980 Northeast: Census Divisions 55 Peace River Regional District and 59 Northern Rockies Regional
District.
Employment insurance region
In compliance with the Employment Insurance Act, the Labour Force Survey publishes seasonally adjusted,three month moving average unemployment rates for employment insurance regions (EIRs). These ratesare generally used to determine eligibility, benefit entitlement and weekly amount of benefits for personsliving within a particular employment insurance region. The boundaries of these regions are determinedby Employment and Social Development Canada (ESDC), and are currently based on 1996 Censusboundaries. For geographic descriptions and maps of employment insurance regions, see the ESDC website:http://www.rhdcc.gc.ca/fra/emploi/ae/regions_economiques/index.shtml.
Newfoundland and Labrador
01. St-John’s; 02. Newfoundland and Labrador.
Prince Edward Island
03. All of Prince Edward Island.
Statistics Canada – Catalogue no. 71-543-G 55

Guide to the Labour Force Survey
Nova Scotia
04. Eastern Nova Scotia; 05. Western Nova Scotia; 06. Halifax.
New Brunswick
07. Fredericton-Moncton-Saint John; 08. Madawaska-Charlotte; 09. Restigouche-Albert.
Quebec
10. Gaspésie – Îles-de-la-Madeleine; 11. Québec; 12. Trois-Rivières; 13. South Central Quebec; 14.Sherbrooke; 15. Montérégie; 16. Montréal; 17. Central Québec; 18. Northwestern Quebec; 19. Bas-Saint-Laurent– Côte-Nord; 20. Gatineau; 21. Saguenay.
Ontario
22. Ottawa; 23. Eastern Ontario; 24. Kingston; 25. Central Ontario; 26. Oshawa; 27. Toronto; 28. Hamilton; 29.St. Catharines; 30. London; 31. Niagara; 32. Windsor; 33. Kitchener; 34. Huron; 35. South Central Ontario; 36.Sudbury; 37. Thunder Bay; 38. Northern Ontario.
Manitoba
39. Winnipeg; 40. Southern Manitoba; 41. Northern Manitoba.
Saskatchewan
42. Regina; 43. Saskatoon; 44. Southern Saskatchewan; 45. Northern Saskatchewan.
Alberta
46. Calgary; 47. Edmonton; 48. Northern Alberta; 49. Southern Alberta.
British Columbia
50. Southern Interior British Columbia; 51. Abbotsford; 52. Vancouver; 53. Victoria; 54. Southern Coastal BritishColumbia; 55. Northern British Columbia.
Territories
56. Yukon; 57. Northwest Territories; 58. Nunavut.
56 Statistics Canada – Catalogue no. 71-543-G

Guide to the Labour Force Survey
Appendix B
Labour Force Survey questionnaire
The LFS application consists of several questionnaire components (Contact, Household, Demographics, Rent,Labour Force Information and Exit), each of which is summarized below, followed by the lists of codesets. Eachof the questionnaire components is comprised of a number of question blocks. For simplicity, as a result of thecomplexity of the logic within the application, not all possible questions and flows are presented. This is especiallythe case within the Contact Component where the scope of possible questions and flows is somewhat greaterthan that summarized below.
Selected dwellings are in the survey for six consecutive months. A birth interview corresponds to the first interview fora new household, and is usually conducted in person. Some birth interviews are now also conducted by telephonefrom centralized CATI work sites. Subsequent interviews are conducted in the following months, and are usuallydone by telephone.
Contact component
The following information is collected at the start of each contact attempt.
II_R01A — Hello, I’m calling from Statistics Canada. My name is …If interview in person, go to IC_R01If birth interview by telephone, go to AR_Q01If subsequent interview by telephone, go to SR_Q01
SR_Q01 — May I speak with … ?If “Speaking”, go to IC_R01If “Available”, go to II_R01BIf “Not available” or “No longer a household member”, go to AR_Q01If “Wrong number”, go to TC_Q01
II_R01B — Hello, I’m calling from Statistics Canada. My name is …Go to IC_R01
TC_Q01 — I would like to make sure I’ve dialed the right number. Is this: [telephone number]?If yes, go to AR_Q01If no, thank person and end call
AR_Q01 — May I speak with an adult member of the household?If “Speaking” and CATI birth interview, go to TFCC_Q01If “Speaking” and not CATI birth interview, go to IC_R01If “Available”, go to II_R01CIf “Not available” and birth interview, go to ARA_Q01If “Not available” and subsequent interview and SR_Q01= “Not available”, go to SRA_Q01If “Not available” and subsequent interview and SR_Q01= “No longer a household member” or “Wrong number”, goto ARA_Q01
II_R01C — Hello, I’m calling from Statistics Canada. My name is …If CATI birth interview, go to TFCC_Q01If not CATI birth interview, go to IC_R01
Statistics Canada – Catalogue no. 71-543-G 57

Guide to the Labour Force Survey
SRA_Q01 — I would like to contact … When would he/she be available?If “Available”, make appointment and then thank person and end callIf “Not available”, go to ARA_Q01
ARA_Q01 — When would an adult member of the household be available?If “Available”, make appointment and then thank person and end callIf “Not available”, thank person and end call
TFCC_Q01 — In order to make sure I’ve reached the correct household, I need to confirm your address. Isit: [listing address]?If yes, go to IC_R01If no, go to TFCC_Q02
TFCC_Q02 — I would like to make sure I’ve dialed the right number. Is this [telephone number]?Thank person and end call
IC_R01I’m calling regarding the Labour Force Survey.
LP_Q01 — Would you prefer to be interviewed in English or in French?If CATI interview, go to MON_R01If not CATI interview, go to Household Component
MON_R01My supervisor may listen to this call for the purpose of quality control.
Household and demographics component
Household blocks
LA_N01If CATI birth interview, go to MA_Q01If subsequent interview in person, go to CMA_Q01If subsequent interview by telephone, go to SD_Q01Confirm the listing address.Go to MA_Q01
SD_Q01 — I would like to confirm your address. Are you still living at [listing address]?If yes and listing address is the same as mailing address, go to CHM_Q01If yes and listing address is different from mailing address, go to CMA_Q01If no, go to SD_Q02If “Respondent never lived there”, go to SD_Q05
SD_Q02 — Does anyone who was living with you at that address still live there?If yes, go to SD_Q03If no, thank person and end call
SD_Q03 — Can you provide me with the current telephone number for that address?If yes, go to SD_Q04If no, thank person and end call
SD_Q04 — What is that telephone number, including the area code?Thank person and end call
SD_Q05 — I would like to make sure I’ve dialed the right number. Is this [telephone number]?Thank person and end call
58 Statistics Canada – Catalogue no. 71-543-G
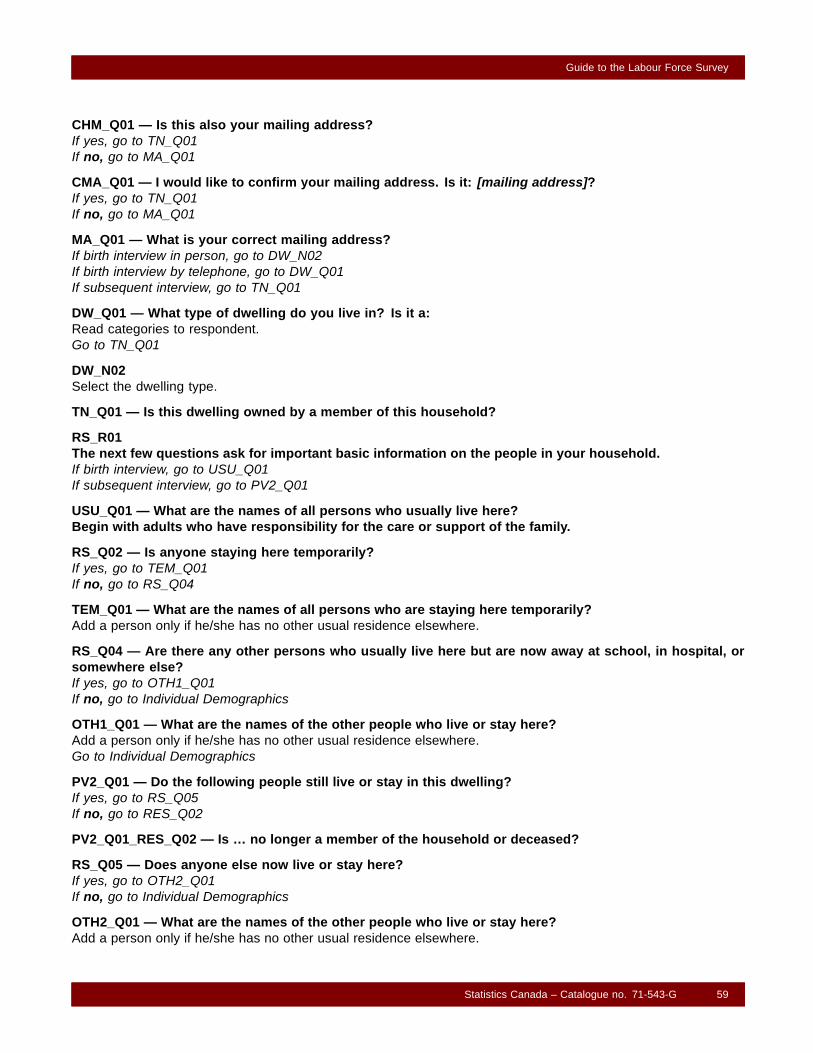
Guide to the Labour Force Survey
CHM_Q01 — Is this also your mailing address?If yes, go to TN_Q01If no, go to MA_Q01
CMA_Q01 — I would like to confirm your mailing address. Is it: [mailing address]?If yes, go to TN_Q01If no, go to MA_Q01
MA_Q01 — What is your correct mailing address?If birth interview in person, go to DW_N02If birth interview by telephone, go to DW_Q01If subsequent interview, go to TN_Q01
DW_Q01 — What type of dwelling do you live in? Is it a:Read categories to respondent.Go to TN_Q01
DW_N02Select the dwelling type.
TN_Q01 — Is this dwelling owned by a member of this household?
RS_R01The next few questions ask for important basic information on the people in your household.If birth interview, go to USU_Q01If subsequent interview, go to PV2_Q01
USU_Q01 — What are the names of all persons who usually live here?Begin with adults who have responsibility for the care or support of the family.
RS_Q02 — Is anyone staying here temporarily?If yes, go to TEM_Q01If no, go to RS_Q04
TEM_Q01 — What are the names of all persons who are staying here temporarily?Add a person only if he/she has no other usual residence elsewhere.
RS_Q04 — Are there any other persons who usually live here but are now away at school, in hospital, orsomewhere else?If yes, go to OTH1_Q01If no, go to Individual Demographics
OTH1_Q01 — What are the names of the other people who live or stay here?Add a person only if he/she has no other usual residence elsewhere.Go to Individual Demographics
PV2_Q01 — Do the following people still live or stay in this dwelling?If yes, go to RS_Q05If no, go to RES_Q02
PV2_Q01_RES_Q02 — Is … no longer a member of the household or deceased?
RS_Q05 — Does anyone else now live or stay here?If yes, go to OTH2_Q01If no, go to Individual Demographics
OTH2_Q01 — What are the names of the other people who live or stay here?Add a person only if he/she has no other usual residence elsewhere.
Statistics Canada – Catalogue no. 71-543-G 59
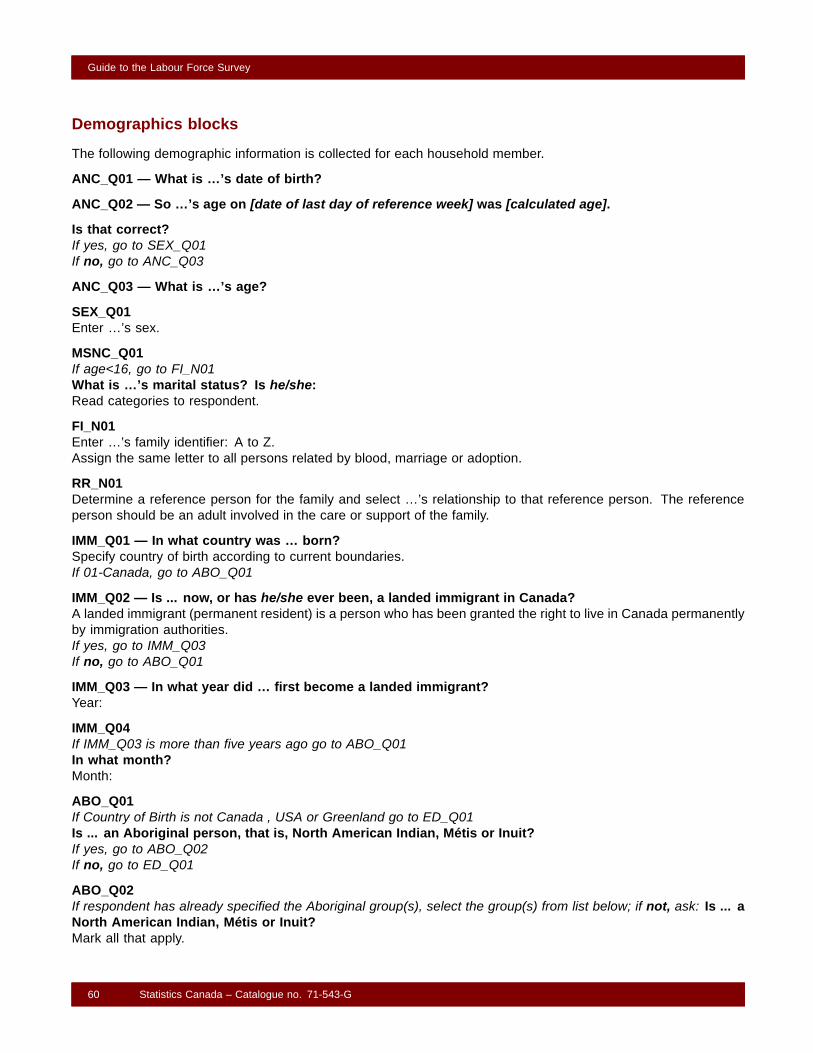
Guide to the Labour Force Survey
Demographics blocks
The following demographic information is collected for each household member.
ANC_Q01 — What is …’s date of birth?
ANC_Q02 — So …’s age on [date of last day of reference week] was [calculated age].
Is that correct?If yes, go to SEX_Q01If no, go to ANC_Q03
ANC_Q03 — What is …’s age?
SEX_Q01Enter …’s sex.
MSNC_Q01If age<16, go to FI_N01What is …’s marital status? Is he/she:Read categories to respondent.
FI_N01Enter …’s family identifier: A to Z.Assign the same letter to all persons related by blood, marriage or adoption.
RR_N01Determine a reference person for the family and select …’s relationship to that reference person. The referenceperson should be an adult involved in the care or support of the family.
IMM_Q01 — In what country was … born?Specify country of birth according to current boundaries.If 01-Canada, go to ABO_Q01
IMM_Q02 — Is ... now, or has he/she ever been, a landed immigrant in Canada?A landed immigrant (permanent resident) is a person who has been granted the right to live in Canada permanentlyby immigration authorities.If yes, go to IMM_Q03If no, go to ABO_Q01
IMM_Q03 — In what year did … first become a landed immigrant?Year:
IMM_Q04If IMM_Q03 is more than five years ago go to ABO_Q01In what month?Month:
ABO_Q01If Country of Birth is not Canada , USA or Greenland go to ED_Q01Is ... an Aboriginal person, that is, North American Indian, Métis or Inuit?If yes, go to ABO_Q02If no, go to ED_Q01
ABO_Q02If respondent has already specified the Aboriginal group(s), select the group(s) from list below; if not, ask: Is ... aNorth American Indian, Métis or Inuit?Mark all that apply.
60 Statistics Canada – Catalogue no. 71-543-G

Guide to the Labour Force Survey
ED_Q01If age<14, go to CAF_Q01What is the highest grade of elementary or high school … ever completed?If “Grade 8 or lower” or “Grade 9 – 10”, go to ED_Q03If “Grade 11 – 13”, go to ED_Q02
ED_Q02 — Did … graduate from high school (secondary school)?
ED_Q03 — Has … received any other education that could be counted towards a degree, certificate ordiploma from an educational institution?If yes, go to ED_Q04If no, go to CAF_Q01
ED_Q04 — What is the highest degree, certificate or diploma … has obtained?
CHE_Q01If (Country of Birth is Canada ) or (IMM_Q02 is No) or (respondent has not received a post-secondary degree,certificate or diploma) go to CAF_Q01In what country did … complete his/her highest degree, certificate or diploma?Specify country of highest education according to current boundaries.
CAF_Q01If age<16 or age>65, go to ANC_Q01 for next household memberIs … a full-time member of the regular Canadian Armed Forces?
For each person aged 15 or over who is not a full-time member of the regular armed forces complete the Labourforce information component.
Rent component
The Rent Component is generated only for cases where the answer to TN_Q01 (“Is this dwelling owned by a memberof this household?”) in the Household Component is “No”, and province/territory is not Yukon, Northwest Territoriesor Nunavut.
RRF_R01
The next few questions are about your rent. The information collected is used to calculate the rent portionof the Consumer Price Index.
RM_Q01If rent information exists from the previous month, go to RM_Q04If dwelling type is not “Low-rise apartment” and not “High-rise apartment”, go to RM_Q02On which floor do you live?
RM_Q02 — To the best of your knowledge, how old is your building?
RM_Q03 — How many bedrooms are there in your dwelling?
RM_Q04 — This month, is the rent for your dwelling subsidized by government or an employer, or a relative?If yes, go to RM_Q04AIf no, go to RM_Q05
RM_Q04A — In what manner is the rent for your dwelling subsidized?
RM_Q05 — This month, are you operating a business from your dwelling?If yes, go to RM_Q05AIf no, go to RM_Q06
RM_Q05A — Does the business affect the amount of rent paid?
Statistics Canada – Catalogue no. 71-543-G 61
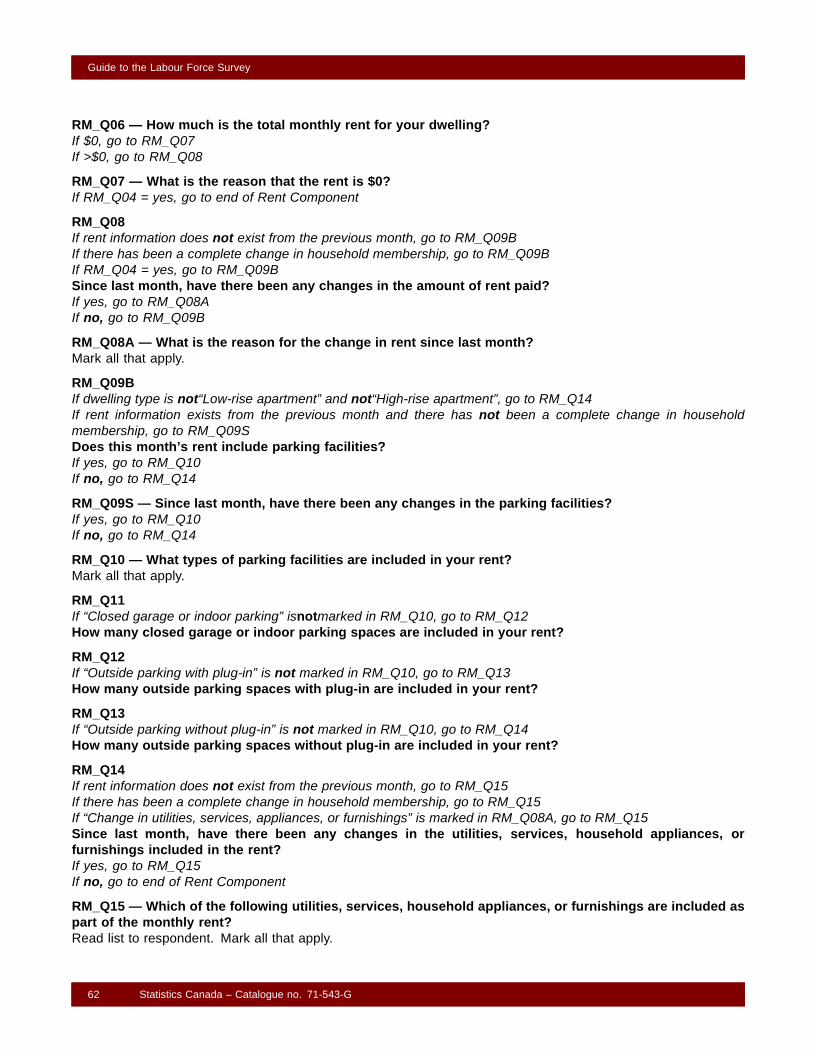
Guide to the Labour Force Survey
RM_Q06 — How much is the total monthly rent for your dwelling?If $0, go to RM_Q07If >$0, go to RM_Q08
RM_Q07 — What is the reason that the rent is $0?If RM_Q04 = yes, go to end of Rent Component
RM_Q08If rent information does not exist from the previous month, go to RM_Q09BIf there has been a complete change in household membership, go to RM_Q09BIf RM_Q04 = yes, go to RM_Q09BSince last month, have there been any changes in the amount of rent paid?If yes, go to RM_Q08AIf no, go to RM_Q09B
RM_Q08A — What is the reason for the change in rent since last month?Mark all that apply.
RM_Q09BIf dwelling type is not“Low-rise apartment” and not“High-rise apartment”, go to RM_Q14If rent information exists from the previous month and there has not been a complete change in householdmembership, go to RM_Q09SDoes this month’s rent include parking facilities?If yes, go to RM_Q10If no, go to RM_Q14
RM_Q09S — Since last month, have there been any changes in the parking facilities?If yes, go to RM_Q10If no, go to RM_Q14
RM_Q10 — What types of parking facilities are included in your rent?Mark all that apply.
RM_Q11If “Closed garage or indoor parking” isnotmarked in RM_Q10, go to RM_Q12How many closed garage or indoor parking spaces are included in your rent?
RM_Q12If “Outside parking with plug-in” is not marked in RM_Q10, go to RM_Q13How many outside parking spaces with plug-in are included in your rent?
RM_Q13If “Outside parking without plug-in” is not marked in RM_Q10, go to RM_Q14How many outside parking spaces without plug-in are included in your rent?
RM_Q14If rent information does not exist from the previous month, go to RM_Q15If there has been a complete change in household membership, go to RM_Q15If “Change in utilities, services, appliances, or furnishings” is marked in RM_Q08A, go to RM_Q15Since last month, have there been any changes in the utilities, services, household appliances, orfurnishings included in the rent?If yes, go to RM_Q15If no, go to end of Rent Component
RM_Q15 — Which of the following utilities, services, household appliances, or furnishings are included aspart of the monthly rent?Read list to respondent. Mark all that apply.
62 Statistics Canada – Catalogue no. 71-543-G

Guide to the Labour Force Survey
Labour force information component
In this component, a path is assigned according to the answers provided. This path is used to control the flow throughthe component. For paths 1, 2, 6, and 7 the path determines the labour force status, but for paths 3, 4 and 5 otherconditions (for example, availability for work) must be considered to distinguish between those who are unemployedand those who are not in the labour force.
PATHS
1 Employed, at work2 Employed, absent from work3 Temporary layoff4 Job seeker5 Future start6 Not in labour force, able to work7 Not in labour force, permanently unable to work
Job attachment block
LFI_Q100 — Many of the following questions concern ...’s activities last week. By last week, I mean theweek beginning on Sunday, [date of first day of reference week], and ending last Saturday, [date of last dayof reference week].Last week, did ... work at a job or business?(regardless of the number of hours)If yes, then PATH = 1 and go to 102If no, go to 101If “Permanently unable to work”, then PATH = 7 and go to 104
LFI_Q101 — Last week, did ... have a job or business from which he/she was absent?If no, go to 104
LFI_Q102 — Did he/she have more than one job or business last week?If no, go to 110
LFI_Q103 — Was this a result of changing employers?Go to 110
Past job attachment block
LFI_Q104 — Has he/she ever worked at a job or business?If no, go to 170
LFI_Q105 — When did he/she last work?If subsequent interview and no change in 105 and last month’s PATH = 3, go to 131Else if subsequent interview and no change in 105 and last month’s PATH = 4 to 7, go to 170Else if not within past year, go to 170Else if PATH = 7, go to 131Else if PATH not 7, go to 110
Statistics Canada – Catalogue no. 71-543-G 63
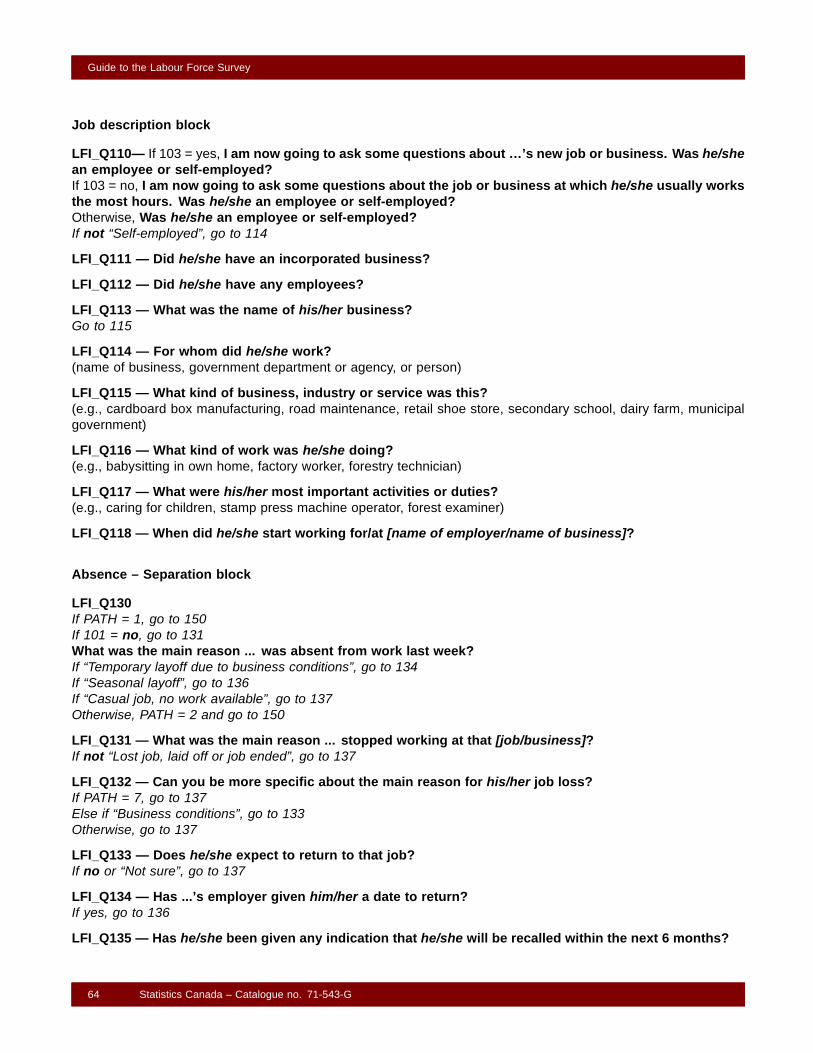
Guide to the Labour Force Survey
Job description block
LFI_Q110— If 103 = yes, I am now going to ask some questions about …’s new job or business. Was he/shean employee or self-employed?If 103 = no, I am now going to ask some questions about the job or business at which he/she usually worksthe most hours. Was he/she an employee or self-employed?Otherwise, Was he/she an employee or self-employed?If not “Self-employed”, go to 114
LFI_Q111 — Did he/she have an incorporated business?
LFI_Q112 — Did he/she have any employees?
LFI_Q113 — What was the name of his/her business?Go to 115
LFI_Q114 — For whom did he/she work?(name of business, government department or agency, or person)
LFI_Q115 — What kind of business, industry or service was this?(e.g., cardboard box manufacturing, road maintenance, retail shoe store, secondary school, dairy farm, municipalgovernment)
LFI_Q116 — What kind of work was he/she doing?(e.g., babysitting in own home, factory worker, forestry technician)
LFI_Q117 — What were his/her most important activities or duties?(e.g., caring for children, stamp press machine operator, forest examiner)
LFI_Q118 — When did he/she start working for/at [name of employer/name of business]?
Absence – Separation block
LFI_Q130If PATH = 1, go to 150If 101 = no, go to 131What was the main reason ... was absent from work last week?If “Temporary layoff due to business conditions”, go to 134If “Seasonal layoff”, go to 136If “Casual job, no work available”, go to 137Otherwise, PATH = 2 and go to 150
LFI_Q131 — What was the main reason ... stopped working at that [job/business]?If not “Lost job, laid off or job ended”, go to 137
LFI_Q132 — Can you be more specific about the main reason for his/her job loss?If PATH = 7, go to 137Else if “Business conditions”, go to 133Otherwise, go to 137
LFI_Q133 — Does he/she expect to return to that job?If no or “Not sure”, go to 137
LFI_Q134 — Has ...’s employer given him/her a date to return?If yes, go to 136
LFI_Q135 — Has he/she been given any indication that he/she will be recalled within the next 6 months?
64 Statistics Canada – Catalogue no. 71-543-G

Guide to the Labour Force Survey
LFI_Q136 — As of last week, how many weeks had ... been on layoff?If 130 = “Seasonal layoff”, go to 137Else if 134 = no and 135 = no, go to 137Else if on layoff more than 52 weeks, go to 137Otherwise, PATH = 3 and go to 137
LFI_Q137 — Did he/she usually work more or less than 30 hours per week?If PATH = 3, go to 190Otherwise, go to 170
Work hours (Main job) block
LFI_Q150The following questions refer to ...’s work hours at his/her [new] [job/business] [at name of employer].If 110 = “Employee”,Excluding overtime, does the number of paid hours ... works vary from week to week?Otherwise,Does the number of hours ... works vary from week to week?If yes, go to 152
LFI_Q151If 110 = “Employee”,Excluding overtime, how many paid hours does ... work per week?Otherwise,How many hours does ... work per week?If PATH = 2, go to 158If 110 = “Employee”, go to 153Otherwise, go to 157
LFI_Q152If 110 = “Employee”,Excluding overtime, on average, how many paid hours does ... usually work per week?Otherwise,On average, how many hours does ... usually work per week?If PATH = 2, go to 158If 110 = “Employee”, go to 153Otherwise, go to 157
LFI_Q153 — Last week, how many hours was he/she away from this job because of vacation, illness, or anyother reason?If 0 hours, go to 155
LFI_Q154 — What was the main reason for that absence?
LFI_Q155 — Last week, how many hours of paid overtime did he/she work at this job?
LFI_Q156 — Last week, how many extra hours without pay did he/she work at this job?If 150 = no, then actual hours = 151 - 153 + 155 + 156 and go to 158
LFI_Q157 — Last week, how many hours did he/she actually work at his/her [new] [job/business] [at nameof employer]?
LFI_Q158If 151 >= 29.5 or 152 >= 29.5, and PATH = 2, go to 162If 151 >= 29.5 or 152 >= 29.5, and PATH = 1, go to 200Does he/she want to work 30 or more hours per week [at a single job]?If yes, go to 160
LFI_Q159 — What is the main reason ... does not want to work 30 or more hours per week [at a single job]?If PATH = 2, go to 162Otherwise, go to 200
Statistics Canada – Catalogue no. 71-543-G 65

Guide to the Labour Force Survey
LFI_Q160 — What is the main reason ... usually works less than 30 hours per week [at his/her main job]?If not (“Business conditions” or “Could not find work with 30 or more hours per week”) and PATH = 2, go to 162If not (“Business conditions” or “Could not find work with 30 or more hours per week”) and PATH = 1, go to 200
LFI_Q161 — At any time in the 4 weeks ending last Saturday, [date of last day of reference week], did he/shelook for full-time work?If PATH = 2, go to 162Otherwise, go to 200
Absence block
LFI_Q162 — As of last week, how many weeks had ... been continuously absent from work?If (110 is “Employee”) or (110 is “Self-employed” and 111 is yes), go to 163Otherwise, go to 200
LFI_Q163 — Is he/she getting any wages or salary from his/her [employer/business] for any time off lastweek?Go to 200
Job search - Future start block
LFI_Q170If PATH = 7, go to 500In the 4 weeks ending last Saturday, [date of last day of reference week], did ... do anything to find work?If no and age >= 65, then PATH = 6 and go to 500If no and age <= 64, go to 174If yes, then PATH = 4 and go to 171
LFI_Q171 — What did he/she do to find work in those 4 weeks? Did he/she do anything else to find work?
LFI_Q172 — As of last week, how many weeks had he/she been looking for work?[since the date last worked]
LFI_Q173 — What was his/her main activity before he/she started looking for work?Go to 177
LFI_Q174 — Last week, did ... have a job to start at a definite date in the future?If no, then PATH = 6 and go to 176
LFI_Q175 — Will he/she start that job before or after Sunday, [date of the first day after four weeks from thelast day of reference week]?If “Before the date above”, then PATH = 5 and go to 190If “On or after the date above”, then PATH = 6 and go to 500
LFI_Q176 — Did he/she want a job last week?If no, go to 500
LFI_Q177 — Did he/she want a job with more or less than 30 hours per week?
LFI_Q178If PATH = 4, go to 190What was the main reason he/she did not look for work last week?If “Believes no work available”, go to 190Otherwise, go to 500
66 Statistics Canada – Catalogue no. 71-543-G

Guide to the Labour Force Survey
Availability block
LFI_Q190 — Could he/she have worked last week [if he/she had been recalled/if a suitable job had beenoffered]?If yes, go to 400
LFI_Q191 — What was the main reason ... was not available to work last week?Go to 400
Earnings block
LFI_Q200If 110 is not“Employee”, go to 300If subsequent interview and no change in 110, 114, 115, 116, 117, 118, go to 300Now I’d like to ask a few short questions about ...’s earnings from his/her [new] job [at name of employer].Is he/she paid by the hour?
LFI_Q201 — Does he/she usually receive tips or commissions?If 200 = no, go to 204
LFI_Q202 —[Including tips and commissions,] what is his/her hourly rate of pay?Go to 220
LFI_Q204 — What is the easiest way for you to tell us his/her wage or salary, [including tips andcommissions,] before taxes and other deductions?Would it be yearly, monthly, weekly, or on some other basis?If “Yearly”, go to 209If “Monthly”, go to 208If “Semi-monthly”, go to 207If “Bi-weekly”, go to 206If “Weekly” or “Other”, go to 205
LFI_Q205 —[Including tips and commissions,] what is his/her weekly wage or salary, before taxes and otherdeductions?Go to 220
LFI_Q206 —[Including tips and commissions,] what is his/her bi-weekly wage or salary, before taxes andother deductions?Go to 220
LFI_Q207 —[Including tips and commissions,] what is his/her semi-monthly wage or salary, before taxesand other deductions?Go to 220
LFI_Q208 —[Including tips and commissions,] what is his/her monthly wage or salary, before taxes andother deductions?Go to 220
LFI_Q209 —[Including tips and commissions,] what is his/her yearly wage or salary, before taxes and otherdeductions?Go to 220
Statistics Canada – Catalogue no. 71-543-G 67

Guide to the Labour Force Survey
Union block
LFI_Q220 — Is he/she a union member at his/her [new] job [at name of employer]?If yes, go to 240
LFI_Q221 — Is he/she covered by a union contract or collective agreement?
Permanence block
LFI_Q240 — Is ...’s [new] job [at name of employer] permanent, or is there some way that it is not permanent?(e.g., seasonal, temporary, term or casual)If “Permanent”, go to 260
LFI_Q241 — In what way is his/her job not permanent?Go to 260
Firm size block
LFI_Q260 — About how many persons are employed at the location where ... works for [name of employer]?Would it be: [Less than 20, 20 to 99, 100 to 500, or over 500]?Read categories to respondent.
LFI_Q261 — Does [name of employer] operate at more than one location?If no, or 260 = “Over 500”, go to 300
LFI_Q262 — In total, about how many persons are employed at all locations?Would it be: [Less than 20, 20 to 99, 100 to 500, or over 500]?Read categories to respondentGo to 300
Class of worker – Hours at other job block
LFI_Q300If 102 = no, go to 400Now I have a couple of questions about ...’s [other/old] job or business. Was he/she an employee orself-employed?If not “Self-employed”, go to 320
LFI_Q301 — Did he/she have an incorporated business?
LFI_Q302 — Did he/she have any employees?
LFI_Q320If 300 = “Employee”,Excluding overtime, how many paid hours [does/did] ... usually work per week at thisjob?Otherwise,How many hours [does/did] ... usually work per week at this [business/family business]?If PATH = 2, go to 400
LFI_Q321 — Last week, how many hours did ... actually work at this [job/business/family business]?Go to 400
Temporary layoff job search block
LFI_Q400If PATH not 3, go to 500
68 Statistics Canada – Catalogue no. 71-543-G
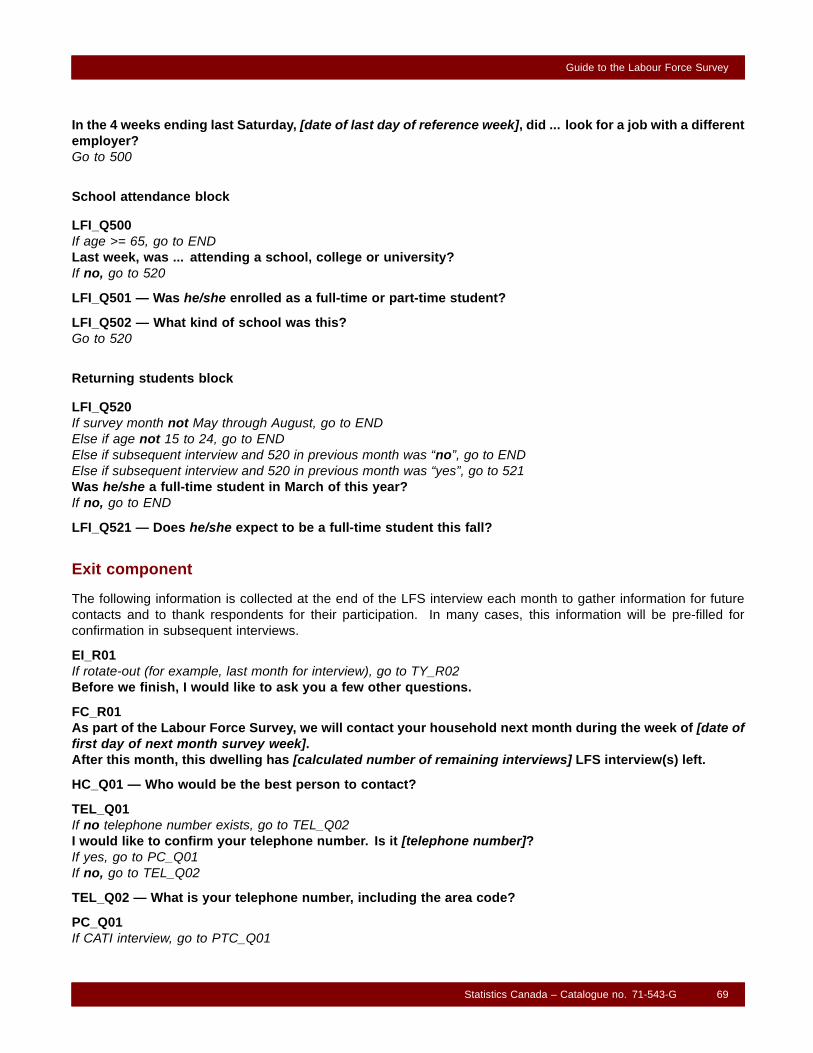
Guide to the Labour Force Survey
In the 4 weeks ending last Saturday, [date of last day of reference week], did ... look for a job with a differentemployer?Go to 500
School attendance block
LFI_Q500If age >= 65, go to ENDLast week, was ... attending a school, college or university?If no, go to 520
LFI_Q501 — Was he/she enrolled as a full-time or part-time student?
LFI_Q502 — What kind of school was this?Go to 520
Returning students block
LFI_Q520If survey month not May through August, go to ENDElse if age not 15 to 24, go to ENDElse if subsequent interview and 520 in previous month was “no”, go to ENDElse if subsequent interview and 520 in previous month was “yes”, go to 521Was he/she a full-time student in March of this year?If no, go to END
LFI_Q521 — Does he/she expect to be a full-time student this fall?
Exit component
The following information is collected at the end of the LFS interview each month to gather information for futurecontacts and to thank respondents for their participation. In many cases, this information will be pre-filled forconfirmation in subsequent interviews.
EI_R01If rotate-out (for example, last month for interview), go to TY_R02Before we finish, I would like to ask you a few other questions.
FC_R01As part of the Labour Force Survey, we will contact your household next month during the week of [date offirst day of next month survey week].After this month, this dwelling has [calculated number of remaining interviews] LFS interview(s) left.
HC_Q01 — Who would be the best person to contact?
TEL_Q01If no telephone number exists, go to TEL_Q02I would like to confirm your telephone number. Is it [telephone number]?If yes, go to PC_Q01If no, go to TEL_Q02
TEL_Q02 — What is your telephone number, including the area code?
PC_Q01If CATI interview, go to PTC_Q01
Statistics Canada – Catalogue no. 71-543-G 69

Guide to the Labour Force Survey
May we conduct the next interview by telephone?If yes, go to PTC_Q01If no, go to PV_R01
PV_R01In this case we will make a personal visit next month during the week of [date of first day of next monthsurvey week].
PTC_Q01If preferred time to call information does not exist from the previous month, go to PTC_Q02I would like to confirm the time of day you would prefer that we call. Is it [preferred time to call]?If yes, go to PTC_N03If no, go to PTC_Q02
PTC_Q02 — What time of day would you prefer that we call? Would it be the morning, the afternoon, theevening, or ANY TIME?Mark all that apply.
PTC_N03Enter any other information about the preferred time to call.
LQ_Q01If CATI interview, go to TY_R01If subsequent interview, go to TY_R01If dwelling type is not “Single detached” and not “Double” and not “Row or terrace” and not “Duplex”, go to TY_R01Is there another set of living quarters within this structure?If yes, go to LQ_N02If no, go to TY_R01
LQ_N02Remember to verify the cluster list and add one or more multiples if necessary.
TY_R01Thank you very much for your participation in this month’s Labour Force Survey. Have a nice [day/evening].Go to END
TY_R02Thank you very much for your participation in the Labour Force Survey. Although your six months in theLabour Force Survey are over, your household may be contacted by Statistics Canada some time in thefuture for another survey. Have a nice [day/evening].
List of codesets
Codes for Contact component
SR_Q01
1 Yes, speaking to respondent2 Yes, respondent available3 No, respondent not available4 No, respondent no longer a household member5 Wrong number
70 Statistics Canada – Catalogue no. 71-543-G
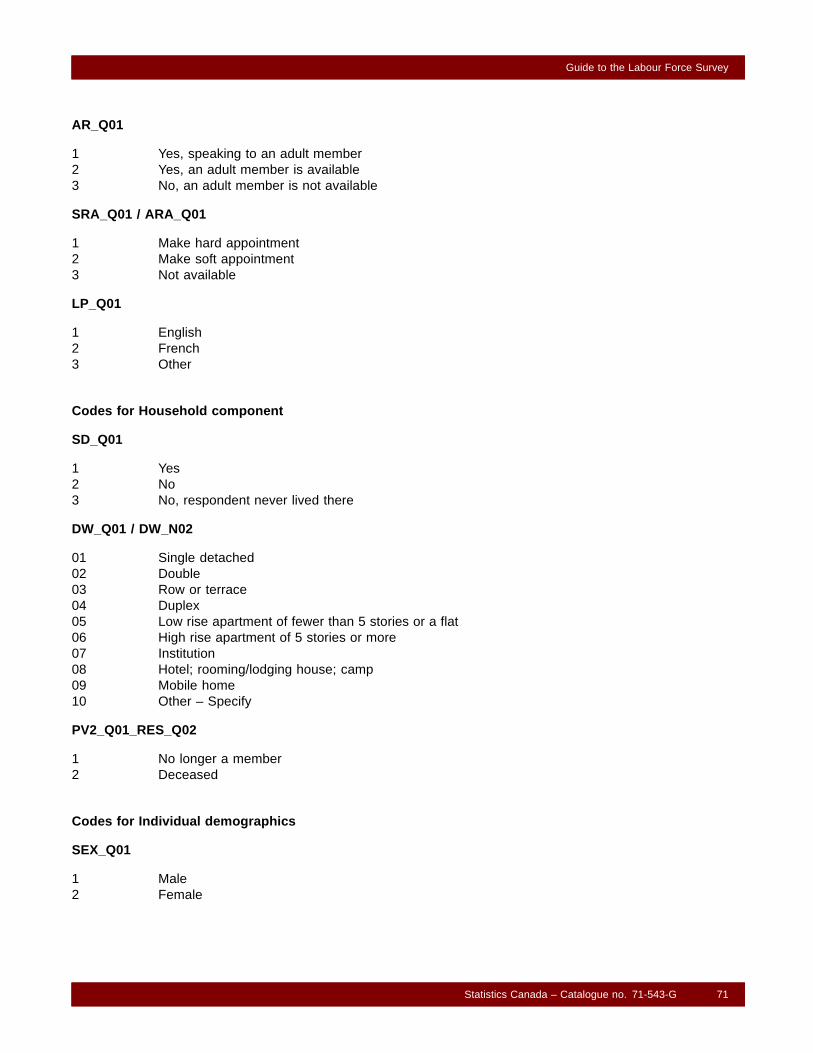
Guide to the Labour Force Survey
AR_Q01
1 Yes, speaking to an adult member2 Yes, an adult member is available3 No, an adult member is not available
SRA_Q01 / ARA_Q01
1 Make hard appointment2 Make soft appointment3 Not available
LP_Q01
1 English2 French3 Other
Codes for Household component
SD_Q01
1 Yes2 No3 No, respondent never lived there
DW_Q01 / DW_N02
01 Single detached02 Double03 Row or terrace04 Duplex05 Low rise apartment of fewer than 5 stories or a flat06 High rise apartment of 5 stories or more07 Institution08 Hotel; rooming/lodging house; camp09 Mobile home10 Other – Specify
PV2_Q01_RES_Q02
1 No longer a member2 Deceased
Codes for Individual demographics
SEX_Q01
1 Male2 Female
Statistics Canada – Catalogue no. 71-543-G 71
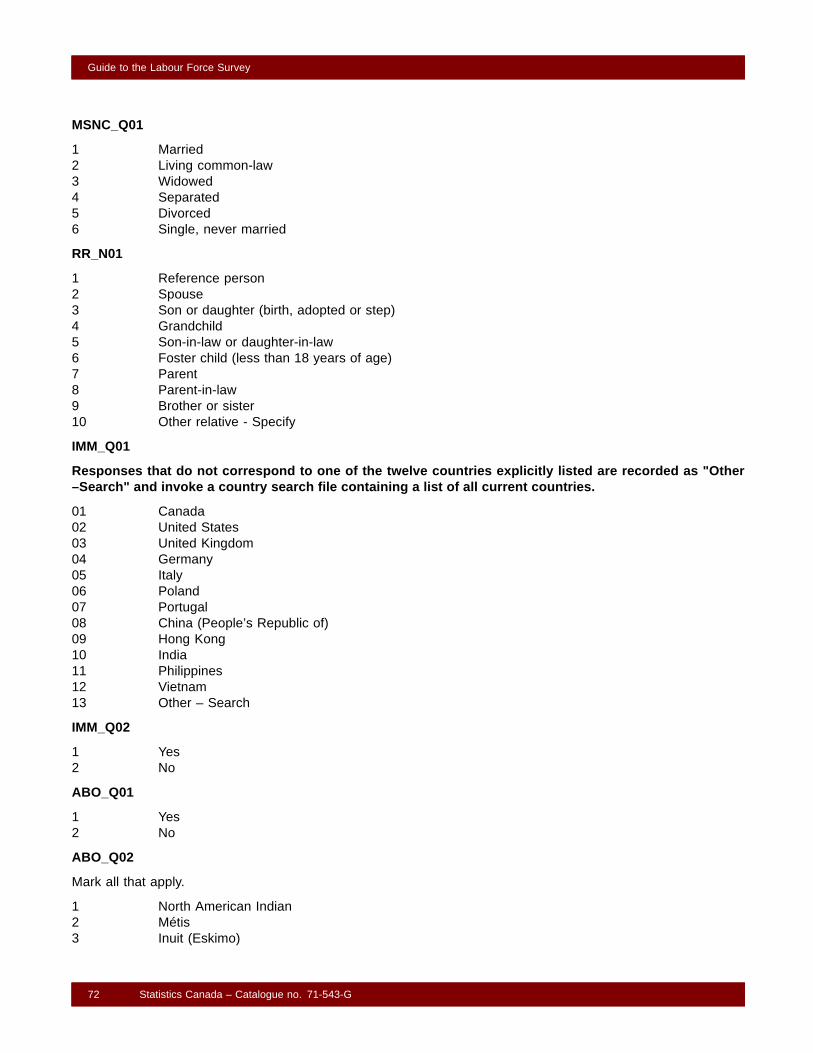
Guide to the Labour Force Survey
MSNC_Q01
1 Married2 Living common-law3 Widowed4 Separated5 Divorced6 Single, never married
RR_N01
1 Reference person2 Spouse3 Son or daughter (birth, adopted or step)4 Grandchild5 Son-in-law or daughter-in-law6 Foster child (less than 18 years of age)7 Parent8 Parent-in-law9 Brother or sister10 Other relative - Specify
IMM_Q01
Responses that do not correspond to one of the twelve countries explicitly listed are recorded as "Other–Search" and invoke a country search file containing a list of all current countries.
01 Canada02 United States03 United Kingdom04 Germany05 Italy06 Poland07 Portugal08 China (People’s Republic of)09 Hong Kong10 India11 Philippines12 Vietnam13 Other – Search
IMM_Q02
1 Yes2 No
ABO_Q01
1 Yes2 No
ABO_Q02
Mark all that apply.
1 North American Indian2 Métis3 Inuit (Eskimo)
72 Statistics Canada – Catalogue no. 71-543-G
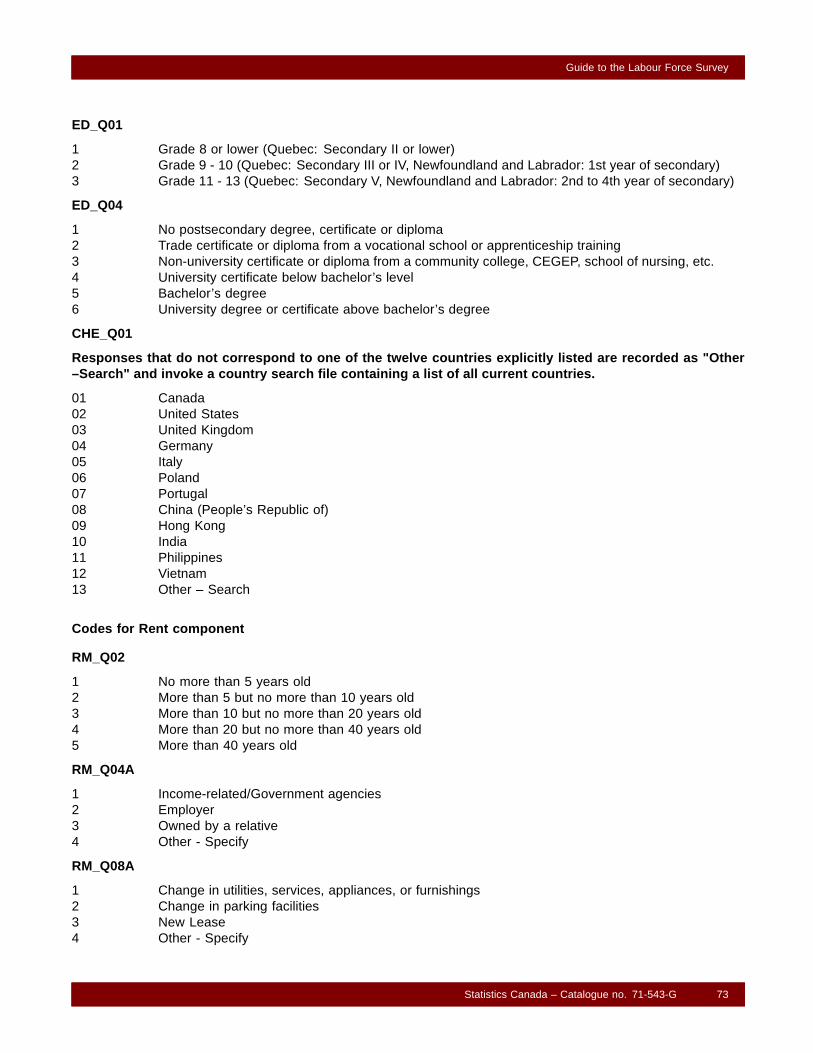
Guide to the Labour Force Survey
ED_Q01
1 Grade 8 or lower (Quebec: Secondary II or lower)2 Grade 9 - 10 (Quebec: Secondary III or IV, Newfoundland and Labrador: 1st year of secondary)3 Grade 11 - 13 (Quebec: Secondary V, Newfoundland and Labrador: 2nd to 4th year of secondary)
ED_Q04
1 No postsecondary degree, certificate or diploma2 Trade certificate or diploma from a vocational school or apprenticeship training3 Non-university certificate or diploma from a community college, CEGEP, school of nursing, etc.4 University certificate below bachelor’s level5 Bachelor’s degree6 University degree or certificate above bachelor’s degree
CHE_Q01
Responses that do not correspond to one of the twelve countries explicitly listed are recorded as "Other–Search" and invoke a country search file containing a list of all current countries.
01 Canada02 United States03 United Kingdom04 Germany05 Italy06 Poland07 Portugal08 China (People’s Republic of)09 Hong Kong10 India11 Philippines12 Vietnam13 Other – Search
Codes for Rent component
RM_Q02
1 No more than 5 years old2 More than 5 but no more than 10 years old3 More than 10 but no more than 20 years old4 More than 20 but no more than 40 years old5 More than 40 years old
RM_Q04A
1 Income-related/Government agencies2 Employer3 Owned by a relative4 Other - Specify
RM_Q08A
1 Change in utilities, services, appliances, or furnishings2 Change in parking facilities3 New Lease4 Other - Specify
Statistics Canada – Catalogue no. 71-543-G 73

Guide to the Labour Force Survey
RM_Q10
1 Closed garage or indoor parking2 Outside parking with plug-in3 Outside parking without plug-in
RM_Q15
1 Heat - Electric2 Heat - Natural Gas3 Heat - Other Specify4 Electricity5 Cablevision6 Refrigerator7 Range8 Washer9 Dryer10 Other major appliance - Specify11 Furniture12 None of the above
Codes for Labour force information
LFI_Q100
1 Yes2 No3 Permanently unable to work
LFI_Q110 / LFI_Q300
1 Employee2 Self-employed3 Working in a family business without pay
LFI_Q130
01 Own illness or disability02 Caring for own children03 Caring for elder relative (60 years of age or older)04 Maternity or parental leave05 Other personal or family responsibilities06 Vacation07 Labour dispute (strike or lockout) (Employees only)08 Temporary layoff due to business conditions (Employees only)09 Seasonal layoff (Employees only)10 Casual job, no work available (Employees only)11 Work schedule (e.g., shift work) (Employees only)12 Self-employed, no work available (Self-employed only)13 Seasonal business (excluding employees)14 Other - Specify
74 Statistics Canada – Catalogue no. 71-543-G

Guide to the Labour Force Survey
LFI_Q131
01 Own illness or disability02 Caring for own children03 Caring for elder relative (60 years of age or older)04 Pregnancy (Females only)05 Other personal or family responsibilities06 Going to school07 Lost job, laid off or job ended (Employees only)08 Business sold or closed down (excluding employees)09 Changed residence10 Dissatisfied with job11 Retired12 Other - Specify
LFI_Q132
1 End of seasonal job2 End of temporary, term or contract job (non-seasonal)3 Casual job4 Company moved5 Company went out of business6 Business conditions (e.g., not enough work, drop in orders, retooling)7 Dismissal by employer (e.g., fired)8 Other - Specify
LFI_Q133 / LFI_Q521
1 Yes2 No3 Not sure
LFI_Q137 / LFI_Q177
1 30 or more hours per week2 Less than 30 hours per week
LFI_Q154
01 Own illness or disability02 Caring for own children03 Caring for elder relative (60 years of age or older)04 Maternity or parental leave05 Other personal or family responsibilities06 Vacation07 Labour dispute (strike or lockout)08 Temporary layoff due to business conditions09 Holiday (legal or religious)10 Weather11 Job started or ended during week12 Working short-time (e.g., due to material shortages, plant maintenance or repair, etc.)13 Other - Specify
Statistics Canada – Catalogue no. 71-543-G 75
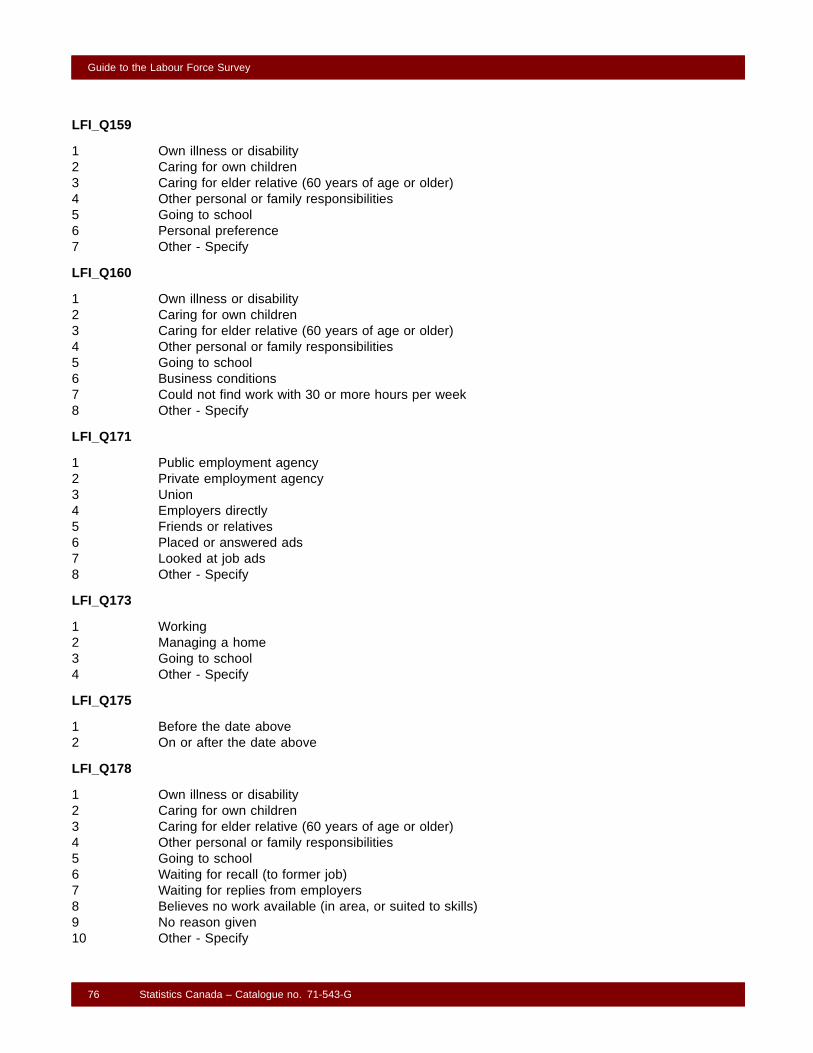
Guide to the Labour Force Survey
LFI_Q159
1 Own illness or disability2 Caring for own children3 Caring for elder relative (60 years of age or older)4 Other personal or family responsibilities5 Going to school6 Personal preference7 Other - Specify
LFI_Q160
1 Own illness or disability2 Caring for own children3 Caring for elder relative (60 years of age or older)4 Other personal or family responsibilities5 Going to school6 Business conditions7 Could not find work with 30 or more hours per week8 Other - Specify
LFI_Q171
1 Public employment agency2 Private employment agency3 Union4 Employers directly5 Friends or relatives6 Placed or answered ads7 Looked at job ads8 Other - Specify
LFI_Q173
1 Working2 Managing a home3 Going to school4 Other - Specify
LFI_Q175
1 Before the date above2 On or after the date above
LFI_Q178
1 Own illness or disability2 Caring for own children3 Caring for elder relative (60 years of age or older)4 Other personal or family responsibilities5 Going to school6 Waiting for recall (to former job)7 Waiting for replies from employers8 Believes no work available (in area, or suited to skills)9 No reason given10 Other - Specify
76 Statistics Canada – Catalogue no. 71-543-G

Guide to the Labour Force Survey
LFI_Q191
1 Own illness or disability2 Caring for own children3 Caring for elder relative (60 years of age or older)4 Other personal or family responsibilities5 Going to school6 Vacation7 Already has a job8 Other - Specify
LFI_Q204
1 Yearly2 Monthly3 Semi-monthly4 Bi-weekly5 Weekly6 Other - Specify
LFI_Q241
1 Seasonal job2 Temporary, term or contract job (non-seasonal)3 Casual job5 Other - Specify
LFI_Q260 / LFI_Q262
1 Less than 202 20 to 993 100 to 5004 Over 500
LFI_Q501
1 Full-time2 Part-time
LFI_Q502
1 Elementary, junior high school, high school or equivalent2 Community college, junior college, or CEGEP3 University4 Other - Specify
Codes for Exit component
PTC_Q02
1 ANY TIME2 Morning3 Afternoon4 Evening5 NOT morning6 NOT afternoon7 NOT evening
Statistics Canada – Catalogue no. 71-543-G 77