Quarterly Labour Force Survey - Statistics South Africa · STATISTICS SOUTH AFRICA P0211 Quarterly...
134
www.statssa.gov.za [email protected] T +27 12 310 8911 F +27 12 310 8500 Private Bag X44, Pretoria, 0001, South Africa ISIbalo House, Koch Street, Salvokop, Pretoria, 0002 Statistical release P0211 Quarterly Labour Force Survey Quarter 1: 2017 Embargoed until: 01 June 2017 12:30 ENQUIRIES: FORTHCOMING ISSUE: EXPECTED RELEASE DATE User Information Services Quarter 2:2017 July 2017 Tel: 012 310 8600/4892/8390
Transcript of Quarterly Labour Force Survey - Statistics South Africa · STATISTICS SOUTH AFRICA P0211 Quarterly...
www.statssa.gov.za
T +27 12 310 8911
F +27 12 310 8500
Private Bag X44, Pretoria, 0001, South Africa
ISIbalo House, Koch Street, Salvokop, Pretoria, 0002
Statistical releaseP0211
Quarterly Labour Force Survey
Quarter 1: 2017
Embargoed until: 01 June 2017
12:30
ENQUIRIES: FORTHCOMING ISSUE: EXPECTED RELEASE DATE User Information Services Quarter 2:2017 July 2017 Tel: 012 310 8600/4892/8390
STATISTICS SOUTH AFRICA P0211
Quarterly Labour Force Survey, Quarter 1, 2017
ii
Contents
Page
Introduction ................................................................................................................................................................... 1
2. Highlights of the results ................................................................................................................................................ 1
3. Employment .................................................................................................................................................................. 2
3.1 Conditions of employment for employees .................................................................................................................. 8
4. Unemployment .............................................................................................................................................................. 9
5. Summary of labour market measures at a glance, Q1: 2017 .................................................................................... 12
6. Other labour market trends ......................................................................................................................................... 13
6.1 Year-on-year changes .............................................................................................................................................. 13
6.2 Trends in unemployment rate ................................................................................................................................... 14
7. Key differences between the Quarterly labour force survey (QLFS) and the Quarterly employment survey (QES) . 15
8.1 Response details ...................................................................................................................................................... 17
8.2 Survey requirements and design .............................................................................................................................. 17
8.3 Sample rotation ......................................................................................................................................................... 18
8.4 Weighting ................................................................................................................................................................. 18
8.5 Non-response adjustment ......................................................................................................................................... 18
8.6 Final survey weights ................................................................................................................................................. 18
8.7 Estimation ................................................................................................................................................................. 18
8.8 Reliability of the survey estimates ............................................................................................................................ 19
9. Definitions ................................................................................................................................................................. 19
STATISTICS SOUTH AFRICA P0211
Quarterly Labour Force Survey, Quarter 1, 2017
iii
List of Tables
Table A: Key labour market indicators ......................................................................................................... 1
Table B: Employment by industry ................................................................................................................ 2
Table C: Employment by occupation ........................................................................................................... 4
Table D: Employment by province ............................................................................................................... 6
Table E: Employment by province and municipality ..................................................................................... 7
Table F: Unemployment rate by province .................................................................................................... 9
Table G: Unemployment rate by metropolitan municipality .........................................................................10
Table H: Key differences between the QLFS and the QES .........................................................................16
Table I: Response rates by province and metropolitan area .......................................................................17
STATISTICS SOUTH AFRICA P0211
Quarterly Labour Force Survey, Quarter 1, 2017
iv
List of Figures
Figure 1: Quarter-to-quarter changes in employment, Q1:2010 to Q1:2017 ............................................................. 2
Figure 2: Quarter-to-quarter changes in employment by sector, Q1: 2010 to Q1: 2017 ........................................... 3
Figure 3: Quarter-to-quarter and year-on-year changes in the formal sector by industry ......................................... 3
Figure 4: Quarter-to-quarter and year-on-year changes in the informal sector by industry ...................................... 4
Figure 5: Share of employed men by occupation and population group, Q1: 2016 and Q1: 2017 ........................... 5
Figure 6: Share of employed women by occupation and population group, Q1: 2016 and Q1: 2017 ...................... 5
Figure 7: Share of employed persons by education and population group, Q1: 2016 and Q1: 2017 ....................... 6
Figure 8: Quarter-to-quarter changes in nature of employment contract .................................................................. 8
Figure 9: Year-on-year changes in nature of employment contract .......................................................................... 8
Figure 10: Quarter-to-quarter changes in unemployment, Q1: 2010 to Q1: 2017 .................................................... 9
Figure 11: NEET rates for youth aged 15-24 years by sex and age group, Q1: 2016 and Q1: 2017 ..................... 11
Figure 12: Year-on-year changes in total employment, Q1: 2009 to Q1: 2017. ...................................................... 13
Figure 13: Year-on-year changes in formal-sector employment, Q1: 2009 to Q1: 2017 ........................................ 13
Figure 14: Year-on-year changes in informal-sector employment, Q1: 2009 to Q1: 2017 ...................................... 13
Figure 15: Unemployment rate by sex, Q1: 2008 to Q1: 2017 ................................................................................ 13
Figure 16: Unemployment rate by education status, Q1: 2008 to Q1: 2017 ........................................................... 14
Figure 17: Formal sector employment trends in QLFS and QES, Q1: 2010 to Q4: 2016 ....................................... 16
STATISTICS SOUTH AFRICA P0211
Quarterly Labour Force Survey, Quarter 1, 2017
v
Appendix 1
Table 1: Population of working age (15–64 years) ......................................................................................................... 21
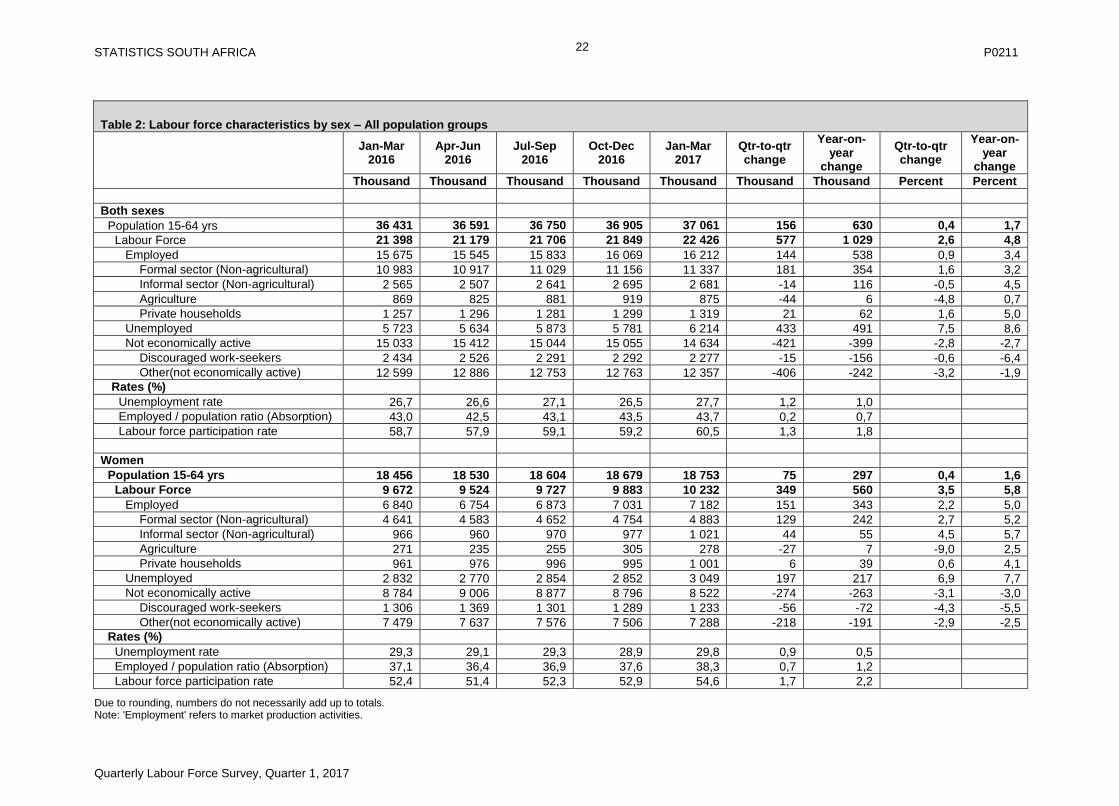
Table 2: Labour force characteristics by sex – All population groups ............................................................................ 22
Table 2.1: Labour force characteristics by population group .......................................................................................... 24
Table 2.2: Labour force characteristics by age group .................................................................................................... 26
Table 2.3: Labour force characteristics by province and metro ...................................................................................... 28
Table 2.4: Labour force characteristics by sex – Expanded definition of unemployment .............................................. 40
Table 2.5: Labour force characteristics by population group – Expanded definition of unemployment ......................... 42
Table 2.6: Labour force characteristics by age group – Expanded definition of unemployment .................................... 44
Table 2.7: Labour force characteristics by province and metro – Expanded definition of unemployment ..................... 46
Table 3.1: Employed by industry and sex – South Africa ............................................................................................... 54
Table 3.2: Employed by industry and province ............................................................................................................... 55
Table 3.3: Employed by sector and industry – South Africa ........................................................................................... 59
Table 3.4: Employed by province and sector ................................................................................................................. 60
Table 3.5: Employed by sex and occupation – South Africa .......................................................................................... 65
Table 3.6: Employed by sex and status in employment – South Africa ......................................................................... 66
Table 3.7: Employed by sex and usual hours of work – South Africa ............................................................................ 67
Table 3.8: Conditions of employment – South Africa ..................................................................................................... 68
Table 3.9: Time-related underemployment – South Africa ............................................................................................. 74
Table 4: Characteristics of the unemployed – South Africa............................................................................................ 75
Table 5: Characteristics of the not economically active – South Africa .......................................................................... 77
Table 6: Sociodemographic characteristics – South Africa ............................................................................................ 78
Table 7: Profile of those not in education and not in employment – South Africa .......................................................... 81
Table 8: Involvement in non-market activities and labour market status by province .................................................... 82
Appendix 2
Table 2A: Sampling variability for labour force characteristics by sex ........................................................................... 86
Table 2.1A: Sampling variability for labour force characteristics by population group ................................................... 88
Table 2.3A: Sampling variability for labour force characteristics by province ................................................................ 90
Table 3.1A: Sampling variability for the employed by industry and sex ....................................................................... 102
Table 3.4A: Sampling variability for the employed by province and sector .................................................................. 103
Table 3.5A: Sampling variability for the employed by sex and occupation .................................................................. 107
Table 2B: Sampling variability for labour force characteristics by sex ......................................................................... 108
Table 2.1B: Sampling variability for labour force characteristics by population group ................................................. 110
Table 2.3B: Sampling variability for labour force characteristics by province .............................................................. 112
Table 3.1B: Sampling variability for the employed by industry and sex ....................................................................... 124
Table 3.4B: Sampling variability for the employed by province and sector .................................................................. 125
Table 3.5B: Sampling variability for the employed by sex and occupation .................................................................. 129
STATISTICS SOUTH AFRICA P0211
Quarterly Labour Force Survey, Quarter 1, 2017
1
Introduction
The Quarterly Labour Force Survey (QLFS) is a household-based sample survey conducted by Statistics South
Africa (Stats SA). It collects data on the labour market activities of individuals aged 15 years and above who live in
South Africa. However, this report only covers labour market activities of persons aged 15–64 years.
This report presents the key findings of the QLFS conducted from January to March 2017 (Q1: 2017).
2. Highlights of the results
Table A: Key labour market indicators
Jan-Mar 2016
Oct-Dec 2016
Jan-Mar 2017
Qtr-to-qtr change
Year-on-year
change Qtr-to-qtr change
Year-on-year
change
Thousand Per cent
Population aged 15–64 yrs 36 431 36 905 37 061 156 630 0,4 1,7
Labour force 21 398 21 849 22 426 577 1 029 2,6 4,8
Employed 15 675 16 069 16 212 144 538 0,9 3,4
Formal sector (non-agricultural) 10 983 11 156 11 337 181 354 1,6 3,2
Informal sector (non-agricultural) 2 565 2 695 2 681 -14 116 -0,5 4,5
Agriculture 869 919 875 -44 6 -4,8 0,7
Private households 1 257 1 299 1 319 21 62 1,6 5,0
Unemployed 5 723 5 781 6 214 433 491 7,5 8,6
Not economically active 15 033 15 055 14 634 -421 -399 -2,8 -2,7
Discouraged work-seekers 2 434 2 292 2 277 -15 -156 -0,6 -6,4
Other (not economically active) 12 599 12 763 12 357 -406 -242 -3,2 -1,9
Rates (%)
Unemployment rate 26,7 26,5 27,7 1,2 1,0
Employment/population ratio
(absorption rate) 43,0 43,5 43,7 0,2 0,7
Labour force participation rate 58,7 59,2 60,5 1,3 1,8
Due to rounding, numbers do not necessarily add up to totals.
The working age population grew by 156 000 or 0,4 per cent while the labour force grew by 577 000 persons in the
first quarter of 2017 compared to the last quarter of 2016. Both employment and unemployment increased in the
first quarter, resulting in an increase in unemployment rate to 27,7% (up by 1,2 percentage points), absorption rate
to 43,7% (up by 0,2 of a percentage point) and labour force participation to 60,5% (up by 1,3 percentage points).
The not economically active population decreased by 421 000, of which 15 000 were discouraged work-seekers.
Employment rose in two of the four sectors; formal sector employment increased by 181 000 while Private households employment increased by 21 000. Employment losses were recorded in the informal sector (14 000) and Agriculture (44 000).
Compared to the same quarter last year, employment increased by 538 000 or 3,4 percent while unemployment
grew by 491 000 or 8,6 percent. This led to an increase in the unemployment rate by 1,0 percentage point to
27,7% in Q1:2017. Between Q1:2017 and Q1: 2016 the inactive population declined by 399 000 (or 2,7 percent).
This decline was mainly driven by the Other (not economically active) population.
STATISTICS SOUTH AFRICA P0211
Quarterly Labour Force Survey, Quarter 1, 2017
2
3. Employment
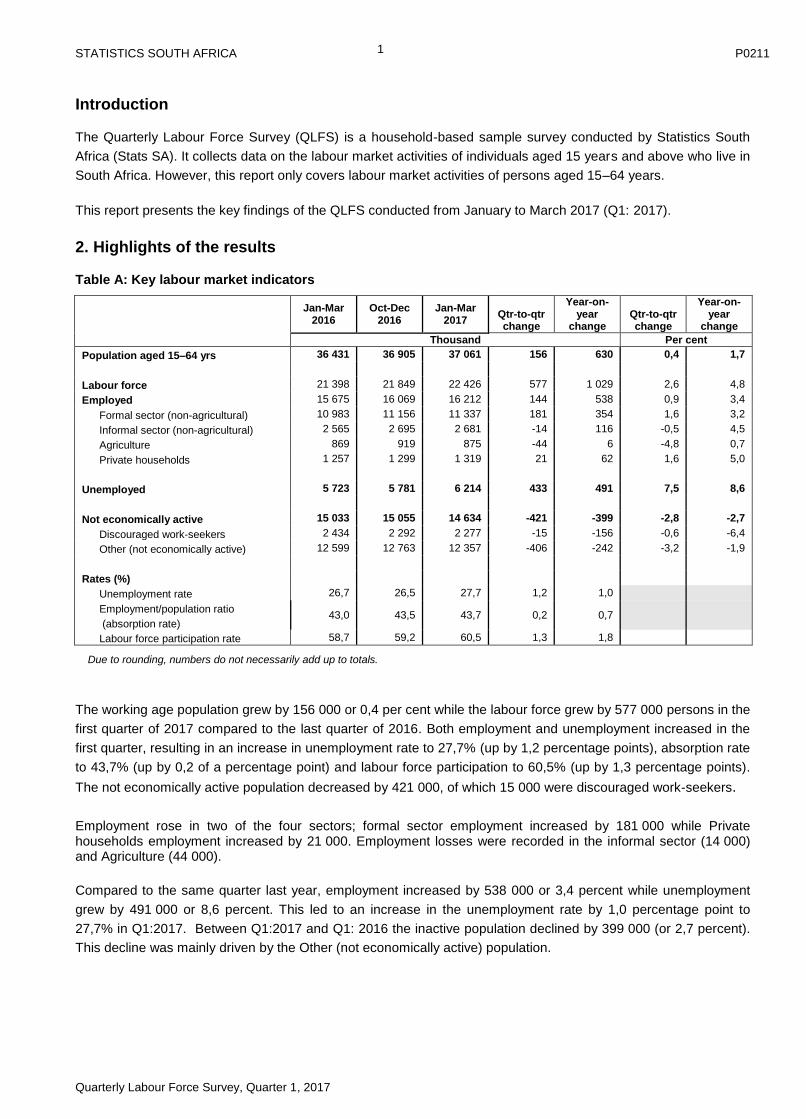
Figure 1: Quarter-to-quarter changes in employment, Q1:2010 to Q1:2017
The number of employed persons increased by 144 000 in Q1:2017 and this is the third consecutive quarterly
growth in employment.
Table B: Employment by industry
Industry
Jan-Mar 2016
Oct-Dec 2016
Jan-Mar 2017
Qtr-to-qtr
change
Year-on-year change
Qtr-to-qtr
change
Year-on-year
change
Thousand Per cent
Total* 15 675 16 069 16 212 144 538 0,9 3,4 Agriculture 869 919 875 -44 6 -4,8 0,7 Mining 471 421 447 26 -24 6,1 -5,1 Manufacturing 1 645 1 727 1 790 62 145 3,6 8,8 Utilities 110 131 145 14 35 10,8 31,6 Construction 1 362 1 483 1 505 23 143 1,5 10,5 Trade 3 158 3 222 3 207 -15 49 -0,5 1,6 Transport 901 961 965 3 63 0,3 7,0 Finance and other business services 2 227 2 329 2 378 49 152 2,1 6,8 Community and social services 3 671 3 571 3 569 -2 -101 -0,1 -2,8 Private households 1 257 1 299 1 319 21 62 1,6 5,0
*Note: Total includes ‘other’ industry. Due to rounding, numbers do not necessarily add up to totals.
Table B shows that the quarterly employment gains of 144 000 in Q1: 2017 were driven by increases in seven of
the ten industries. The largest increases were recorded in Manufacturing (62 000), Finance and other business
services (49 000), Mining (26 000) and Construction (23 000). The number of employed persons decreased in
three industries, namely; Agriculture (44 000), Trade (15 000) and Community and social services (2 000).
The year-on-year employment gains of 538 000 were largely contributed by Finance & other business services
(152 000), Manufacturing (145 000) and Construction (143 000). Employment declines were reflected in two of the
ten industries namely Community & social services (101 000) and Mining (24 000).
STATISTICS SOUTH AFRICA P0211
Quarterly Labour Force Survey, Quarter 1, 2017
3
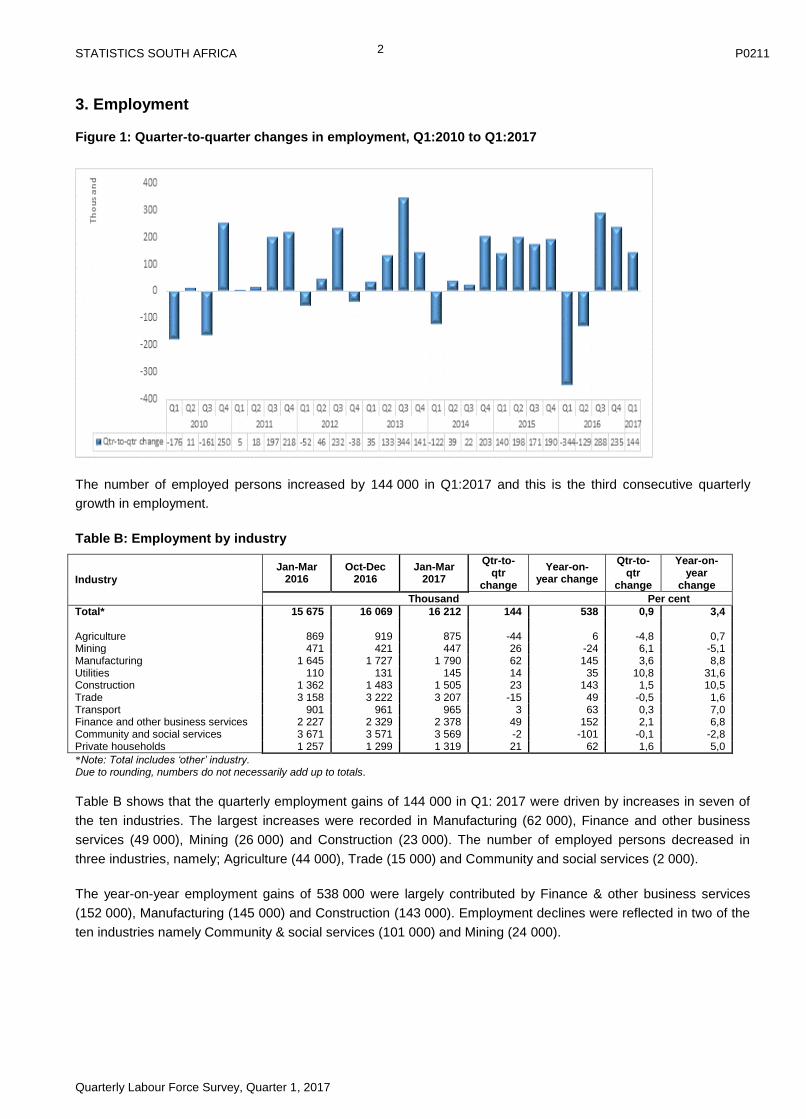
Figure 2: Quarter-to-quarter changes in employment by sector, Q1: 2010 to Q1: 2017
Employment gains were observed in the formal sector for three consecutive quarters since Q3:2016 and in the first
quarter of 2017 formal sector employment by 181 000. Following two quarters of employment gains in the informal
sector, 14 000 jobs were lost in the sector in Q1:2017.
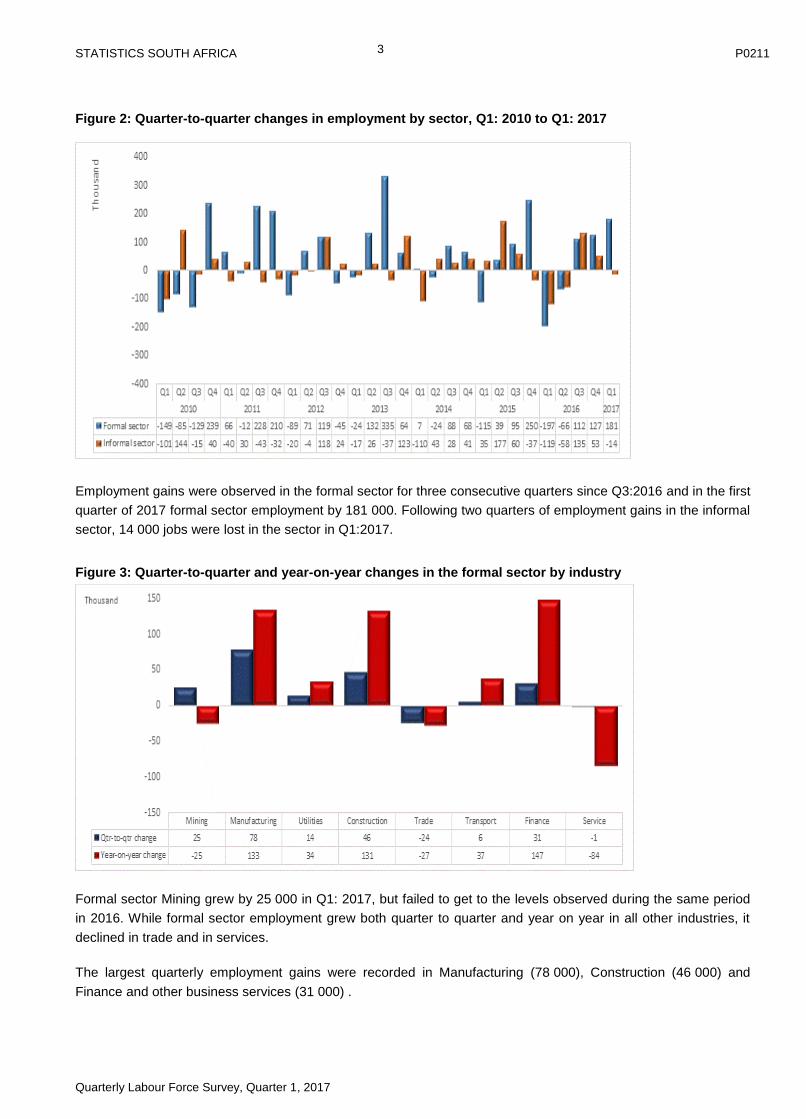
Figure 3: Quarter-to-quarter and year-on-year changes in the formal sector by industry
Formal sector Mining grew by 25 000 in Q1: 2017, but failed to get to the levels observed during the same period
in 2016. While formal sector employment grew both quarter to quarter and year on year in all other industries, it
declined in trade and in services.
The largest quarterly employment gains were recorded in Manufacturing (78 000), Construction (46 000) and
Finance and other business services (31 000) .
STATISTICS SOUTH AFRICA P0211
Quarterly Labour Force Survey, Quarter 1, 2017
4
The main contributor to annual increase in employment were Finance and other business services (147 000),
Manufacturing (133 000) and Construction (131 0000).
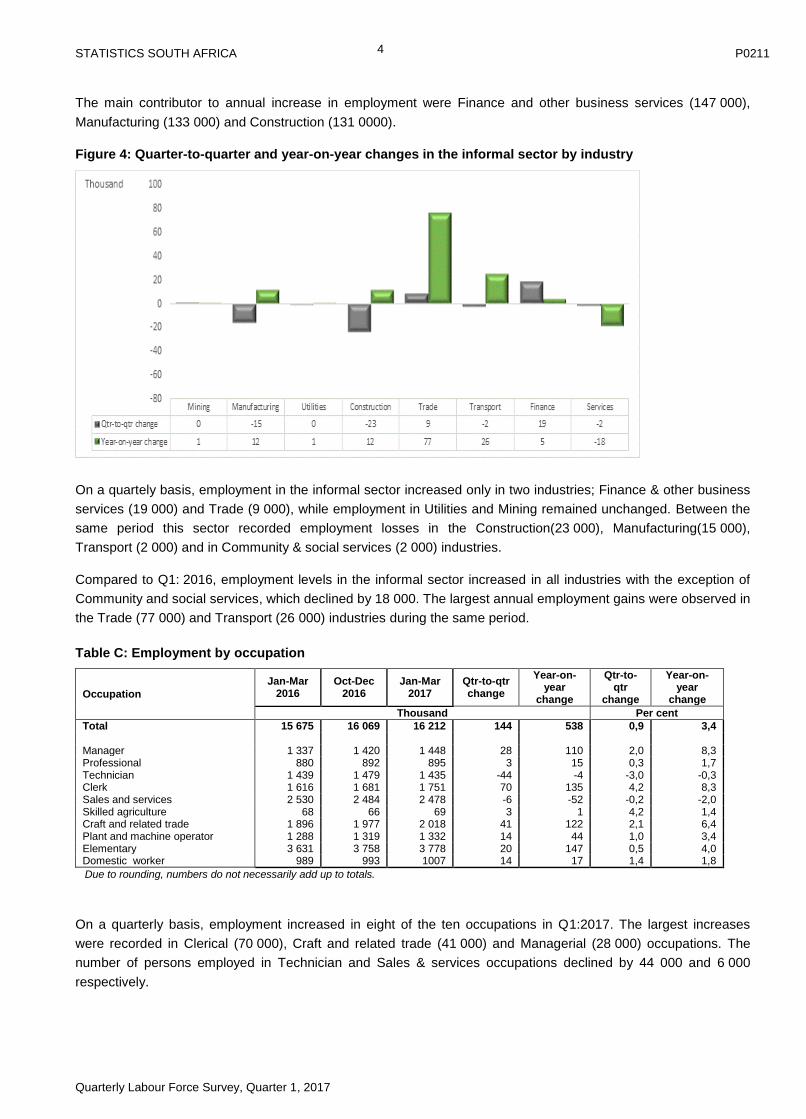
Figure 4: Quarter-to-quarter and year-on-year changes in the informal sector by industry
On a quartely basis, employment in the informal sector increased only in two industries; Finance & other business
services (19 000) and Trade (9 000), while employment in Utilities and Mining remained unchanged. Between the
same period this sector recorded employment losses in the Construction(23 000), Manufacturing(15 000),
Transport (2 000) and in Community & social services (2 000) industries.
Compared to Q1: 2016, employment levels in the informal sector increased in all industries with the exception of
Community and social services, which declined by 18 000. The largest annual employment gains were observed in
the Trade (77 000) and Transport (26 000) industries during the same period.
Table C: Employment by occupation
Occupation
Jan-Mar 2016
Oct-Dec 2016
Jan-Mar 2017
Qtr-to-qtr change
Year-on-year
change
Qtr-to-qtr
change
Year-on-year
change
Thousand Per cent
Total 15 675 16 069 16 212 144 538 0,9 3,4 Manager 1 337 1 420 1 448 28 110 2,0 8,3 Professional 880 892 895 3 15 0,3 1,7 Technician 1 439 1 479 1 435 -44 -4 -3,0 -0,3 Clerk 1 616 1 681 1 751 70 135 4,2 8,3 Sales and services 2 530 2 484 2 478 -6 -52 -0,2 -2,0 Skilled agriculture 68 66 69 3 1 4,2 1,4 Craft and related trade 1 896 1 977 2 018 41 122 2,1 6,4 Plant and machine operator 1 288 1 319 1 332 14 44 1,0 3,4 Elementary 3 631 3 758 3 778 20 147 0,5 4,0 Domestic worker 989 993 1007 14 17 1,4 1,8
Due to rounding, numbers do not necessarily add up to totals.
On a quarterly basis, employment increased in eight of the ten occupations in Q1:2017. The largest increases
were recorded in Clerical (70 000), Craft and related trade (41 000) and Managerial (28 000) occupations. The
number of persons employed in Technician and Sales & services occupations declined by 44 000 and 6 000
respectively.
STATISTICS SOUTH AFRICA P0211
Quarterly Labour Force Survey, Quarter 1, 2017
5
Year-on-year changes reflect that employment gains were recorded in eight of the ten occupations, with the
largest increases observed in Elementary, Clerical, Crafts and related trade and Managerial occupations (147 000,
135 000, 122 000 and 110 000 respectively). The number of employed persons in Sales & services and
Technician occupations decreased by 52 000 and 4 000 respectively.
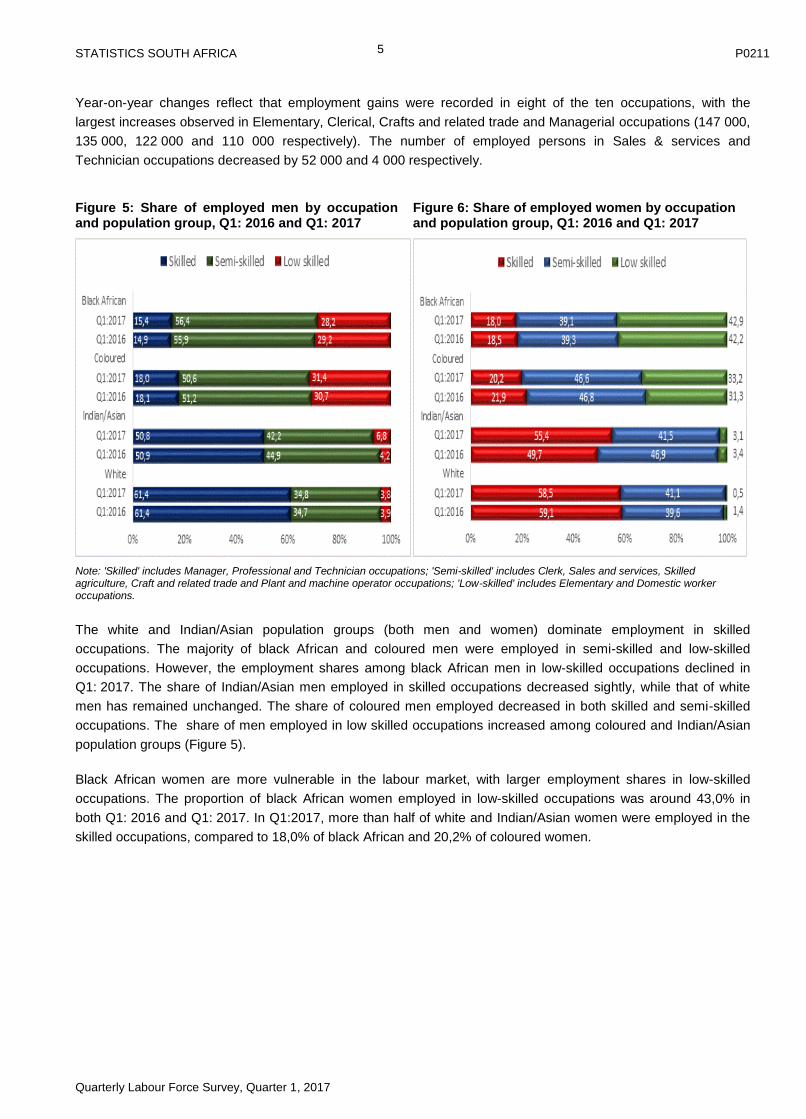
Figure 5: Share of employed men by occupation and population group, Q1: 2016 and Q1: 2017
Figure 6: Share of employed women by occupation and population group, Q1: 2016 and Q1: 2017
Note: 'Skilled' includes Manager, Professional and Technician occupations; 'Semi-skilled' includes Clerk, Sales and services, Skilled agriculture, Craft and related trade and Plant and machine operator occupations; 'Low-skilled' includes Elementary and Domestic worker occupations.
The white and Indian/Asian population groups (both men and women) dominate employment in skilled
occupations. The majority of black African and coloured men were employed in semi-skilled and low-skilled
occupations. However, the employment shares among black African men in low-skilled occupations declined in
Q1: 2017. The share of Indian/Asian men employed in skilled occupations decreased sightly, while that of white
men has remained unchanged. The share of coloured men employed decreased in both skilled and semi-skilled
occupations. The share of men employed in low skilled occupations increased among coloured and Indian/Asian
population groups (Figure 5).
Black African women are more vulnerable in the labour market, with larger employment shares in low-skilled
occupations. The proportion of black African women employed in low-skilled occupations was around 43,0% in
both Q1: 2016 and Q1: 2017. In Q1:2017, more than half of white and Indian/Asian women were employed in the
skilled occupations, compared to 18,0% of black African and 20,2% of coloured women.
STATISTICS SOUTH AFRICA P0211
Quarterly Labour Force Survey, Quarter 1, 2017
6
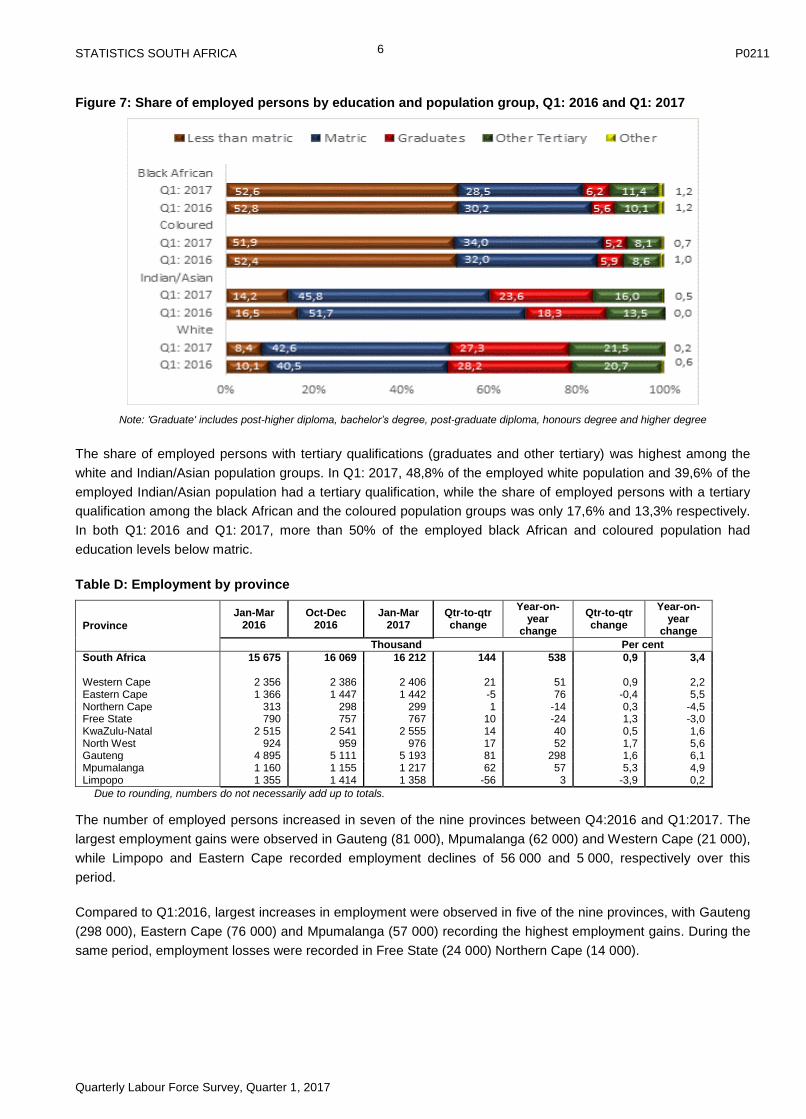
Figure 7: Share of employed persons by education and population group, Q1: 2016 and Q1: 2017
Note: 'Graduate' includes post-higher diploma, bachelor’s degree, post-graduate diploma, honours degree and higher degree
The share of employed persons with tertiary qualifications (graduates and other tertiary) was highest among the
white and Indian/Asian population groups. In Q1: 2017, 48,8% of the employed white population and 39,6% of the
employed Indian/Asian population had a tertiary qualification, while the share of employed persons with a tertiary
qualification among the black African and the coloured population groups was only 17,6% and 13,3% respectively.
In both Q1: 2016 and Q1: 2017, more than 50% of the employed black African and coloured population had
education levels below matric.
Table D: Employment by province
Province
Jan-Mar 2016
Oct-Dec 2016
Jan-Mar 2017
Qtr-to-qtr change
Year-on-year
change
Qtr-to-qtr change
Year-on-year
change
Thousand Per cent
South Africa 15 675 16 069 16 212 144 538 0,9 3,4 Western Cape 2 356 2 386 2 406 21 51 0,9 2,2 Eastern Cape 1 366 1 447 1 442 -5 76 -0,4 5,5 Northern Cape 313 298 299 1 -14 0,3 -4,5 Free State 790 757 767 10 -24 1,3 -3,0 KwaZulu-Natal 2 515 2 541 2 555 14 40 0,5 1,6 North West 924 959 976 17 52 1,7 5,6 Gauteng 4 895 5 111 5 193 81 298 1,6 6,1 Mpumalanga 1 160 1 155 1 217 62 57 5,3 4,9 Limpopo 1 355 1 414 1 358 -56 3 -3,9 0,2
Due to rounding, numbers do not necessarily add up to totals.
The number of employed persons increased in seven of the nine provinces between Q4:2016 and Q1:2017. The
largest employment gains were observed in Gauteng (81 000), Mpumalanga (62 000) and Western Cape (21 000),
while Limpopo and Eastern Cape recorded employment declines of 56 000 and 5 000, respectively over this
period.
Compared to Q1:2016, largest increases in employment were observed in five of the nine provinces, with Gauteng
(298 000), Eastern Cape (76 000) and Mpumalanga (57 000) recording the highest employment gains. During the
same period, employment losses were recorded in Free State (24 000) Northern Cape (14 000).
STATISTICS SOUTH AFRICA P0211
Quarterly Labour Force Survey, Quarter 1, 2017
7
Table E: Employment by province and municipality
Province and municipality
Jan-Mar 2016
Oct-Dec 2016
Jan-Mar 2017
Qtr-to-qtr change
Year-on-year
change
Qtr-to-qtr change
Year-on-year
change
Thousand Per cent
South Africa 15 675 16 069 16 212 144 538 0,9 3,4
Western Cape 2 356 2 386 2 406 21 51 0,9 2,2 Non-metro 839 903 895 -8 56 -0,9 6,7 City of Cape Town 1 516 1482 1511 29 -5 1,9 -0,4
Eastern Cape 1 366 1447 1442 -5 76 -0,4 5,5 Non-metro 787 842 825 -17 38 -2,0 4,8 Buffalo City 232 239 257 18 25 7,7 11,0 Nelson Mandela Bay 347 367 360 -7 13 -2,0 3,6
Free State 790 757 767 10 -24 1,3 -3,0
Non-metro 540 523 534 11 -5 2,1 -1,0 Mangaung 251 234 232 -2 -18 -0,6 -7,2
KwaZulu-Natal 2 515 2541 2555 14 40 0,5 1,6
Non-metro 1 413 1384 1377 -6 -36 -0,5 -2,5 eThekwini 1 102 1157 1178 20 76 1,7 6,9
Gauteng 4 895 5111 5193 81 298 1,6 6,1
Non-metro 594 583 624 40 30 6,9 5,0 Ekurhuleni 1 145 1264 1296 32 152 2,5 13,3 City of Johannesburg 1 926 1995 1992 -3 66 -0,1 3,4 City of Tshwane 1 231 1269 1281 12 50 0,9 4,0
Other* 3 752 3826 3850 24 97 0,6 2,6
*Note: 'Other' includes Northern Cape, North West, Mpumalanga and Limpopo. These provinces do not have metropolitan municipalities.
Between Q4: 2016 and Q1: 2017, employment levels increased in all metropolitan municipalities, with the
exception of, Nelson Mandela Bay, City of Johannesburg and Mangaung metros, where the number of employed
persons declined by 7 000, 3 000 and 2 000 respectively. Ekurhuleni and City of Cape Town recorded the highest
gains in employment at 32 000 and 29 000, respectively.
Annual employment gains were observed in six metros, with the largest increase in Ekurhuleni (152 000) followed
by eThekwini (76 000) and City of Johannesburg (66 000). Compared to the same period last year, employment
decreases were recorded in two metropolitan municipalities, namely Mangaung (18 000) and in City of Cape Town
(5 000).
STATISTICS SOUTH AFRICA P0211
Quarterly Labour Force Survey, Quarter 1, 2017
8
3.1 Conditions of employment for employees
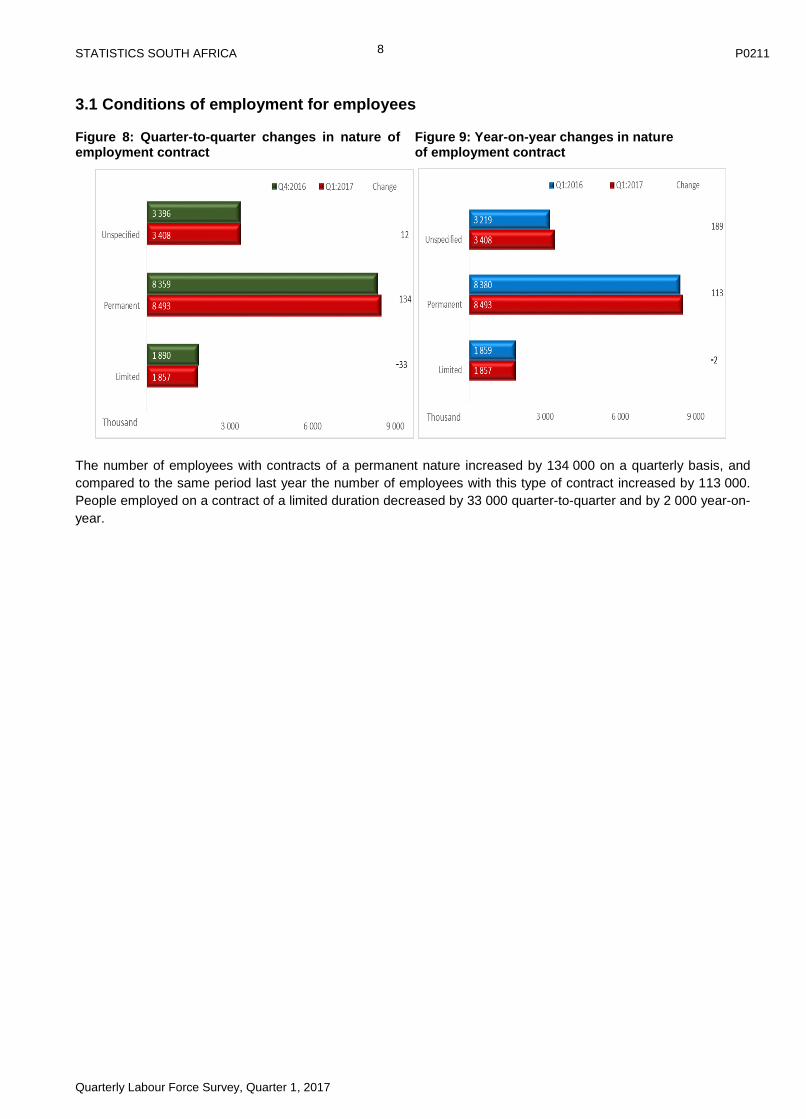
Figure 8: Quarter-to-quarter changes in nature of employment contract
Figure 9: Year-on-year changes in nature of employment contract
The number of employees with contracts of a permanent nature increased by 134 000 on a quarterly basis, and
compared to the same period last year the number of employees with this type of contract increased by 113 000.
People employed on a contract of a limited duration decreased by 33 000 quarter-to-quarter and by 2 000 year-on-
year.
STATISTICS SOUTH AFRICA P0211
Quarterly Labour Force Survey, Quarter 1, 2017
9
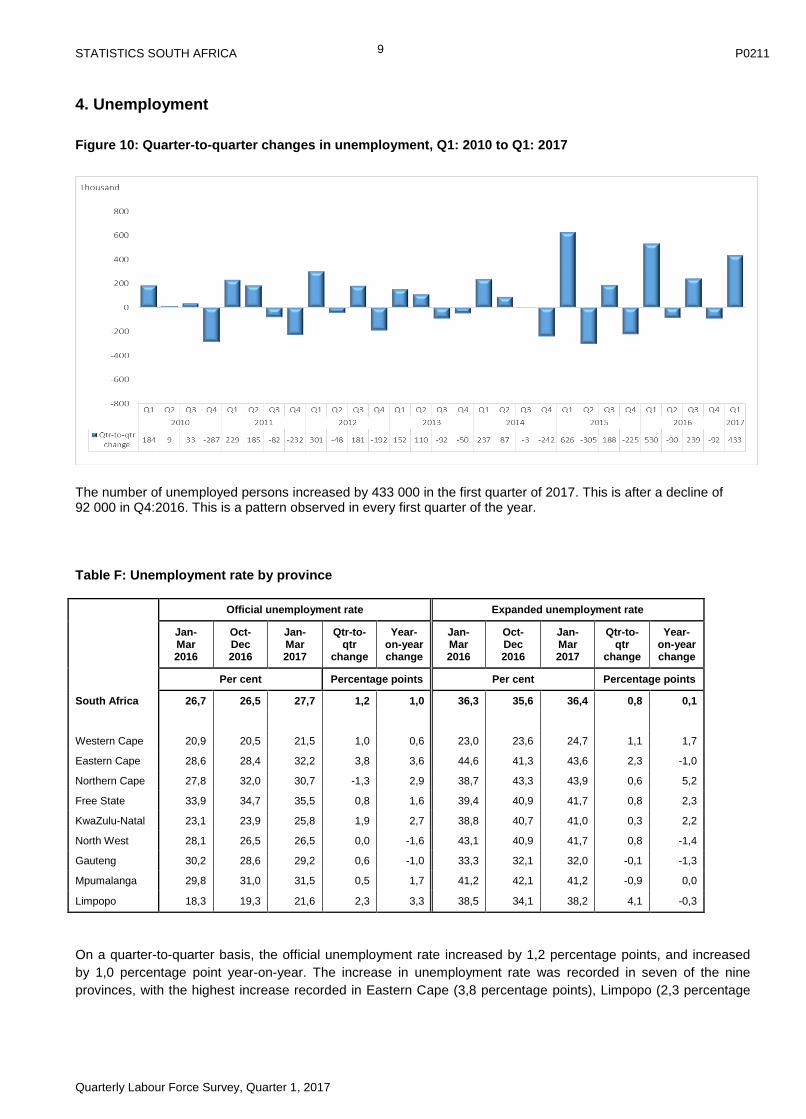
4. Unemployment
Figure 10: Quarter-to-quarter changes in unemployment, Q1: 2010 to Q1: 2017
The number of unemployed persons increased by 433 000 in the first quarter of 2017. This is after a decline of 92 000 in Q4:2016. This is a pattern observed in every first quarter of the year.
Table F: Unemployment rate by province
Official unemployment rate Expanded unemployment rate
Jan-Mar 2016
Oct-Dec 2016
Jan-Mar 2017
Qtr-to-qtr
change
Year-on-year change
Jan-Mar 2016
Oct-Dec 2016
Jan-Mar 2017
Qtr-to-qtr
change
Year-on-year change
Per cent Percentage points Per cent Percentage points
South Africa 26,7 26,5 27,7 1,2 1,0 36,3 35,6 36,4 0,8 0,1
Western Cape 20,9 20,5 21,5 1,0 0,6 23,0 23,6 24,7 1,1 1,7
Eastern Cape 28,6 28,4 32,2 3,8 3,6 44,6 41,3 43,6 2,3 -1,0
Northern Cape 27,8 32,0 30,7 -1,3 2,9 38,7 43,3 43,9 0,6 5,2
Free State 33,9 34,7 35,5 0,8 1,6 39,4 40,9 41,7 0,8 2,3
KwaZulu-Natal 23,1 23,9 25,8 1,9 2,7 38,8 40,7 41,0 0,3 2,2
North West 28,1 26,5 26,5 0,0 -1,6 43,1 40,9 41,7 0,8 -1,4
Gauteng 30,2 28,6 29,2 0,6 -1,0 33,3 32,1 32,0 -0,1 -1,3
Mpumalanga 29,8 31,0 31,5 0,5 1,7 41,2 42,1 41,2 -0,9 0,0
Limpopo 18,3 19,3 21,6 2,3 3,3 38,5 34,1 38,2 4,1 -0,3
On a quarter-to-quarter basis, the official unemployment rate increased by 1,2 percentage points, and increased
by 1,0 percentage point year-on-year. The increase in unemployment rate was recorded in seven of the nine
provinces, with the highest increase recorded in Eastern Cape (3,8 percentage points), Limpopo (2,3 percentage

STATISTICS SOUTH AFRICA P0211
Quarterly Labour Force Survey, Quarter 1, 2017
10
points) and KwaZulu-Natal (1,9 percentage points). Northern Cape was the only province that recorded a
decrease in the official unemployment rate (1,3 percentage points).
Compared to Q4:2016 the expanded unemployment rate increased by 0,8 of a percentage point in Q1:2017 to
36,4%. The expanded unemployment rate increased in seven of the nine provinces, with Limpopo (4,1), Eastern
Cape (2,3) and Western Cape (1,1) recording the largest increases. Both Mpumalanga and Gauteng provinces
recorded a decrease of 0,1 and 0,9 of a percentage point respectively in the expanded unemployment rate.
Table G: Unemployment rate by metropolitan municipality
Official unemployment rate Expanded unemployment rate
Jan-Mar 2016
Oct-Dec 2016
Jan-Mar 2017
Qtr-to-qtr
change
Year-on-year
change
Jan-Mar 2016
Oct-Dec 2016
Jan-Mar 2017
Qtr-to-qtr
change
Year-on-year
change
Per cent Percentage
points Per cent
Percentage points
South Africa 26,7 26,5 27,7 1,2 1,0 36,3 35,6 36,4 0,8 0,1
Western Cape 20,9 20,5 21,5 1,0 0,6 23,0 23,6 24,7 1,1 1,7
Non-metro 20,5 14,0 18,8 4,8 -1,7 25,1 20,7 24,2 3,5 -0,9
City of Cape Town 21,1 23,9 23,0 -0,9 2,0 21,8 25,3 25,1 -0,2 3,3
Eastern Cape 28,6 28,4 32,2 3,8 3,6 44,6 41,3 43,6 2,3 -1,0
Non-metro 27,6 26,3 33,8 7,5 6,2 50,9 46,3 50,2 3,9 -0,7
Buffalo City 24,1 33,4 29,5 -3,9 5,4 31,8 36,1 32,4 -3,7 0,6
Nelson Mandela Bay
33,3 29,6 30,2 0,6 -3,1 33,3 30,2 30,4 0,2 -2,9
Free State 33,9 34,7 35,5 0,8 1,6 39,4 40,9 41,7 0,8 2,3
Non-metro 36,2 34,8 35,9 1,1 -0,3 41,8 41,2 42,2 1,0 0,4
Mangaung 28,2 34,5 34,4 -0,1 6,2 33,5 40,1 40,7 0,6 7,2
KwaZulu-Natal 23,1 23,9 25,8 1,9 2,7 38,8 40,7 41,0 0,3 2,2
Non-metro 26,1 25,4 28,9 3,5 2,8 45,6 48,3 48,5 0,2 2,9
eThekwini 18,9 22,0 21,8 -0,2 2,9 27,3 28,0 28,7 0,7 1,4
Gauteng 30,2 28,6 29,2 0,6 -1,0 33,3 32,1 32,0 -0,1 -1,3
Non-metro 30,3 32,7 30,7 -2,0 0,4 38,5 38,5 36,6 -1,9 -1,9
Ekurhuleni 34,5 30,6 30,8 0,2 -3,7 37,4 34,4 34,0 -0,4 -3,4
City of Johannesburg
29,9 27,8 28,3 0,5 -1,6 31,2 30,2 30,2 0,0 -1,0
City of Tshwane 26,0 25,7 28,3 2,6 2,3 29,6 29,1 30,1 1,0 0,5
Note: RSA includes all nine provinces, i.e. even those without metropolitan municipalities (Northern Cape, North West, Mpumalanga and Limpopo).
In the first quarter of 2017, quarterly increases in the official unemployment rate were observed in four of the eight
metropolitan municipalities, with the highest increase being recorded in City of Tshwane (up by 2,6 percentage
points). Compared to Q1: 2016, Ekurhuleni and Nelson Mandela Bay recorded the largest decreases in the official
unemployment rate at 3,7 and 3,1 percentage points respectively.
Between Q4: 2016 and Q1: 2017, the expanded unemployment rate increased in four metropolitan municipalities,
with City of Tshwane recording the largest quarterly increases of 1,0 percentage points while Buffalo City (down
by 3,7 percentage points) recorded the largest decline in expanded unemployment rate during the same period.
STATISTICS SOUTH AFRICA P0211
Quarterly Labour Force Survey, Quarter 1, 2017
11
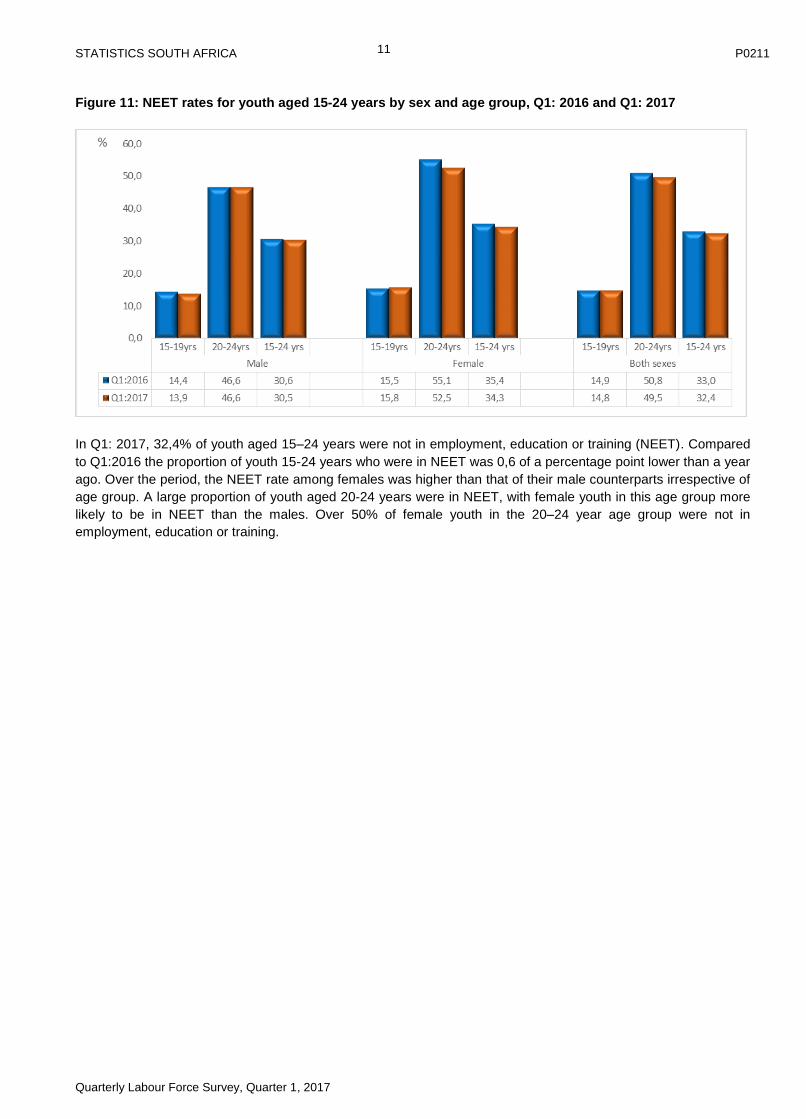
Figure 11: NEET rates for youth aged 15-24 years by sex and age group, Q1: 2016 and Q1: 2017
In Q1: 2017, 32,4% of youth aged 15–24 years were not in employment, education or training (NEET). Compared
to Q1:2016 the proportion of youth 15-24 years who were in NEET was 0,6 of a percentage point lower than a year
ago. Over the period, the NEET rate among females was higher than that of their male counterparts irrespective of
age group. A large proportion of youth aged 20-24 years were in NEET, with female youth in this age group more
likely to be in NEET than the males. Over 50% of female youth in the 20–24 year age group were not in
employment, education or training.
STATISTICS SOUTH AFRICA P0211
Quarterly Labour Force Survey, Quarter 1, 2017
12
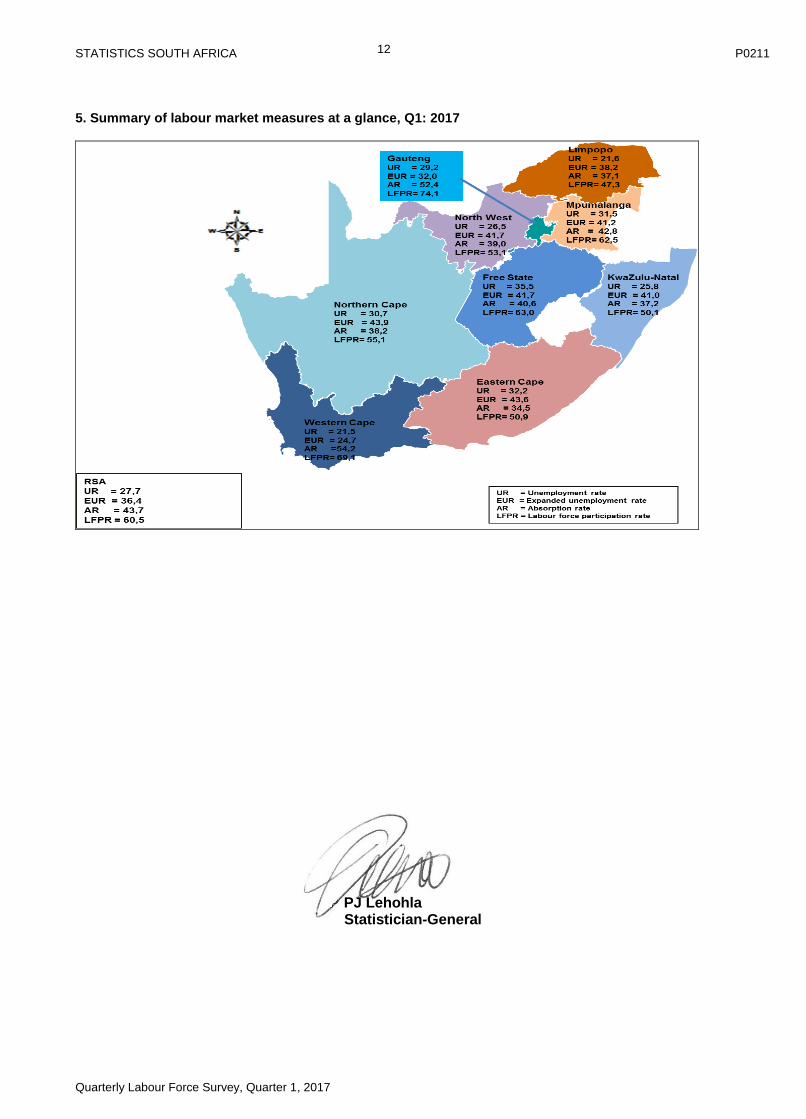
5. Summary of labour market measures at a glance, Q1: 2017
PJ Lehohla
Statistician-General
STATISTICS SOUTH AFRICA P0211
Quarterly Labour Force Survey, Quarter 1, 2017
13
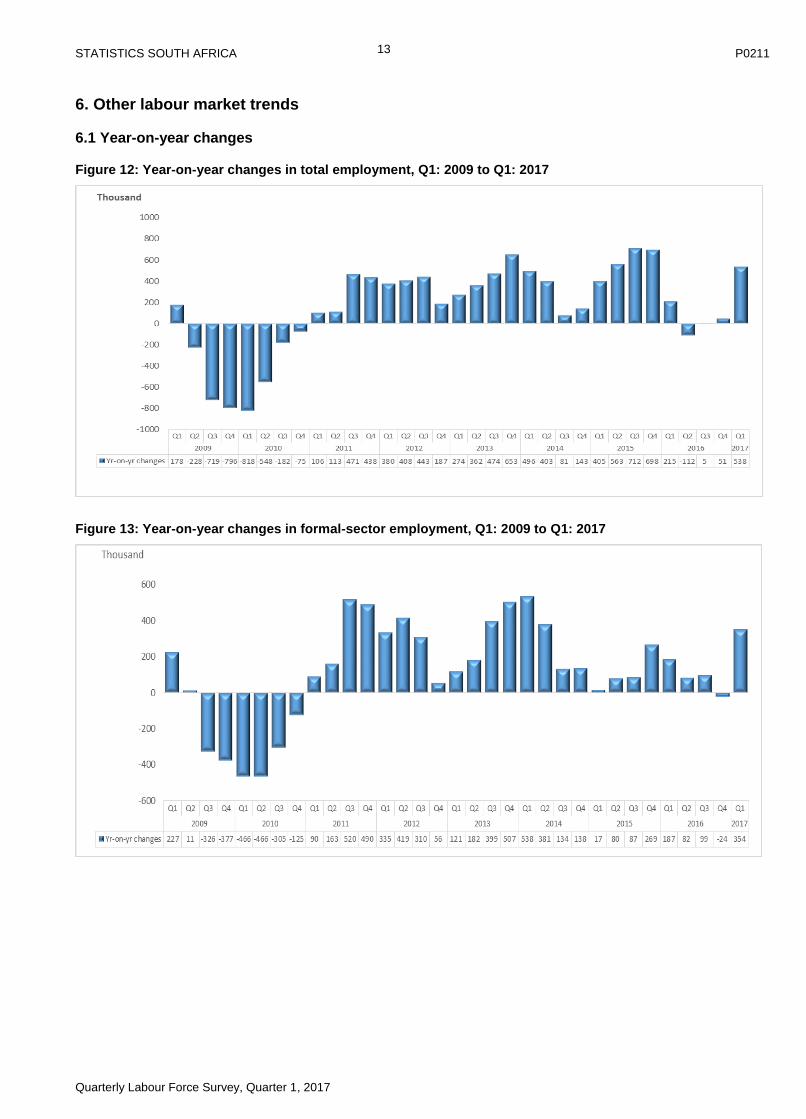
6. Other labour market trends
6.1 Year-on-year changes
Figure 12: Year-on-year changes in total employment, Q1: 2009 to Q1: 2017
Figure 13: Year-on-year changes in formal-sector employment, Q1: 2009 to Q1: 2017
STATISTICS SOUTH AFRICA P0211
Quarterly Labour Force Survey, Quarter 1, 2017
14
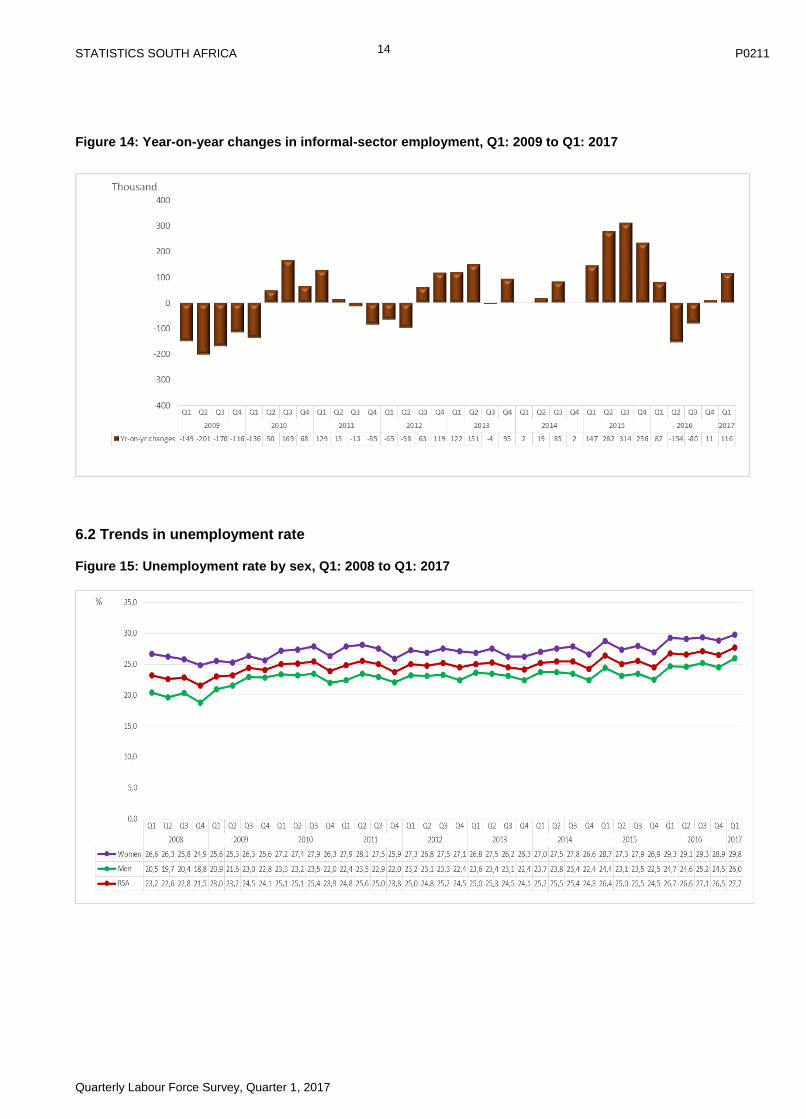
Figure 14: Year-on-year changes in informal-sector employment, Q1: 2009 to Q1: 2017
6.2 Trends in unemployment rate
Figure 15: Unemployment rate by sex, Q1: 2008 to Q1: 2017
STATISTICS SOUTH AFRICA P0211
Quarterly Labour Force Survey, Quarter 1, 2017
15
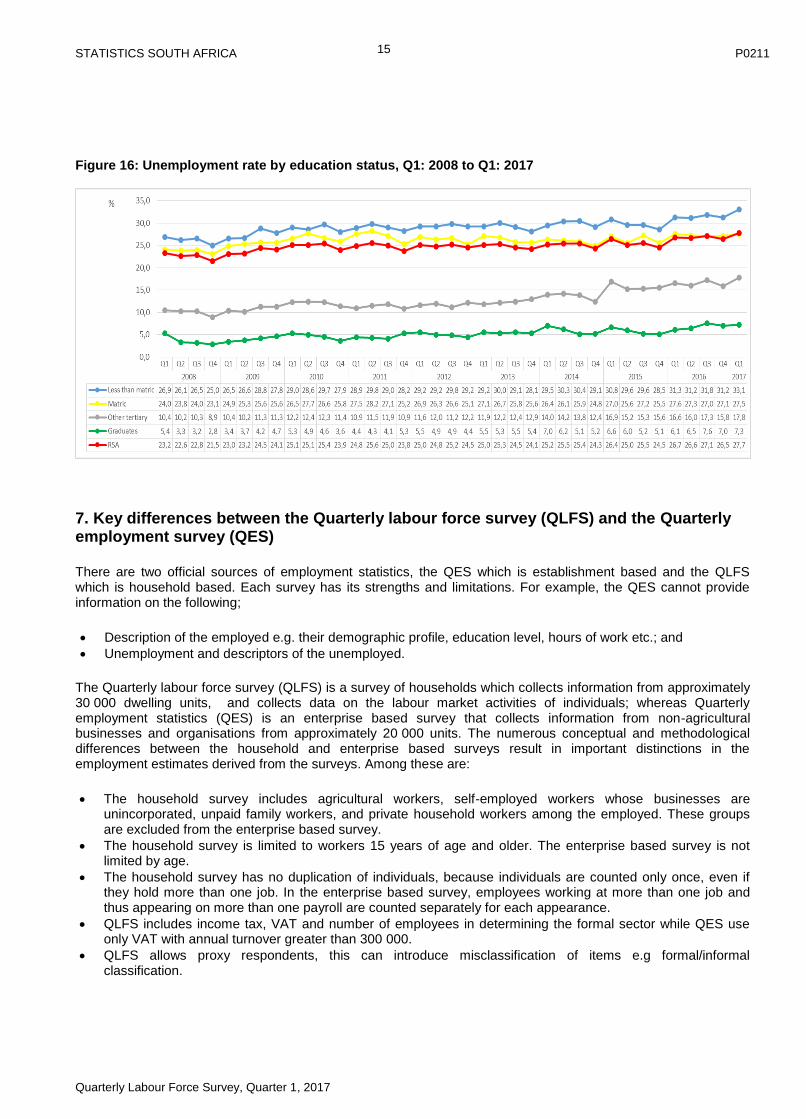
Figure 16: Unemployment rate by education status, Q1: 2008 to Q1: 2017
7. Key differences between the Quarterly labour force survey (QLFS) and the Quarterly employment survey (QES)
There are two official sources of employment statistics, the QES which is establishment based and the QLFS which is household based. Each survey has its strengths and limitations. For example, the QES cannot provide information on the following;
Description of the employed e.g. their demographic profile, education level, hours of work etc.; and
Unemployment and descriptors of the unemployed.
The Quarterly labour force survey (QLFS) is a survey of households which collects information from approximately 30 000 dwelling units, and collects data on the labour market activities of individuals; whereas Quarterly employment statistics (QES) is an enterprise based survey that collects information from non-agricultural businesses and organisations from approximately 20 000 units. The numerous conceptual and methodological differences between the household and enterprise based surveys result in important distinctions in the employment estimates derived from the surveys. Among these are:
The household survey includes agricultural workers, self-employed workers whose businesses are unincorporated, unpaid family workers, and private household workers among the employed. These groups are excluded from the enterprise based survey.
The household survey is limited to workers 15 years of age and older. The enterprise based survey is not limited by age.
The household survey has no duplication of individuals, because individuals are counted only once, even if they hold more than one job. In the enterprise based survey, employees working at more than one job and thus appearing on more than one payroll are counted separately for each appearance.
QLFS includes income tax, VAT and number of employees in determining the formal sector while QES use only VAT with annual turnover greater than 300 000.
QLFS allows proxy respondents, this can introduce misclassification of items e.g formal/informal classification.
STATISTICS SOUTH AFRICA P0211
Quarterly Labour Force Survey, Quarter 1, 2017
16
Table H: Key differences between the QLFS and the QES
QLFS QES
Coverage
Private households and workers' hostels Payroll of VAT-registered businesses
Non-institutional population (15 years and older) Employees only
Total employment (including informal sector,
Private households, Agriculture and small
businesses)
Formal sector excluding Agriculture
Sample size Quarterly sample of approximately 30 000
dwellings in which households reside
Quarterly sample of 20 000 non-agricultural formal-
sector businesses
Reference period One week prior to the interview Payroll on the last day of the quarter
Standard Industrial Classification (SIC)
All industries Excluding Agriculture and Private households
Formal sector definition (excluding Agriculture and Private households)
Employers and own-account workers registered
for VAT or income tax Employees on payroll of VAT-registered businesses
Employees paying income tax and those not
paying tax but working in firms with five or more
workers
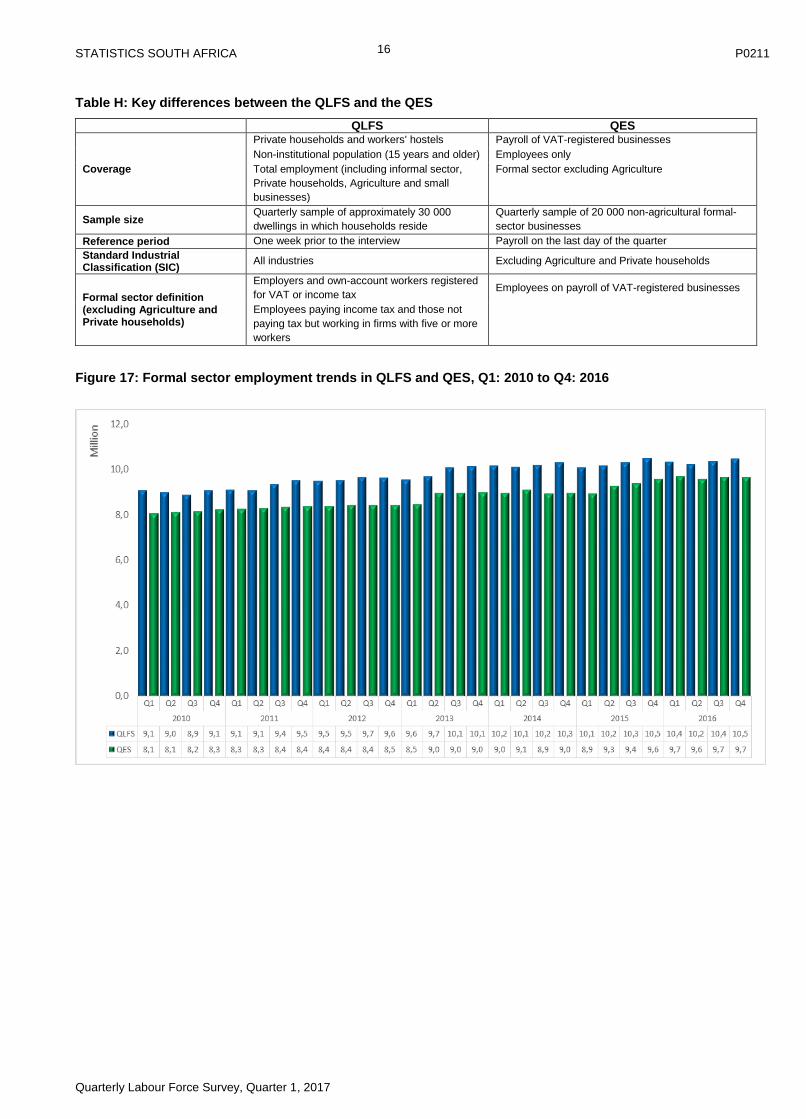
Figure 17: Formal sector employment trends in QLFS and QES, Q1: 2010 to Q4: 2016
STATISTICS SOUTH AFRICA P0211
Quarterly Labour Force Survey, Quarter 1, 2017
17
8. Technical notes
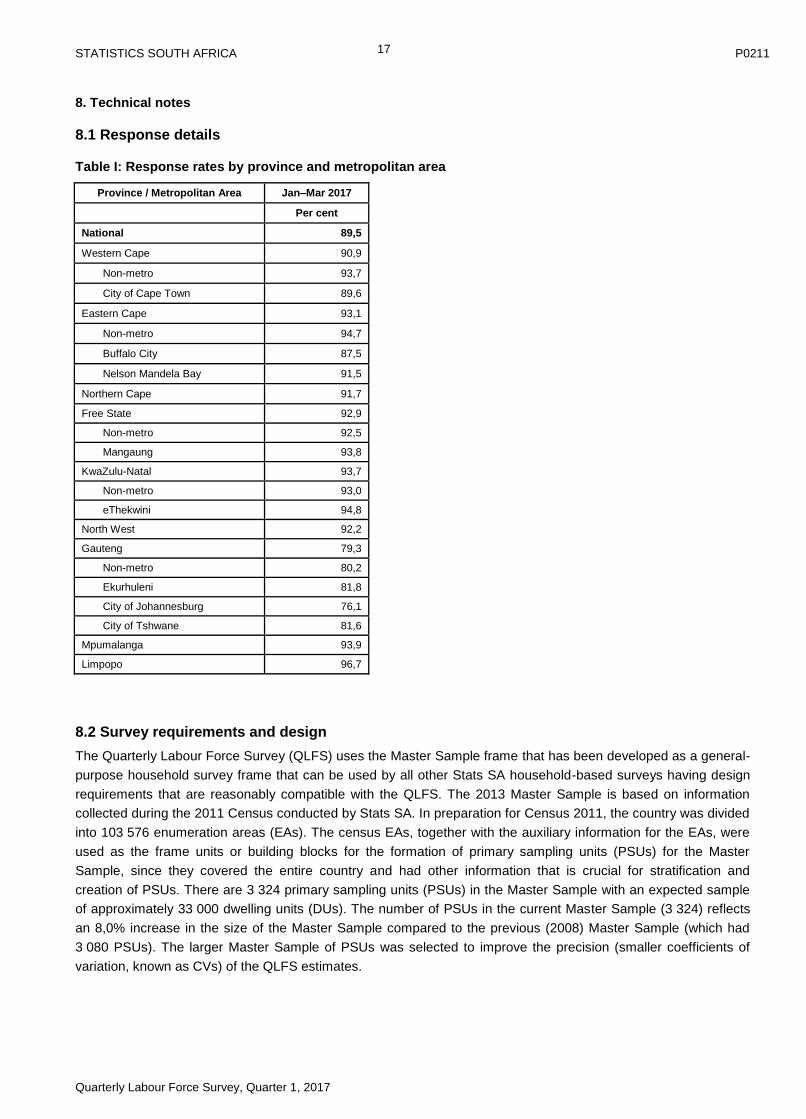
8.1 Response details
Table I: Response rates by province and metropolitan area
Province / Metropolitan Area Jan–Mar 2017
Per cent
National 89,5
Western Cape 90,9
Non-metro 93,7
City of Cape Town 89,6
Eastern Cape 93,1
Non-metro 94,7
Buffalo City 87,5
Nelson Mandela Bay 91,5
Northern Cape 91,7
Free State 92,9
Non-metro 92,5
Mangaung 93,8
KwaZulu-Natal 93,7
Non-metro 93,0
eThekwini 94,8
North West 92,2
Gauteng 79,3
Non-metro 80,2
Ekurhuleni 81,8
City of Johannesburg 76,1
City of Tshwane 81,6
Mpumalanga 93,9
Limpopo 96,7
8.2 Survey requirements and design
The Quarterly Labour Force Survey (QLFS) uses the Master Sample frame that has been developed as a general-
purpose household survey frame that can be used by all other Stats SA household-based surveys having design
requirements that are reasonably compatible with the QLFS. The 2013 Master Sample is based on information
collected during the 2011 Census conducted by Stats SA. In preparation for Census 2011, the country was divided
into 103 576 enumeration areas (EAs). The census EAs, together with the auxiliary information for the EAs, were
used as the frame units or building blocks for the formation of primary sampling units (PSUs) for the Master
Sample, since they covered the entire country and had other information that is crucial for stratification and
creation of PSUs. There are 3 324 primary sampling units (PSUs) in the Master Sample with an expected sample
of approximately 33 000 dwelling units (DUs). The number of PSUs in the current Master Sample (3 324) reflects
an 8,0% increase in the size of the Master Sample compared to the previous (2008) Master Sample (which had
3 080 PSUs). The larger Master Sample of PSUs was selected to improve the precision (smaller coefficients of
variation, known as CVs) of the QLFS estimates.
STATISTICS SOUTH AFRICA P0211
Quarterly Labour Force Survey, Quarter 1, 2017
18
The Master Sample is designed to be representative at provincial level and within provinces at metro/non-metro
levels. Within the metros, the sample is further distributed by geographical type. The three geography types are
Urban, Tribal and Farms. This implies, for example, that within a metropolitan area, the sample is representative of
the different geography types that may exist within that metro.
It is divided equally into four sub-groups or panels called rotation groups. The rotation groups are designed in such
a way that each of these groups has the same distribution pattern as that which is observed in the whole sample.
They are numbered from one (1) to four (4) and these numbers also correspond to the quarters of the year in
which the sample will be rotated for the particular group.
The sample for the QLFS is based on a stratified two-stage design with probability proportional to size (PPS)
sampling of PSUs in the first stage, and sampling of dwelling units (DUs) with systematic sampling in the second
stage.
8.3 Sample rotation
For each quarter of the QLFS, a ¼ of the sampled dwellings are rotated out of the sample. These dwellings are
replaced by new dwellings from the same PSU or the next PSU on the list. Thus, sampled dwellings are expected
to remain in the sample for four consecutive quarters. It should be noted that the sampling unit is the dwelling, and
the unit of observation is the household. Therefore, if a household moves out of a dwelling after being in the
sample for, say two quarters (as an example) and a new household moves in, the new household will be
enumerated for the next two quarters. If no household moves into the sampled dwelling, the dwelling will be
classified as vacant (or unoccupied).
8.4 Weighting
The sample weights were constructed in order to account for the following: the original selection probabilities
(design weights), adjustments for PSUs that were sub-sampled or segmented, excluded population from the
sampling frame, non-response, weight trimming, and benchmarking to known population estimates from the
Demographic Analysis Division within Stats SA.
8.5 Non-response adjustment
In general, imputation is used for item non-response (i.e. blanks within the questionnaire) and edit failures (i.e.
invalid or inconsistent responses). The eligible households in the sampled dwellings can be divided into two
response categories: respondents and non-respondents. Weight adjustment is applied to account for the non-
respondent households (e.g. refusal, no contact, etc.). The adjustment for total non-response was computed at
two levels of non-response: PSU non-response and household non-response.
8.6 Final survey weights
In the final step of constructing the sample weights, all individuals within a household are assigned the same
adjusted base weight. The adjusted base weights are calibrated such that the aggregate totals will match with
independently derived (by Stats SA Demography Division) population estimates (from the Demographic Analysis
Division) for various age, race and gender groups at national level and individual metropolitan and non-
metropolitan area levels within the provinces. The calibrated weights are constructed using the constraint that
each person within the same household should have the same calibrated weight, with a lower bound on the
calibrated weights set at 50.
8.7 Estimation
The final survey weights are used to obtain the estimates for various domains of interest, e.g. number of persons
employed in Agriculture in Western Cape, number of females employed in Manufacturing, etc.
STATISTICS SOUTH AFRICA P0211
Quarterly Labour Force Survey, Quarter 1, 2017
19
8.8 Reliability of the survey estimates
Since estimates are based on sample data, they differ from figures that would have been obtained from complete
enumeration of the population using the same instrument. Results are subject to both sampling and non-sampling
errors. Non-sampling errors include biases from inaccurate reporting, processing, and tabulation, etc., as well as
errors from non-responses and incomplete reporting. These types of errors cannot be measured readily. However,
to some extent, non-sampling errors can be minimised through the procedures used for data collection, editing,
quality control, and non-response adjustment. The variances of the survey estimates are used to measure
sampling errors.
(i) Variance estimation
The most commonly used methods for estimating variances of survey estimates from complex surveys such as the
QLFS, are the Taylor-series Linearization, Jack-knife Replication, Balanced Repeated Replication (BRR), and
Bootstrap methods (Wolter, 2007)1. The Fay's BRR method has been used for variance estimation in the QLFS
because of its simplicity.
(ii) Coefficient of variation
It is more useful in many situations to assess the size of the standard error relative to the magnitude of the
characteristic being measured (the standard error is defined as the square root of the variance). The coefficient
of variation cv provides such a measure. It is the ratio of the standard error of the survey estimate to the
value of the estimate itself expressed as a Per centage. It is very useful in comparing the precision of several
different survey estimates, where their sizes or scale differ from one another.
(iii) P-value of an estimate of change
The p-value corresponding to an estimate of change is the probability of observing a value larger than the
particular observed value under the hypothesis that there is no real change. If p-value <0,01, the difference is
highly significant; if p-value is between 0,01 and 0,05; then the difference is significant; and if p-value >0,05, the
difference is not significant.
9. Definitions
Discouraged work-seeker is a person who was not employed during the reference period, wanted to work, was
available to work/start a business but did not take active steps to find work during the last four weeks, provided
that the main reason given for not seeking work was any of the following: no jobs available in the area; unable to
find work requiring his/her skills; lost hope of finding any kind of work.
Economic activities are those that contribute to the production of goods and services in the country. There are
two types of economic activities, namely: (1) Market production activities (work done for others and usually
associated with pay or profit); and (2) Non-market production activities (work done for the benefit of the household,
e.g. subsistence farming).
Employed persons are those aged 15–64 years who, during the reference week, did any work for at least one
hour, or had a job or business but were not at work (i.e. were temporarily absent).
Employment-to-population ratio (labour absorption rate) is the proportion of the working-age population that is
employed.
1Wolter, K.M. 2007. Introduction to Variance Estimation, 2nd Edition. New York: Springer-Verlag.
STATISTICS SOUTH AFRICA P0211
Quarterly Labour Force Survey, Quarter 1, 2017
20
Informal employment identifies persons who are in precarious employment situations irrespective of whether or
not the entity for which they work is in the formal or informal sector. Persons in informal employment therefore
comprise all persons in the informal sector, employees in the formal sector, and persons working in private
households who are not entitled to basic benefits such as pension or medical aid contributions from their
employer, and who do not have a written contract of employment.
Informal sector: The informal sector has the following two components:
i) Employees working in establishments that employ fewer than five employees, who do not deduct
income tax from their salaries/wages; and
ii) Employers, own-account workers and persons helping unpaid in their household business who are not
registered for either income tax or value-added tax.
The labour force comprises all persons who are employed plus all persons who are unemployed.
Labour force participation rate is the proportion of the working-age population that is either employed or
unemployed.
Long-term unemployment: Persons in long-term unemployment are those individuals among the unemployed
who were without work and trying to find a job or start a business for one year or more.
Not economically active: Persons aged 15–64 years who are neither employed nor unemployed in the reference
week.
Persons in underemployment (time-related) are employed persons who were willing and available to work
additional hours, whose total number of hours actually worked during the reference period were below 35 hours
per week.
Underutilised labour comprises three groups that are defined as follows: persons who are underemployed,
persons who are unemployed, and persons who are discouraged.
Unemployed persons are those (aged 15–64 years) who:
a) Were not employed in the reference week; and
b) Actively looked for work or tried to start a business in the four weeks preceding the survey interview; and
c) Were available for work, i.e. would have been able to start work or a business in the reference week; or
d) Had not actively looked for work in the past four weeks but had a job or business to start at a definite date
in the future and were available.
Unemployment rate is the proportion of the labour force that is unemployed.
The working-age population comprises all persons aged 15–64 years.
STATISTICS SOUTH AFRICA P0211
Quarterly Labour Force Survey, Quarter 1, 2017
21
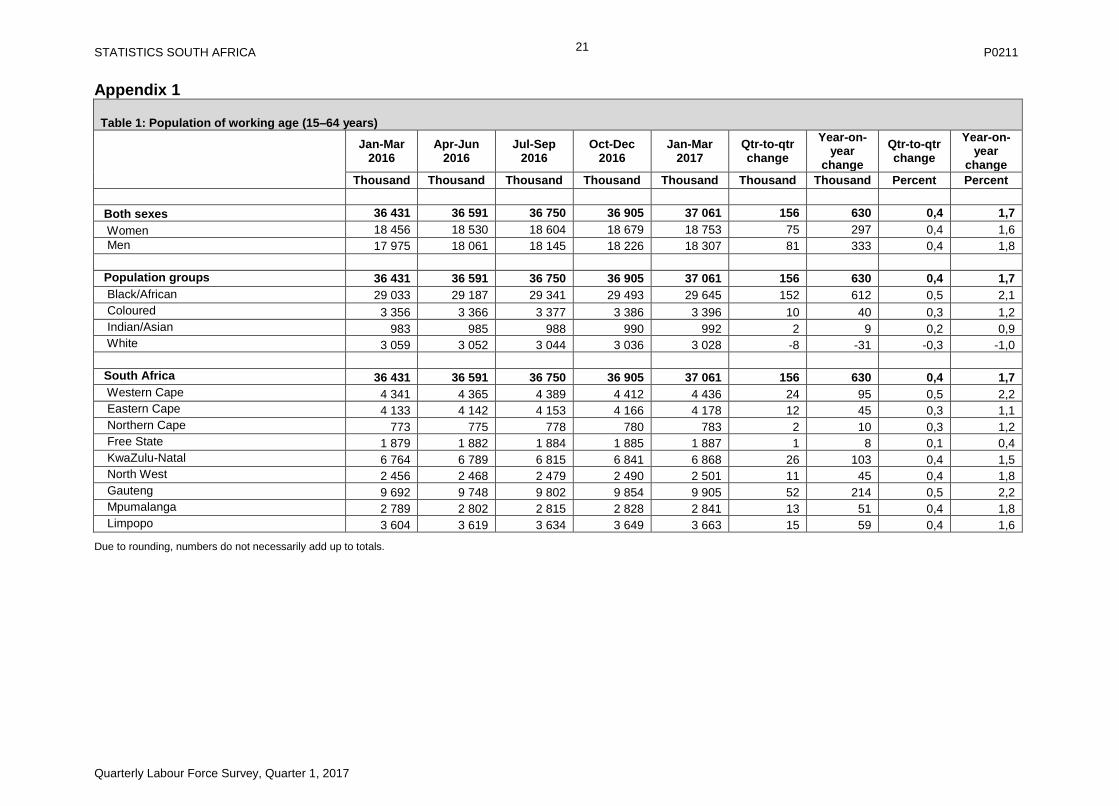
Appendix 1
Table 1: Population of working age (15–64 years)
Jan-Mar 2016
Apr-Jun 2016
Jul-Sep 2016
Oct-Dec 2016
Jan-Mar 2017
Qtr-to-qtr change
Year-on-year
change
Qtr-to-qtr change
Year-on-year
change
Thousand Thousand Thousand Thousand Thousand Thousand Thousand Percent Percent
Both sexes 36 431 36 591 36 750 36 905 37 061 156 630 0,4 1,7
Women 18 456 18 530 18 604 18 679 18 753 75 297 0,4 1,6
Men 17 975 18 061 18 145 18 226 18 307 81 333 0,4 1,8
Population groups 36 431 36 591 36 750 36 905 37 061 156 630 0,4 1,7
Black/African 29 033 29 187 29 341 29 493 29 645 152 612 0,5 2,1
Coloured 3 356 3 366 3 377 3 386 3 396 10 40 0,3 1,2
Indian/Asian 983 985 988 990 992 2 9 0,2 0,9
White 3 059 3 052 3 044 3 036 3 028 -8 -31 -0,3 -1,0
South Africa 36 431 36 591 36 750 36 905 37 061 156 630 0,4 1,7
Western Cape 4 341 4 365 4 389 4 412 4 436 24 95 0,5 2,2
Eastern Cape 4 133 4 142 4 153 4 166 4 178 12 45 0,3 1,1
Northern Cape 773 775 778 780 783 2 10 0,3 1,2
Free State 1 879 1 882 1 884 1 885 1 887 1 8 0,1 0,4
KwaZulu-Natal 6 764 6 789 6 815 6 841 6 868 26 103 0,4 1,5
North West 2 456 2 468 2 479 2 490 2 501 11 45 0,4 1,8
Gauteng 9 692 9 748 9 802 9 854 9 905 52 214 0,5 2,2
Mpumalanga 2 789 2 802 2 815 2 828 2 841 13 51 0,4 1,8
Limpopo 3 604 3 619 3 634 3 649 3 663 15 59 0,4 1,6
Due to rounding, numbers do not necessarily add up to totals.
STATISTICS SOUTH AFRICA P0211
Quarterly Labour Force Survey, Quarter 1, 2017
22
Table 2: Labour force characteristics by sex – All population groups
Jan-Mar 2016
Apr-Jun 2016
Jul-Sep 2016
Oct-Dec 2016
Jan-Mar 2017
Qtr-to-qtr change
Year-on-year
change
Qtr-to-qtr change
Year-on-year
change
Thousand Thousand Thousand Thousand Thousand Thousand Thousand Percent Percent
Both sexes
Population 15-64 yrs 36 431 36 591 36 750 36 905 37 061 156 630 0,4 1,7
Labour Force 21 398 21 179 21 706 21 849 22 426 577 1 029 2,6 4,8
Employed 15 675 15 545 15 833 16 069 16 212 144 538 0,9 3,4
Formal sector (Non-agricultural) 10 983 10 917 11 029 11 156 11 337 181 354 1,6 3,2
Informal sector (Non-agricultural) 2 565 2 507 2 641 2 695 2 681 -14 116 -0,5 4,5
Agriculture 869 825 881 919 875 -44 6 -4,8 0,7
Private households 1 257 1 296 1 281 1 299 1 319 21 62 1,6 5,0
Unemployed 5 723 5 634 5 873 5 781 6 214 433 491 7,5 8,6
Not economically active 15 033 15 412 15 044 15 055 14 634 -421 -399 -2,8 -2,7
Discouraged work-seekers 2 434 2 526 2 291 2 292 2 277 -15 -156 -0,6 -6,4
Other(not economically active) 12 599 12 886 12 753 12 763 12 357 -406 -242 -3,2 -1,9
Rates (%)
Unemployment rate 26,7 26,6 27,1 26,5 27,7 1,2 1,0
Employed / population ratio (Absorption) 43,0 42,5 43,1 43,5 43,7 0,2 0,7
Labour force participation rate 58,7 57,9 59,1 59,2 60,5 1,3 1,8
Women
Population 15-64 yrs 18 456 18 530 18 604 18 679 18 753 75 297 0,4 1,6
Labour Force 9 672 9 524 9 727 9 883 10 232 349 560 3,5 5,8
Employed 6 840 6 754 6 873 7 031 7 182 151 343 2,2 5,0
Formal sector (Non-agricultural) 4 641 4 583 4 652 4 754 4 883 129 242 2,7 5,2
Informal sector (Non-agricultural) 966 960 970 977 1 021 44 55 4,5 5,7
Agriculture 271 235 255 305 278 -27 7 -9,0 2,5
Private households 961 976 996 995 1 001 6 39 0,6 4,1
Unemployed 2 832 2 770 2 854 2 852 3 049 197 217 6,9 7,7
Not economically active 8 784 9 006 8 877 8 796 8 522 -274 -263 -3,1 -3,0
Discouraged work-seekers 1 306 1 369 1 301 1 289 1 233 -56 -72 -4,3 -5,5
Other(not economically active) 7 479 7 637 7 576 7 506 7 288 -218 -191 -2,9 -2,5
Rates (%)
Unemployment rate 29,3 29,1 29,3 28,9 29,8 0,9 0,5
Employed / population ratio (Absorption) 37,1 36,4 36,9 37,6 38,3 0,7 1,2
Labour force participation rate 52,4 51,4 52,3 52,9 54,6 1,7 2,2
Due to rounding, numbers do not necessarily add up to totals. Note: 'Employment' refers to market production activities.
STATISTICS SOUTH AFRICA P0211
Quarterly Labour Force Survey, Quarter 1, 2017
23
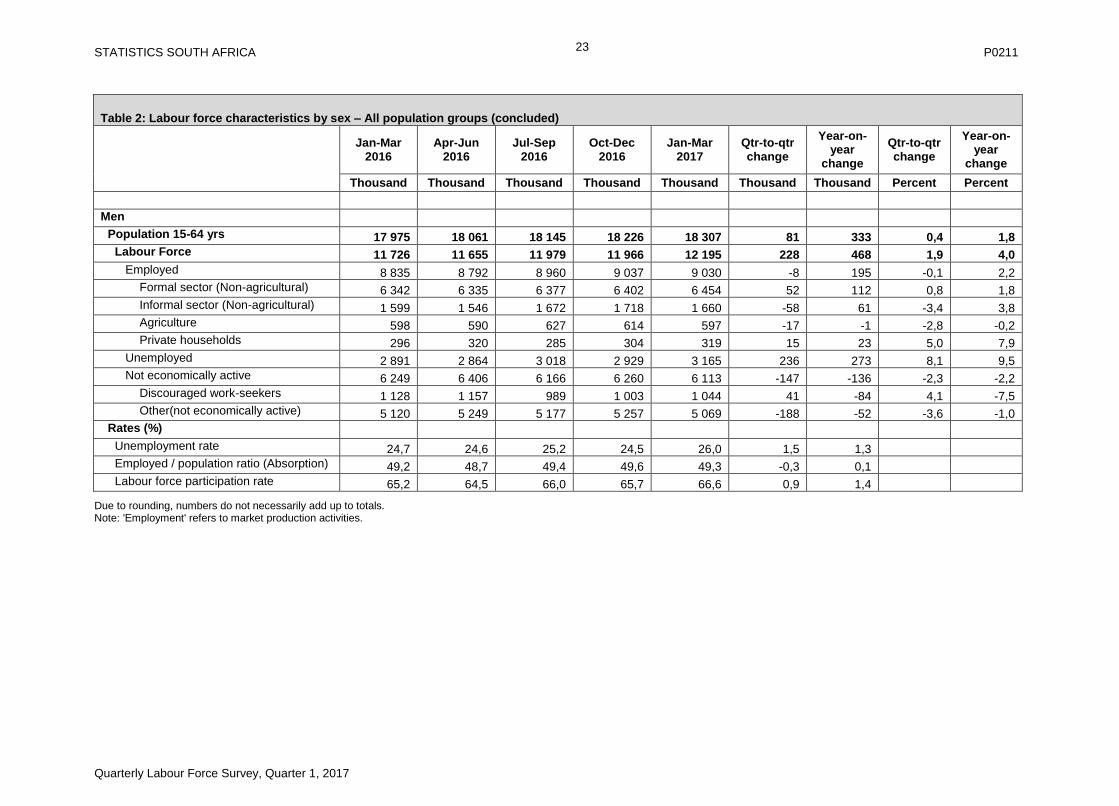
Table 2: Labour force characteristics by sex – All population groups (concluded)
Jan-Mar 2016
Apr-Jun 2016
Jul-Sep 2016
Oct-Dec 2016
Jan-Mar 2017
Qtr-to-qtr change
Year-on-year
change
Qtr-to-qtr change
Year-on-year
change
Thousand Thousand Thousand Thousand Thousand Thousand Thousand Percent Percent
Men
Population 15-64 yrs 17 975 18 061 18 145 18 226 18 307 81 333 0,4 1,8
Labour Force 11 726 11 655 11 979 11 966 12 195 228 468 1,9 4,0
Employed 8 835 8 792 8 960 9 037 9 030 -8 195 -0,1 2,2
Formal sector (Non-agricultural) 6 342 6 335 6 377 6 402 6 454 52 112 0,8 1,8
Informal sector (Non-agricultural) 1 599 1 546 1 672 1 718 1 660 -58 61 -3,4 3,8
Agriculture 598 590 627 614 597 -17 -1 -2,8 -0,2
Private households 296 320 285 304 319 15 23 5,0 7,9
Unemployed 2 891 2 864 3 018 2 929 3 165 236 273 8,1 9,5
Not economically active 6 249 6 406 6 166 6 260 6 113 -147 -136 -2,3 -2,2
Discouraged work-seekers 1 128 1 157 989 1 003 1 044 41 -84 4,1 -7,5
Other(not economically active) 5 120 5 249 5 177 5 257 5 069 -188 -52 -3,6 -1,0
Rates (%)
Unemployment rate 24,7 24,6 25,2 24,5 26,0 1,5 1,3
Employed / population ratio (Absorption) 49,2 48,7 49,4 49,6 49,3 -0,3 0,1
Labour force participation rate 65,2 64,5 66,0 65,7 66,6 0,9 1,4
Due to rounding, numbers do not necessarily add up to totals. Note: 'Employment' refers to market production activities.
STATISTICS SOUTH AFRICA P0211
Quarterly Labour Force Survey, Quarter 1, 2017
24
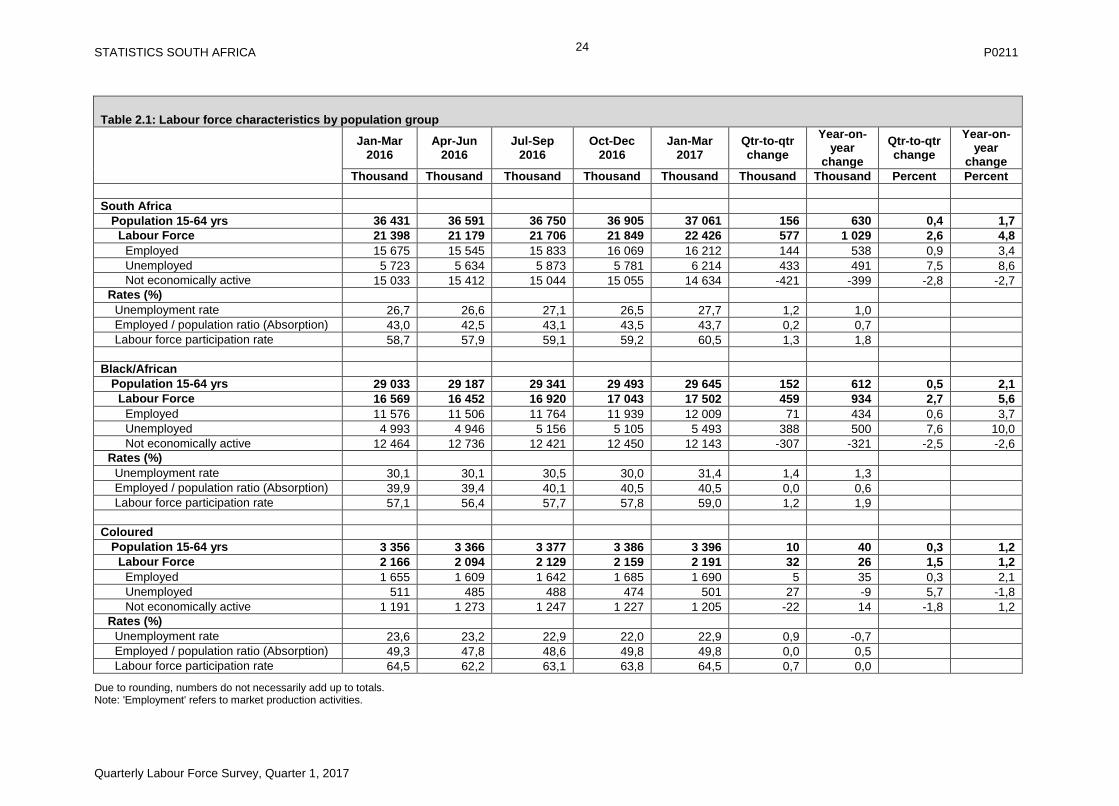
Table 2.1: Labour force characteristics by population group
Jan-Mar 2016
Apr-Jun 2016
Jul-Sep 2016
Oct-Dec 2016
Jan-Mar 2017
Qtr-to-qtr change
Year-on-year
change
Qtr-to-qtr change
Year-on-year
change
Thousand Thousand Thousand Thousand Thousand Thousand Thousand Percent Percent
South Africa
Population 15-64 yrs 36 431 36 591 36 750 36 905 37 061 156 630 0,4 1,7
Labour Force 21 398 21 179 21 706 21 849 22 426 577 1 029 2,6 4,8
Employed 15 675 15 545 15 833 16 069 16 212 144 538 0,9 3,4
Unemployed 5 723 5 634 5 873 5 781 6 214 433 491 7,5 8,6
Not economically active 15 033 15 412 15 044 15 055 14 634 -421 -399 -2,8 -2,7
Rates (%)
Unemployment rate 26,7 26,6 27,1 26,5 27,7 1,2 1,0
Employed / population ratio (Absorption) 43,0 42,5 43,1 43,5 43,7 0,2 0,7
Labour force participation rate 58,7 57,9 59,1 59,2 60,5 1,3 1,8
Black/African
Population 15-64 yrs 29 033 29 187 29 341 29 493 29 645 152 612 0,5 2,1
Labour Force 16 569 16 452 16 920 17 043 17 502 459 934 2,7 5,6
Employed 11 576 11 506 11 764 11 939 12 009 71 434 0,6 3,7
Unemployed 4 993 4 946 5 156 5 105 5 493 388 500 7,6 10,0
Not economically active 12 464 12 736 12 421 12 450 12 143 -307 -321 -2,5 -2,6
Rates (%)
Unemployment rate 30,1 30,1 30,5 30,0 31,4 1,4 1,3
Employed / population ratio (Absorption) 39,9 39,4 40,1 40,5 40,5 0,0 0,6
Labour force participation rate 57,1 56,4 57,7 57,8 59,0 1,2 1,9
Coloured
Population 15-64 yrs 3 356 3 366 3 377 3 386 3 396 10 40 0,3 1,2
Labour Force 2 166 2 094 2 129 2 159 2 191 32 26 1,5 1,2
Employed 1 655 1 609 1 642 1 685 1 690 5 35 0,3 2,1
Unemployed 511 485 488 474 501 27 -9 5,7 -1,8
Not economically active 1 191 1 273 1 247 1 227 1 205 -22 14 -1,8 1,2
Rates (%)
Unemployment rate 23,6 23,2 22,9 22,0 22,9 0,9 -0,7
Employed / population ratio (Absorption) 49,3 47,8 48,6 49,8 49,8 0,0 0,5
Labour force participation rate 64,5 62,2 63,1 63,8 64,5 0,7 0,0
Due to rounding, numbers do not necessarily add up to totals. Note: 'Employment' refers to market production activities.
STATISTICS SOUTH AFRICA P0211
Quarterly Labour Force Survey, Quarter 1, 2017
25
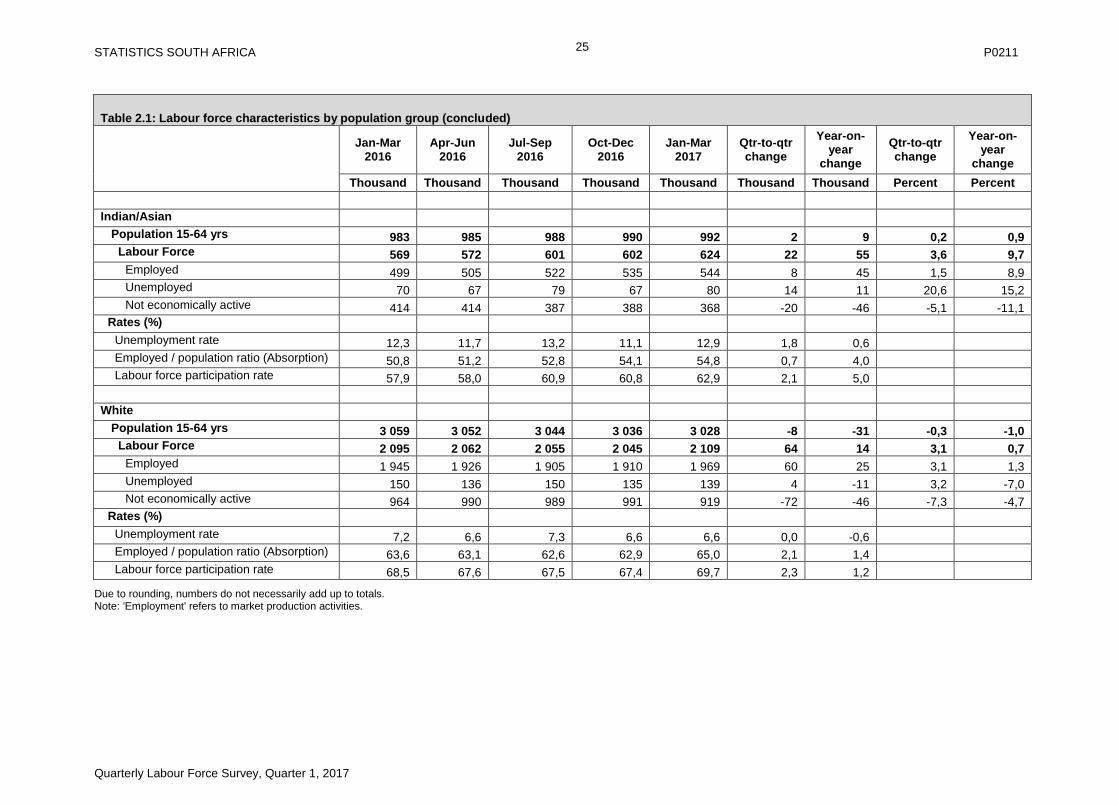
Table 2.1: Labour force characteristics by population group (concluded)
Jan-Mar 2016
Apr-Jun 2016
Jul-Sep 2016
Oct-Dec 2016
Jan-Mar 2017
Qtr-to-qtr change
Year-on-year
change
Qtr-to-qtr change
Year-on-year
change
Thousand Thousand Thousand Thousand Thousand Thousand Thousand Percent Percent
Indian/Asian
Population 15-64 yrs 983 985 988 990 992 2 9 0,2 0,9
Labour Force 569 572 601 602 624 22 55 3,6 9,7
Employed 499 505 522 535 544 8 45 1,5 8,9
Unemployed 70 67 79 67 80 14 11 20,6 15,2
Not economically active 414 414 387 388 368 -20 -46 -5,1 -11,1
Rates (%)
Unemployment rate 12,3 11,7 13,2 11,1 12,9 1,8 0,6
Employed / population ratio (Absorption) 50,8 51,2 52,8 54,1 54,8 0,7 4,0
Labour force participation rate 57,9 58,0 60,9 60,8 62,9 2,1 5,0
White
Population 15-64 yrs 3 059 3 052 3 044 3 036 3 028 -8 -31 -0,3 -1,0
Labour Force 2 095 2 062 2 055 2 045 2 109 64 14 3,1 0,7
Employed 1 945 1 926 1 905 1 910 1 969 60 25 3,1 1,3
Unemployed 150 136 150 135 139 4 -11 3,2 -7,0
Not economically active 964 990 989 991 919 -72 -46 -7,3 -4,7
Rates (%)
Unemployment rate 7,2 6,6 7,3 6,6 6,6 0,0 -0,6
Employed / population ratio (Absorption) 63,6 63,1 62,6 62,9 65,0 2,1 1,4
Labour force participation rate 68,5 67,6 67,5 67,4 69,7 2,3 1,2
Due to rounding, numbers do not necessarily add up to totals. Note: 'Employment' refers to market production activities.
STATISTICS SOUTH AFRICA P0211
Quarterly Labour Force Survey, Quarter 1, 2017
26
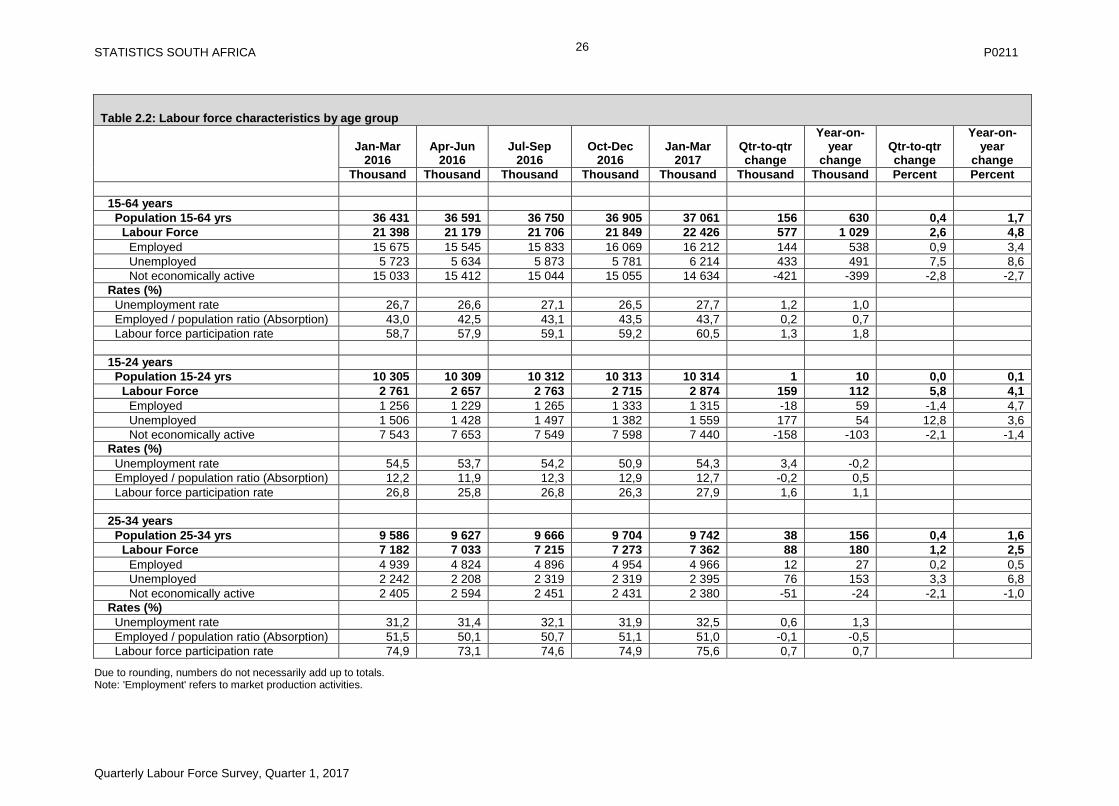
Table 2.2: Labour force characteristics by age group
Jan-Mar 2016
Apr-Jun 2016
Jul-Sep 2016
Oct-Dec 2016
Jan-Mar 2017
Qtr-to-qtr change
Year-on-year
change Qtr-to-qtr change
Year-on-year
change
Thousand Thousand Thousand Thousand Thousand Thousand Thousand Percent Percent
15-64 years
Population 15-64 yrs 36 431 36 591 36 750 36 905 37 061 156 630 0,4 1,7
Labour Force 21 398 21 179 21 706 21 849 22 426 577 1 029 2,6 4,8
Employed 15 675 15 545 15 833 16 069 16 212 144 538 0,9 3,4
Unemployed 5 723 5 634 5 873 5 781 6 214 433 491 7,5 8,6
Not economically active 15 033 15 412 15 044 15 055 14 634 -421 -399 -2,8 -2,7
Rates (%)
Unemployment rate 26,7 26,6 27,1 26,5 27,7 1,2 1,0
Employed / population ratio (Absorption) 43,0 42,5 43,1 43,5 43,7 0,2 0,7
Labour force participation rate 58,7 57,9 59,1 59,2 60,5 1,3 1,8
15-24 years
Population 15-24 yrs 10 305 10 309 10 312 10 313 10 314 1 10 0,0 0,1
Labour Force 2 761 2 657 2 763 2 715 2 874 159 112 5,8 4,1
Employed 1 256 1 229 1 265 1 333 1 315 -18 59 -1,4 4,7
Unemployed 1 506 1 428 1 497 1 382 1 559 177 54 12,8 3,6
Not economically active 7 543 7 653 7 549 7 598 7 440 -158 -103 -2,1 -1,4
Rates (%)
Unemployment rate 54,5 53,7 54,2 50,9 54,3 3,4 -0,2
Employed / population ratio (Absorption) 12,2 11,9 12,3 12,9 12,7 -0,2 0,5
Labour force participation rate 26,8 25,8 26,8 26,3 27,9 1,6 1,1
25-34 years
Population 25-34 yrs 9 586 9 627 9 666 9 704 9 742 38 156 0,4 1,6
Labour Force 7 182 7 033 7 215 7 273 7 362 88 180 1,2 2,5
Employed 4 939 4 824 4 896 4 954 4 966 12 27 0,2 0,5
Unemployed 2 242 2 208 2 319 2 319 2 395 76 153 3,3 6,8
Not economically active 2 405 2 594 2 451 2 431 2 380 -51 -24 -2,1 -1,0
Rates (%)
Unemployment rate 31,2 31,4 32,1 31,9 32,5 0,6 1,3
Employed / population ratio (Absorption) 51,5 50,1 50,7 51,1 51,0 -0,1 -0,5
Labour force participation rate 74,9 73,1 74,6 74,9 75,6 0,7 0,7
Due to rounding, numbers do not necessarily add up to totals. Note: 'Employment' refers to market production activities.
STATISTICS SOUTH AFRICA P0211
Quarterly Labour Force Survey, Quarter 1, 2017
27
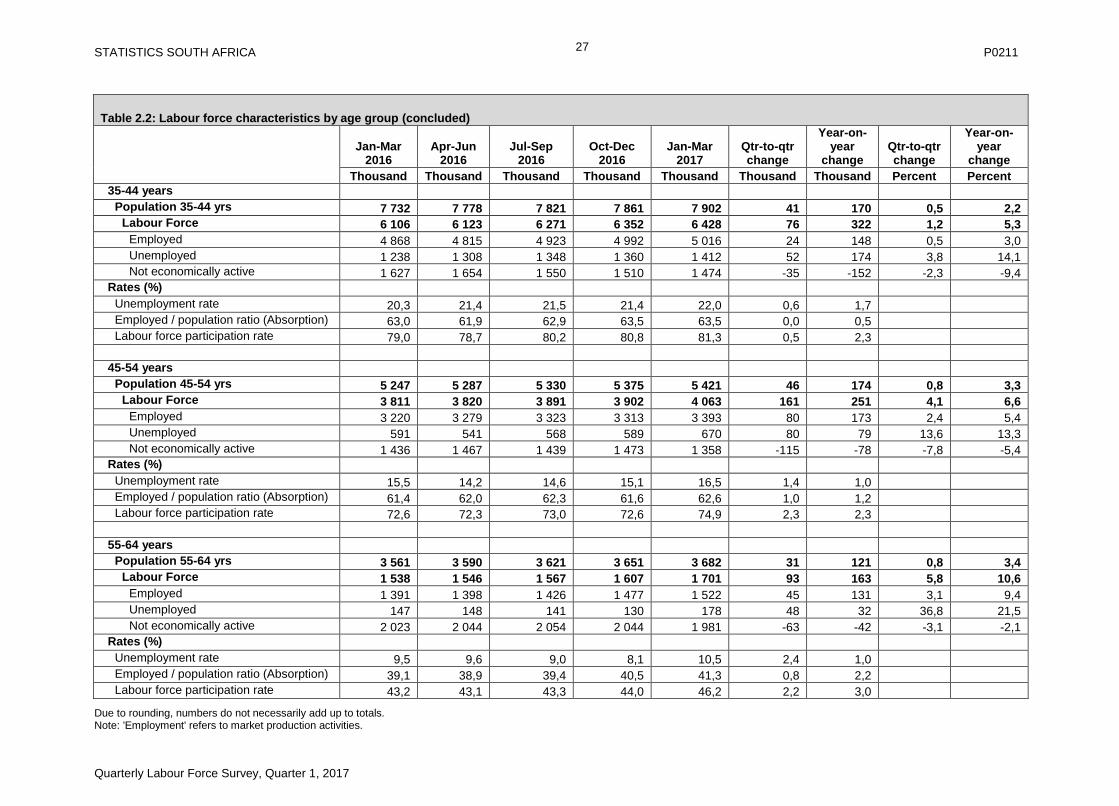
Table 2.2: Labour force characteristics by age group (concluded)
Jan-Mar 2016
Apr-Jun 2016
Jul-Sep 2016
Oct-Dec 2016
Jan-Mar 2017
Qtr-to-qtr change
Year-on-year
change Qtr-to-qtr change
Year-on-year
change
Thousand Thousand Thousand Thousand Thousand Thousand Thousand Percent Percent
35-44 years
Population 35-44 yrs 7 732 7 778 7 821 7 861 7 902 41 170 0,5 2,2
Labour Force 6 106 6 123 6 271 6 352 6 428 76 322 1,2 5,3
Employed 4 868 4 815 4 923 4 992 5 016 24 148 0,5 3,0
Unemployed 1 238 1 308 1 348 1 360 1 412 52 174 3,8 14,1
Not economically active 1 627 1 654 1 550 1 510 1 474 -35 -152 -2,3 -9,4
Rates (%)
Unemployment rate 20,3 21,4 21,5 21,4 22,0 0,6 1,7
Employed / population ratio (Absorption) 63,0 61,9 62,9 63,5 63,5 0,0 0,5
Labour force participation rate 79,0 78,7 80,2 80,8 81,3 0,5 2,3
45-54 years
Population 45-54 yrs 5 247 5 287 5 330 5 375 5 421 46 174 0,8 3,3
Labour Force 3 811 3 820 3 891 3 902 4 063 161 251 4,1 6,6
Employed 3 220 3 279 3 323 3 313 3 393 80 173 2,4 5,4
Unemployed 591 541 568 589 670 80 79 13,6 13,3
Not economically active 1 436 1 467 1 439 1 473 1 358 -115 -78 -7,8 -5,4
Rates (%)
Unemployment rate 15,5 14,2 14,6 15,1 16,5 1,4 1,0
Employed / population ratio (Absorption) 61,4 62,0 62,3 61,6 62,6 1,0 1,2
Labour force participation rate 72,6 72,3 73,0 72,6 74,9 2,3 2,3
55-64 years
Population 55-64 yrs 3 561 3 590 3 621 3 651 3 682 31 121 0,8 3,4
Labour Force 1 538 1 546 1 567 1 607 1 701 93 163 5,8 10,6
Employed 1 391 1 398 1 426 1 477 1 522 45 131 3,1 9,4
Unemployed 147 148 141 130 178 48 32 36,8 21,5
Not economically active 2 023 2 044 2 054 2 044 1 981 -63 -42 -3,1 -2,1
Rates (%)
Unemployment rate 9,5 9,6 9,0 8,1 10,5 2,4 1,0
Employed / population ratio (Absorption) 39,1 38,9 39,4 40,5 41,3 0,8 2,2
Labour force participation rate 43,2 43,1 43,3 44,0 46,2 2,2 3,0
Due to rounding, numbers do not necessarily add up to totals. Note: 'Employment' refers to market production activities.
STATISTICS SOUTH AFRICA P0211
Quarterly Labour Force Survey, Quarter 1, 2017
28
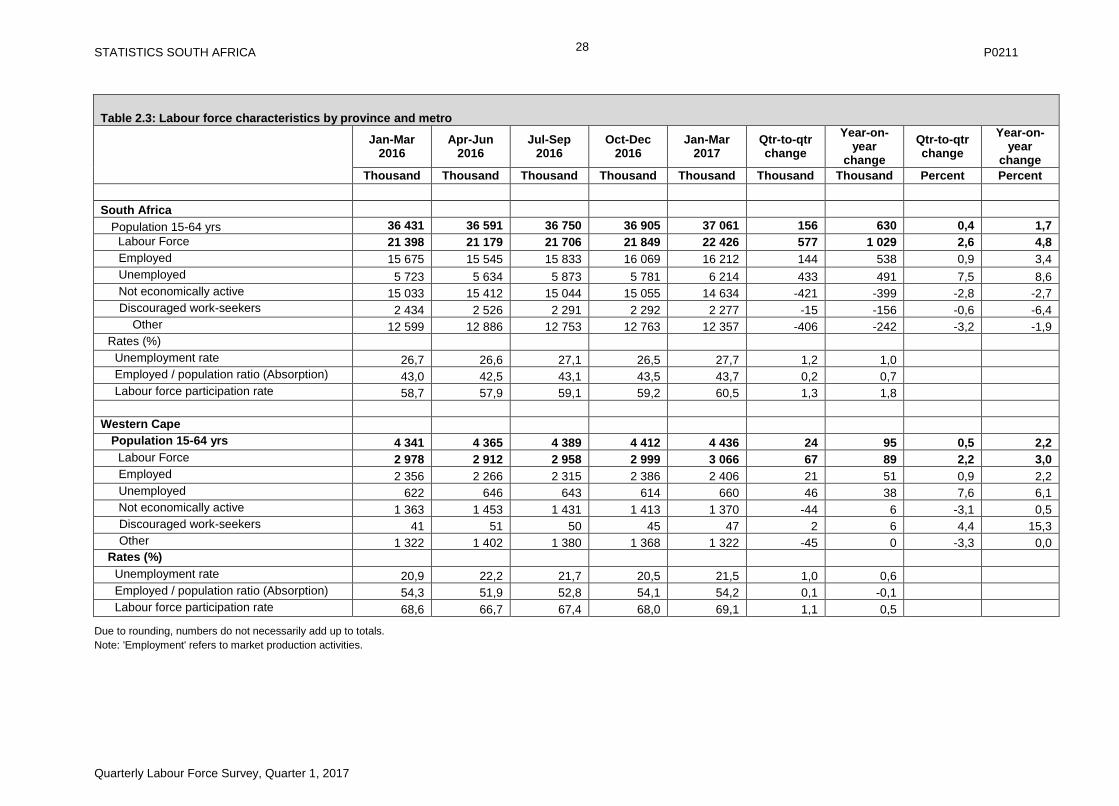
Table 2.3: Labour force characteristics by province and metro
Jan-Mar 2016
Apr-Jun 2016
Jul-Sep 2016
Oct-Dec 2016
Jan-Mar 2017
Qtr-to-qtr change
Year-on-year
change
Qtr-to-qtr change
Year-on-year
change
Thousand Thousand Thousand Thousand Thousand Thousand Thousand Percent Percent
South Africa
Population 15-64 yrs 36 431 36 591 36 750 36 905 37 061 156 630 0,4 1,7
Labour Force 21 398 21 179 21 706 21 849 22 426 577 1 029 2,6 4,8
Employed 15 675 15 545 15 833 16 069 16 212 144 538 0,9 3,4
Unemployed 5 723 5 634 5 873 5 781 6 214 433 491 7,5 8,6
Not economically active 15 033 15 412 15 044 15 055 14 634 -421 -399 -2,8 -2,7
Discouraged work-seekers 2 434 2 526 2 291 2 292 2 277 -15 -156 -0,6 -6,4
Other 12 599 12 886 12 753 12 763 12 357 -406 -242 -3,2 -1,9
Rates (%)
Unemployment rate 26,7 26,6 27,1 26,5 27,7 1,2 1,0
Employed / population ratio (Absorption) 43,0 42,5 43,1 43,5 43,7 0,2 0,7
Labour force participation rate 58,7 57,9 59,1 59,2 60,5 1,3 1,8
Western Cape
Population 15-64 yrs 4 341 4 365 4 389 4 412 4 436 24 95 0,5 2,2
Labour Force 2 978 2 912 2 958 2 999 3 066 67 89 2,2 3,0
Employed 2 356 2 266 2 315 2 386 2 406 21 51 0,9 2,2
Unemployed 622 646 643 614 660 46 38 7,6 6,1
Not economically active 1 363 1 453 1 431 1 413 1 370 -44 6 -3,1 0,5
Discouraged work-seekers 41 51 50 45 47 2 6 4,4 15,3
Other 1 322 1 402 1 380 1 368 1 322 -45 0 -3,3 0,0
Rates (%)
Unemployment rate 20,9 22,2 21,7 20,5 21,5 1,0 0,6
Employed / population ratio (Absorption) 54,3 51,9 52,8 54,1 54,2 0,1 -0,1
Labour force participation rate 68,6 66,7 67,4 68,0 69,1 1,1 0,5
Due to rounding, numbers do not necessarily add up to totals.
Note: 'Employment' refers to market production activities.

STATISTICS SOUTH AFRICA P0211
Quarterly Labour Force Survey, Quarter 1, 2017
29
Table 2.3: Labour force characteristics by province and metro (continued)
Jan-Mar 2016
Apr-Jun 2016
Jul-Sep 2016
Oct-Dec 2016
Jan-Mar 2017
Qtr-to-qtr change
Year-on-year
change
Qtr-to-qtr change
Year-on-year
change
Thousand Thousand Thousand Thousand Thousand Thousand Thousand Percent Percent
Western Cape - Non metro
Population 15-64 yrs 1 569 1 579 1 589 1 598 1 607 9 38 0,6 2,4
Labour Force 1 056 1 007 1 050 1 050 1 103 53 47 5,0 4,4
Employed 839 798 847 903 895 -8 56 -0,9 6,7
Unemployed 217 208 203 147 208 61 -9 41,4 -4,3
Not economically active 513 572 539 548 504 -43 -9 -7,9 -1,7
Discouraged work-seekers 36 43 37 35 36 1 -1 3,1 -2,2
Other 477 530 502 513 469 -44 -8 -8,6 -1,6
Rates (%)
Unemployment rate 20,5 20,7 19,3 14,0 18,8 4,8 -1,7
Employed / population ratio (Absorption) 53,5 50,6 53,3 56,5 55,7 -0,8 2,2
Labour force participation rate 67,3 63,8 66,1 6,1 68,6 2,9 1,3
Western Cape - City of Cape Town
Population 15-64 yrs 2 772 2 786 2 800 2 814 2 828 14 57 0,5 2,0
Labour Force 1 921 1 905 1 908 1 949 1 963 14 42 0,7 2,2
Employed 1 516 1 468 1 469 1 482 1 511 29 -5 1,9 -0,4
Unemployed 405 438 440 467 452 -14 47 -3,1 11,7
Not economically active 850 880 892 865 865 0 15 0,0 1,8
Discouraged work-seekers 5 8 13 11 12 1 7 8,5 154,2
Other 846 872 879 855 853 -1 8 -0,1 0,9
Rates (%)
Unemployment rate 21,1 23,0 23,0 23,9 23,0 -0,9 1,9
Employed / population ratio (Absorption) 54,7 52,7 52,4 52,7 53,4 0,7 -1,3
Labour force participation rate 69,3 68,4 68,2 69,2 69,4 0,2 0,1
Due to rounding, numbers do not necessarily add up to totals.
Note: 'Employment' refers to market production activities.
STATISTICS SOUTH AFRICA P0211
Quarterly Labour Force Survey, Quarter 1, 2017
30
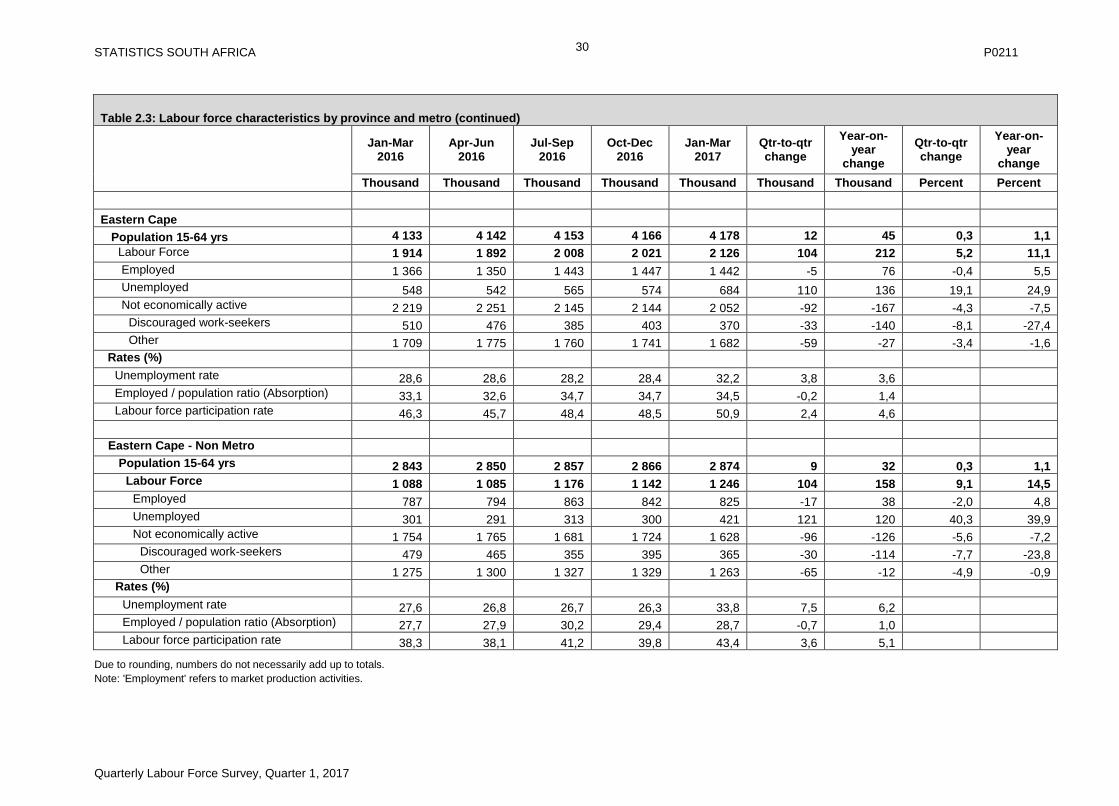
Table 2.3: Labour force characteristics by province and metro (continued)
Jan-Mar 2016
Apr-Jun 2016
Jul-Sep 2016
Oct-Dec 2016
Jan-Mar 2017
Qtr-to-qtr change
Year-on-year
change
Qtr-to-qtr change
Year-on-year
change
Thousand Thousand Thousand Thousand Thousand Thousand Thousand Percent Percent
Eastern Cape
Population 15-64 yrs 4 133 4 142 4 153 4 166 4 178 12 45 0,3 1,1
Labour Force 1 914 1 892 2 008 2 021 2 126 104 212 5,2 11,1
Employed 1 366 1 350 1 443 1 447 1 442 -5 76 -0,4 5,5
Unemployed 548 542 565 574 684 110 136 19,1 24,9
Not economically active 2 219 2 251 2 145 2 144 2 052 -92 -167 -4,3 -7,5
Discouraged work-seekers 510 476 385 403 370 -33 -140 -8,1 -27,4
Other 1 709 1 775 1 760 1 741 1 682 -59 -27 -3,4 -1,6
Rates (%)
Unemployment rate 28,6 28,6 28,2 28,4 32,2 3,8 3,6
Employed / population ratio (Absorption) 33,1 32,6 34,7 34,7 34,5 -0,2 1,4
Labour force participation rate 46,3 45,7 48,4 48,5 50,9 2,4 4,6
Eastern Cape - Non Metro
Population 15-64 yrs 2 843 2 850 2 857 2 866 2 874 9 32 0,3 1,1
Labour Force 1 088 1 085 1 176 1 142 1 246 104 158 9,1 14,5
Employed 787 794 863 842 825 -17 38 -2,0 4,8
Unemployed 301 291 313 300 421 121 120 40,3 39,9
Not economically active 1 754 1 765 1 681 1 724 1 628 -96 -126 -5,6 -7,2
Discouraged work-seekers 479 465 355 395 365 -30 -114 -7,7 -23,8
Other 1 275 1 300 1 327 1 329 1 263 -65 -12 -4,9 -0,9
Rates (%)
Unemployment rate 27,6 26,8 26,7 26,3 33,8 7,5 6,2
Employed / population ratio (Absorption) 27,7 27,9 30,2 29,4 28,7 -0,7 1,0
Labour force participation rate 38,3 38,1 41,2 39,8 43,4 3,6 5,1
Due to rounding, numbers do not necessarily add up to totals.
Note: 'Employment' refers to market production activities.
STATISTICS SOUTH AFRICA P0211
Quarterly Labour Force Survey, Quarter 1, 2017
31
Table 2.3: Labour force characteristics by province and metro (continued)
Jan-Mar 2016
Apr-Jun 2016
Jul-Sep 2016
Oct-Dec 2016
Jan-Mar 2017
Qtr-to-qtr change
Year-on-year
change
Qtr-to-qtr change
Year-on-year
change
Thousand Thousand Thousand Thousand Thousand Thousand Thousand Percent Percent
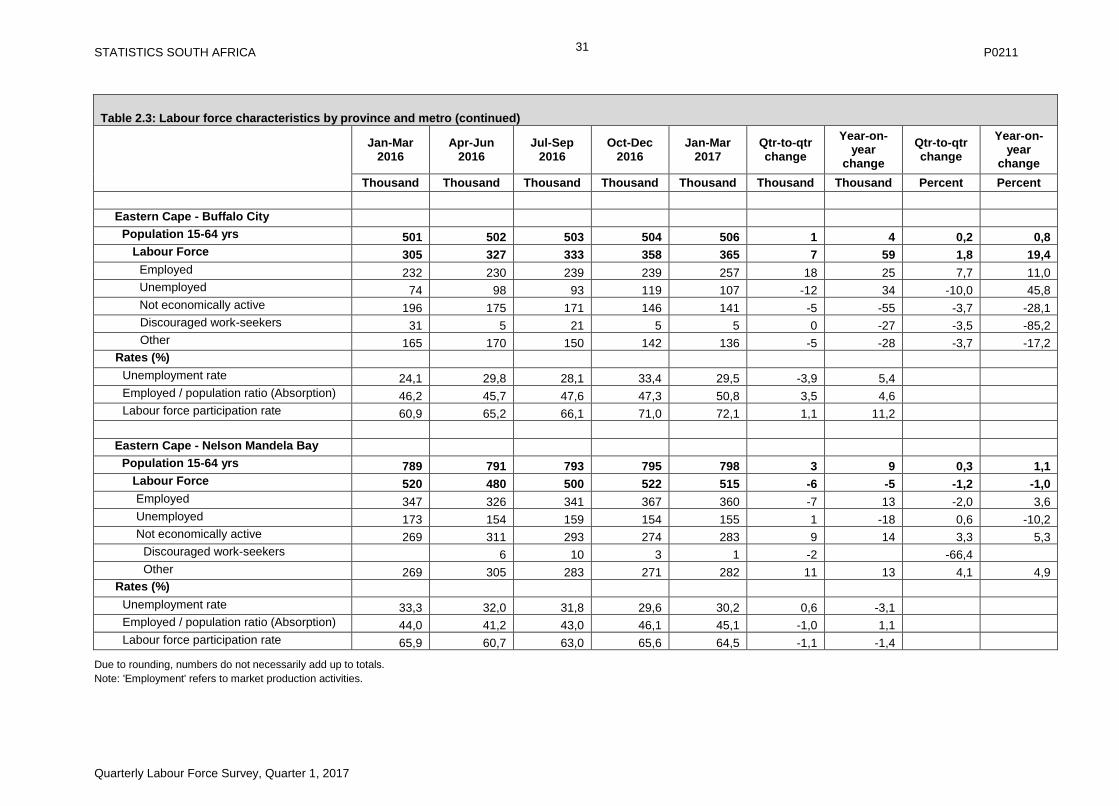
Eastern Cape - Buffalo City
Population 15-64 yrs 501 502 503 504 506 1 4 0,2 0,8
Labour Force 305 327 333 358 365 7 59 1,8 19,4
Employed 232 230 239 239 257 18 25 7,7 11,0
Unemployed 74 98 93 119 107 -12 34 -10,0 45,8
Not economically active 196 175 171 146 141 -5 -55 -3,7 -28,1
Discouraged work-seekers 31 5 21 5 5 0 -27 -3,5 -85,2
Other 165 170 150 142 136 -5 -28 -3,7 -17,2
Rates (%)
Unemployment rate 24,1 29,8 28,1 33,4 29,5 -3,9 5,4
Employed / population ratio (Absorption) 46,2 45,7 47,6 47,3 50,8 3,5 4,6
Labour force participation rate 60,9 65,2 66,1 71,0 72,1 1,1 11,2
Eastern Cape - Nelson Mandela Bay
Population 15-64 yrs 789 791 793 795 798 3 9 0,3 1,1
Labour Force 520 480 500 522 515 -6 -5 -1,2 -1,0
Employed 347 326 341 367 360 -7 13 -2,0 3,6
Unemployed 173 154 159 154 155 1 -18 0,6 -10,2
Not economically active 269 311 293 274 283 9 14 3,3 5,3
Discouraged work-seekers 6 10 3 1 -2 -66,4
Other 269 305 283 271 282 11 13 4,1 4,9
Rates (%)
Unemployment rate 33,3 32,0 31,8 29,6 30,2 0,6 -3,1
Employed / population ratio (Absorption) 44,0 41,2 43,0 46,1 45,1 -1,0 1,1
Labour force participation rate 65,9 60,7 63,0 65,6 64,5 -1,1 -1,4
Due to rounding, numbers do not necessarily add up to totals.
Note: 'Employment' refers to market production activities.
STATISTICS SOUTH AFRICA P0211
Quarterly Labour Force Survey, Quarter 1, 2017
32
Table 2.3: Labour force characteristics by province and metro (continued)
Jan-Mar 2016
Apr-Jun 2016
Jul-Sep 2016
Oct-Dec 2016
Jan-Mar 2017
Qtr-to-qtr change
Year-on-year
change
Qtr-to-qtr change
Year-on-year
change
Thousand Thousand Thousand Thousand Thousand Thousand Thousand Percent Percent
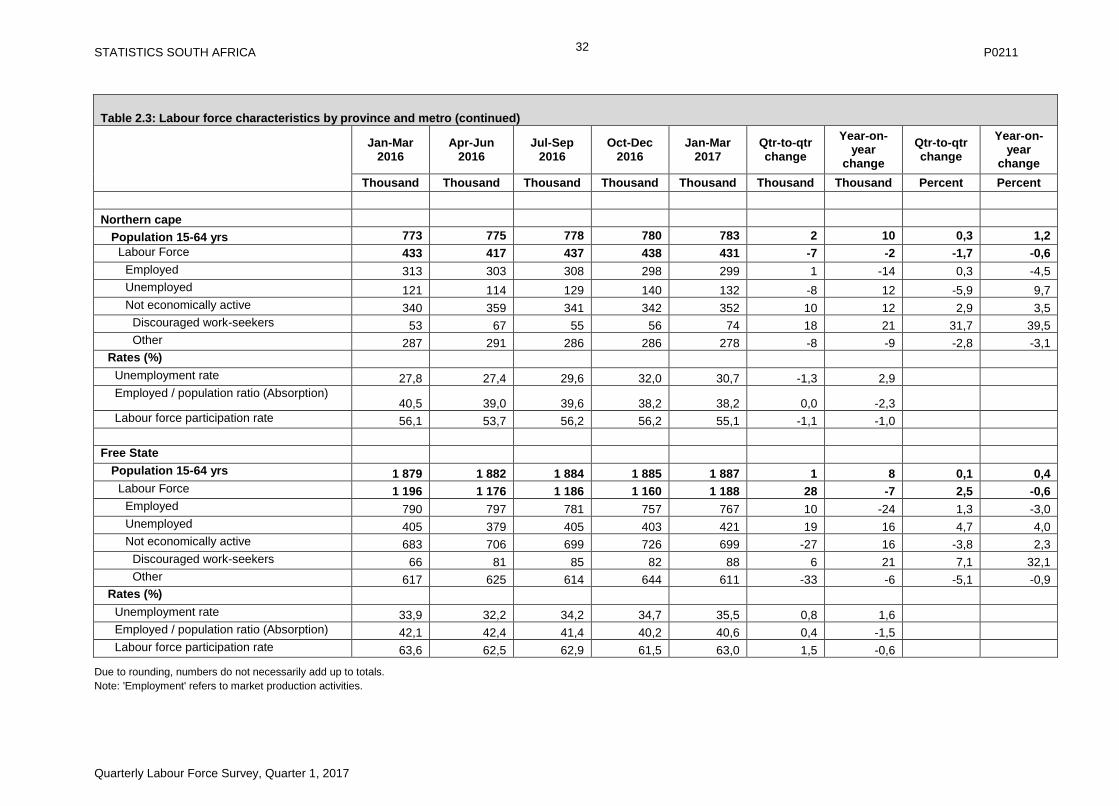
Northern cape
Population 15-64 yrs 773 775 778 780 783 2 10 0,3 1,2
Labour Force 433 417 437 438 431 -7 -2 -1,7 -0,6
Employed 313 303 308 298 299 1 -14 0,3 -4,5
Unemployed 121 114 129 140 132 -8 12 -5,9 9,7
Not economically active 340 359 341 342 352 10 12 2,9 3,5
Discouraged work-seekers 53 67 55 56 74 18 21 31,7 39,5
Other 287 291 286 286 278 -8 -9 -2,8 -3,1
Rates (%)
Unemployment rate 27,8 27,4 29,6 32,0 30,7 -1,3 2,9
Employed / population ratio (Absorption) 40,5 39,0 39,6 38,2 38,2 0,0 -2,3
Labour force participation rate 56,1 53,7 56,2 56,2 55,1 -1,1 -1,0
Free State
Population 15-64 yrs 1 879 1 882 1 884 1 885 1 887 1 8 0,1 0,4
Labour Force 1 196 1 176 1 186 1 160 1 188 28 -7 2,5 -0,6
Employed 790 797 781 757 767 10 -24 1,3 -3,0
Unemployed 405 379 405 403 421 19 16 4,7 4,0
Not economically active 683 706 699 726 699 -27 16 -3,8 2,3
Discouraged work-seekers 66 81 85 82 88 6 21 7,1 32,1
Other 617 625 614 644 611 -33 -6 -5,1 -0,9
Rates (%)
Unemployment rate 33,9 32,2 34,2 34,7 35,5 0,8 1,6
Employed / population ratio (Absorption) 42,1 42,4 41,4 40,2 40,6 0,4 -1,5
Labour force participation rate 63,6 62,5 62,9 61,5 63,0 1,5 -0,6
Due to rounding, numbers do not necessarily add up to totals.
Note: 'Employment' refers to market production activities.
STATISTICS SOUTH AFRICA P0211
Quarterly Labour Force Survey, Quarter 1, 2017
33
Table 2.3: Labour force characteristics by province and metro (continued)
Jan-Mar 2016
Apr-Jun 2016
Jul-Sep 2016
Oct-Dec 2016
Jan-Mar 2017
Qtr-to-qtr change
Year-on-year
change
Qtr-to-qtr change
Year-on-year
change
Thousand Thousand Thousand Thousand Thousand Thousand Thousand Percent Percent
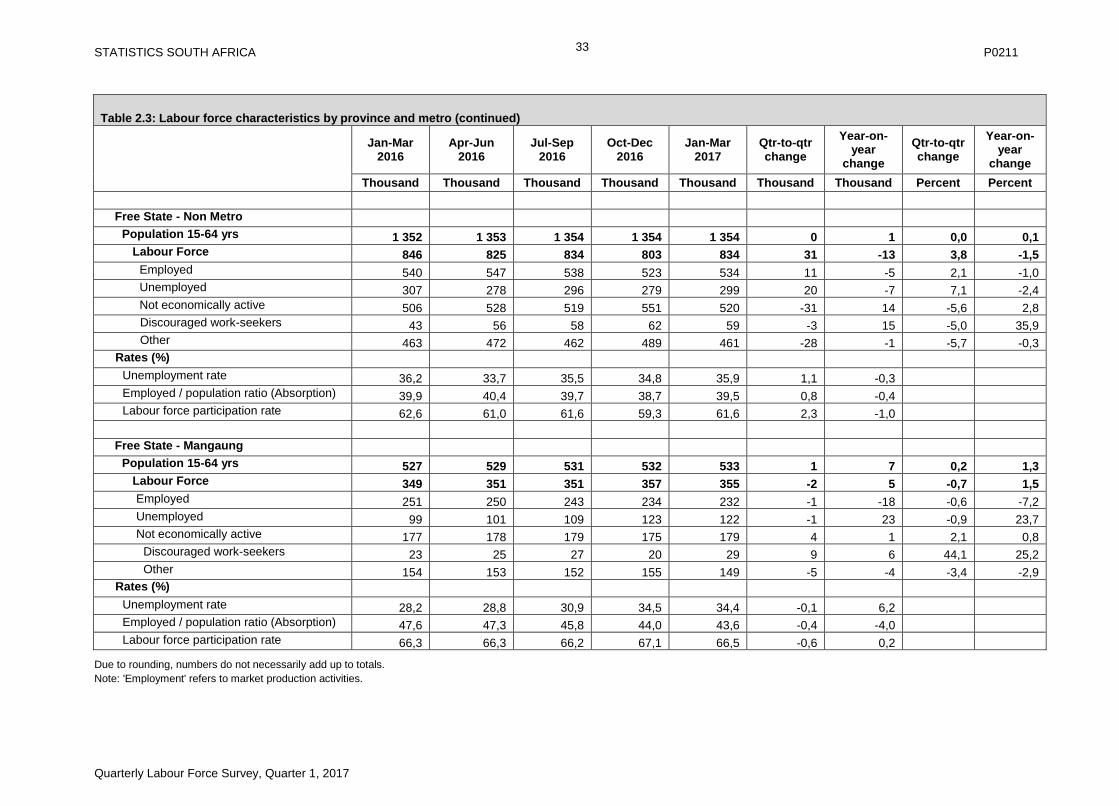
Free State - Non Metro
Population 15-64 yrs 1 352 1 353 1 354 1 354 1 354 0 1 0,0 0,1
Labour Force 846 825 834 803 834 31 -13 3,8 -1,5
Employed 540 547 538 523 534 11 -5 2,1 -1,0
Unemployed 307 278 296 279 299 20 -7 7,1 -2,4
Not economically active 506 528 519 551 520 -31 14 -5,6 2,8
Discouraged work-seekers 43 56 58 62 59 -3 15 -5,0 35,9
Other 463 472 462 489 461 -28 -1 -5,7 -0,3
Rates (%)
Unemployment rate 36,2 33,7 35,5 34,8 35,9 1,1 -0,3
Employed / population ratio (Absorption) 39,9 40,4 39,7 38,7 39,5 0,8 -0,4
Labour force participation rate 62,6 61,0 61,6 59,3 61,6 2,3 -1,0
Free State - Mangaung
Population 15-64 yrs 527 529 531 532 533 1 7 0,2 1,3
Labour Force 349 351 351 357 355 -2 5 -0,7 1,5
Employed 251 250 243 234 232 -1 -18 -0,6 -7,2
Unemployed 99 101 109 123 122 -1 23 -0,9 23,7
Not economically active 177 178 179 175 179 4 1 2,1 0,8
Discouraged work-seekers 23 25 27 20 29 9 6 44,1 25,2
Other 154 153 152 155 149 -5 -4 -3,4 -2,9
Rates (%)
Unemployment rate 28,2 28,8 30,9 34,5 34,4 -0,1 6,2
Employed / population ratio (Absorption) 47,6 47,3 45,8 44,0 43,6 -0,4 -4,0
Labour force participation rate 66,3 66,3 66,2 67,1 66,5 -0,6 0,2
Due to rounding, numbers do not necessarily add up to totals.
Note: 'Employment' refers to market production activities.
STATISTICS SOUTH AFRICA P0211
Quarterly Labour Force Survey, Quarter 1, 2017
34
Table 2.3: Labour force characteristics by province and metro (continued)
Jan-Mar 2016
Apr-Jun 2016
Jul-Sep 2016
Oct-Dec 2016
Jan-Mar 2017
Qtr-to-qtr change
Year-on-year
change
Qtr-to-qtr change
Year-on-year
change
Thousand Thousand Thousand Thousand Thousand Thousand Thousand Percent Percent
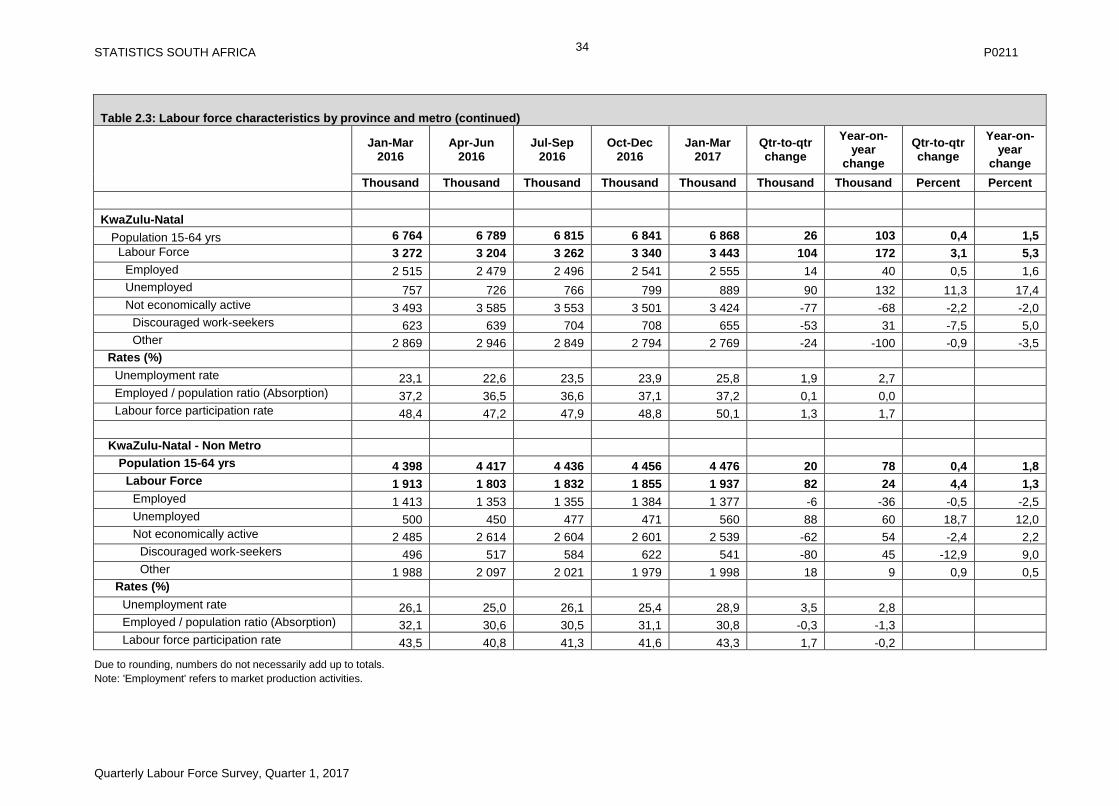
KwaZulu-Natal
Population 15-64 yrs 6 764 6 789 6 815 6 841 6 868 26 103 0,4 1,5
Labour Force 3 272 3 204 3 262 3 340 3 443 104 172 3,1 5,3
Employed 2 515 2 479 2 496 2 541 2 555 14 40 0,5 1,6
Unemployed 757 726 766 799 889 90 132 11,3 17,4
Not economically active 3 493 3 585 3 553 3 501 3 424 -77 -68 -2,2 -2,0
Discouraged work-seekers 623 639 704 708 655 -53 31 -7,5 5,0
Other 2 869 2 946 2 849 2 794 2 769 -24 -100 -0,9 -3,5
Rates (%)
Unemployment rate 23,1 22,6 23,5 23,9 25,8 1,9 2,7
Employed / population ratio (Absorption) 37,2 36,5 36,6 37,1 37,2 0,1 0,0
Labour force participation rate 48,4 47,2 47,9 48,8 50,1 1,3 1,7
KwaZulu-Natal - Non Metro
Population 15-64 yrs 4 398 4 417 4 436 4 456 4 476 20 78 0,4 1,8
Labour Force 1 913 1 803 1 832 1 855 1 937 82 24 4,4 1,3
Employed 1 413 1 353 1 355 1 384 1 377 -6 -36 -0,5 -2,5
Unemployed 500 450 477 471 560 88 60 18,7 12,0
Not economically active 2 485 2 614 2 604 2 601 2 539 -62 54 -2,4 2,2
Discouraged work-seekers 496 517 584 622 541 -80 45 -12,9 9,0
Other 1 988 2 097 2 021 1 979 1 998 18 9 0,9 0,5
Rates (%)
Unemployment rate 26,1 25,0 26,1 25,4 28,9 3,5 2,8
Employed / population ratio (Absorption) 32,1 30,6 30,5 31,1 30,8 -0,3 -1,3
Labour force participation rate 43,5 40,8 41,3 41,6 43,3 1,7 -0,2
Due to rounding, numbers do not necessarily add up to totals.
Note: 'Employment' refers to market production activities.
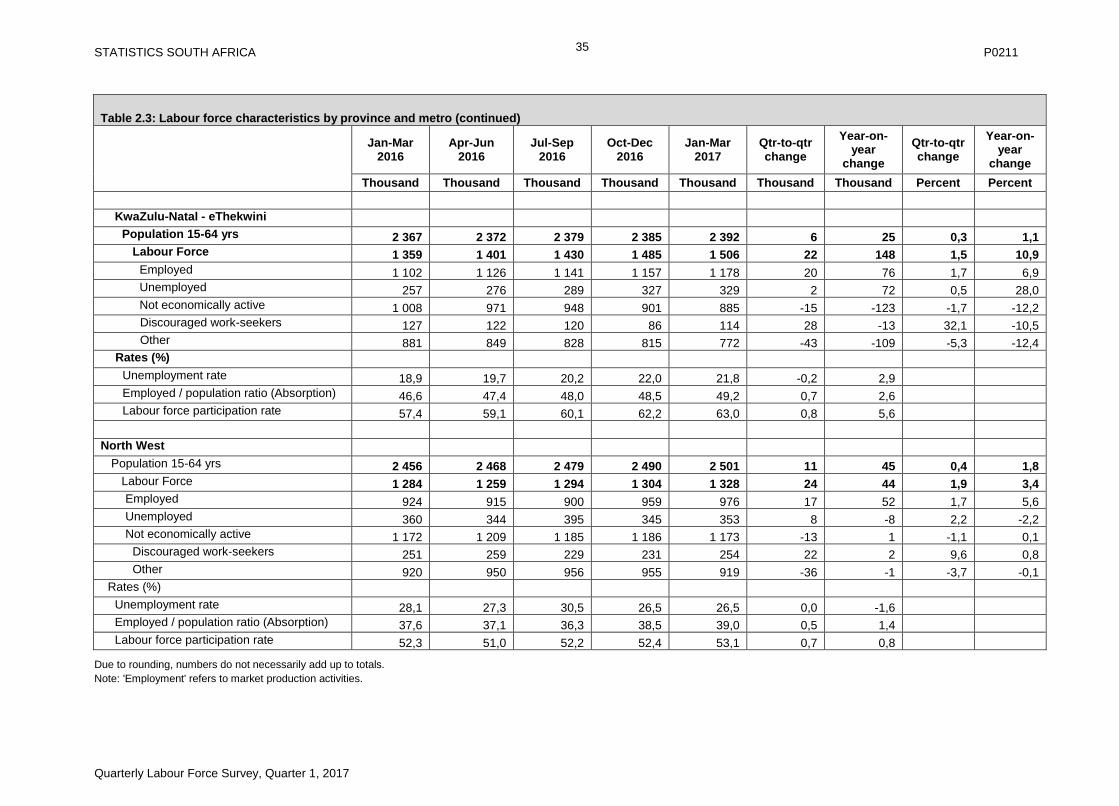
STATISTICS SOUTH AFRICA P0211
Quarterly Labour Force Survey, Quarter 1, 2017
35
Table 2.3: Labour force characteristics by province and metro (continued)
Jan-Mar 2016
Apr-Jun 2016
Jul-Sep 2016
Oct-Dec 2016
Jan-Mar 2017
Qtr-to-qtr change
Year-on-year
change
Qtr-to-qtr change
Year-on-year
change
Thousand Thousand Thousand Thousand Thousand Thousand Thousand Percent Percent
KwaZulu-Natal - eThekwini
Population 15-64 yrs 2 367 2 372 2 379 2 385 2 392 6 25 0,3 1,1
Labour Force 1 359 1 401 1 430 1 485 1 506 22 148 1,5 10,9
Employed 1 102 1 126 1 141 1 157 1 178 20 76 1,7 6,9
Unemployed 257 276 289 327 329 2 72 0,5 28,0
Not economically active 1 008 971 948 901 885 -15 -123 -1,7 -12,2
Discouraged work-seekers 127 122 120 86 114 28 -13 32,1 -10,5
Other 881 849 828 815 772 -43 -109 -5,3 -12,4
Rates (%)
Unemployment rate 18,9 19,7 20,2 22,0 21,8 -0,2 2,9
Employed / population ratio (Absorption) 46,6 47,4 48,0 48,5 49,2 0,7 2,6
Labour force participation rate 57,4 59,1 60,1 62,2 63,0 0,8 5,6
North West
Population 15-64 yrs 2 456 2 468 2 479 2 490 2 501 11 45 0,4 1,8
Labour Force 1 284 1 259 1 294 1 304 1 328 24 44 1,9 3,4
Employed 924 915 900 959 976 17 52 1,7 5,6
Unemployed 360 344 395 345 353 8 -8 2,2 -2,2
Not economically active 1 172 1 209 1 185 1 186 1 173 -13 1 -1,1 0,1
Discouraged work-seekers 251 259 229 231 254 22 2 9,6 0,8
Other 920 950 956 955 919 -36 -1 -3,7 -0,1
Rates (%)
Unemployment rate 28,1 27,3 30,5 26,5 26,5 0,0 -1,6
Employed / population ratio (Absorption) 37,6 37,1 36,3 38,5 39,0 0,5 1,4
Labour force participation rate 52,3 51,0 52,2 52,4 53,1 0,7 0,8
Due to rounding, numbers do not necessarily add up to totals.
Note: 'Employment' refers to market production activities.
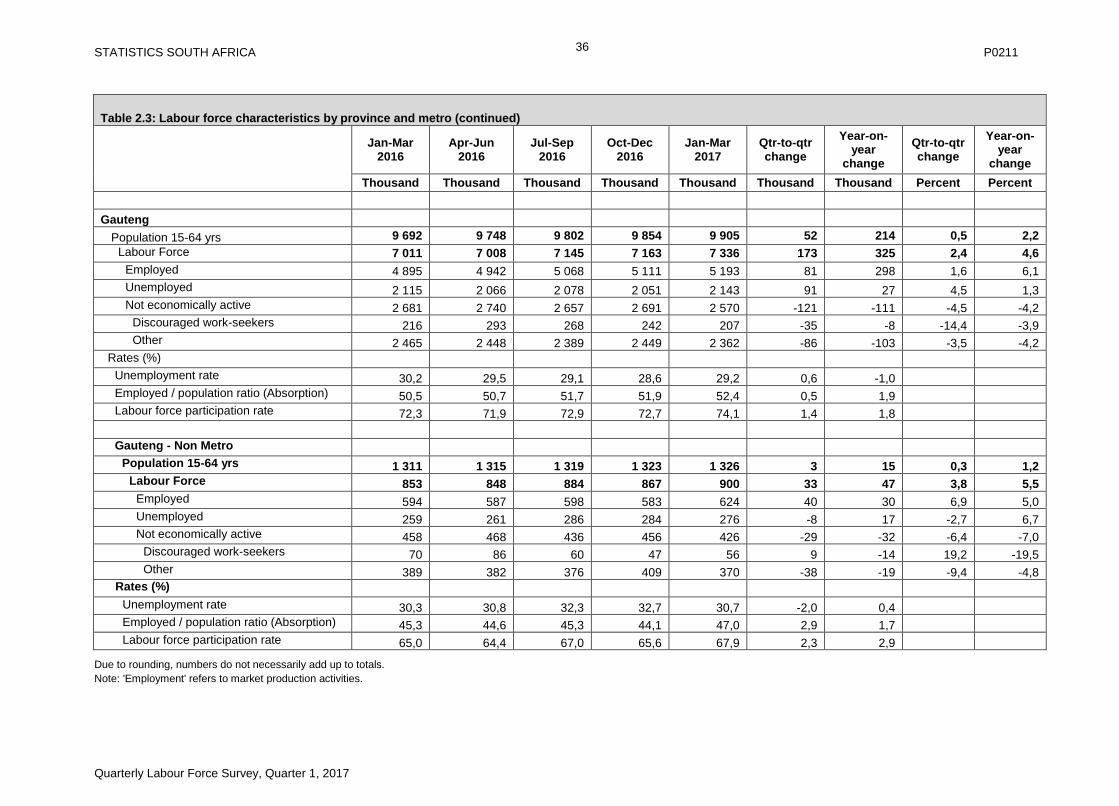
STATISTICS SOUTH AFRICA P0211
Quarterly Labour Force Survey, Quarter 1, 2017
36
Table 2.3: Labour force characteristics by province and metro (continued)
Jan-Mar 2016
Apr-Jun 2016
Jul-Sep 2016
Oct-Dec 2016
Jan-Mar 2017
Qtr-to-qtr change
Year-on-year
change
Qtr-to-qtr change
Year-on-year
change
Thousand Thousand Thousand Thousand Thousand Thousand Thousand Percent Percent
Gauteng
Population 15-64 yrs 9 692 9 748 9 802 9 854 9 905 52 214 0,5 2,2
Labour Force 7 011 7 008 7 145 7 163 7 336 173 325 2,4 4,6
Employed 4 895 4 942 5 068 5 111 5 193 81 298 1,6 6,1
Unemployed 2 115 2 066 2 078 2 051 2 143 91 27 4,5 1,3
Not economically active 2 681 2 740 2 657 2 691 2 570 -121 -111 -4,5 -4,2
Discouraged work-seekers 216 293 268 242 207 -35 -8 -14,4 -3,9
Other 2 465 2 448 2 389 2 449 2 362 -86 -103 -3,5 -4,2
Rates (%)
Unemployment rate 30,2 29,5 29,1 28,6 29,2 0,6 -1,0
Employed / population ratio (Absorption) 50,5 50,7 51,7 51,9 52,4 0,5 1,9
Labour force participation rate 72,3 71,9 72,9 72,7 74,1 1,4 1,8
Gauteng - Non Metro
Population 15-64 yrs 1 311 1 315 1 319 1 323 1 326 3 15 0,3 1,2
Labour Force 853 848 884 867 900 33 47 3,8 5,5
Employed 594 587 598 583 624 40 30 6,9 5,0
Unemployed 259 261 286 284 276 -8 17 -2,7 6,7
Not economically active 458 468 436 456 426 -29 -32 -6,4 -7,0
Discouraged work-seekers 70 86 60 47 56 9 -14 19,2 -19,5
Other 389 382 376 409 370 -38 -19 -9,4 -4,8
Rates (%)
Unemployment rate 30,3 30,8 32,3 32,7 30,7 -2,0 0,4
Employed / population ratio (Absorption) 45,3 44,6 45,3 44,1 47,0 2,9 1,7
Labour force participation rate 65,0 64,4 67,0 65,6 67,9 2,3 2,9
Due to rounding, numbers do not necessarily add up to totals.
Note: 'Employment' refers to market production activities.
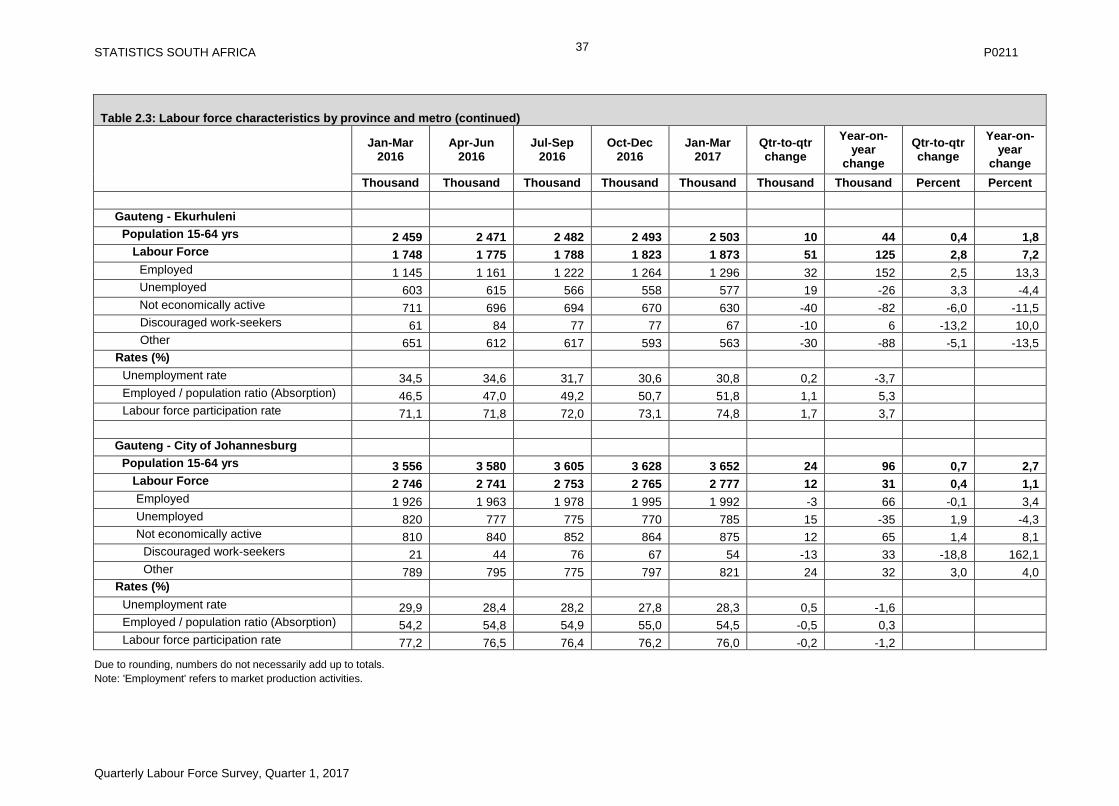
STATISTICS SOUTH AFRICA P0211
Quarterly Labour Force Survey, Quarter 1, 2017
37
Table 2.3: Labour force characteristics by province and metro (continued)
Jan-Mar 2016
Apr-Jun 2016
Jul-Sep 2016
Oct-Dec 2016
Jan-Mar 2017
Qtr-to-qtr change
Year-on-year
change
Qtr-to-qtr change
Year-on-year
change
Thousand Thousand Thousand Thousand Thousand Thousand Thousand Percent Percent
Gauteng - Ekurhuleni
Population 15-64 yrs 2 459 2 471 2 482 2 493 2 503 10 44 0,4 1,8
Labour Force 1 748 1 775 1 788 1 823 1 873 51 125 2,8 7,2
Employed 1 145 1 161 1 222 1 264 1 296 32 152 2,5 13,3
Unemployed 603 615 566 558 577 19 -26 3,3 -4,4
Not economically active 711 696 694 670 630 -40 -82 -6,0 -11,5
Discouraged work-seekers 61 84 77 77 67 -10 6 -13,2 10,0
Other 651 612 617 593 563 -30 -88 -5,1 -13,5
Rates (%)
Unemployment rate 34,5 34,6 31,7 30,6 30,8 0,2 -3,7
Employed / population ratio (Absorption) 46,5 47,0 49,2 50,7 51,8 1,1 5,3
Labour force participation rate 71,1 71,8 72,0 73,1 74,8 1,7 3,7
Gauteng - City of Johannesburg
Population 15-64 yrs 3 556 3 580 3 605 3 628 3 652 24 96 0,7 2,7
Labour Force 2 746 2 741 2 753 2 765 2 777 12 31 0,4 1,1
Employed 1 926 1 963 1 978 1 995 1 992 -3 66 -0,1 3,4
Unemployed 820 777 775 770 785 15 -35 1,9 -4,3
Not economically active 810 840 852 864 875 12 65 1,4 8,1
Discouraged work-seekers 21 44 76 67 54 -13 33 -18,8 162,1
Other 789 795 775 797 821 24 32 3,0 4,0
Rates (%)
Unemployment rate 29,9 28,4 28,2 27,8 28,3 0,5 -1,6
Employed / population ratio (Absorption) 54,2 54,8 54,9 55,0 54,5 -0,5 0,3
Labour force participation rate 77,2 76,5 76,4 76,2 76,0 -0,2 -1,2
Due to rounding, numbers do not necessarily add up to totals.
Note: 'Employment' refers to market production activities.
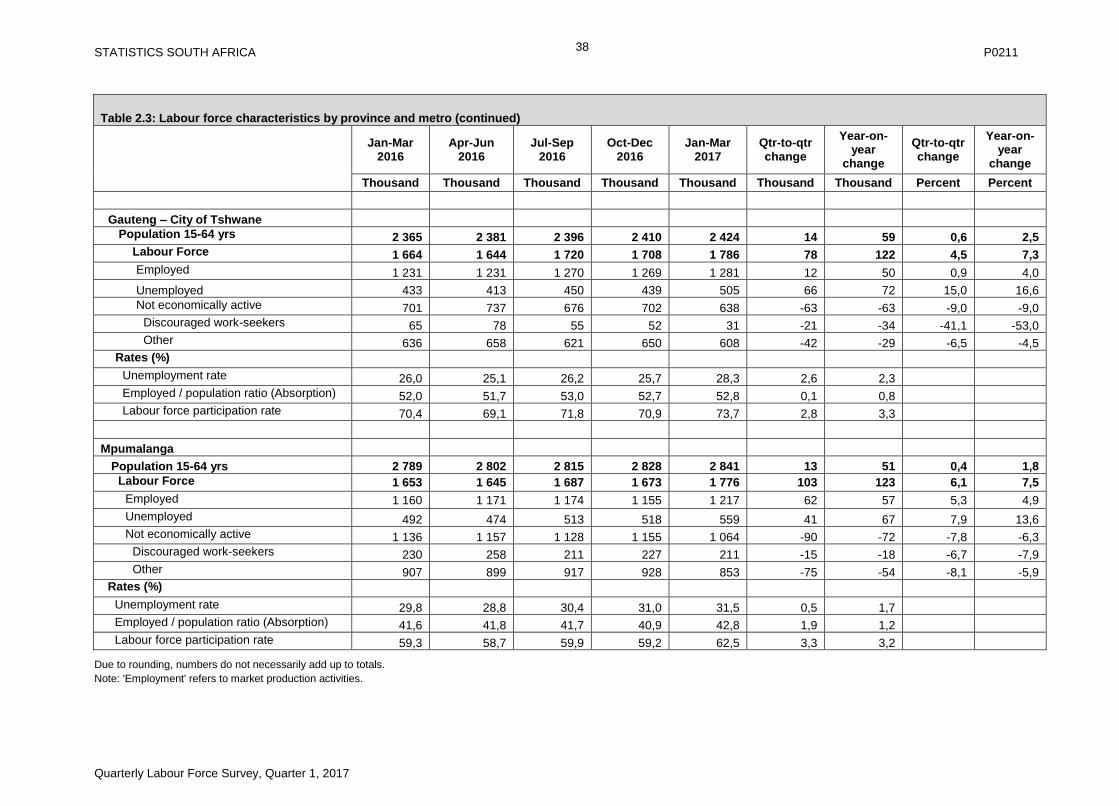
STATISTICS SOUTH AFRICA P0211
Quarterly Labour Force Survey, Quarter 1, 2017
38
Table 2.3: Labour force characteristics by province and metro (continued)
Jan-Mar 2016
Apr-Jun 2016
Jul-Sep 2016
Oct-Dec 2016
Jan-Mar 2017
Qtr-to-qtr change
Year-on-year
change
Qtr-to-qtr change
Year-on-year
change
Thousand Thousand Thousand Thousand Thousand Thousand Thousand Percent Percent
Gauteng – City of Tshwane
Population 15-64 yrs 2 365 2 381 2 396 2 410 2 424 14 59 0,6 2,5
Labour Force 1 664 1 644 1 720 1 708 1 786 78 122 4,5 7,3
Employed 1 231 1 231 1 270 1 269 1 281 12 50 0,9 4,0
Unemployed 433 413 450 439 505 66 72 15,0 16,6
Not economically active 701 737 676 702 638 -63 -63 -9,0 -9,0
Discouraged work-seekers 65 78 55 52 31 -21 -34 -41,1 -53,0
Other 636 658 621 650 608 -42 -29 -6,5 -4,5
Rates (%)
Unemployment rate 26,0 25,1 26,2 25,7 28,3 2,6 2,3
Employed / population ratio (Absorption) 52,0 51,7 53,0 52,7 52,8 0,1 0,8
Labour force participation rate 70,4 69,1 71,8 70,9 73,7 2,8 3,3
Mpumalanga
Population 15-64 yrs 2 789 2 802 2 815 2 828 2 841 13 51 0,4 1,8
Labour Force 1 653 1 645 1 687 1 673 1 776 103 123 6,1 7,5
Employed 1 160 1 171 1 174 1 155 1 217 62 57 5,3 4,9
Unemployed 492 474 513 518 559 41 67 7,9 13,6
Not economically active 1 136 1 157 1 128 1 155 1 064 -90 -72 -7,8 -6,3
Discouraged work-seekers 230 258 211 227 211 -15 -18 -6,7 -7,9
Other 907 899 917 928 853 -75 -54 -8,1 -5,9
Rates (%)
Unemployment rate 29,8 28,8 30,4 31,0 31,5 0,5 1,7
Employed / population ratio (Absorption) 41,6 41,8 41,7 40,9 42,8 1,9 1,2
Labour force participation rate 59,3 58,7 59,9 59,2 62,5 3,3 3,2
Due to rounding, numbers do not necessarily add up to totals.
Note: 'Employment' refers to market production activities.
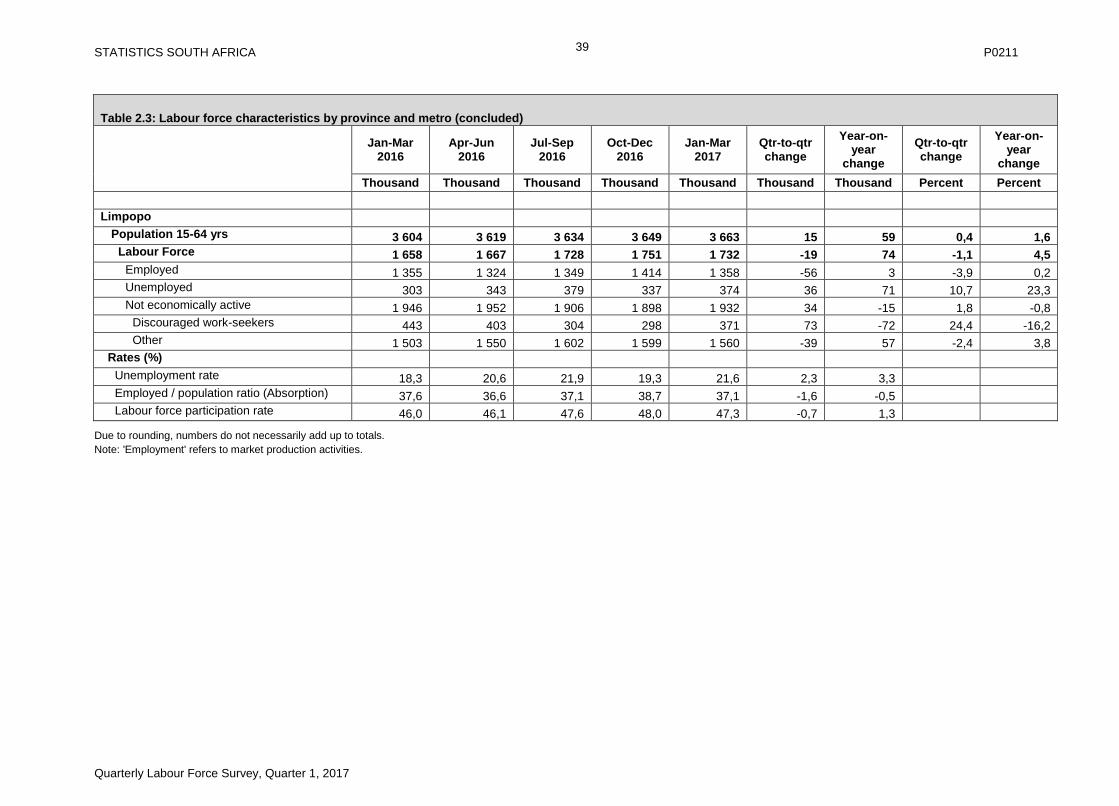
STATISTICS SOUTH AFRICA P0211
Quarterly Labour Force Survey, Quarter 1, 2017
39
Table 2.3: Labour force characteristics by province and metro (concluded)
Jan-Mar 2016
Apr-Jun 2016
Jul-Sep 2016
Oct-Dec 2016
Jan-Mar 2017
Qtr-to-qtr change
Year-on-year
change
Qtr-to-qtr change
Year-on-year
change
Thousand Thousand Thousand Thousand Thousand Thousand Thousand Percent Percent
Limpopo
Population 15-64 yrs 3 604 3 619 3 634 3 649 3 663 15 59 0,4 1,6
Labour Force 1 658 1 667 1 728 1 751 1 732 -19 74 -1,1 4,5
Employed 1 355 1 324 1 349 1 414 1 358 -56 3 -3,9 0,2
Unemployed 303 343 379 337 374 36 71 10,7 23,3
Not economically active 1 946 1 952 1 906 1 898 1 932 34 -15 1,8 -0,8
Discouraged work-seekers 443 403 304 298 371 73 -72 24,4 -16,2
Other 1 503 1 550 1 602 1 599 1 560 -39 57 -2,4 3,8
Rates (%)
Unemployment rate 18,3 20,6 21,9 19,3 21,6 2,3 3,3
Employed / population ratio (Absorption) 37,6 36,6 37,1 38,7 37,1 -1,6 -0,5
Labour force participation rate 46,0 46,1 47,6 48,0 47,3 -0,7 1,3
Due to rounding, numbers do not necessarily add up to totals.
Note: 'Employment' refers to market production activities.
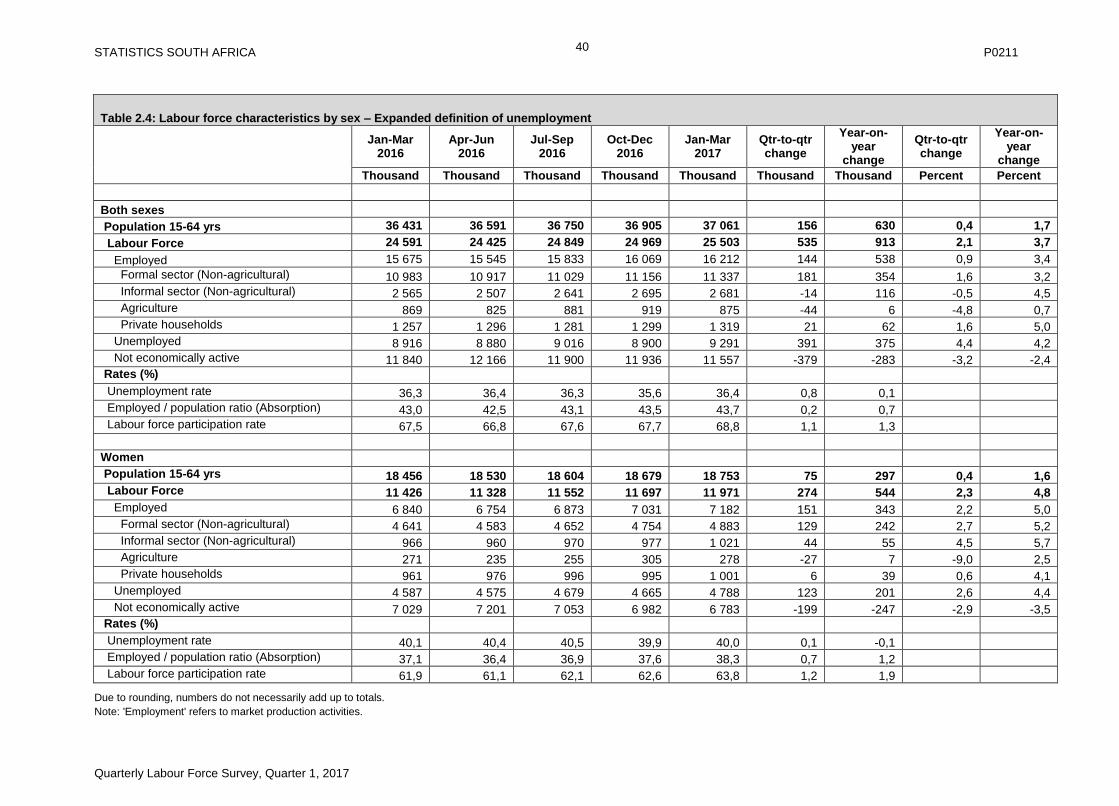
STATISTICS SOUTH AFRICA P0211
Quarterly Labour Force Survey, Quarter 1, 2017
40
Table 2.4: Labour force characteristics by sex – Expanded definition of unemployment
Jan-Mar 2016
Apr-Jun 2016
Jul-Sep 2016
Oct-Dec 2016
Jan-Mar 2017
Qtr-to-qtr change
Year-on-year
change
Qtr-to-qtr change
Year-on-year
change
Thousand Thousand Thousand Thousand Thousand Thousand Thousand Percent Percent
Both sexes
Population 15-64 yrs 36 431 36 591 36 750 36 905 37 061 156 630 0,4 1,7
Labour Force 24 591 24 425 24 849 24 969 25 503 535 913 2,1 3,7
Employed 15 675 15 545 15 833 16 069 16 212 144 538 0,9 3,4
Formal sector (Non-agricultural) 10 983 10 917 11 029 11 156 11 337 181 354 1,6 3,2
Informal sector (Non-agricultural) 2 565 2 507 2 641 2 695 2 681 -14 116 -0,5 4,5
Agriculture 869 825 881 919 875 -44 6 -4,8 0,7
Private households 1 257 1 296 1 281 1 299 1 319 21 62 1,6 5,0
Unemployed 8 916 8 880 9 016 8 900 9 291 391 375 4,4 4,2
Not economically active 11 840 12 166 11 900 11 936 11 557 -379 -283 -3,2 -2,4
Rates (%)
Unemployment rate 36,3 36,4 36,3 35,6 36,4 0,8 0,1
Employed / population ratio (Absorption) 43,0 42,5 43,1 43,5 43,7 0,2 0,7
Labour force participation rate 67,5 66,8 67,6 67,7 68,8 1,1 1,3
Women
Population 15-64 yrs 18 456 18 530 18 604 18 679 18 753 75 297 0,4 1,6
Labour Force 11 426 11 328 11 552 11 697 11 971 274 544 2,3 4,8
Employed 6 840 6 754 6 873 7 031 7 182 151 343 2,2 5,0
Formal sector (Non-agricultural) 4 641 4 583 4 652 4 754 4 883 129 242 2,7 5,2
Informal sector (Non-agricultural) 966 960 970 977 1 021 44 55 4,5 5,7
Agriculture 271 235 255 305 278 -27 7 -9,0 2,5
Private households 961 976 996 995 1 001 6 39 0,6 4,1
Unemployed 4 587 4 575 4 679 4 665 4 788 123 201 2,6 4,4
Not economically active 7 029 7 201 7 053 6 982 6 783 -199 -247 -2,9 -3,5
Rates (%)
Unemployment rate 40,1 40,4 40,5 39,9 40,0 0,1 -0,1
Employed / population ratio (Absorption) 37,1 36,4 36,9 37,6 38,3 0,7 1,2
Labour force participation rate 61,9 61,1 62,1 62,6 63,8 1,2 1,9
Due to rounding, numbers do not necessarily add up to totals.
Note: 'Employment' refers to market production activities.
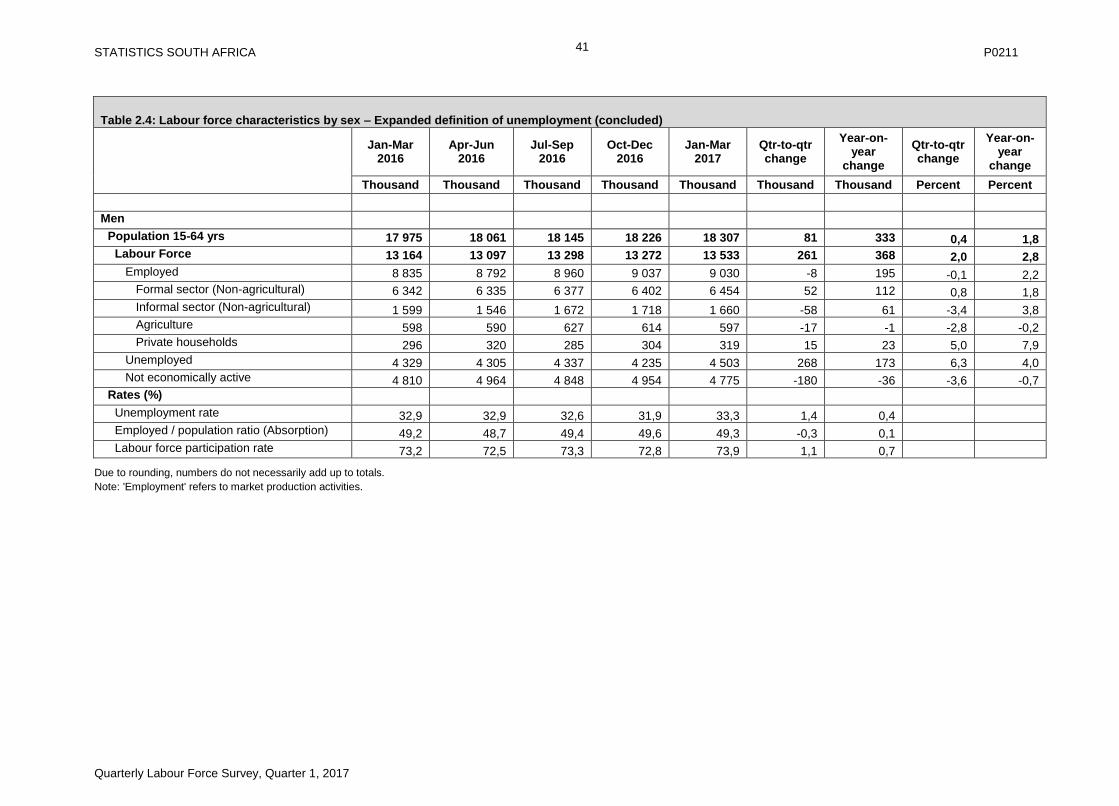
STATISTICS SOUTH AFRICA P0211
Quarterly Labour Force Survey, Quarter 1, 2017
41
Table 2.4: Labour force characteristics by sex – Expanded definition of unemployment (concluded)
Jan-Mar 2016
Apr-Jun 2016
Jul-Sep 2016
Oct-Dec 2016
Jan-Mar 2017
Qtr-to-qtr change
Year-on-year
change
Qtr-to-qtr change
Year-on-year
change
Thousand Thousand Thousand Thousand Thousand Thousand Thousand Percent Percent
Men
Population 15-64 yrs 17 975 18 061 18 145 18 226 18 307 81 333 0,4 1,8
Labour Force 13 164 13 097 13 298 13 272 13 533 261 368 2,0 2,8
Employed 8 835 8 792 8 960 9 037 9 030 -8 195 -0,1 2,2
Formal sector (Non-agricultural) 6 342 6 335 6 377 6 402 6 454 52 112 0,8 1,8
Informal sector (Non-agricultural) 1 599 1 546 1 672 1 718 1 660 -58 61 -3,4 3,8
Agriculture 598 590 627 614 597 -17 -1 -2,8 -0,2
Private households 296 320 285 304 319 15 23 5,0 7,9
Unemployed 4 329 4 305 4 337 4 235 4 503 268 173 6,3 4,0
Not economically active 4 810 4 964 4 848 4 954 4 775 -180 -36 -3,6 -0,7
Rates (%)
Unemployment rate 32,9 32,9 32,6 31,9 33,3 1,4 0,4
Employed / population ratio (Absorption) 49,2 48,7 49,4 49,6 49,3 -0,3 0,1
Labour force participation rate 73,2 72,5 73,3 72,8 73,9 1,1 0,7
Due to rounding, numbers do not necessarily add up to totals.
Note: 'Employment' refers to market production activities.
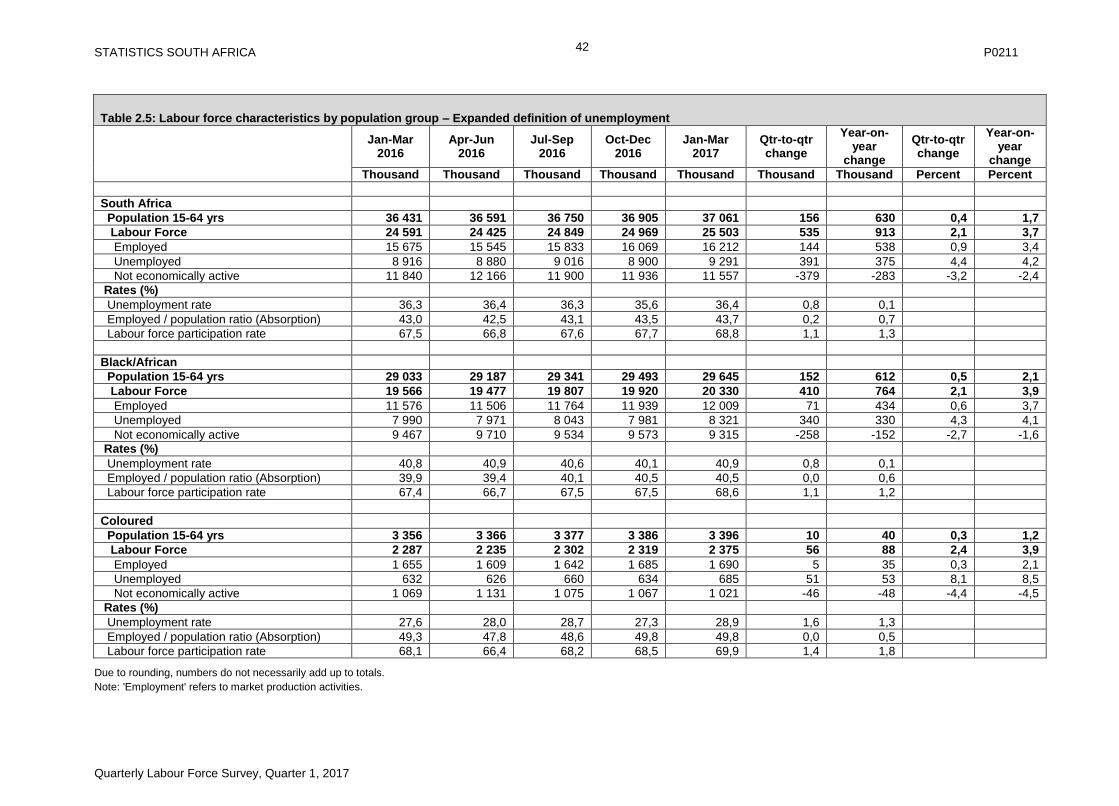
STATISTICS SOUTH AFRICA P0211
Quarterly Labour Force Survey, Quarter 1, 2017
42
Table 2.5: Labour force characteristics by population group – Expanded definition of unemployment
Jan-Mar 2016
Apr-Jun 2016
Jul-Sep 2016
Oct-Dec 2016
Jan-Mar 2017
Qtr-to-qtr change
Year-on-year
change
Qtr-to-qtr change
Year-on-year
change
Thousand Thousand Thousand Thousand Thousand Thousand Thousand Percent Percent
South Africa
Population 15-64 yrs 36 431 36 591 36 750 36 905 37 061 156 630 0,4 1,7
Labour Force 24 591 24 425 24 849 24 969 25 503 535 913 2,1 3,7
Employed 15 675 15 545 15 833 16 069 16 212 144 538 0,9 3,4
Unemployed 8 916 8 880 9 016 8 900 9 291 391 375 4,4 4,2
Not economically active 11 840 12 166 11 900 11 936 11 557 -379 -283 -3,2 -2,4
Rates (%)
Unemployment rate 36,3 36,4 36,3 35,6 36,4 0,8 0,1
Employed / population ratio (Absorption) 43,0 42,5 43,1 43,5 43,7 0,2 0,7
Labour force participation rate 67,5 66,8 67,6 67,7 68,8 1,1 1,3
Black/African
Population 15-64 yrs 29 033 29 187 29 341 29 493 29 645 152 612 0,5 2,1
Labour Force 19 566 19 477 19 807 19 920 20 330 410 764 2,1 3,9
Employed 11 576 11 506 11 764 11 939 12 009 71 434 0,6 3,7
Unemployed 7 990 7 971 8 043 7 981 8 321 340 330 4,3 4,1
Not economically active 9 467 9 710 9 534 9 573 9 315 -258 -152 -2,7 -1,6
Rates (%)
Unemployment rate 40,8 40,9 40,6 40,1 40,9 0,8 0,1
Employed / population ratio (Absorption) 39,9 39,4 40,1 40,5 40,5 0,0 0,6
Labour force participation rate 67,4 66,7 67,5 67,5 68,6 1,1 1,2
Coloured
Population 15-64 yrs 3 356 3 366 3 377 3 386 3 396 10 40 0,3 1,2
Labour Force 2 287 2 235 2 302 2 319 2 375 56 88 2,4 3,9
Employed 1 655 1 609 1 642 1 685 1 690 5 35 0,3 2,1
Unemployed 632 626 660 634 685 51 53 8,1 8,5
Not economically active 1 069 1 131 1 075 1 067 1 021 -46 -48 -4,4 -4,5
Rates (%)
Unemployment rate 27,6 28,0 28,7 27,3 28,9 1,6 1,3
Employed / population ratio (Absorption) 49,3 47,8 48,6 49,8 49,8 0,0 0,5
Labour force participation rate 68,1 66,4 68,2 68,5 69,9 1,4 1,8
Due to rounding, numbers do not necessarily add up to totals.
Note: 'Employment' refers to market production activities.
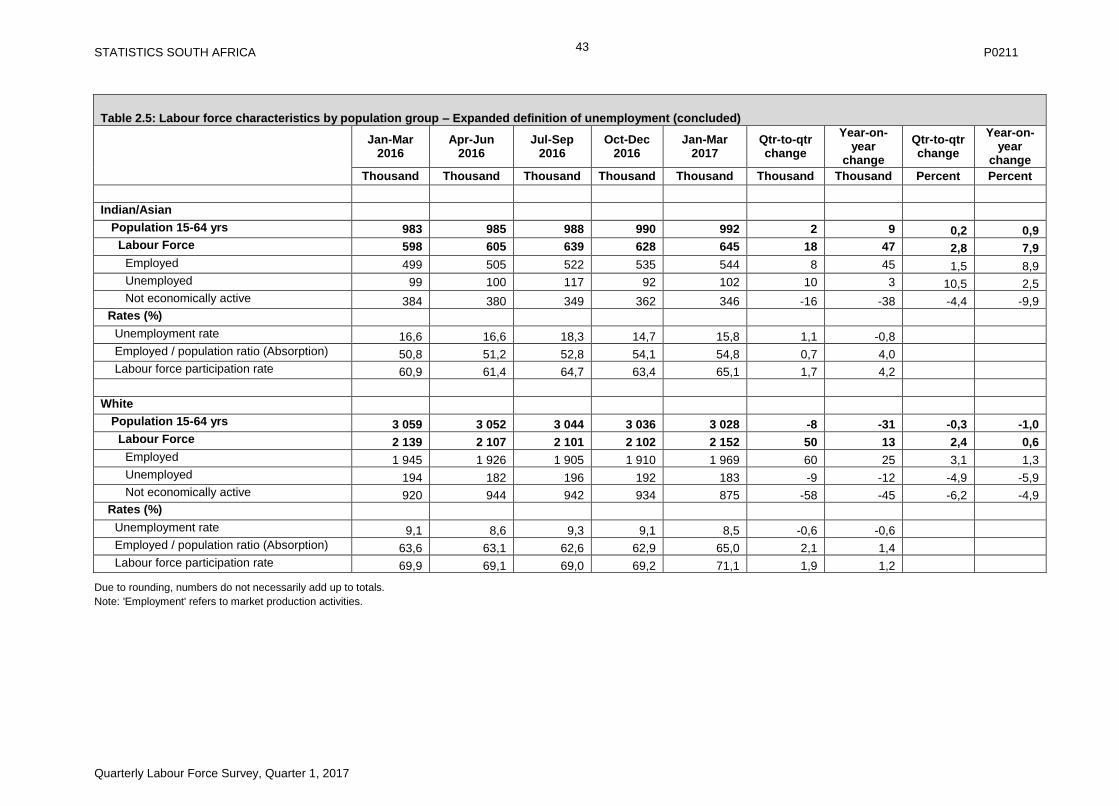
STATISTICS SOUTH AFRICA P0211
Quarterly Labour Force Survey, Quarter 1, 2017
43
Table 2.5: Labour force characteristics by population group – Expanded definition of unemployment (concluded)
Jan-Mar 2016
Apr-Jun 2016
Jul-Sep 2016
Oct-Dec 2016
Jan-Mar 2017
Qtr-to-qtr change
Year-on-year
change
Qtr-to-qtr change
Year-on-year
change
Thousand Thousand Thousand Thousand Thousand Thousand Thousand Percent Percent
Indian/Asian
Population 15-64 yrs 983 985 988 990 992 2 9 0,2 0,9
Labour Force 598 605 639 628 645 18 47 2,8 7,9
Employed 499 505 522 535 544 8 45 1,5 8,9
Unemployed 99 100 117 92 102 10 3 10,5 2,5
Not economically active 384 380 349 362 346 -16 -38 -4,4 -9,9
Rates (%)
Unemployment rate 16,6 16,6 18,3 14,7 15,8 1,1 -0,8
Employed / population ratio (Absorption) 50,8 51,2 52,8 54,1 54,8 0,7 4,0
Labour force participation rate 60,9 61,4 64,7 63,4 65,1 1,7 4,2
White
Population 15-64 yrs 3 059 3 052 3 044 3 036 3 028 -8 -31 -0,3 -1,0
Labour Force 2 139 2 107 2 101 2 102 2 152 50 13 2,4 0,6
Employed 1 945 1 926 1 905 1 910 1 969 60 25 3,1 1,3
Unemployed 194 182 196 192 183 -9 -12 -4,9 -5,9
Not economically active 920 944 942 934 875 -58 -45 -6,2 -4,9
Rates (%)
Unemployment rate 9,1 8,6 9,3 9,1 8,5 -0,6 -0,6
Employed / population ratio (Absorption) 63,6 63,1 62,6 62,9 65,0 2,1 1,4
Labour force participation rate 69,9 69,1 69,0 69,2 71,1 1,9 1,2
Due to rounding, numbers do not necessarily add up to totals.
Note: 'Employment' refers to market production activities.
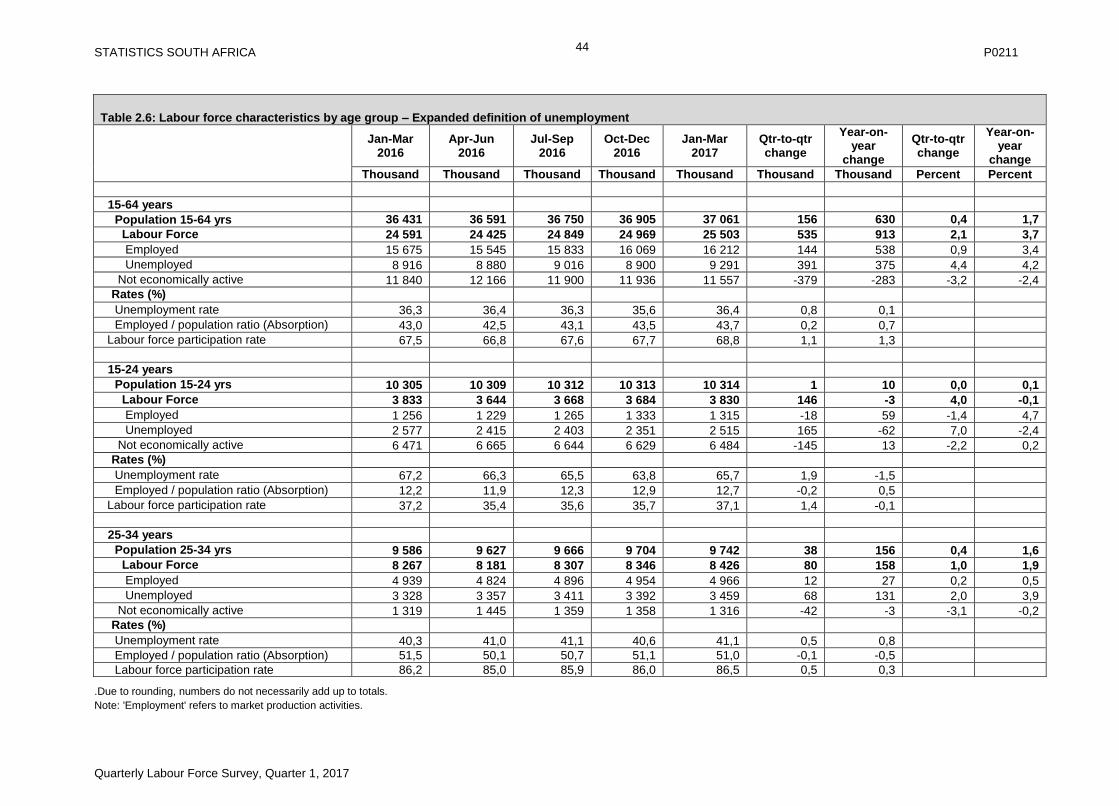
STATISTICS SOUTH AFRICA P0211
Quarterly Labour Force Survey, Quarter 1, 2017
44
Table 2.6: Labour force characteristics by age group – Expanded definition of unemployment
Jan-Mar 2016
Apr-Jun 2016
Jul-Sep 2016
Oct-Dec 2016
Jan-Mar 2017
Qtr-to-qtr change
Year-on-year
change
Qtr-to-qtr change
Year-on-year
change
Thousand Thousand Thousand Thousand Thousand Thousand Thousand Percent Percent
15-64 years
Population 15-64 yrs 36 431 36 591 36 750 36 905 37 061 156 630 0,4 1,7
Labour Force 24 591 24 425 24 849 24 969 25 503 535 913 2,1 3,7
Employed 15 675 15 545 15 833 16 069 16 212 144 538 0,9 3,4
Unemployed 8 916 8 880 9 016 8 900 9 291 391 375 4,4 4,2
Not economically active 11 840 12 166 11 900 11 936 11 557 -379 -283 -3,2 -2,4
Rates (%)
Unemployment rate 36,3 36,4 36,3 35,6 36,4 0,8 0,1
Employed / population ratio (Absorption) 43,0 42,5 43,1 43,5 43,7 0,2 0,7
Labour force participation rate 67,5 66,8 67,6 67,7 68,8 1,1 1,3
15-24 years
Population 15-24 yrs 10 305 10 309 10 312 10 313 10 314 1 10 0,0 0,1
Labour Force 3 833 3 644 3 668 3 684 3 830 146 -3 4,0 -0,1
Employed 1 256 1 229 1 265 1 333 1 315 -18 59 -1,4 4,7
Unemployed 2 577 2 415 2 403 2 351 2 515 165 -62 7,0 -2,4
Not economically active 6 471 6 665 6 644 6 629 6 484 -145 13 -2,2 0,2
Rates (%)
Unemployment rate 67,2 66,3 65,5 63,8 65,7 1,9 -1,5
Employed / population ratio (Absorption) 12,2 11,9 12,3 12,9 12,7 -0,2 0,5
Labour force participation rate 37,2 35,4 35,6 35,7 37,1 1,4 -0,1
25-34 years
Population 25-34 yrs 9 586 9 627 9 666 9 704 9 742 38 156 0,4 1,6
Labour Force 8 267 8 181 8 307 8 346 8 426 80 158 1,0 1,9
Employed 4 939 4 824 4 896 4 954 4 966 12 27 0,2 0,5
Unemployed 3 328 3 357 3 411 3 392 3 459 68 131 2,0 3,9
Not economically active 1 319 1 445 1 359 1 358 1 316 -42 -3 -3,1 -0,2
Rates (%)
Unemployment rate 40,3 41,0 41,1 40,6 41,1 0,5 0,8
Employed / population ratio (Absorption) 51,5 50,1 50,7 51,1 51,0 -0,1 -0,5
Labour force participation rate 86,2 85,0 85,9 86,0 86,5 0,5 0,3
.Due to rounding, numbers do not necessarily add up to totals.
Note: 'Employment' refers to market production activities.

STATISTICS SOUTH AFRICA P0211
Quarterly Labour Force Survey, Quarter 1, 2017
45
Table 2.6: Labour force characteristics by age group – Expanded definition of unemployment (concluded)
Jan-Mar 2016
Apr-Jun 2016
Jul-Sep 2016
Oct-Dec 2016
Jan-Mar 2017
Qtr-to-qtr change
Year-on-year
change
Qtr-to-qtr change
Year-on-year
change
Thousand Thousand Thousand Thousand Thousand Thousand Thousand Percent Percent
35-44 years
Population 35-44 yrs 7 732 7 778 7 821 7 861 7 902 41 170 0,5 2,2
Labour Force 6 699 6 739 6 867 6 916 6 974 58 275 0,8 4,1
Employed 4 868 4 815 4 923 4 992 5 016 24 148 0,5 3,0
Unemployed 1 831 1 923 1 944 1 924 1 958 34 127 1,8 7,0
Not economically active 1 033 1 039 954 945 928 -17 -105 -1,8 -10,2
Rates (%)
Unemployment rate 27,3 28,5 28,3 27,8 28,1 0,3 0,8
Employed / population ratio (Absorption) 63,0 61,9 62,9 63,5 63,5 0,0 0,5
Labour force participation rate 86,6 86,6 87,8 88,0 88,3 0,3 1,7
45-54 years
Population 45-54 yrs 5 247 5 287 5 330 5 375 5 421 46 174 0,8 3,3
Labour Force 4 132 4 181 4 288 4 272 4 424 151 292 3,5 7,1
Employed 3 220 3 279 3 323 3 313 3 393 80 173 2,4 5,4
Unemployed 912 902 965 960 1 031 71 119 7,4 13,1
Not economically active 1 115 1 106 1 042 1 103 997 -106 -118 -9,6 -10,6
Rates (%)
Unemployment rate 22,1 21,6 22,5 22,5 23,3 0,8 1,2
Employed / population ratio (Absorption) 61,4 62,0 62,3 61,6 62,6 1,0 1,2
Labour force participation rate 78,7 79,1 80,5 79,5 81,6 2,1 2,9
55-64 years
Population 55-64 yrs 3 561 3 590 3 621 3 651 3 682 31 121 0,8 3,4
Labour Force 1 659 1 680 1 719 1 750 1 849 99 190 5,7 11,5
Employed 1 391 1 398 1 426 1 477 1 522 45 131 3,1 9,4
Unemployed 268 282 293 273 327 54 59 19,7 22,0
Not economically active 1 901 1 911 1 902 1 901 1 832 -69 -69 -3,6 -3,6
Rates (%)
Unemployment rate 16,2 16,8 17,0 15,6 17,7 2,1 1,5
Employed / population ratio (Absorption) 39,1 38,9 39,4 40,5 41,3 0,8 2,2
Labour force participation rate 46,6 46,8 47,5 47,9 50,2 2,3 3,6
Due to rounding, numbers do not necessarily add up to totals.
Note: 'Employment' refers to market production activities.
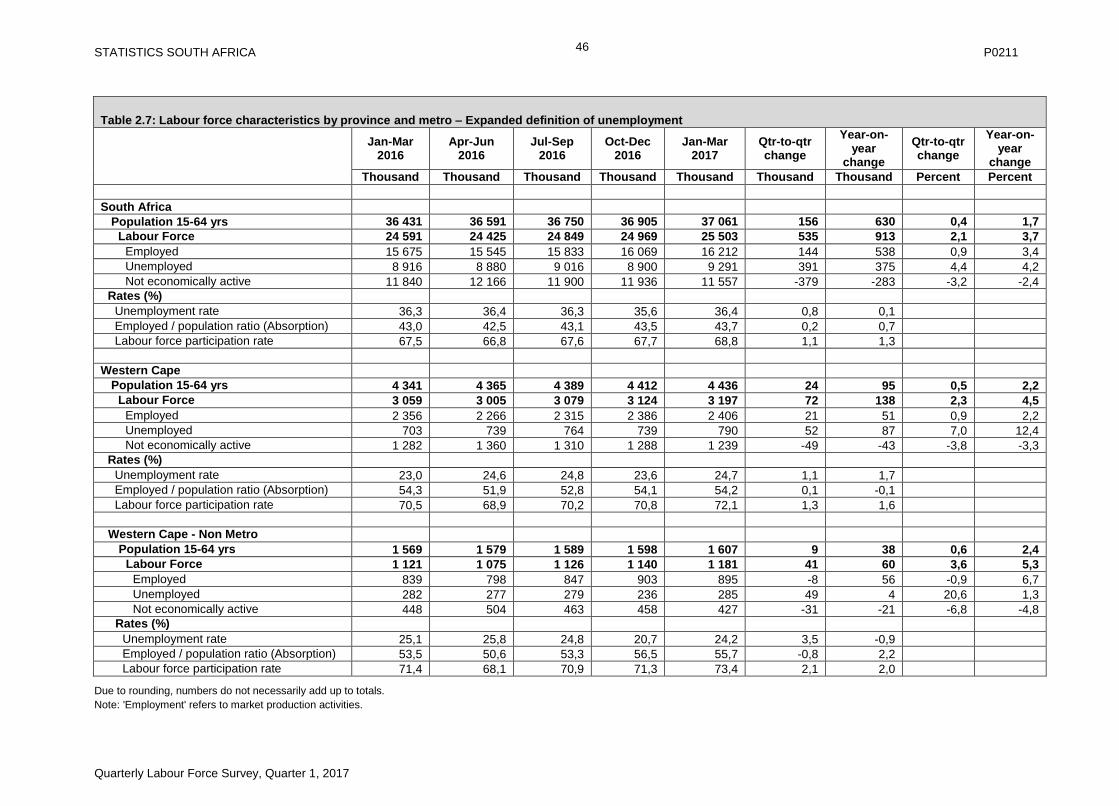
STATISTICS SOUTH AFRICA P0211
Quarterly Labour Force Survey, Quarter 1, 2017
46
Table 2.7: Labour force characteristics by province and metro – Expanded definition of unemployment
Jan-Mar 2016
Apr-Jun 2016
Jul-Sep 2016
Oct-Dec 2016
Jan-Mar 2017
Qtr-to-qtr change
Year-on-year
change
Qtr-to-qtr change
Year-on-year
change
Thousand Thousand Thousand Thousand Thousand Thousand Thousand Percent Percent
South Africa
Population 15-64 yrs 36 431 36 591 36 750 36 905 37 061 156 630 0,4 1,7
Labour Force 24 591 24 425 24 849 24 969 25 503 535 913 2,1 3,7
Employed 15 675 15 545 15 833 16 069 16 212 144 538 0,9 3,4
Unemployed 8 916 8 880 9 016 8 900 9 291 391 375 4,4 4,2
Not economically active 11 840 12 166 11 900 11 936 11 557 -379 -283 -3,2 -2,4
Rates (%)
Unemployment rate 36,3 36,4 36,3 35,6 36,4 0,8 0,1
Employed / population ratio (Absorption) 43,0 42,5 43,1 43,5 43,7 0,2 0,7
Labour force participation rate 67,5 66,8 67,6 67,7 68,8 1,1 1,3
Western Cape
Population 15-64 yrs 4 341 4 365 4 389 4 412 4 436 24 95 0,5 2,2
Labour Force 3 059 3 005 3 079 3 124 3 197 72 138 2,3 4,5
Employed 2 356 2 266 2 315 2 386 2 406 21 51 0,9 2,2
Unemployed 703 739 764 739 790 52 87 7,0 12,4
Not economically active 1 282 1 360 1 310 1 288 1 239 -49 -43 -3,8 -3,3
Rates (%)
Unemployment rate 23,0 24,6 24,8 23,6 24,7 1,1 1,7
Employed / population ratio (Absorption) 54,3 51,9 52,8 54,1 54,2 0,1 -0,1
Labour force participation rate 70,5 68,9 70,2 70,8 72,1 1,3 1,6
Western Cape - Non Metro
Population 15-64 yrs 1 569 1 579 1 589 1 598 1 607 9 38 0,6 2,4
Labour Force 1 121 1 075 1 126 1 140 1 181 41 60 3,6 5,3
Employed 839 798 847 903 895 -8 56 -0,9 6,7
Unemployed 282 277 279 236 285 49 4 20,6 1,3
Not economically active 448 504 463 458 427 -31 -21 -6,8 -4,8
Rates (%)
Unemployment rate 25,1 25,8 24,8 20,7 24,2 3,5 -0,9
Employed / population ratio (Absorption) 53,5 50,6 53,3 56,5 55,7 -0,8 2,2
Labour force participation rate 71,4 68,1 70,9 71,3 73,4 2,1 2,0
Due to rounding, numbers do not necessarily add up to totals.
Note: 'Employment' refers to market production activities.
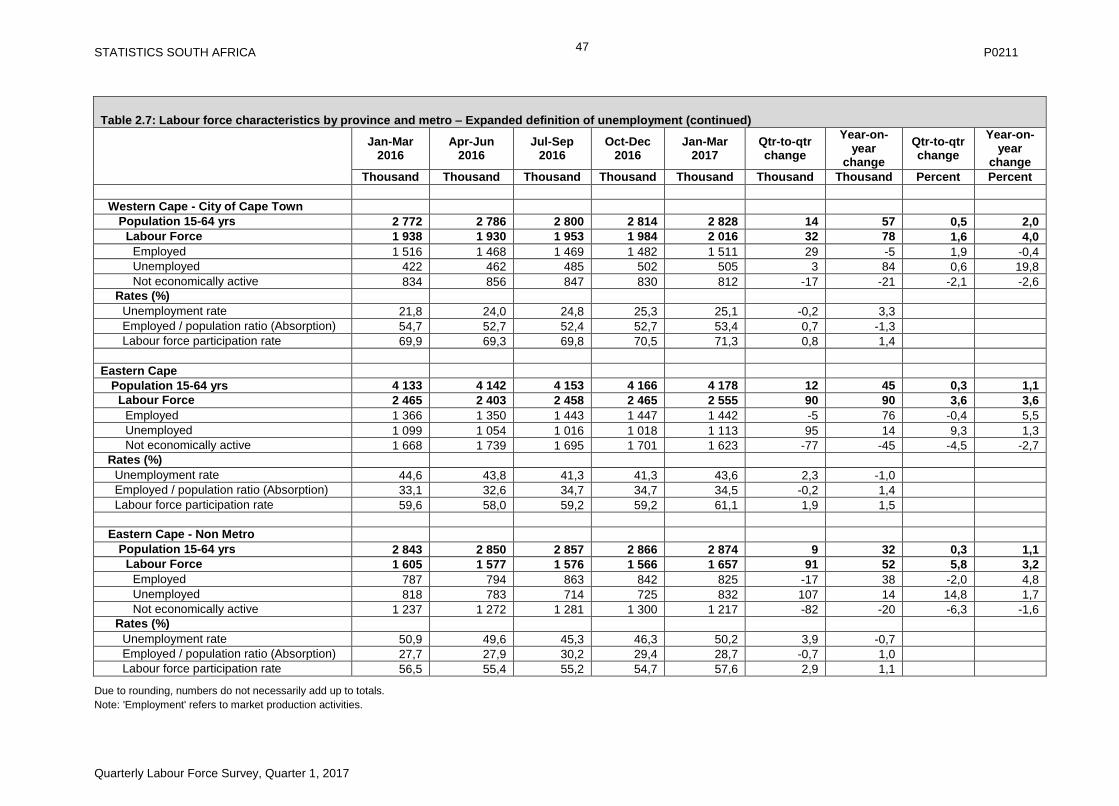
STATISTICS SOUTH AFRICA P0211
Quarterly Labour Force Survey, Quarter 1, 2017
47
Table 2.7: Labour force characteristics by province and metro – Expanded definition of unemployment (continued)
Jan-Mar 2016
Apr-Jun 2016
Jul-Sep 2016
Oct-Dec 2016
Jan-Mar 2017
Qtr-to-qtr change
Year-on-year
change
Qtr-to-qtr change
Year-on-year
change
Thousand Thousand Thousand Thousand Thousand Thousand Thousand Percent Percent
Western Cape - City of Cape Town
Population 15-64 yrs 2 772 2 786 2 800 2 814 2 828 14 57 0,5 2,0
Labour Force 1 938 1 930 1 953 1 984 2 016 32 78 1,6 4,0
Employed 1 516 1 468 1 469 1 482 1 511 29 -5 1,9 -0,4
Unemployed 422 462 485 502 505 3 84 0,6 19,8
Not economically active 834 856 847 830 812 -17 -21 -2,1 -2,6
Rates (%)
Unemployment rate 21,8 24,0 24,8 25,3 25,1 -0,2 3,3
Employed / population ratio (Absorption) 54,7 52,7 52,4 52,7 53,4 0,7 -1,3
Labour force participation rate 69,9 69,3 69,8 70,5 71,3 0,8 1,4
Eastern Cape
Population 15-64 yrs 4 133 4 142 4 153 4 166 4 178 12 45 0,3 1,1
Labour Force 2 465 2 403 2 458 2 465 2 555 90 90 3,6 3,6
Employed 1 366 1 350 1 443 1 447 1 442 -5 76 -0,4 5,5
Unemployed 1 099 1 054 1 016 1 018 1 113 95 14 9,3 1,3
Not economically active 1 668 1 739 1 695 1 701 1 623 -77 -45 -4,5 -2,7
Rates (%)
Unemployment rate 44,6 43,8 41,3 41,3 43,6 2,3 -1,0
Employed / population ratio (Absorption) 33,1 32,6 34,7 34,7 34,5 -0,2 1,4
Labour force participation rate 59,6 58,0 59,2 59,2 61,1 1,9 1,5
Eastern Cape - Non Metro
Population 15-64 yrs 2 843 2 850 2 857 2 866 2 874 9 32 0,3 1,1
Labour Force 1 605 1 577 1 576 1 566 1 657 91 52 5,8 3,2
Employed 787 794 863 842 825 -17 38 -2,0 4,8
Unemployed 818 783 714 725 832 107 14 14,8 1,7
Not economically active 1 237 1 272 1 281 1 300 1 217 -82 -20 -6,3 -1,6
Rates (%)
Unemployment rate 50,9 49,6 45,3 46,3 50,2 3,9 -0,7
Employed / population ratio (Absorption) 27,7 27,9 30,2 29,4 28,7 -0,7 1,0
Labour force participation rate 56,5 55,4 55,2 54,7 57,6 2,9 1,1
Due to rounding, numbers do not necessarily add up to totals.
Note: 'Employment' refers to market production activities.
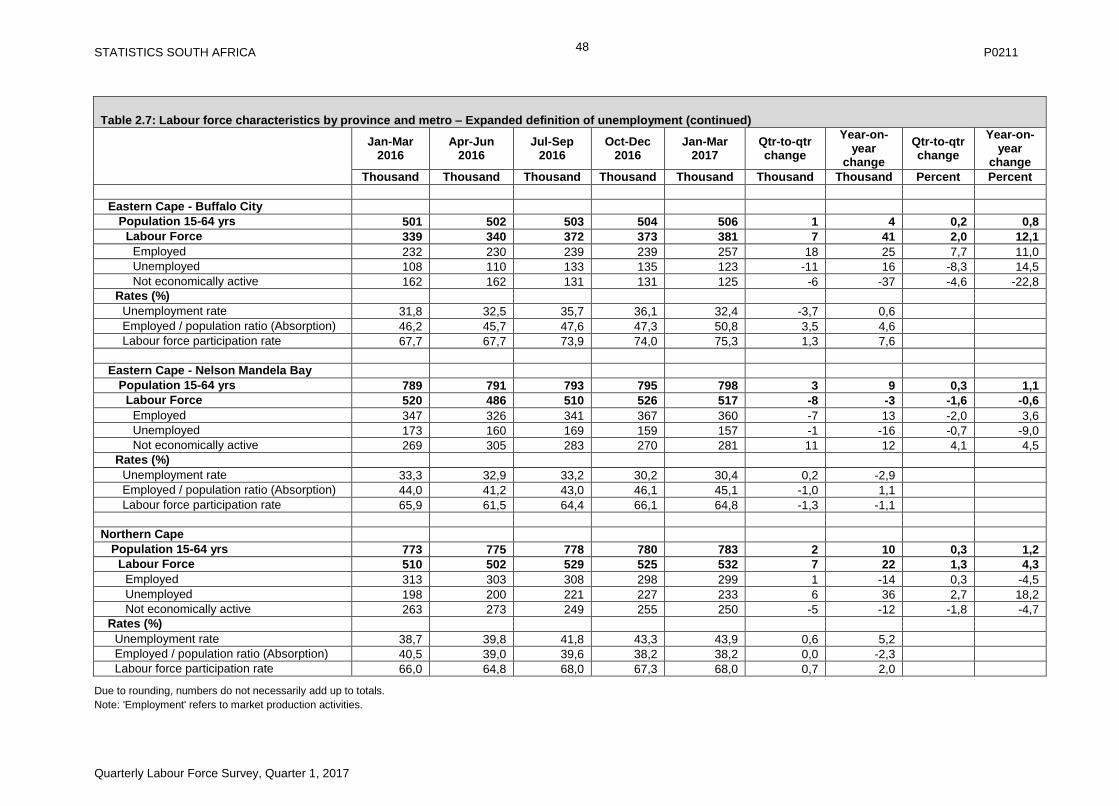
STATISTICS SOUTH AFRICA P0211
Quarterly Labour Force Survey, Quarter 1, 2017
48
Table 2.7: Labour force characteristics by province and metro – Expanded definition of unemployment (continued)
Jan-Mar 2016
Apr-Jun 2016
Jul-Sep 2016
Oct-Dec 2016
Jan-Mar 2017
Qtr-to-qtr change
Year-on-year
change
Qtr-to-qtr change
Year-on-year
change
Thousand Thousand Thousand Thousand Thousand Thousand Thousand Percent Percent
Eastern Cape - Buffalo City
Population 15-64 yrs 501 502 503 504 506 1 4 0,2 0,8
Labour Force 339 340 372 373 381 7 41 2,0 12,1
Employed 232 230 239 239 257 18 25 7,7 11,0
Unemployed 108 110 133 135 123 -11 16 -8,3 14,5
Not economically active 162 162 131 131 125 -6 -37 -4,6 -22,8
Rates (%)
Unemployment rate 31,8 32,5 35,7 36,1 32,4 -3,7 0,6
Employed / population ratio (Absorption) 46,2 45,7 47,6 47,3 50,8 3,5 4,6
Labour force participation rate 67,7 67,7 73,9 74,0 75,3 1,3 7,6
Eastern Cape - Nelson Mandela Bay
Population 15-64 yrs 789 791 793 795 798 3 9 0,3 1,1
Labour Force 520 486 510 526 517 -8 -3 -1,6 -0,6
Employed 347 326 341 367 360 -7 13 -2,0 3,6
Unemployed 173 160 169 159 157 -1 -16 -0,7 -9,0
Not economically active 269 305 283 270 281 11 12 4,1 4,5
Rates (%)
Unemployment rate 33,3 32,9 33,2 30,2 30,4 0,2 -2,9
Employed / population ratio (Absorption) 44,0 41,2 43,0 46,1 45,1 -1,0 1,1
Labour force participation rate 65,9 61,5 64,4 66,1 64,8 -1,3 -1,1
Northern Cape
Population 15-64 yrs 773 775 778 780 783 2 10 0,3 1,2
Labour Force 510 502 529 525 532 7 22 1,3 4,3
Employed 313 303 308 298 299 1 -14 0,3 -4,5
Unemployed 198 200 221 227 233 6 36 2,7 18,2
Not economically active 263 273 249 255 250 -5 -12 -1,8 -4,7
Rates (%)
Unemployment rate 38,7 39,8 41,8 43,3 43,9 0,6 5,2
Employed / population ratio (Absorption) 40,5 39,0 39,6 38,2 38,2 0,0 -2,3
Labour force participation rate 66,0 64,8 68,0 67,3 68,0 0,7 2,0
Due to rounding, numbers do not necessarily add up to totals.
Note: 'Employment' refers to market production activities.

STATISTICS SOUTH AFRICA P0211
Quarterly Labour Force Survey, Quarter 1, 2017
49
Table 2.7: Labour force characteristics by province and metro – Expanded definition of unemployment (continued)
Jan-Mar 2016
Apr-Jun 2016
Jul-Sep 2016
Oct-Dec 2016
Jan-Mar 2017
Qtr-to-qtr change
Year-on-year
change
Qtr-to-qtr change
Year-on-year
change
Thousand Thousand Thousand Thousand Thousand Thousand Thousand Percent Percent
Free State
Population 15-64 yrs 1 879 1 882 1 884 1 885 1 887 1 8 0,1 0,4
Labour Force 1 305 1 287 1 310 1 281 1 316 35 11 2,7 0,9
Employed 790 797 781 757 767 10 -24 1,3 -3,0
Unemployed 514 490 529 524 549 25 35 4,8 6,7
Not economically active 574 595 574 605 571 -34 -3 -5,6 -0,5
Rates (%)
Unemployment rate 39,4 38,1 40,4 40,9 41,7 0,8 2,3
Employed / population ratio (Absorption) 42,1 42,4 41,4 40,2 40,6 0,4 -1,5
Labour force participation rate 69,4 68,4 69,5 67,9 69,7 1,8 0,3
Free State - Non Metro
Population 15-64 yrs 1 352 1 353 1 354 1 354 1 354 0 1 0,0 0,1
Labour Force 927 908 918 891 924 33 -4 3,7 -0,4
Employed 540 547 538 523 534 11 -5 2,1 -1,0
Unemployed 388 361 380 367 389 22 2 6,0 0,5
Not economically active 425 445 435 463 430 -33 5 -7,2 1,2
Rates (%)
Unemployment rate 41,8 39,7 41,4 41,2 42,2 1,0 0,4
Employed / population ratio (Absorption) 39,9 40,4 39,7 38,7 39,5 0,8 -0,4
Labour force participation rate 68,6 67,1 67,8 65,8 68,2 2,4 -0,4
Free State - Mangaung
Population 15-64 yrs 527 529 531 532 533 1 7 0,2 1,3
Labour Force 377 379 391 390 392 2 15 0,5 3,9
Employed 251 250 243 234 232 -1 -18 -0,6 -7,2
Unemployed 127 130 149 156 159 3 33 2,0 26,0
Not economically active 149 149 139 142 141 -1 -8 -0,4 -5,4
Rates (%)
Unemployment rate 33,5 34,1 38,0 40,1 40,7 0,6 7,2
Employed / population ratio (Absorption) 47,6 47,3 45,8 44,0 43,6 -0,4 -4,0
Labour force participation rate 71,6 71,8 73,8 73,3 73,5 0,2 1,9
Due to rounding, numbers do not necessarily add up to totals.
Note: 'Employment' refers to market production activities.

STATISTICS SOUTH AFRICA P0211
Quarterly Labour Force Survey, Quarter 1, 2017
50
Table 2.7: Labour force characteristics by province metro – Expanded definition of unemployment (continued)
Jan-Mar 2016
Apr-Jun 2016
Jul-Sep 2016
Oct-Dec 2016
Jan-Mar 2017
Qtr-to-qtr change
Year-on-year
change
Qtr-to-qtr change
Year-on-year
change
Thousand Thousand Thousand Thousand Thousand Thousand Thousand Percent Percent
KwaZulu-Natal
Population 15-64 yrs 6 764 6 789 6 815 6 841 6 868 26 103 0,4 1,5
Labour Force 4 112 4 112 4 188 4 285 4 328 43 215 1,0 5,2
Employed 2 515 2 479 2 496 2 541 2 555 14 40 0,5 1,6
Unemployed 1 597 1 633 1 692 1 744 1 773 29 175 1,7 11,0
Not economically active 2 652 2 677 2 627 2 556 2 540 -16 -112 -0,6 -4,2
Rates (%)
Unemployment rate 38,8 39,7 40,4 40,7 41,0 0,3 2,2
Employed / population ratio (Absorption) 37,2 36,5 36,6 37,1 37,2 0,1 0,0
Labour force participation rate 60,8 60,6 61,5 62,6 63,0 0,4 2,2
KwaZulu-Natal - Non Metro
Population 15-64 yrs 4 398 4 417 4 436 4 456 4 476 20 78 0,4 1,8
Labour Force 2 597 2 549 2 593 2 677 2 676 -1 78 0,0 3,0
Employed 1 413 1 353 1 355 1 384 1 377 -6 -36 -0,5 -2,5
Unemployed 1 184 1 196 1 239 1 293 1 298 5 114 0,4 9,7
Not economically active 1 800 1 868 1 843 1 779 1 800 21 0 1,2 0,0
Rates (%)
Unemployment rate 45,6 46,9 47,8 48,3 48,5 0,2 2,9
Employed / population ratio (Absorption) 32,1 30,6 30,5 31,1 30,8 -0,3 -1,3
Labour force participation rate 59,1 57,7 58,5 60,1 59,8 -0,3 0,7
KwaZulu-Natal - eThekhwini
Population 15-64 yrs 2 367 2 372 2 379 2 385 2 392 6 25 0,3 1,1
Labour Force 1 515 1 563 1 594 1 608 1 652 44 137 2,7 9,0
Employed 1 102 1 126 1 141 1 157 1 178 20 76 1,7 6,9
Unemployed 413 437 453 450 474 24 61 5,3 14,8
Not economically active 852 809 784 777 740 -38 -112 -4,8 -13,1
Rates (%)
Unemployment rate 27,3 28,0 28,4 28,0 28,7 0,7 1,4
Employed / population ratio (Absorption) 46,6 47,4 48,0 48,5 49,2 0,7 2,6
Labour force participation rate 64,0 65,9 67,0 67,4 69,1 1,7 5,1
Due to rounding, numbers do not necessarily add up to totals.
Note: 'Employment' refers to market production activities.
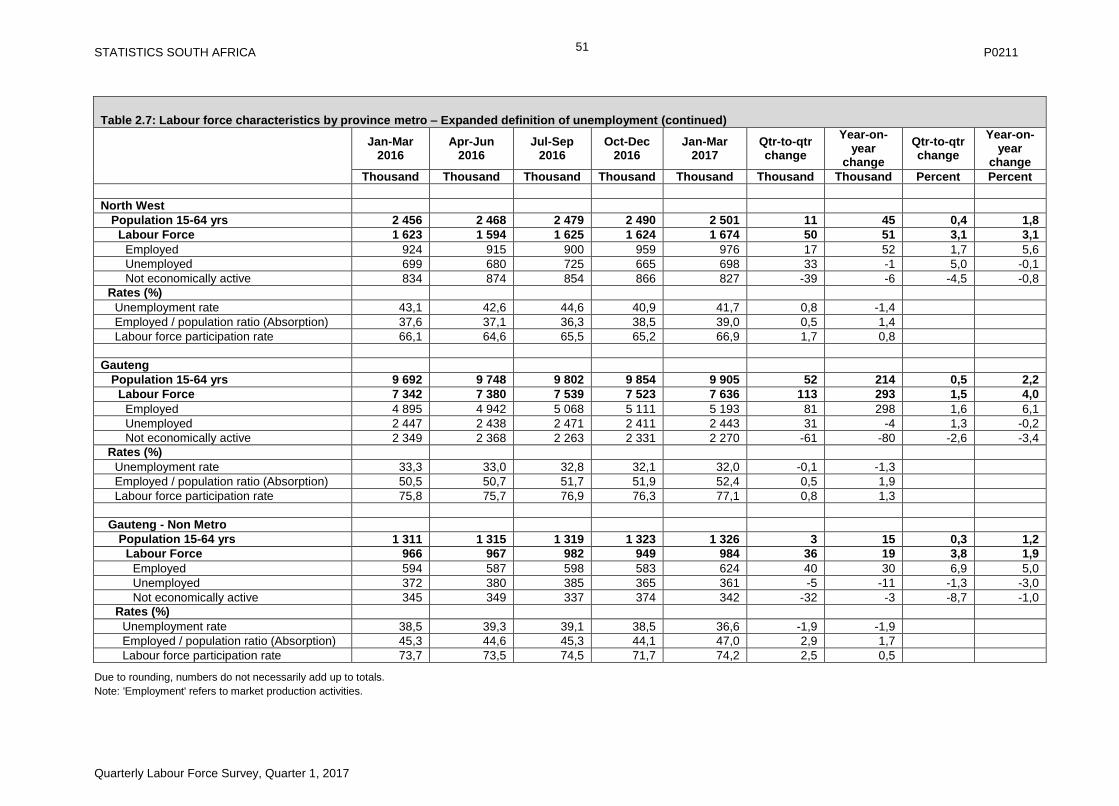
STATISTICS SOUTH AFRICA P0211
Quarterly Labour Force Survey, Quarter 1, 2017
51
Table 2.7: Labour force characteristics by province metro – Expanded definition of unemployment (continued)
Jan-Mar 2016
Apr-Jun 2016
Jul-Sep 2016
Oct-Dec 2016
Jan-Mar 2017
Qtr-to-qtr change
Year-on-year
change
Qtr-to-qtr change
Year-on-year
change
Thousand Thousand Thousand Thousand Thousand Thousand Thousand Percent Percent
North West
Population 15-64 yrs 2 456 2 468 2 479 2 490 2 501 11 45 0,4 1,8
Labour Force 1 623 1 594 1 625 1 624 1 674 50 51 3,1 3,1
Employed 924 915 900 959 976 17 52 1,7 5,6
Unemployed 699 680 725 665 698 33 -1 5,0 -0,1
Not economically active 834 874 854 866 827 -39 -6 -4,5 -0,8
Rates (%)
Unemployment rate 43,1 42,6 44,6 40,9 41,7 0,8 -1,4
Employed / population ratio (Absorption) 37,6 37,1 36,3 38,5 39,0 0,5 1,4
Labour force participation rate 66,1 64,6 65,5 65,2 66,9 1,7 0,8
Gauteng
Population 15-64 yrs 9 692 9 748 9 802 9 854 9 905 52 214 0,5 2,2
Labour Force 7 342 7 380 7 539 7 523 7 636 113 293 1,5 4,0
Employed 4 895 4 942 5 068 5 111 5 193 81 298 1,6 6,1
Unemployed 2 447 2 438 2 471 2 411 2 443 31 -4 1,3 -0,2
Not economically active 2 349 2 368 2 263 2 331 2 270 -61 -80 -2,6 -3,4
Rates (%)
Unemployment rate 33,3 33,0 32,8 32,1 32,0 -0,1 -1,3
Employed / population ratio (Absorption) 50,5 50,7 51,7 51,9 52,4 0,5 1,9
Labour force participation rate 75,8 75,7 76,9 76,3 77,1 0,8 1,3
Gauteng - Non Metro
Population 15-64 yrs 1 311 1 315 1 319 1 323 1 326 3 15 0,3 1,2
Labour Force 966 967 982 949 984 36 19 3,8 1,9
Employed 594 587 598 583 624 40 30 6,9 5,0
Unemployed 372 380 385 365 361 -5 -11 -1,3 -3,0
Not economically active 345 349 337 374 342 -32 -3 -8,7 -1,0
Rates (%)
Unemployment rate 38,5 39,3 39,1 38,5 36,6 -1,9 -1,9
Employed / population ratio (Absorption) 45,3 44,6 45,3 44,1 47,0 2,9 1,7
Labour force participation rate 73,7 73,5 74,5 71,7 74,2 2,5 0,5
Due to rounding, numbers do not necessarily add up to totals.
Note: 'Employment' refers to market production activities.
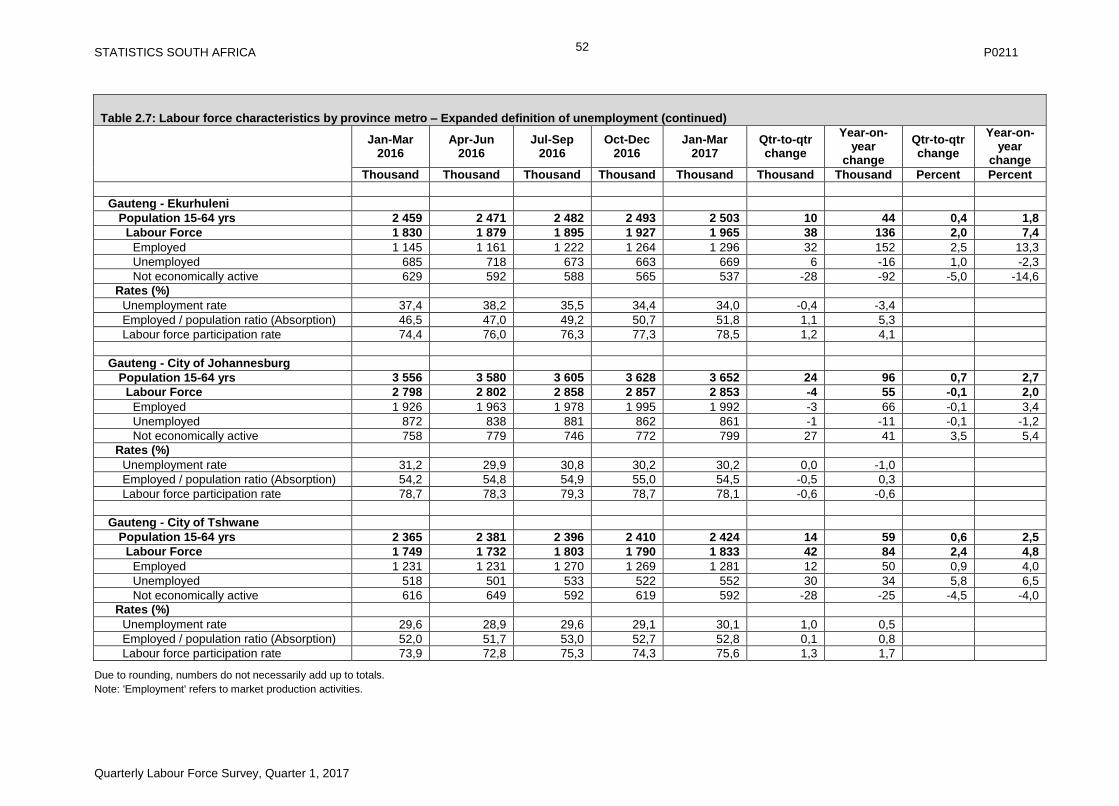
STATISTICS SOUTH AFRICA P0211
Quarterly Labour Force Survey, Quarter 1, 2017
52
Table 2.7: Labour force characteristics by province metro – Expanded definition of unemployment (continued)
Jan-Mar 2016
Apr-Jun 2016
Jul-Sep 2016
Oct-Dec 2016
Jan-Mar 2017
Qtr-to-qtr change
Year-on-year
change
Qtr-to-qtr change
Year-on-year
change
Thousand Thousand Thousand Thousand Thousand Thousand Thousand Percent Percent
Gauteng - Ekurhuleni
Population 15-64 yrs 2 459 2 471 2 482 2 493 2 503 10 44 0,4 1,8
Labour Force 1 830 1 879 1 895 1 927 1 965 38 136 2,0 7,4
Employed 1 145 1 161 1 222 1 264 1 296 32 152 2,5 13,3
Unemployed 685 718 673 663 669 6 -16 1,0 -2,3
Not economically active 629 592 588 565 537 -28 -92 -5,0 -14,6
Rates (%)
Unemployment rate 37,4 38,2 35,5 34,4 34,0 -0,4 -3,4
Employed / population ratio (Absorption) 46,5 47,0 49,2 50,7 51,8 1,1 5,3
Labour force participation rate 74,4 76,0 76,3 77,3 78,5 1,2 4,1
Gauteng - City of Johannesburg
Population 15-64 yrs 3 556 3 580 3 605 3 628 3 652 24 96 0,7 2,7
Labour Force 2 798 2 802 2 858 2 857 2 853 -4 55 -0,1 2,0
Employed 1 926 1 963 1 978 1 995 1 992 -3 66 -0,1 3,4
Unemployed 872 838 881 862 861 -1 -11 -0,1 -1,2
Not economically active 758 779 746 772 799 27 41 3,5 5,4
Rates (%)
Unemployment rate 31,2 29,9 30,8 30,2 30,2 0,0 -1,0
Employed / population ratio (Absorption) 54,2 54,8 54,9 55,0 54,5 -0,5 0,3
Labour force participation rate 78,7 78,3 79,3 78,7 78,1 -0,6 -0,6
Gauteng - City of Tshwane
Population 15-64 yrs 2 365 2 381 2 396 2 410 2 424 14 59 0,6 2,5
Labour Force 1 749 1 732 1 803 1 790 1 833 42 84 2,4 4,8
Employed 1 231 1 231 1 270 1 269 1 281 12 50 0,9 4,0
Unemployed 518 501 533 522 552 30 34 5,8 6,5
Not economically active 616 649 592 619 592 -28 -25 -4,5 -4,0
Rates (%)
Unemployment rate 29,6 28,9 29,6 29,1 30,1 1,0 0,5
Employed / population ratio (Absorption) 52,0 51,7 53,0 52,7 52,8 0,1 0,8
Labour force participation rate 73,9 72,8 75,3 74,3 75,6 1,3 1,7
Due to rounding, numbers do not necessarily add up to totals.
Note: 'Employment' refers to market production activities.
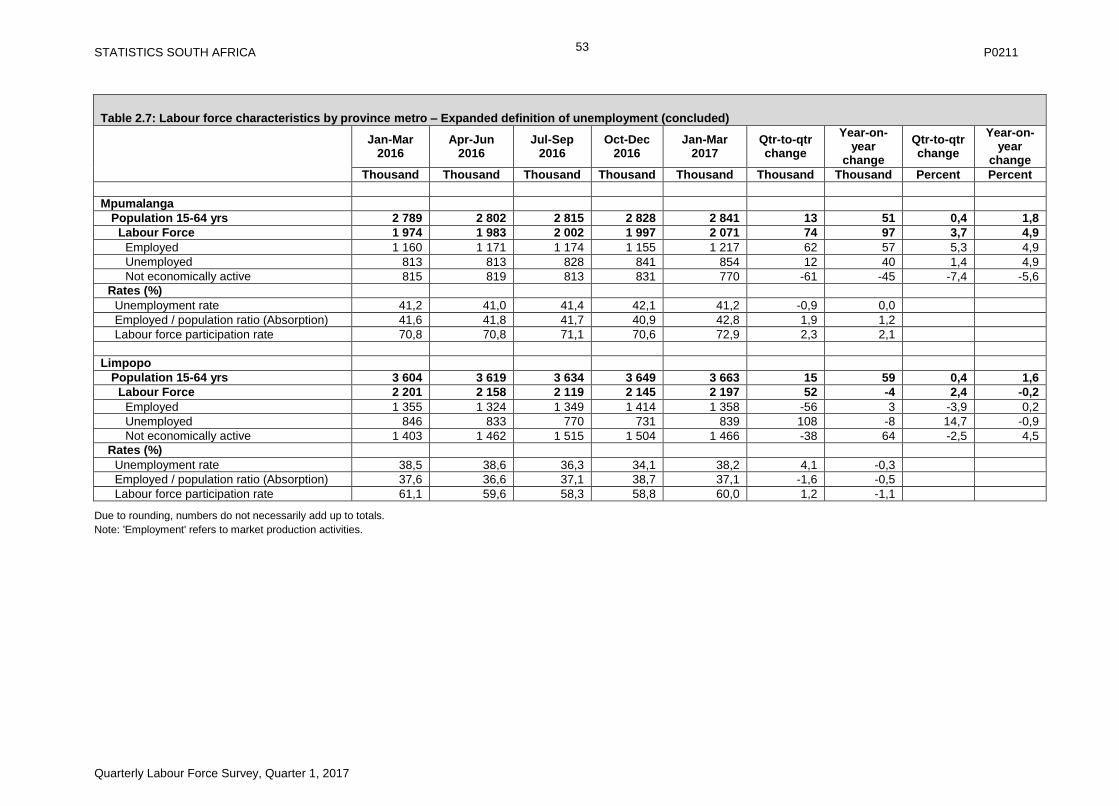
STATISTICS SOUTH AFRICA P0211
Quarterly Labour Force Survey, Quarter 1, 2017
53
Table 2.7: Labour force characteristics by province metro – Expanded definition of unemployment (concluded)
Jan-Mar 2016
Apr-Jun 2016
Jul-Sep 2016
Oct-Dec 2016
Jan-Mar 2017
Qtr-to-qtr change
Year-on-year
change
Qtr-to-qtr change
Year-on-year
change
Thousand Thousand Thousand Thousand Thousand Thousand Thousand Percent Percent
Mpumalanga
Population 15-64 yrs 2 789 2 802 2 815 2 828 2 841 13 51 0,4 1,8
Labour Force 1 974 1 983 2 002 1 997 2 071 74 97 3,7 4,9
Employed 1 160 1 171 1 174 1 155 1 217 62 57 5,3 4,9
Unemployed 813 813 828 841 854 12 40 1,4 4,9
Not economically active 815 819 813 831 770 -61 -45 -7,4 -5,6
Rates (%)
Unemployment rate 41,2 41,0 41,4 42,1 41,2 -0,9 0,0
Employed / population ratio (Absorption) 41,6 41,8 41,7 40,9 42,8 1,9 1,2
Labour force participation rate 70,8 70,8 71,1 70,6 72,9 2,3 2,1
Limpopo
Population 15-64 yrs 3 604 3 619 3 634 3 649 3 663 15 59 0,4 1,6
Labour Force 2 201 2 158 2 119 2 145 2 197 52 -4 2,4 -0,2
Employed 1 355 1 324 1 349 1 414 1 358 -56 3 -3,9 0,2
Unemployed 846 833 770 731 839 108 -8 14,7 -0,9
Not economically active 1 403 1 462 1 515 1 504 1 466 -38 64 -2,5 4,5
Rates (%)
Unemployment rate 38,5 38,6 36,3 34,1 38,2 4,1 -0,3
Employed / population ratio (Absorption) 37,6 36,6 37,1 38,7 37,1 -1,6 -0,5
Labour force participation rate 61,1 59,6 58,3 58,8 60,0 1,2 -1,1
Due to rounding, numbers do not necessarily add up to totals.
Note: 'Employment' refers to market production activities.
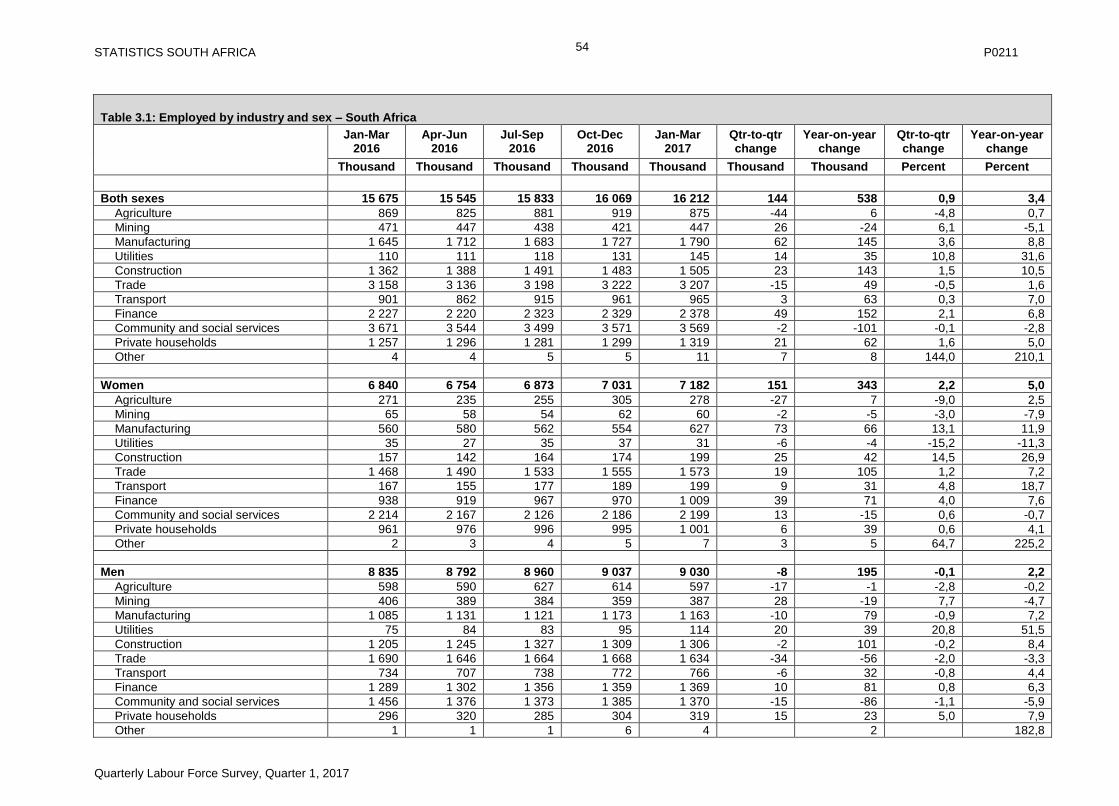
STATISTICS SOUTH AFRICA P0211
Quarterly Labour Force Survey, Quarter 1, 2017
54
Table 3.1: Employed by industry and sex – South Africa
Jan-Mar 2016
Apr-Jun 2016
Jul-Sep 2016
Oct-Dec 2016
Jan-Mar 2017
Qtr-to-qtr change
Year-on-year change
Qtr-to-qtr change
Year-on-year change
Thousand Thousand Thousand Thousand Thousand Thousand Thousand Percent Percent
Both sexes 15 675 15 545 15 833 16 069 16 212 144 538 0,9 3,4
Agriculture 869 825 881 919 875 -44 6 -4,8 0,7
Mining 471 447 438 421 447 26 -24 6,1 -5,1
Manufacturing 1 645 1 712 1 683 1 727 1 790 62 145 3,6 8,8
Utilities 110 111 118 131 145 14 35 10,8 31,6
Construction 1 362 1 388 1 491 1 483 1 505 23 143 1,5 10,5
Trade 3 158 3 136 3 198 3 222 3 207 -15 49 -0,5 1,6
Transport 901 862 915 961 965 3 63 0,3 7,0
Finance 2 227 2 220 2 323 2 329 2 378 49 152 2,1 6,8
Community and social services 3 671 3 544 3 499 3 571 3 569 -2 -101 -0,1 -2,8
Private households 1 257 1 296 1 281 1 299 1 319 21 62 1,6 5,0
Other 4 4 5 5 11 7 8 144,0 210,1
Women 6 840 6 754 6 873 7 031 7 182 151 343 2,2 5,0
Agriculture 271 235 255 305 278 -27 7 -9,0 2,5
Mining 65 58 54 62 60 -2 -5 -3,0 -7,9
Manufacturing 560 580 562 554 627 73 66 13,1 11,9
Utilities 35 27 35 37 31 -6 -4 -15,2 -11,3
Construction 157 142 164 174 199 25 42 14,5 26,9
Trade 1 468 1 490 1 533 1 555 1 573 19 105 1,2 7,2
Transport 167 155 177 189 199 9 31 4,8 18,7
Finance 938 919 967 970 1 009 39 71 4,0 7,6
Community and social services 2 214 2 167 2 126 2 186 2 199 13 -15 0,6 -0,7
Private households 961 976 996 995 1 001 6 39 0,6 4,1
Other 2 3 4 5 7 3 5 64,7 225,2
Men 8 835 8 792 8 960 9 037 9 030 -8 195 -0,1 2,2
Agriculture 598 590 627 614 597 -17 -1 -2,8 -0,2
Mining 406 389 384 359 387 28 -19 7,7 -4,7
Manufacturing 1 085 1 131 1 121 1 173 1 163 -10 79 -0,9 7,2
Utilities 75 84 83 95 114 20 39 20,8 51,5
Construction 1 205 1 245 1 327 1 309 1 306 -2 101 -0,2 8,4
Trade 1 690 1 646 1 664 1 668 1 634 -34 -56 -2,0 -3,3
Transport 734 707 738 772 766 -6 32 -0,8 4,4
Finance 1 289 1 302 1 356 1 359 1 369 10 81 0,8 6,3
Community and social services 1 456 1 376 1 373 1 385 1 370 -15 -86 -1,1 -5,9
Private households 296 320 285 304 319 15 23 5,0 7,9
Other 1 1 1 6 4 2 182,8
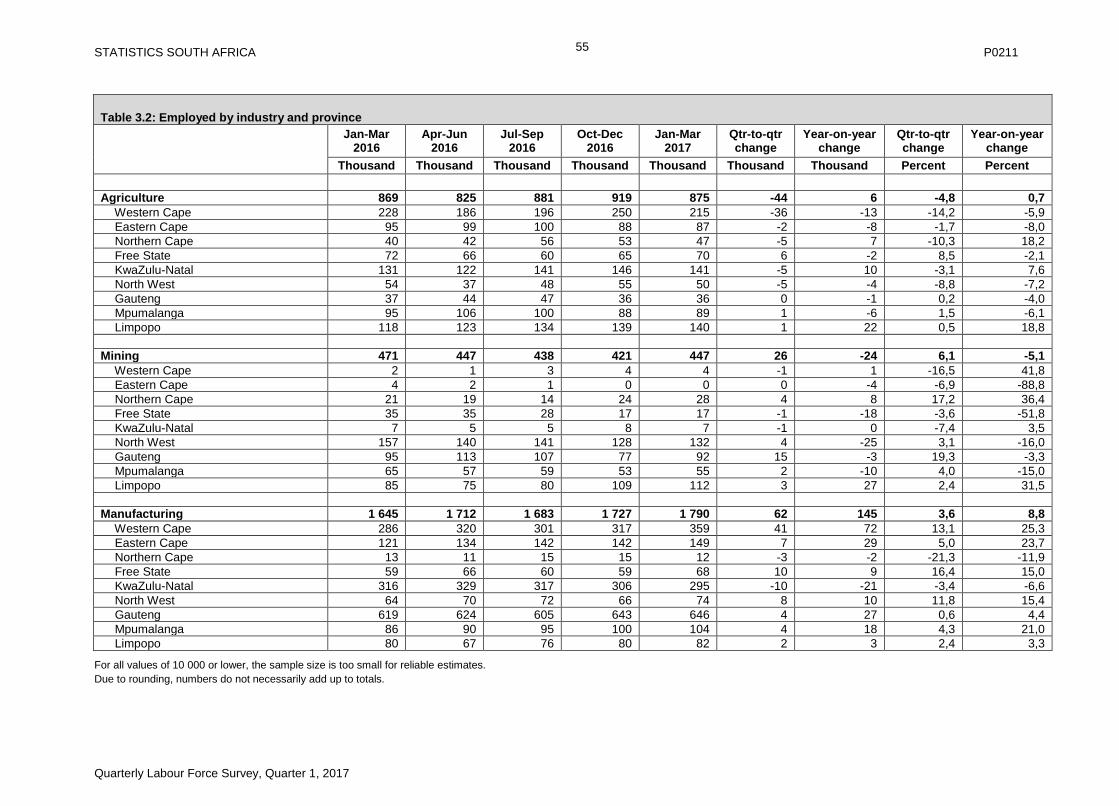
STATISTICS SOUTH AFRICA P0211
Quarterly Labour Force Survey, Quarter 1, 2017
55
Table 3.2: Employed by industry and province
Jan-Mar 2016
Apr-Jun 2016
Jul-Sep 2016
Oct-Dec 2016
Jan-Mar 2017
Qtr-to-qtr change
Year-on-year change
Qtr-to-qtr change
Year-on-year change
Thousand Thousand Thousand Thousand Thousand Thousand Thousand Percent Percent
Agriculture 869 825 881 919 875 -44 6 -4,8 0,7
Western Cape 228 186 196 250 215 -36 -13 -14,2 -5,9
Eastern Cape 95 99 100 88 87 -2 -8 -1,7 -8,0
Northern Cape 40 42 56 53 47 -5 7 -10,3 18,2
Free State 72 66 60 65 70 6 -2 8,5 -2,1
KwaZulu-Natal 131 122 141 146 141 -5 10 -3,1 7,6
North West 54 37 48 55 50 -5 -4 -8,8 -7,2
Gauteng 37 44 47 36 36 0 -1 0,2 -4,0
Mpumalanga 95 106 100 88 89 1 -6 1,5 -6,1
Limpopo 118 123 134 139 140 1 22 0,5 18,8
Mining 471 447 438 421 447 26 -24 6,1 -5,1
Western Cape 2 1 3 4 4 -1 1 -16,5 41,8
Eastern Cape 4 2 1 0 0 0 -4 -6,9 -88,8
Northern Cape 21 19 14 24 28 4 8 17,2 36,4
Free State 35 35 28 17 17 -1 -18 -3,6 -51,8
KwaZulu-Natal 7 5 5 8 7 -1 0 -7,4 3,5
North West 157 140 141 128 132 4 -25 3,1 -16,0
Gauteng 95 113 107 77 92 15 -3 19,3 -3,3
Mpumalanga 65 57 59 53 55 2 -10 4,0 -15,0
Limpopo 85 75 80 109 112 3 27 2,4 31,5
Manufacturing 1 645 1 712 1 683 1 727 1 790 62 145 3,6 8,8
Western Cape 286 320 301 317 359 41 72 13,1 25,3
Eastern Cape 121 134 142 142 149 7 29 5,0 23,7
Northern Cape 13 11 15 15 12 -3 -2 -21,3 -11,9
Free State 59 66 60 59 68 10 9 16,4 15,0
KwaZulu-Natal 316 329 317 306 295 -10 -21 -3,4 -6,6
North West 64 70 72 66 74 8 10 11,8 15,4
Gauteng 619 624 605 643 646 4 27 0,6 4,4
Mpumalanga 86 90 95 100 104 4 18 4,3 21,0
Limpopo 80 67 76 80 82 2 3 2,4 3,3
For all values of 10 000 or lower, the sample size is too small for reliable estimates.
Due to rounding, numbers do not necessarily add up to totals.
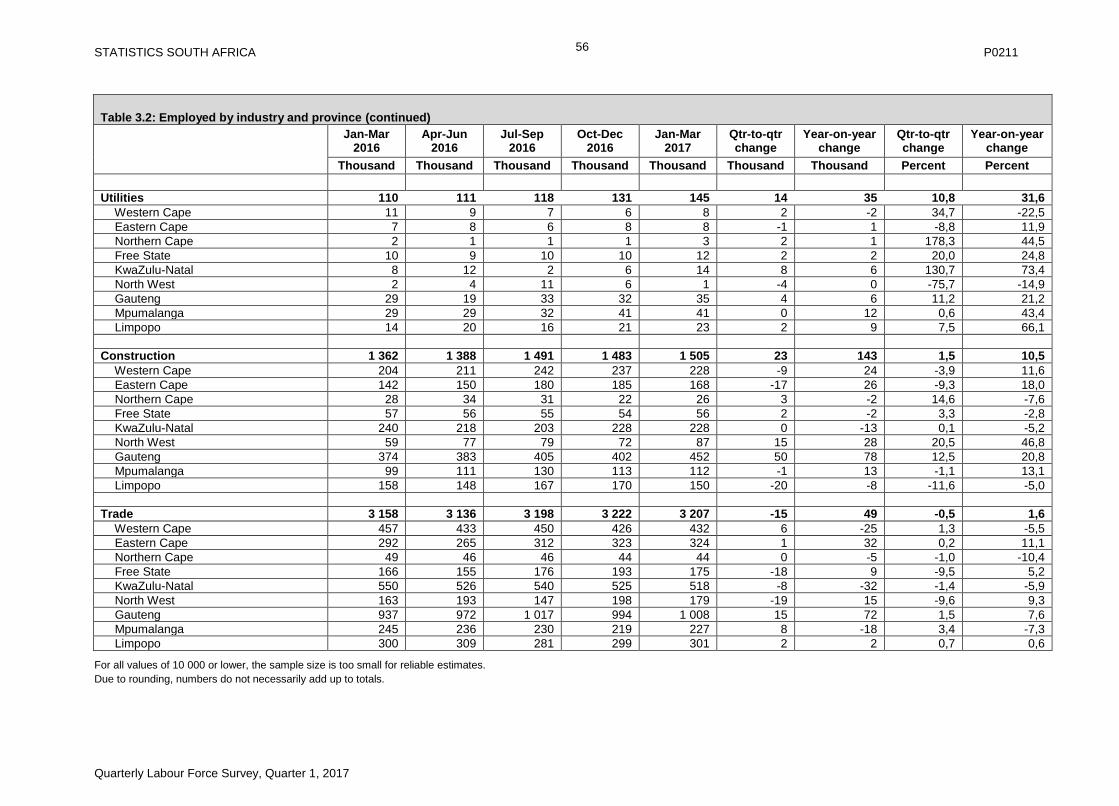
STATISTICS SOUTH AFRICA P0211
Quarterly Labour Force Survey, Quarter 1, 2017
56
Table 3.2: Employed by industry and province (continued)
Jan-Mar 2016
Apr-Jun 2016
Jul-Sep 2016
Oct-Dec 2016
Jan-Mar 2017
Qtr-to-qtr change
Year-on-year change
Qtr-to-qtr change
Year-on-year change
Thousand Thousand Thousand Thousand Thousand Thousand Thousand Percent Percent
Utilities 110 111 118 131 145 14 35 10,8 31,6
Western Cape 11 9 7 6 8 2 -2 34,7 -22,5
Eastern Cape 7 8 6 8 8 -1 1 -8,8 11,9
Northern Cape 2 1 1 1 3 2 1 178,3 44,5
Free State 10 9 10 10 12 2 2 20,0 24,8
KwaZulu-Natal 8 12 2 6 14 8 6 130,7 73,4
North West 2 4 11 6 1 -4 0 -75,7 -14,9
Gauteng 29 19 33 32 35 4 6 11,2 21,2
Mpumalanga 29 29 32 41 41 0 12 0,6 43,4
Limpopo 14 20 16 21 23 2 9 7,5 66,1
Construction 1 362 1 388 1 491 1 483 1 505 23 143 1,5 10,5
Western Cape 204 211 242 237 228 -9 24 -3,9 11,6
Eastern Cape 142 150 180 185 168 -17 26 -9,3 18,0
Northern Cape 28 34 31 22 26 3 -2 14,6 -7,6
Free State 57 56 55 54 56 2 -2 3,3 -2,8
KwaZulu-Natal 240 218 203 228 228 0 -13 0,1 -5,2
North West 59 77 79 72 87 15 28 20,5 46,8
Gauteng 374 383 405 402 452 50 78 12,5 20,8
Mpumalanga 99 111 130 113 112 -1 13 -1,1 13,1
Limpopo 158 148 167 170 150 -20 -8 -11,6 -5,0
Trade 3 158 3 136 3 198 3 222 3 207 -15 49 -0,5 1,6
Western Cape 457 433 450 426 432 6 -25 1,3 -5,5
Eastern Cape 292 265 312 323 324 1 32 0,2 11,1
Northern Cape 49 46 46 44 44 0 -5 -1,0 -10,4
Free State 166 155 176 193 175 -18 9 -9,5 5,2
KwaZulu-Natal 550 526 540 525 518 -8 -32 -1,4 -5,9
North West 163 193 147 198 179 -19 15 -9,6 9,3
Gauteng 937 972 1 017 994 1 008 15 72 1,5 7,6
Mpumalanga 245 236 230 219 227 8 -18 3,4 -7,3
Limpopo 300 309 281 299 301 2 2 0,7 0,6
For all values of 10 000 or lower, the sample size is too small for reliable estimates.
Due to rounding, numbers do not necessarily add up to totals.
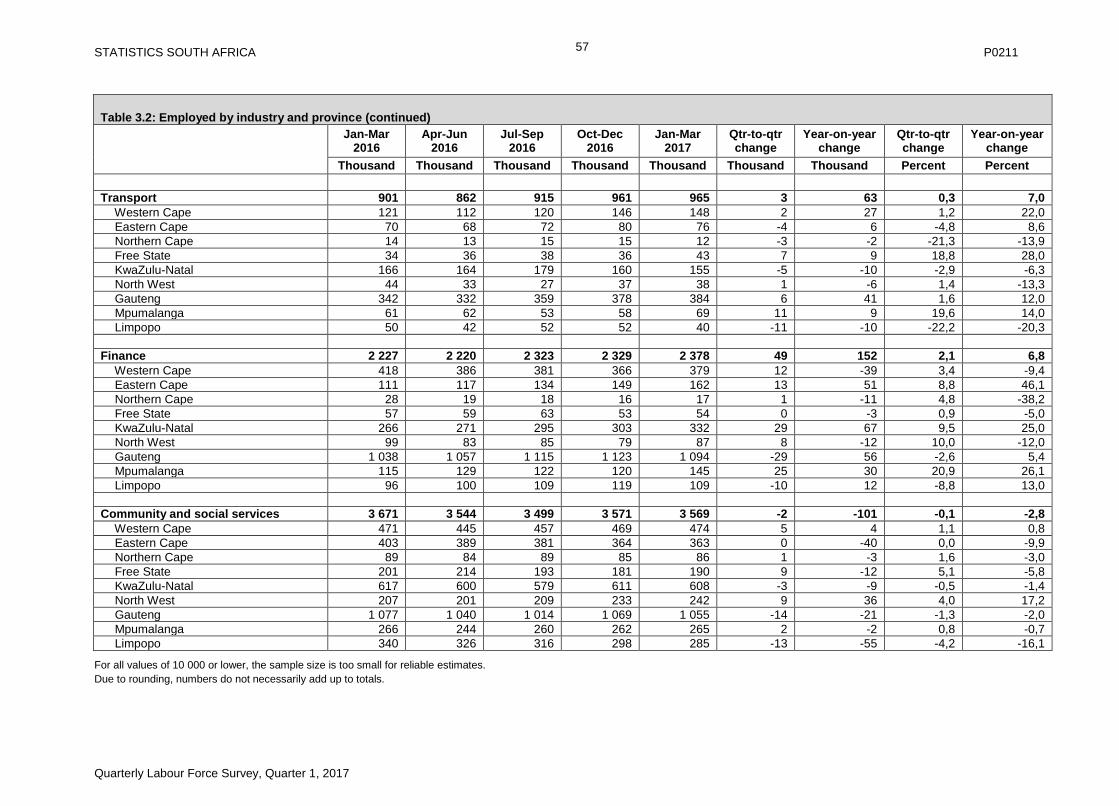
STATISTICS SOUTH AFRICA P0211
Quarterly Labour Force Survey, Quarter 1, 2017
57
Table 3.2: Employed by industry and province (continued)
Jan-Mar 2016
Apr-Jun 2016
Jul-Sep 2016
Oct-Dec 2016
Jan-Mar 2017
Qtr-to-qtr change
Year-on-year change
Qtr-to-qtr change
Year-on-year change
Thousand Thousand Thousand Thousand Thousand Thousand Thousand Percent Percent
Transport 901 862 915 961 965 3 63 0,3 7,0
Western Cape 121 112 120 146 148 2 27 1,2 22,0
Eastern Cape 70 68 72 80 76 -4 6 -4,8 8,6
Northern Cape 14 13 15 15 12 -3 -2 -21,3 -13,9
Free State 34 36 38 36 43 7 9 18,8 28,0
KwaZulu-Natal 166 164 179 160 155 -5 -10 -2,9 -6,3
North West 44 33 27 37 38 1 -6 1,4 -13,3
Gauteng 342 332 359 378 384 6 41 1,6 12,0
Mpumalanga 61 62 53 58 69 11 9 19,6 14,0
Limpopo 50 42 52 52 40 -11 -10 -22,2 -20,3
Finance 2 227 2 220 2 323 2 329 2 378 49 152 2,1 6,8
Western Cape 418 386 381 366 379 12 -39 3,4 -9,4
Eastern Cape 111 117 134 149 162 13 51 8,8 46,1
Northern Cape 28 19 18 16 17 1 -11 4,8 -38,2
Free State 57 59 63 53 54 0 -3 0,9 -5,0
KwaZulu-Natal 266 271 295 303 332 29 67 9,5 25,0
North West 99 83 85 79 87 8 -12 10,0 -12,0
Gauteng 1 038 1 057 1 115 1 123 1 094 -29 56 -2,6 5,4
Mpumalanga 115 129 122 120 145 25 30 20,9 26,1
Limpopo 96 100 109 119 109 -10 12 -8,8 13,0
Community and social services 3 671 3 544 3 499 3 571 3 569 -2 -101 -0,1 -2,8
Western Cape 471 445 457 469 474 5 4 1,1 0,8
Eastern Cape 403 389 381 364 363 0 -40 0,0 -9,9
Northern Cape 89 84 89 85 86 1 -3 1,6 -3,0
Free State 201 214 193 181 190 9 -12 5,1 -5,8
KwaZulu-Natal 617 600 579 611 608 -3 -9 -0,5 -1,4
North West 207 201 209 233 242 9 36 4,0 17,2
Gauteng 1 077 1 040 1 014 1 069 1 055 -14 -21 -1,3 -2,0
Mpumalanga 266 244 260 262 265 2 -2 0,8 -0,7
Limpopo 340 326 316 298 285 -13 -55 -4,2 -16,1
For all values of 10 000 or lower, the sample size is too small for reliable estimates.
Due to rounding, numbers do not necessarily add up to totals.
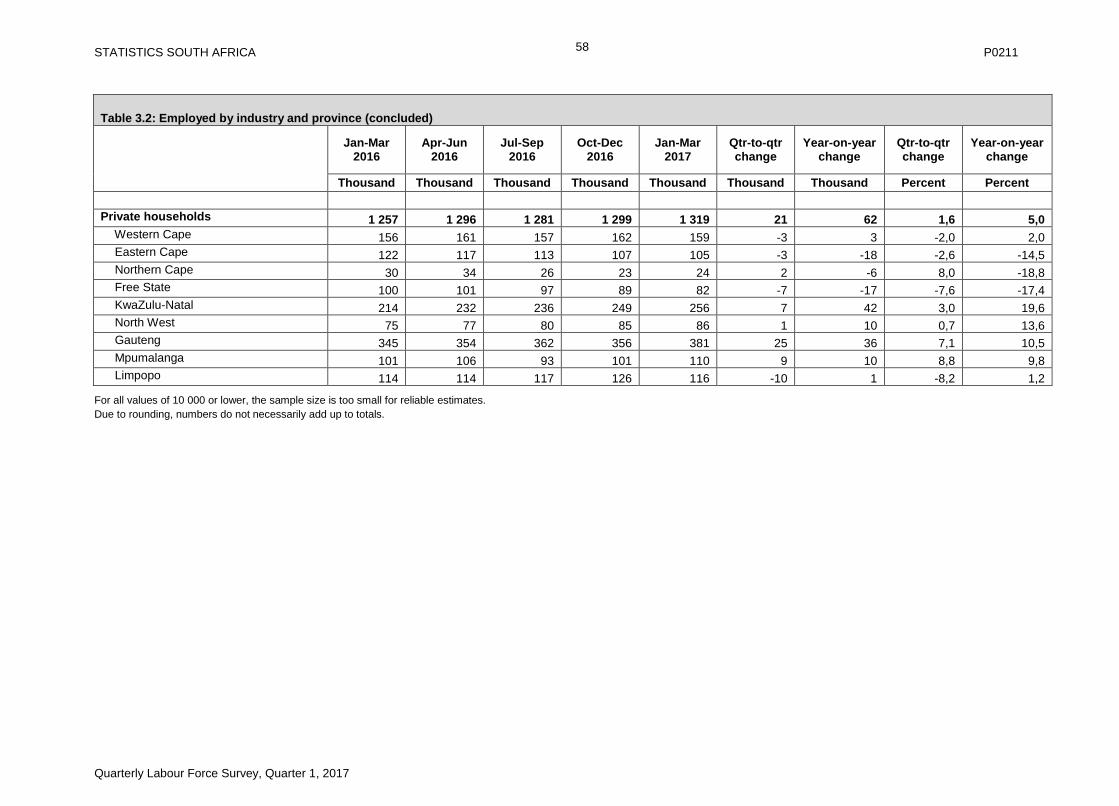
STATISTICS SOUTH AFRICA P0211
Quarterly Labour Force Survey, Quarter 1, 2017
58
Table 3.2: Employed by industry and province (concluded)
Jan-Mar 2016
Apr-Jun 2016
Jul-Sep 2016
Oct-Dec 2016
Jan-Mar 2017
Qtr-to-qtr change
Year-on-year change
Qtr-to-qtr change
Year-on-year change
Thousand Thousand Thousand Thousand Thousand Thousand Thousand Percent Percent
Private households 1 257 1 296 1 281 1 299 1 319 21 62 1,6 5,0
Western Cape 156 161 157 162 159 -3 3 -2,0 2,0
Eastern Cape 122 117 113 107 105 -3 -18 -2,6 -14,5
Northern Cape 30 34 26 23 24 2 -6 8,0 -18,8
Free State 100 101 97 89 82 -7 -17 -7,6 -17,4
KwaZulu-Natal 214 232 236 249 256 7 42 3,0 19,6
North West 75 77 80 85 86 1 10 0,7 13,6
Gauteng 345 354 362 356 381 25 36 7,1 10,5
Mpumalanga 101 106 93 101 110 9 10 8,8 9,8
Limpopo 114 114 117 126 116 -10 1 -8,2 1,2
For all values of 10 000 or lower, the sample size is too small for reliable estimates.
Due to rounding, numbers do not necessarily add up to totals.
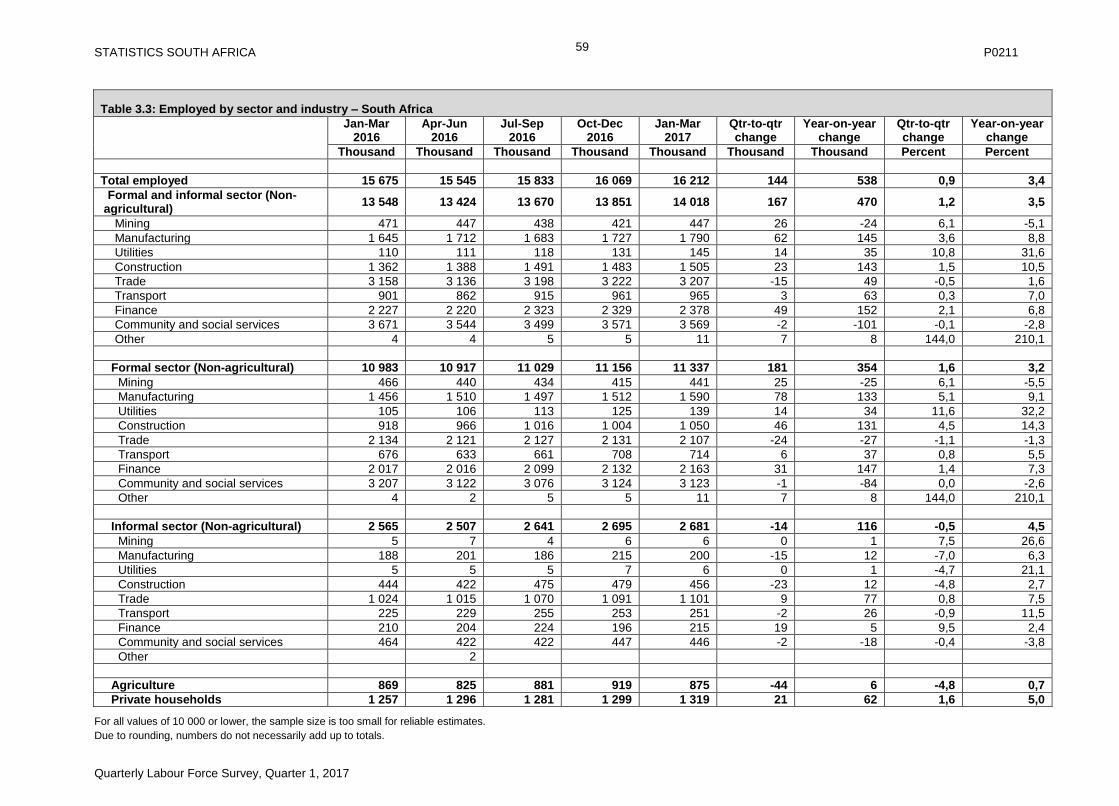
STATISTICS SOUTH AFRICA P0211
Quarterly Labour Force Survey, Quarter 1, 2017
59
Table 3.3: Employed by sector and industry – South Africa
Jan-Mar 2016
Apr-Jun 2016
Jul-Sep 2016
Oct-Dec 2016
Jan-Mar 2017
Qtr-to-qtr change
Year-on-year change
Qtr-to-qtr change
Year-on-year change
Thousand Thousand Thousand Thousand Thousand Thousand Thousand Percent Percent
Total employed 15 675 15 545 15 833 16 069 16 212 144 538 0,9 3,4
Formal and informal sector (Non-agricultural)
13 548 13 424 13 670 13 851 14 018 167 470 1,2 3,5
Mining 471 447 438 421 447 26 -24 6,1 -5,1
Manufacturing 1 645 1 712 1 683 1 727 1 790 62 145 3,6 8,8
Utilities 110 111 118 131 145 14 35 10,8 31,6
Construction 1 362 1 388 1 491 1 483 1 505 23 143 1,5 10,5
Trade 3 158 3 136 3 198 3 222 3 207 -15 49 -0,5 1,6
Transport 901 862 915 961 965 3 63 0,3 7,0
Finance 2 227 2 220 2 323 2 329 2 378 49 152 2,1 6,8
Community and social services 3 671 3 544 3 499 3 571 3 569 -2 -101 -0,1 -2,8
Other 4 4 5 5 11 7 8 144,0 210,1
Formal sector (Non-agricultural) 10 983 10 917 11 029 11 156 11 337 181 354 1,6 3,2
Mining 466 440 434 415 441 25 -25 6,1 -5,5
Manufacturing 1 456 1 510 1 497 1 512 1 590 78 133 5,1 9,1
Utilities 105 106 113 125 139 14 34 11,6 32,2
Construction 918 966 1 016 1 004 1 050 46 131 4,5 14,3
Trade 2 134 2 121 2 127 2 131 2 107 -24 -27 -1,1 -1,3
Transport 676 633 661 708 714 6 37 0,8 5,5
Finance 2 017 2 016 2 099 2 132 2 163 31 147 1,4 7,3
Community and social services 3 207 3 122 3 076 3 124 3 123 -1 -84 0,0 -2,6
Other 4 2 5 5 11 7 8 144,0 210,1
Informal sector (Non-agricultural) 2 565 2 507 2 641 2 695 2 681 -14 116 -0,5 4,5
Mining 5 7 4 6 6 0 1 7,5 26,6
Manufacturing 188 201 186 215 200 -15 12 -7,0 6,3
Utilities 5 5 5 7 6 0 1 -4,7 21,1
Construction 444 422 475 479 456 -23 12 -4,8 2,7
Trade 1 024 1 015 1 070 1 091 1 101 9 77 0,8 7,5
Transport 225 229 255 253 251 -2 26 -0,9 11,5
Finance 210 204 224 196 215 19 5 9,5 2,4
Community and social services 464 422 422 447 446 -2 -18 -0,4 -3,8
Other 2
Agriculture 869 825 881 919 875 -44 6 -4,8 0,7
Private households 1 257 1 296 1 281 1 299 1 319 21 62 1,6 5,0
For all values of 10 000 or lower, the sample size is too small for reliable estimates.
Due to rounding, numbers do not necessarily add up to totals.
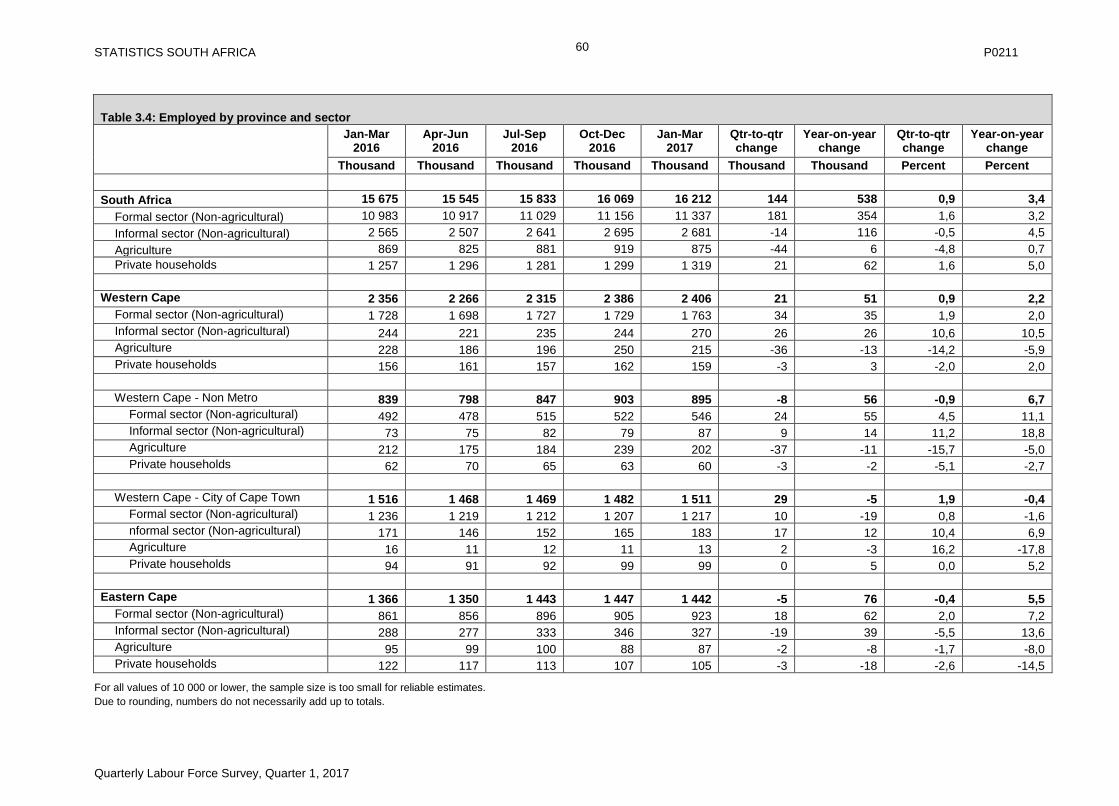
STATISTICS SOUTH AFRICA P0211
Quarterly Labour Force Survey, Quarter 1, 2017
60
Table 3.4: Employed by province and sector
Jan-Mar 2016
Apr-Jun 2016
Jul-Sep 2016
Oct-Dec 2016
Jan-Mar 2017
Qtr-to-qtr change
Year-on-year change
Qtr-to-qtr change
Year-on-year change
Thousand Thousand Thousand Thousand Thousand Thousand Thousand Percent Percent
South Africa 15 675 15 545 15 833 16 069 16 212 144 538 0,9 3,4
Formal sector (Non-agricultural) 10 983 10 917 11 029 11 156 11 337 181 354 1,6 3,2
Informal sector (Non-agricultural) 2 565 2 507 2 641 2 695 2 681 -14 116 -0,5 4,5
Agriculture 869 825 881 919 875 -44 6 -4,8 0,7
Private households 1 257 1 296 1 281 1 299 1 319 21 62 1,6 5,0
Western Cape 2 356 2 266 2 315 2 386 2 406 21 51 0,9 2,2
Formal sector (Non-agricultural) 1 728 1 698 1 727 1 729 1 763 34 35 1,9 2,0
Informal sector (Non-agricultural) 244 221 235 244 270 26 26 10,6 10,5
Agriculture 228 186 196 250 215 -36 -13 -14,2 -5,9
Private households 156 161 157 162 159 -3 3 -2,0 2,0
Western Cape - Non Metro 839 798 847 903 895 -8 56 -0,9 6,7
Formal sector (Non-agricultural) 492 478 515 522 546 24 55 4,5 11,1
Informal sector (Non-agricultural) 73 75 82 79 87 9 14 11,2 18,8
Agriculture 212 175 184 239 202 -37 -11 -15,7 -5,0
Private households 62 70 65 63 60 -3 -2 -5,1 -2,7
Western Cape - City of Cape Town 1 516 1 468 1 469 1 482 1 511 29 -5 1,9 -0,4
Formal sector (Non-agricultural) 1 236 1 219 1 212 1 207 1 217 10 -19 0,8 -1,6
nformal sector (Non-agricultural) 171 146 152 165 183 17 12 10,4 6,9
Agriculture 16 11 12 11 13 2 -3 16,2 -17,8
Private households 94 91 92 99 99 0 5 0,0 5,2
Eastern Cape 1 366 1 350 1 443 1 447 1 442 -5 76 -0,4 5,5
Formal sector (Non-agricultural) 861 856 896 905 923 18 62 2,0 7,2
Informal sector (Non-agricultural) 288 277 333 346 327 -19 39 -5,5 13,6
Agriculture 95 99 100 88 87 -2 -8 -1,7 -8,0
Private households 122 117 113 107 105 -3 -18 -2,6 -14,5
For all values of 10 000 or lower, the sample size is too small for reliable estimates.
Due to rounding, numbers do not necessarily add up to totals.
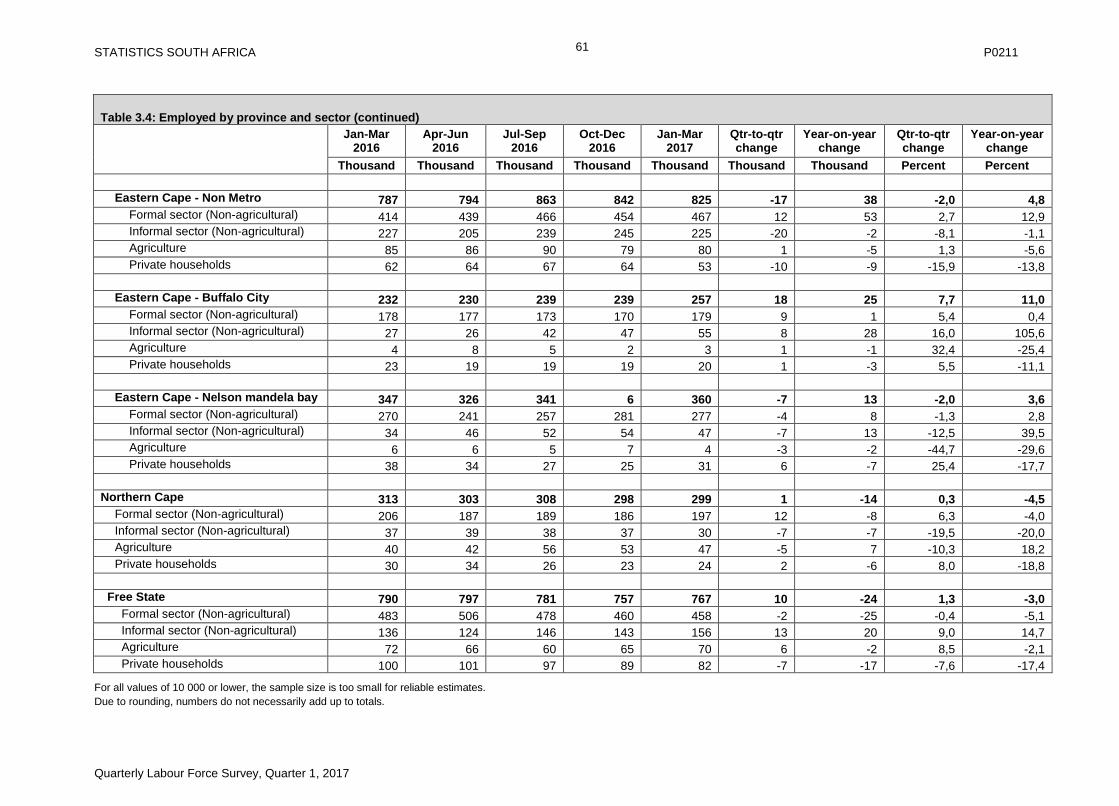
STATISTICS SOUTH AFRICA P0211
Quarterly Labour Force Survey, Quarter 1, 2017
61
Table 3.4: Employed by province and sector (continued)
Jan-Mar 2016
Apr-Jun 2016
Jul-Sep 2016
Oct-Dec 2016
Jan-Mar 2017
Qtr-to-qtr change
Year-on-year change
Qtr-to-qtr change
Year-on-year change
Thousand Thousand Thousand Thousand Thousand Thousand Thousand Percent Percent
Eastern Cape - Non Metro 787 794 863 842 825 -17 38 -2,0 4,8
Formal sector (Non-agricultural) 414 439 466 454 467 12 53 2,7 12,9
Informal sector (Non-agricultural) 227 205 239 245 225 -20 -2 -8,1 -1,1
Agriculture 85 86 90 79 80 1 -5 1,3 -5,6
Private households 62 64 67 64 53 -10 -9 -15,9 -13,8
Eastern Cape - Buffalo City 232 230 239 239 257 18 25 7,7 11,0
Formal sector (Non-agricultural) 178 177 173 170 179 9 1 5,4 0,4
Informal sector (Non-agricultural) 27 26 42 47 55 8 28 16,0 105,6
Agriculture 4 8 5 2 3 1 -1 32,4 -25,4
Private households 23 19 19 19 20 1 -3 5,5 -11,1
Eastern Cape - Nelson mandela bay 347 326 341 6 360 -7 13 -2,0 3,6
Formal sector (Non-agricultural) 270 241 257 281 277 -4 8 -1,3 2,8
Informal sector (Non-agricultural) 34 46 52 54 47 -7 13 -12,5 39,5
Agriculture 6 6 5 7 4 -3 -2 -44,7 -29,6
Private households 38 34 27 25 31 6 -7 25,4 -17,7
Northern Cape 313 303 308 298 299 1 -14 0,3 -4,5
Formal sector (Non-agricultural) 206 187 189 186 197 12 -8 6,3 -4,0
Informal sector (Non-agricultural) 37 39 38 37 30 -7 -7 -19,5 -20,0
Agriculture 40 42 56 53 47 -5 7 -10,3 18,2
Private households 30 34 26 23 24 2 -6 8,0 -18,8
Free State 790 797 781 757 767 10 -24 1,3 -3,0
Formal sector (Non-agricultural) 483 506 478 460 458 -2 -25 -0,4 -5,1
Informal sector (Non-agricultural) 136 124 146 143 156 13 20 9,0 14,7
Agriculture 72 66 60 65 70 6 -2 8,5 -2,1
Private households 100 101 97 89 82 -7 -17 -7,6 -17,4
For all values of 10 000 or lower, the sample size is too small for reliable estimates.
Due to rounding, numbers do not necessarily add up to totals.
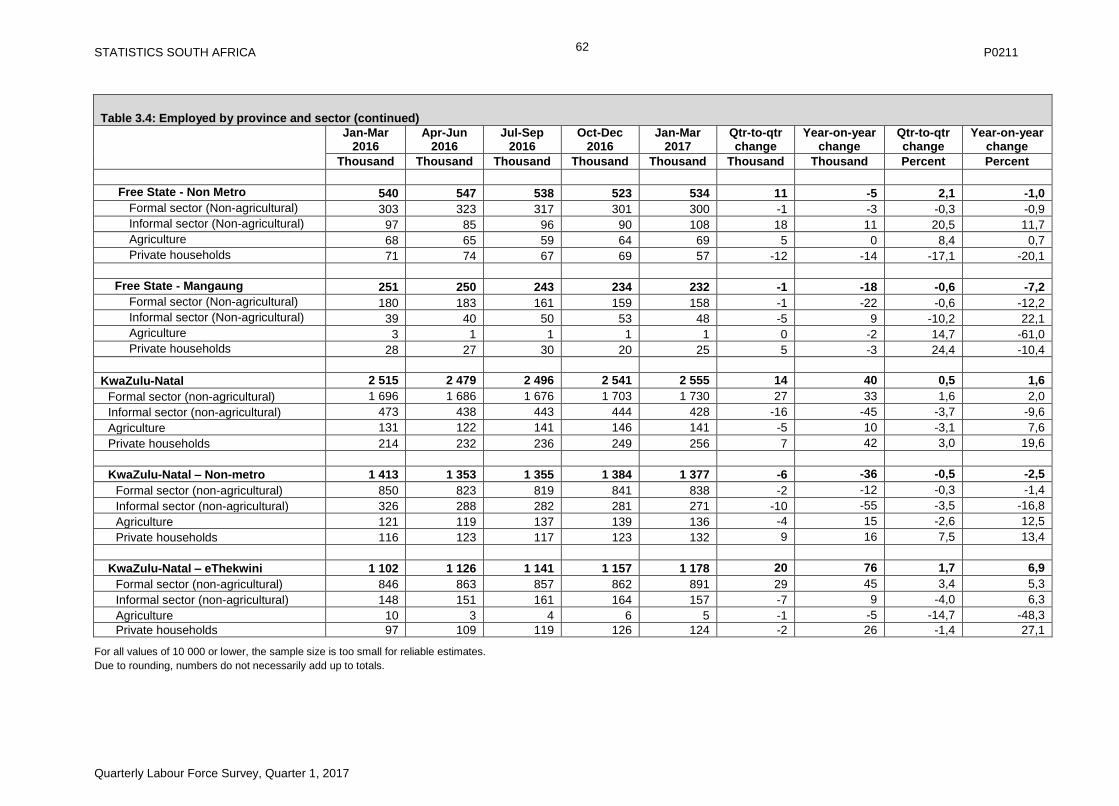
STATISTICS SOUTH AFRICA P0211
Quarterly Labour Force Survey, Quarter 1, 2017
62
Table 3.4: Employed by province and sector (continued)
Jan-Mar 2016
Apr-Jun 2016
Jul-Sep 2016
Oct-Dec 2016
Jan-Mar 2017
Qtr-to-qtr change
Year-on-year change
Qtr-to-qtr change
Year-on-year change
Thousand Thousand Thousand Thousand Thousand Thousand Thousand Percent Percent
Free State - Non Metro 540 547 538 523 534 11 -5 2,1 -1,0
Formal sector (Non-agricultural) 303 323 317 301 300 -1 -3 -0,3 -0,9
Informal sector (Non-agricultural) 97 85 96 90 108 18 11 20,5 11,7
Agriculture 68 65 59 64 69 5 0 8,4 0,7
Private households 71 74 67 69 57 -12 -14 -17,1 -20,1
Free State - Mangaung 251 250 243 234 232 -1 -18 -0,6 -7,2
Formal sector (Non-agricultural) 180 183 161 159 158 -1 -22 -0,6 -12,2
Informal sector (Non-agricultural) 39 40 50 53 48 -5 9 -10,2 22,1
Agriculture 3 1 1 1 1 0 -2 14,7 -61,0
Private households 28 27 30 20 25 5 -3 24,4 -10,4
KwaZulu-Natal 2 515 2 479 2 496 2 541 2 555 14 40 0,5 1,6
Formal sector (non-agricultural) 1 696 1 686 1 676 1 703 1 730 27 33 1,6 2,0
Informal sector (non-agricultural) 473 438 443 444 428 -16 -45 -3,7 -9,6
Agriculture 131 122 141 146 141 -5 10 -3,1 7,6
Private households 214 232 236 249 256 7 42 3,0 19,6
KwaZulu-Natal – Non-metro 1 413 1 353 1 355 1 384 1 377 -6 -36 -0,5 -2,5
Formal sector (non-agricultural) 850 823 819 841 838 -2 -12 -0,3 -1,4
Informal sector (non-agricultural) 326 288 282 281 271 -10 -55 -3,5 -16,8
Agriculture 121 119 137 139 136 -4 15 -2,6 12,5
Private households 116 123 117 123 132 9 16 7,5 13,4
KwaZulu-Natal – eThekwini 1 102 1 126 1 141 1 157 1 178 20 76 1,7 6,9
Formal sector (non-agricultural) 846 863 857 862 891 29 45 3,4 5,3
Informal sector (non-agricultural) 148 151 161 164 157 -7 9 -4,0 6,3
Agriculture 10 3 4 6 5 -1 -5 -14,7 -48,3
Private households 97 109 119 126 124 -2 26 -1,4 27,1
For all values of 10 000 or lower, the sample size is too small for reliable estimates.
Due to rounding, numbers do not necessarily add up to totals.

STATISTICS SOUTH AFRICA P0211
Quarterly Labour Force Survey, Quarter 1, 2017
63
Table 3.4: Employed by province and sector (continued)
Jan-Mar 2016
Apr-Jun 2016
Jul-Sep 2016
Oct-Dec 2016
Jan-Mar 2017
Qtr-to-qtr change
Year-on-year change
Qtr-to-qtr change
Year-on-year change
Thousand Thousand Thousand Thousand Thousand Thousand Thousand Percent Percent
North West 924 915 900 959 976 17 52 1,7 5,6
Formal sector (non-agricultural) 672 671 636 680 696 16 24 2,4 3,5
Informal sector (non-agricultural) 122 130 135 139 144 4 22 3,2 17,9
Agriculture 54 37 48 55 50 -5 -4 -8,8 -7,2
Private households 75 77 80 85 86 1 10 0,7 13,6
Gauteng 4 895 4 942 5 068 5 111 5 193 81 298 1,6 6,1
Formal sector (non-agricultural) 3 863 3 857 3 954 4 008 4 056 48 193 1,2 5,0
Informal sector (non-agricultural) 651 687 705 712 720 8 69 1,2 10,7
Agriculture 37 44 47 36 36 0 -1 0,2 -4,0
Private households 345 354 362 356 381 25 36 7,1 10,5
Gauteng – Non-metro 594 587 598 583 624 40 30 6,9 5,0
Formal sector (non-agricultural) 452 440 453 435 452 17 0 3,9 0,0
Informal sector (non-agricultural) 87 84 86 93 103 9 16 10,1 18,1
Agriculture 14 19 18 14 16 2 2 13,7 13,0
Private households 41 44 41 41 53 12 13 29,3 30,8
Gauteng – Ekurhuleni 1 145 1 161 1 222 1 264 1 296 32 152 2,5 13,3
Formal sector (non-agricultural) 941 896 958 997 1 005 8 63 0,8 6,7
Informal sector (non-agricultural) 127 177 168 179 189 10 62 5,6 49,3
Agriculture 8 10 14 8 8 0 0 0,1 1,0
Private households 68 78 82 80 94 14 26 17,4 38,0
Gauteng – City of Johannesburg 1 926 1 963 1 978 1 995 1 992 -3 66 -0,1 3,4
Formal sector (non-agricultural) 1 461 1 543 1 528 1 544 1 545 2 85 0,1 5,8
Informal sector (non-agricultural) 310 273 306 311 308 -4 -2 -1,2 -0,7
Agriculture 6 5 7 5 5 0 -1 -5,9 -15,5
Private households 150 143 137 135 134 -1 -16 -0,5 -10,4
For all values of 10 000 or lower, the sample size is too small for reliable estimates.
Due to rounding, numbers do not necessarily add up to totals.
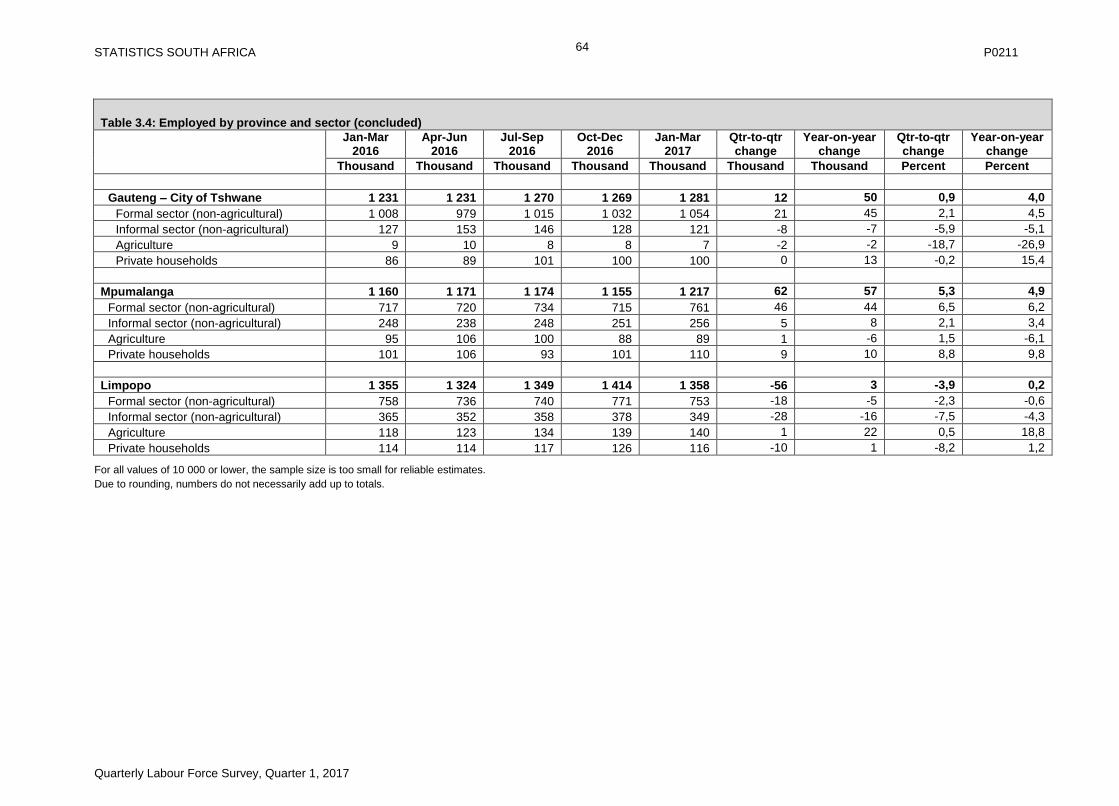
STATISTICS SOUTH AFRICA P0211
Quarterly Labour Force Survey, Quarter 1, 2017
64
Table 3.4: Employed by province and sector (concluded)
Jan-Mar 2016
Apr-Jun 2016
Jul-Sep 2016
Oct-Dec 2016
Jan-Mar 2017
Qtr-to-qtr change
Year-on-year change
Qtr-to-qtr change
Year-on-year change
Thousand Thousand Thousand Thousand Thousand Thousand Thousand Percent Percent
Gauteng – City of Tshwane 1 231 1 231 1 270 1 269 1 281 12 50 0,9 4,0
Formal sector (non-agricultural) 1 008 979 1 015 1 032 1 054 21 45 2,1 4,5
Informal sector (non-agricultural) 127 153 146 128 121 -8 -7 -5,9 -5,1
Agriculture 9 10 8 8 7 -2 -2 -18,7 -26,9
Private households 86 89 101 100 100 0 13 -0,2 15,4
Mpumalanga 1 160 1 171 1 174 1 155 1 217 62 57 5,3 4,9
Formal sector (non-agricultural) 717 720 734 715 761 46 44 6,5 6,2
Informal sector (non-agricultural) 248 238 248 251 256 5 8 2,1 3,4
Agriculture 95 106 100 88 89 1 -6 1,5 -6,1
Private households 101 106 93 101 110 9 10 8,8 9,8
Limpopo 1 355 1 324 1 349 1 414 1 358 -56 3 -3,9 0,2
Formal sector (non-agricultural) 758 736 740 771 753 -18 -5 -2,3 -0,6
Informal sector (non-agricultural) 365 352 358 378 349 -28 -16 -7,5 -4,3
Agriculture 118 123 134 139 140 1 22 0,5 18,8
Private households 114 114 117 126 116 -10 1 -8,2 1,2
For all values of 10 000 or lower, the sample size is too small for reliable estimates.
Due to rounding, numbers do not necessarily add up to totals.
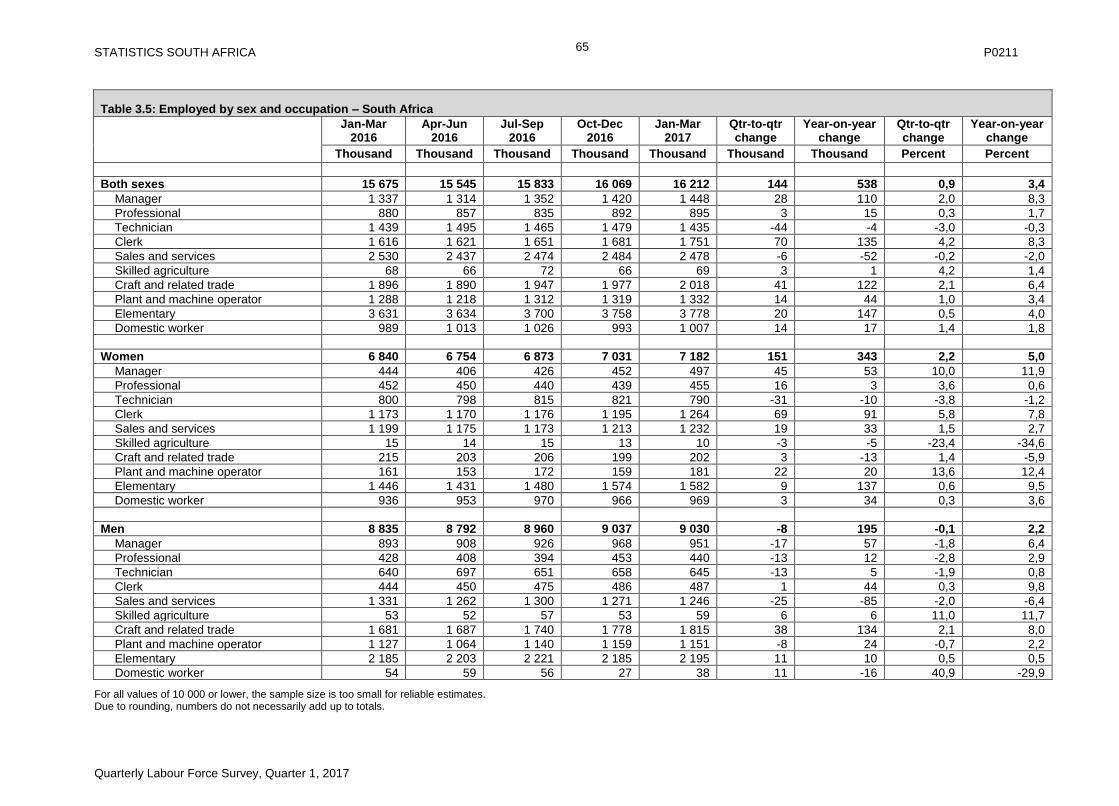
STATISTICS SOUTH AFRICA P0211
Quarterly Labour Force Survey, Quarter 1, 2017
65
Table 3.5: Employed by sex and occupation – South Africa
Jan-Mar 2016
Apr-Jun 2016
Jul-Sep 2016
Oct-Dec 2016
Jan-Mar 2017
Qtr-to-qtr change
Year-on-year change
Qtr-to-qtr change
Year-on-year change
Thousand Thousand Thousand Thousand Thousand Thousand Thousand Percent Percent
Both sexes 15 675 15 545 15 833 16 069 16 212 144 538 0,9 3,4
Manager 1 337 1 314 1 352 1 420 1 448 28 110 2,0 8,3
Professional 880 857 835 892 895 3 15 0,3 1,7
Technician 1 439 1 495 1 465 1 479 1 435 -44 -4 -3,0 -0,3
Clerk 1 616 1 621 1 651 1 681 1 751 70 135 4,2 8,3
Sales and services 2 530 2 437 2 474 2 484 2 478 -6 -52 -0,2 -2,0
Skilled agriculture 68 66 72 66 69 3 1 4,2 1,4
Craft and related trade 1 896 1 890 1 947 1 977 2 018 41 122 2,1 6,4
Plant and machine operator 1 288 1 218 1 312 1 319 1 332 14 44 1,0 3,4
Elementary 3 631 3 634 3 700 3 758 3 778 20 147 0,5 4,0
Domestic worker 989 1 013 1 026 993 1 007 14 17 1,4 1,8
Women 6 840 6 754 6 873 7 031 7 182 151 343 2,2 5,0
Manager 444 406 426 452 497 45 53 10,0 11,9
Professional 452 450 440 439 455 16 3 3,6 0,6
Technician 800 798 815 821 790 -31 -10 -3,8 -1,2
Clerk 1 173 1 170 1 176 1 195 1 264 69 91 5,8 7,8
Sales and services 1 199 1 175 1 173 1 213 1 232 19 33 1,5 2,7
Skilled agriculture 15 14 15 13 10 -3 -5 -23,4 -34,6
Craft and related trade 215 203 206 199 202 3 -13 1,4 -5,9
Plant and machine operator 161 153 172 159 181 22 20 13,6 12,4
Elementary 1 446 1 431 1 480 1 574 1 582 9 137 0,6 9,5
Domestic worker 936 953 970 966 969 3 34 0,3 3,6
Men 8 835 8 792 8 960 9 037 9 030 -8 195 -0,1 2,2
Manager 893 908 926 968 951 -17 57 -1,8 6,4
Professional 428 408 394 453 440 -13 12 -2,8 2,9
Technician 640 697 651 658 645 -13 5 -1,9 0,8
Clerk 444 450 475 486 487 1 44 0,3 9,8
Sales and services 1 331 1 262 1 300 1 271 1 246 -25 -85 -2,0 -6,4
Skilled agriculture 53 52 57 53 59 6 6 11,0 11,7
Craft and related trade 1 681 1 687 1 740 1 778 1 815 38 134 2,1 8,0
Plant and machine operator 1 127 1 064 1 140 1 159 1 151 -8 24 -0,7 2,2
Elementary 2 185 2 203 2 221 2 185 2 195 11 10 0,5 0,5
Domestic worker 54 59 56 27 38 11 -16 40,9 -29,9
For all values of 10 000 or lower, the sample size is too small for reliable estimates. Due to rounding, numbers do not necessarily add up to totals.
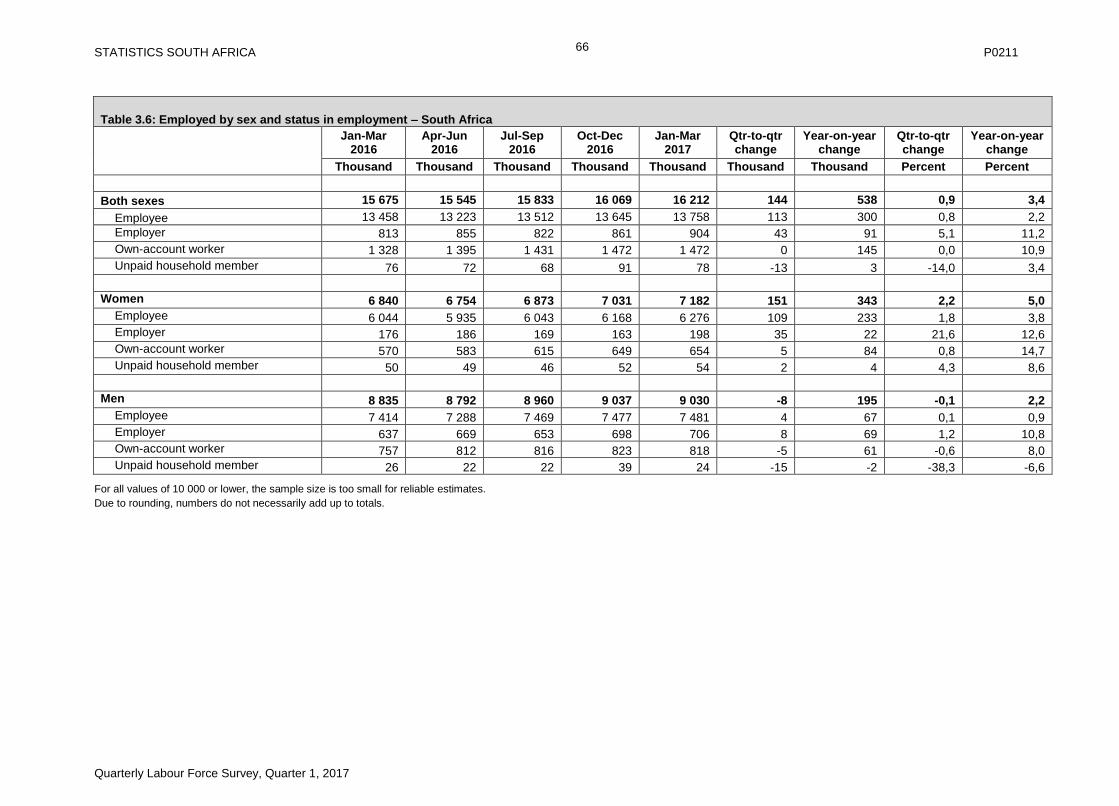
STATISTICS SOUTH AFRICA P0211
Quarterly Labour Force Survey, Quarter 1, 2017
66
Table 3.6: Employed by sex and status in employment – South Africa
Jan-Mar 2016
Apr-Jun 2016
Jul-Sep 2016
Oct-Dec 2016
Jan-Mar 2017
Qtr-to-qtr change
Year-on-year change
Qtr-to-qtr change
Year-on-year change
Thousand Thousand Thousand Thousand Thousand Thousand Thousand Percent Percent
Both sexes 15 675 15 545 15 833 16 069 16 212 144 538 0,9 3,4
Employee 13 458 13 223 13 512 13 645 13 758 113 300 0,8 2,2
Employer 813 855 822 861 904 43 91 5,1 11,2
Own-account worker 1 328 1 395 1 431 1 472 1 472 0 145 0,0 10,9
Unpaid household member 76 72 68 91 78 -13 3 -14,0 3,4
Women 6 840 6 754 6 873 7 031 7 182 151 343 2,2 5,0
Employee 6 044 5 935 6 043 6 168 6 276 109 233 1,8 3,8
Employer 176 186 169 163 198 35 22 21,6 12,6
Own-account worker 570 583 615 649 654 5 84 0,8 14,7
Unpaid household member 50 49 46 52 54 2 4 4,3 8,6
Men 8 835 8 792 8 960 9 037 9 030 -8 195 -0,1 2,2
Employee 7 414 7 288 7 469 7 477 7 481 4 67 0,1 0,9
Employer 637 669 653 698 706 8 69 1,2 10,8
Own-account worker 757 812 816 823 818 -5 61 -0,6 8,0
Unpaid household member 26 22 22 39 24 -15 -2 -38,3 -6,6
For all values of 10 000 or lower, the sample size is too small for reliable estimates.
Due to rounding, numbers do not necessarily add up to totals.
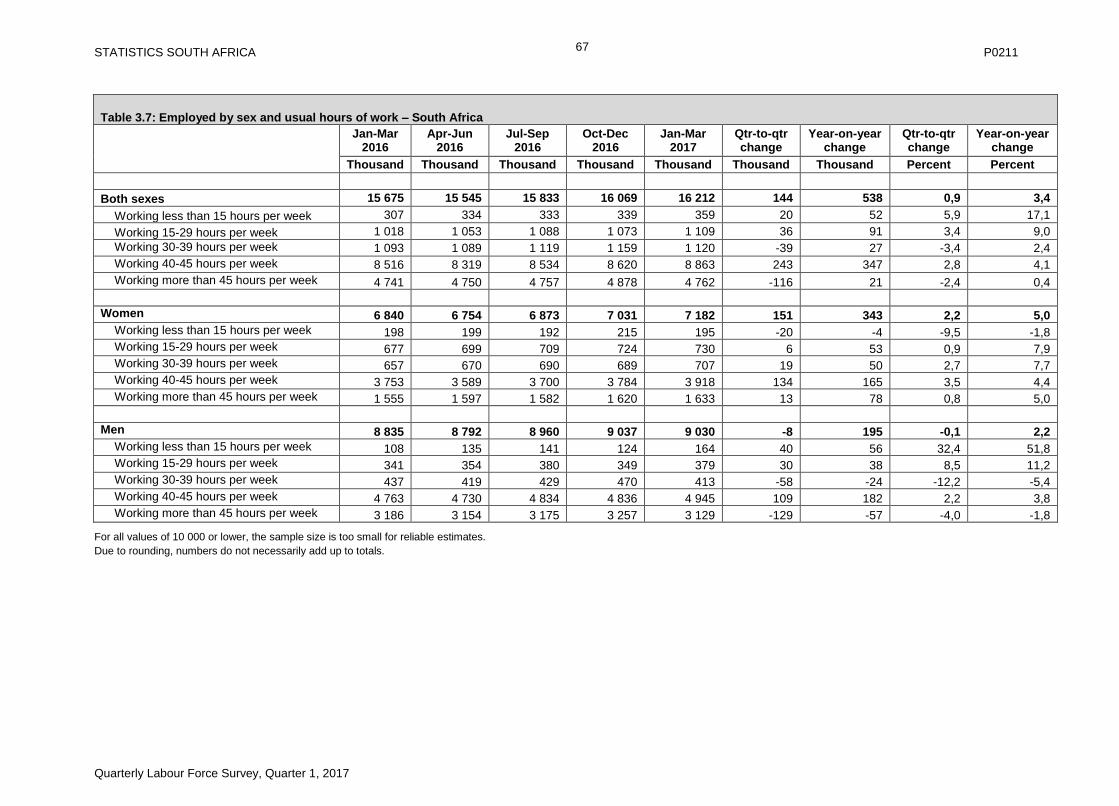
STATISTICS SOUTH AFRICA P0211
Quarterly Labour Force Survey, Quarter 1, 2017
67
Table 3.7: Employed by sex and usual hours of work – South Africa
Jan-Mar 2016
Apr-Jun 2016
Jul-Sep 2016
Oct-Dec 2016
Jan-Mar 2017
Qtr-to-qtr change
Year-on-year change
Qtr-to-qtr change
Year-on-year change
Thousand Thousand Thousand Thousand Thousand Thousand Thousand Percent Percent
Both sexes 15 675 15 545 15 833 16 069 16 212 144 538 0,9 3,4
Working less than 15 hours per week 307 334 333 339 359 20 52 5,9 17,1
Working 15-29 hours per week 1 018 1 053 1 088 1 073 1 109 36 91 3,4 9,0
Working 30-39 hours per week 1 093 1 089 1 119 1 159 1 120 -39 27 -3,4 2,4
Working 40-45 hours per week 8 516 8 319 8 534 8 620 8 863 243 347 2,8 4,1
Working more than 45 hours per week 4 741 4 750 4 757 4 878 4 762 -116 21 -2,4 0,4
Women 6 840 6 754 6 873 7 031 7 182 151 343 2,2 5,0
Working less than 15 hours per week 198 199 192 215 195 -20 -4 -9,5 -1,8
Working 15-29 hours per week 677 699 709 724 730 6 53 0,9 7,9
Working 30-39 hours per week 657 670 690 689 707 19 50 2,7 7,7
Working 40-45 hours per week 3 753 3 589 3 700 3 784 3 918 134 165 3,5 4,4
Working more than 45 hours per week 1 555 1 597 1 582 1 620 1 633 13 78 0,8 5,0
Men 8 835 8 792 8 960 9 037 9 030 -8 195 -0,1 2,2
Working less than 15 hours per week 108 135 141 124 164 40 56 32,4 51,8
Working 15-29 hours per week 341 354 380 349 379 30 38 8,5 11,2
Working 30-39 hours per week 437 419 429 470 413 -58 -24 -12,2 -5,4
Working 40-45 hours per week 4 763 4 730 4 834 4 836 4 945 109 182 2,2 3,8
Working more than 45 hours per week 3 186 3 154 3 175 3 257 3 129 -129 -57 -4,0 -1,8
For all values of 10 000 or lower, the sample size is too small for reliable estimates.
Due to rounding, numbers do not necessarily add up to totals.
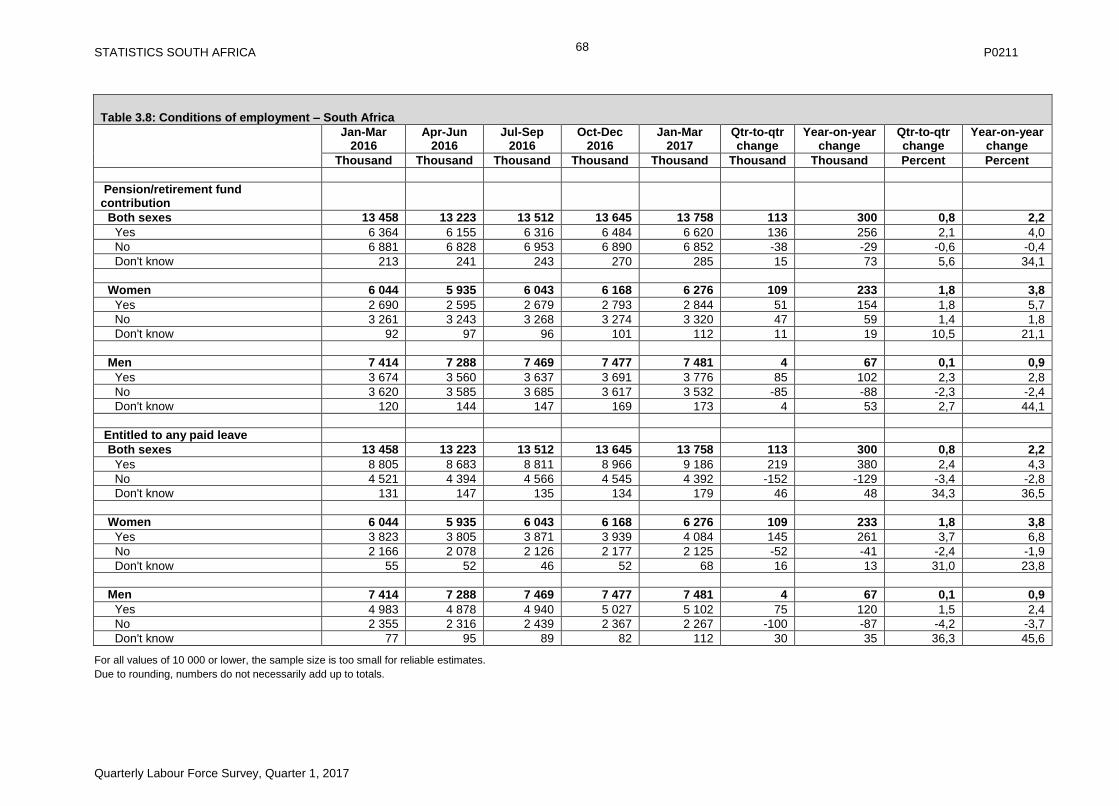
STATISTICS SOUTH AFRICA P0211
Quarterly Labour Force Survey, Quarter 1, 2017
68
Table 3.8: Conditions of employment – South Africa
Jan-Mar 2016
Apr-Jun 2016
Jul-Sep 2016
Oct-Dec 2016
Jan-Mar 2017
Qtr-to-qtr change
Year-on-year change
Qtr-to-qtr change
Year-on-year change
Thousand Thousand Thousand Thousand Thousand Thousand Thousand Percent Percent
Pension/retirement fund contribution
Both sexes 13 458 13 223 13 512 13 645 13 758 113 300 0,8 2,2
Yes 6 364 6 155 6 316 6 484 6 620 136 256 2,1 4,0
No 6 881 6 828 6 953 6 890 6 852 -38 -29 -0,6 -0,4
Don't know 213 241 243 270 285 15 73 5,6 34,1
Women 6 044 5 935 6 043 6 168 6 276 109 233 1,8 3,8
Yes 2 690 2 595 2 679 2 793 2 844 51 154 1,8 5,7
No 3 261 3 243 3 268 3 274 3 320 47 59 1,4 1,8
Don't know 92 97 96 101 112 11 19 10,5 21,1
Men 7 414 7 288 7 469 7 477 7 481 4 67 0,1 0,9
Yes 3 674 3 560 3 637 3 691 3 776 85 102 2,3 2,8
No 3 620 3 585 3 685 3 617 3 532 -85 -88 -2,3 -2,4
Don't know 120 144 147 169 173 4 53 2,7 44,1
Entitled to any paid leave
Both sexes 13 458 13 223 13 512 13 645 13 758 113 300 0,8 2,2
Yes 8 805 8 683 8 811 8 966 9 186 219 380 2,4 4,3
No 4 521 4 394 4 566 4 545 4 392 -152 -129 -3,4 -2,8
Don't know 131 147 135 134 179 46 48 34,3 36,5
Women 6 044 5 935 6 043 6 168 6 276 109 233 1,8 3,8
Yes 3 823 3 805 3 871 3 939 4 084 145 261 3,7 6,8
No 2 166 2 078 2 126 2 177 2 125 -52 -41 -2,4 -1,9
Don't know 55 52 46 52 68 16 13 31,0 23,8
Men 7 414 7 288 7 469 7 477 7 481 4 67 0,1 0,9
Yes 4 983 4 878 4 940 5 027 5 102 75 120 1,5 2,4
No 2 355 2 316 2 439 2 367 2 267 -100 -87 -4,2 -3,7
Don't know 77 95 89 82 112 30 35 36,3 45,6
For all values of 10 000 or lower, the sample size is too small for reliable estimates.
Due to rounding, numbers do not necessarily add up to totals.
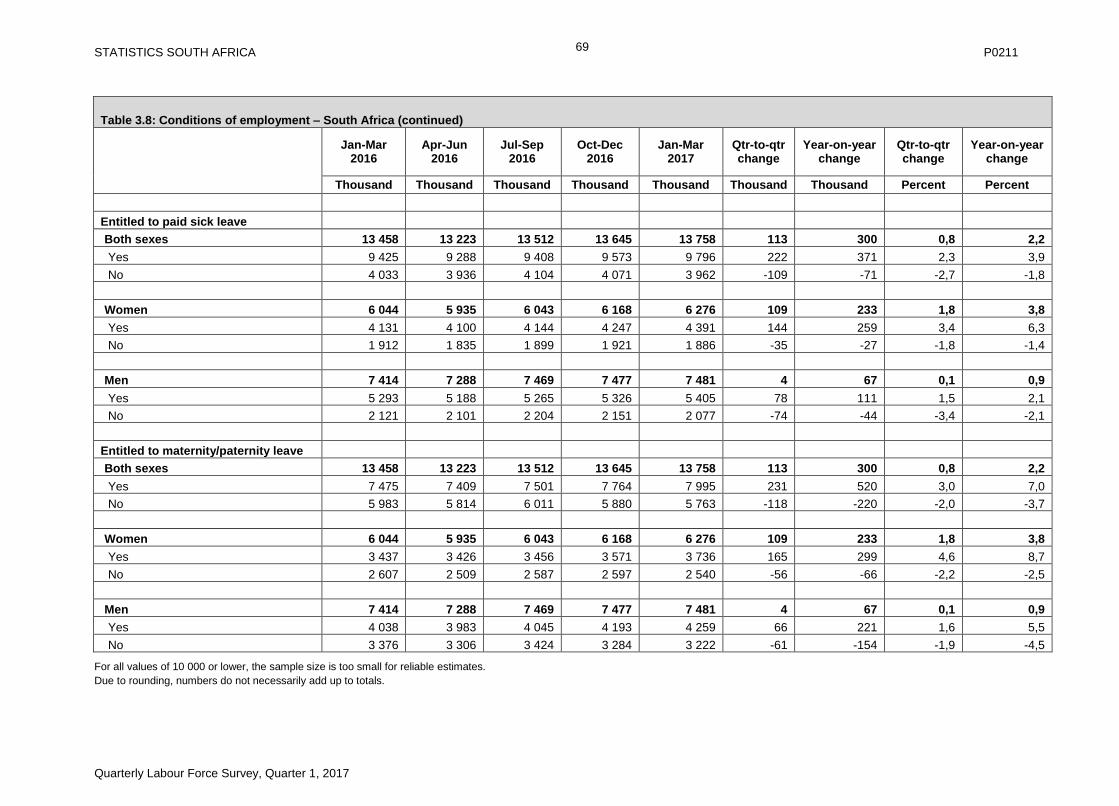
STATISTICS SOUTH AFRICA P0211
Quarterly Labour Force Survey, Quarter 1, 2017
69
Table 3.8: Conditions of employment – South Africa (continued)
Jan-Mar 2016
Apr-Jun 2016
Jul-Sep 2016
Oct-Dec 2016
Jan-Mar 2017
Qtr-to-qtr change
Year-on-year change
Qtr-to-qtr change
Year-on-year change
Thousand Thousand Thousand Thousand Thousand Thousand Thousand Percent Percent
Entitled to paid sick leave
Both sexes 13 458 13 223 13 512 13 645 13 758 113 300 0,8 2,2
Yes 9 425 9 288 9 408 9 573 9 796 222 371 2,3 3,9
No 4 033 3 936 4 104 4 071 3 962 -109 -71 -2,7 -1,8
Women 6 044 5 935 6 043 6 168 6 276 109 233 1,8 3,8
Yes 4 131 4 100 4 144 4 247 4 391 144 259 3,4 6,3
No 1 912 1 835 1 899 1 921 1 886 -35 -27 -1,8 -1,4
Men 7 414 7 288 7 469 7 477 7 481 4 67 0,1 0,9
Yes 5 293 5 188 5 265 5 326 5 405 78 111 1,5 2,1
No 2 121 2 101 2 204 2 151 2 077 -74 -44 -3,4 -2,1
Entitled to maternity/paternity leave
Both sexes 13 458 13 223 13 512 13 645 13 758 113 300 0,8 2,2
Yes 7 475 7 409 7 501 7 764 7 995 231 520 3,0 7,0
No 5 983 5 814 6 011 5 880 5 763 -118 -220 -2,0 -3,7
Women 6 044 5 935 6 043 6 168 6 276 109 233 1,8 3,8
Yes 3 437 3 426 3 456 3 571 3 736 165 299 4,6 8,7
No 2 607 2 509 2 587 2 597 2 540 -56 -66 -2,2 -2,5
Men 7 414 7 288 7 469 7 477 7 481 4 67 0,1 0,9
Yes 4 038 3 983 4 045 4 193 4 259 66 221 1,6 5,5
No 3 376 3 306 3 424 3 284 3 222 -61 -154 -1,9 -4,5
For all values of 10 000 or lower, the sample size is too small for reliable estimates.
Due to rounding, numbers do not necessarily add up to totals.
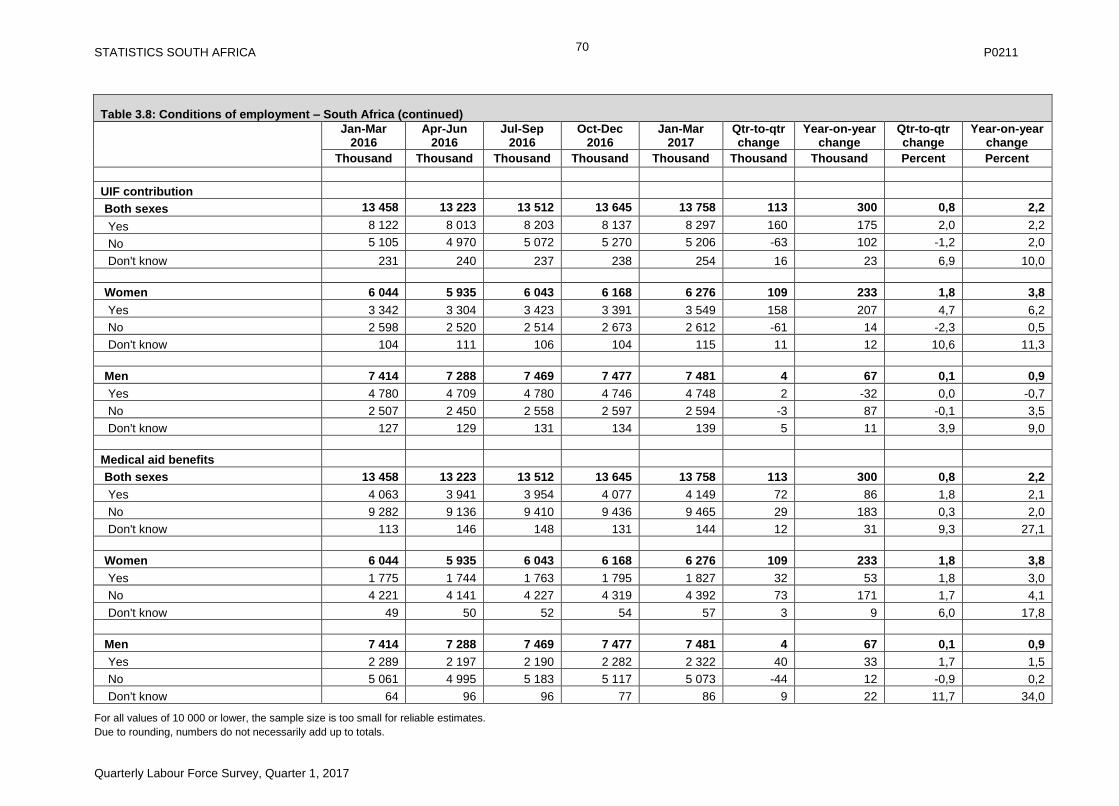
STATISTICS SOUTH AFRICA P0211
Quarterly Labour Force Survey, Quarter 1, 2017
70
Table 3.8: Conditions of employment – South Africa (continued)
Jan-Mar 2016
Apr-Jun 2016
Jul-Sep 2016
Oct-Dec 2016
Jan-Mar 2017
Qtr-to-qtr change
Year-on-year change
Qtr-to-qtr change
Year-on-year change
Thousand Thousand Thousand Thousand Thousand Thousand Thousand Percent Percent
UIF contribution
Both sexes 13 458 13 223 13 512 13 645 13 758 113 300 0,8 2,2
Yes 8 122 8 013 8 203 8 137 8 297 160 175 2,0 2,2
No 5 105 4 970 5 072 5 270 5 206 -63 102 -1,2 2,0
Don't know 231 240 237 238 254 16 23 6,9 10,0
Women 6 044 5 935 6 043 6 168 6 276 109 233 1,8 3,8
Yes 3 342 3 304 3 423 3 391 3 549 158 207 4,7 6,2
No 2 598 2 520 2 514 2 673 2 612 -61 14 -2,3 0,5
Don't know 104 111 106 104 115 11 12 10,6 11,3
Men 7 414 7 288 7 469 7 477 7 481 4 67 0,1 0,9
Yes 4 780 4 709 4 780 4 746 4 748 2 -32 0,0 -0,7
No 2 507 2 450 2 558 2 597 2 594 -3 87 -0,1 3,5
Don't know 127 129 131 134 139 5 11 3,9 9,0
Medical aid benefits
Both sexes 13 458 13 223 13 512 13 645 13 758 113 300 0,8 2,2
Yes 4 063 3 941 3 954 4 077 4 149 72 86 1,8 2,1
No 9 282 9 136 9 410 9 436 9 465 29 183 0,3 2,0
Don't know 113 146 148 131 144 12 31 9,3 27,1
Women 6 044 5 935 6 043 6 168 6 276 109 233 1,8 3,8
Yes 1 775 1 744 1 763 1 795 1 827 32 53 1,8 3,0
No 4 221 4 141 4 227 4 319 4 392 73 171 1,7 4,1
Don't know 49 50 52 54 57 3 9 6,0 17,8
Men 7 414 7 288 7 469 7 477 7 481 4 67 0,1 0,9
Yes 2 289 2 197 2 190 2 282 2 322 40 33 1,7 1,5
No 5 061 4 995 5 183 5 117 5 073 -44 12 -0,9 0,2
Don't know 64 96 96 77 86 9 22 11,7 34,0
For all values of 10 000 or lower, the sample size is too small for reliable estimates.
Due to rounding, numbers do not necessarily add up to totals.
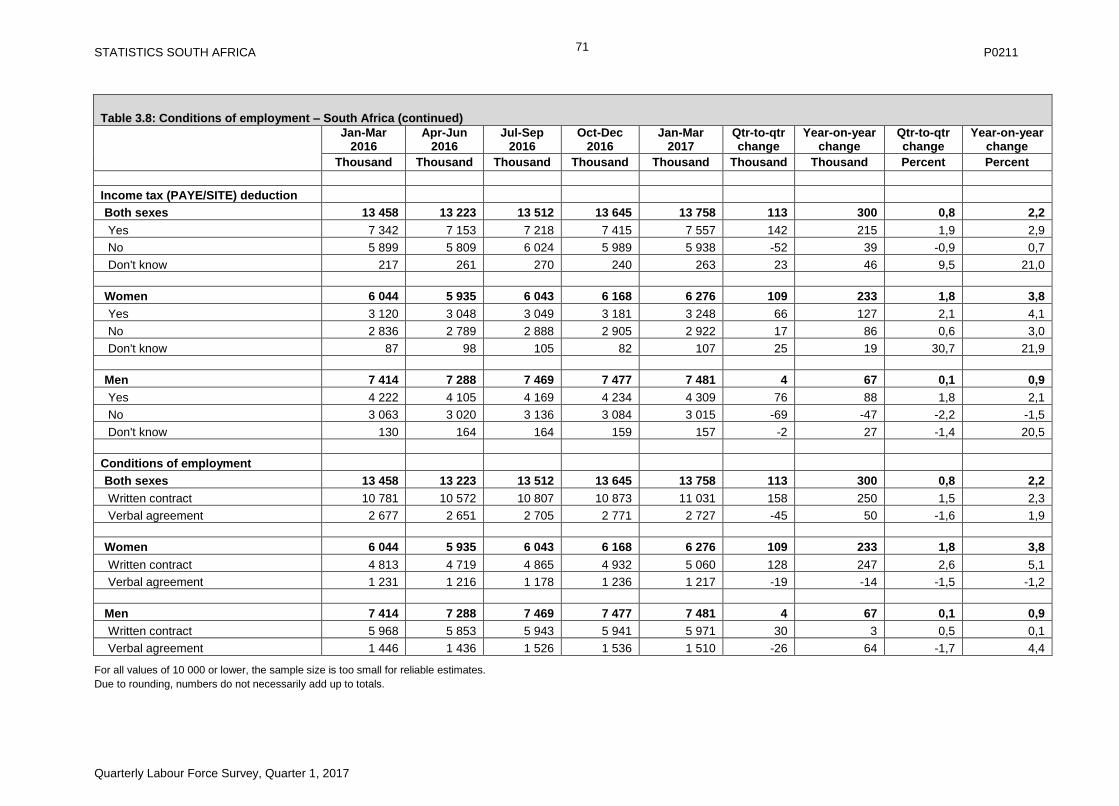
STATISTICS SOUTH AFRICA P0211
Quarterly Labour Force Survey, Quarter 1, 2017
71
Table 3.8: Conditions of employment – South Africa (continued)
Jan-Mar 2016
Apr-Jun 2016
Jul-Sep 2016
Oct-Dec 2016
Jan-Mar 2017
Qtr-to-qtr change
Year-on-year change
Qtr-to-qtr change
Year-on-year change
Thousand Thousand Thousand Thousand Thousand Thousand Thousand Percent Percent
Income tax (PAYE/SITE) deduction
Both sexes 13 458 13 223 13 512 13 645 13 758 113 300 0,8 2,2
Yes 7 342 7 153 7 218 7 415 7 557 142 215 1,9 2,9
No 5 899 5 809 6 024 5 989 5 938 -52 39 -0,9 0,7
Don't know 217 261 270 240 263 23 46 9,5 21,0
Women 6 044 5 935 6 043 6 168 6 276 109 233 1,8 3,8
Yes 3 120 3 048 3 049 3 181 3 248 66 127 2,1 4,1
No 2 836 2 789 2 888 2 905 2 922 17 86 0,6 3,0
Don't know 87 98 105 82 107 25 19 30,7 21,9
Men 7 414 7 288 7 469 7 477 7 481 4 67 0,1 0,9
Yes 4 222 4 105 4 169 4 234 4 309 76 88 1,8 2,1
No 3 063 3 020 3 136 3 084 3 015 -69 -47 -2,2 -1,5
Don't know 130 164 164 159 157 -2 27 -1,4 20,5
Conditions of employment
Both sexes 13 458 13 223 13 512 13 645 13 758 113 300 0,8 2,2
Written contract 10 781 10 572 10 807 10 873 11 031 158 250 1,5 2,3
Verbal agreement 2 677 2 651 2 705 2 771 2 727 -45 50 -1,6 1,9
Women 6 044 5 935 6 043 6 168 6 276 109 233 1,8 3,8
Written contract 4 813 4 719 4 865 4 932 5 060 128 247 2,6 5,1
Verbal agreement 1 231 1 216 1 178 1 236 1 217 -19 -14 -1,5 -1,2
Men 7 414 7 288 7 469 7 477 7 481 4 67 0,1 0,9
Written contract 5 968 5 853 5 943 5 941 5 971 30 3 0,5 0,1
Verbal agreement 1 446 1 436 1 526 1 536 1 510 -26 64 -1,7 4,4
For all values of 10 000 or lower, the sample size is too small for reliable estimates.
Due to rounding, numbers do not necessarily add up to totals.

STATISTICS SOUTH AFRICA P0211
Quarterly Labour Force Survey, Quarter 1, 2017
72
Table 3.8: Conditions of employment – South Africa (continued)
Jan-Mar 2016
Apr-Jun 2016
Jul-Sep 2016
Oct-Dec 2016
Jan-Mar 2017
Qtr-to-qtr change
Year-on-year change
Qtr-to-qtr change
Year-on-year change
Thousand Thousand Thousand Thousand Thousand Thousand Thousand Percent Percent
Nature of contract/agreement
Both sexes 13 458 13 223 13 512 13 645 13 758 113 300 0,8 2,2
Limited duration 1 859 1 775 1 928 1 890 1 857 -33 -2 -1,7 -0,1
Permanent nature 8 380 8 168 8 274 8 359 8 493 134 113 1,6 1,3
Unspecified duration 3 219 3 281 3 310 3 396 3 408 12 189 0,4 5,9
Women 6 044 5 935 6 043 6 168 6 276 108 232 1,8 3,8
Limited duration 909 879 953 993 950 -43 41 -4,3 4,5
Permanent nature 3 644 3 556 3 628 3 645 3 766 121 122 3,3 3,3
Unspecified duration 1 491 1 501 1 462 1 530 1 560 30 69 2,0 4,6
Men 7 414 7 288 7 469 7 477 7 481 4 67 0,1 0,9
Limited duration 950 896 976 897 906 9 -44 1,0 -4,6
Permanent nature 4 736 4 612 4 646 4 714 4 726 12 -10 0,3 -0,2
Unspecified duration 1 728 1 780 1 848 1 866 1 849 -17 121 -0,9 7,0
Trade union membership
Both sexes 13 458 13 223 13 512 13 645 13 758 113 300 0,8 2,2
Yes 3 788 3 716 3 781 3 849 3 947 98 159 2,5 4,2
No 9 299 9 117 9 373 9 437 9 370 -67 71 -0,7 0,8
Don't know 371 390 358 359 441 82 70 22,8 18,9
Women 6 044 5 935 6 043 6 168 6 276 108 232 1,8 3,8
Yes 1 575 1 587 1 617 1 665 1 680 15 105 0,9 6,7
No 4 321 4 191 4 289 4 377 4 413 36 92 0,8 2,1
Don't know 148 158 137 126 183 57 35 45,2 23,6
Men 7 414 7 288 7 469 7 477 7 481 4 67 0,1 0,9
Yes 2 213 2 129 2 164 2 184 2 267 83 54 3,8 2,4
No 4 978 4 927 5 084 5 060 4 957 -103 -21 -2,0 -0,4
Don't know 223 232 220 234 258 24 35 10,3 15,7
For all values of 10 000 or lower, the sample size is too small for reliable estimates.
Due to rounding, numbers do not necessarily add up to totals.
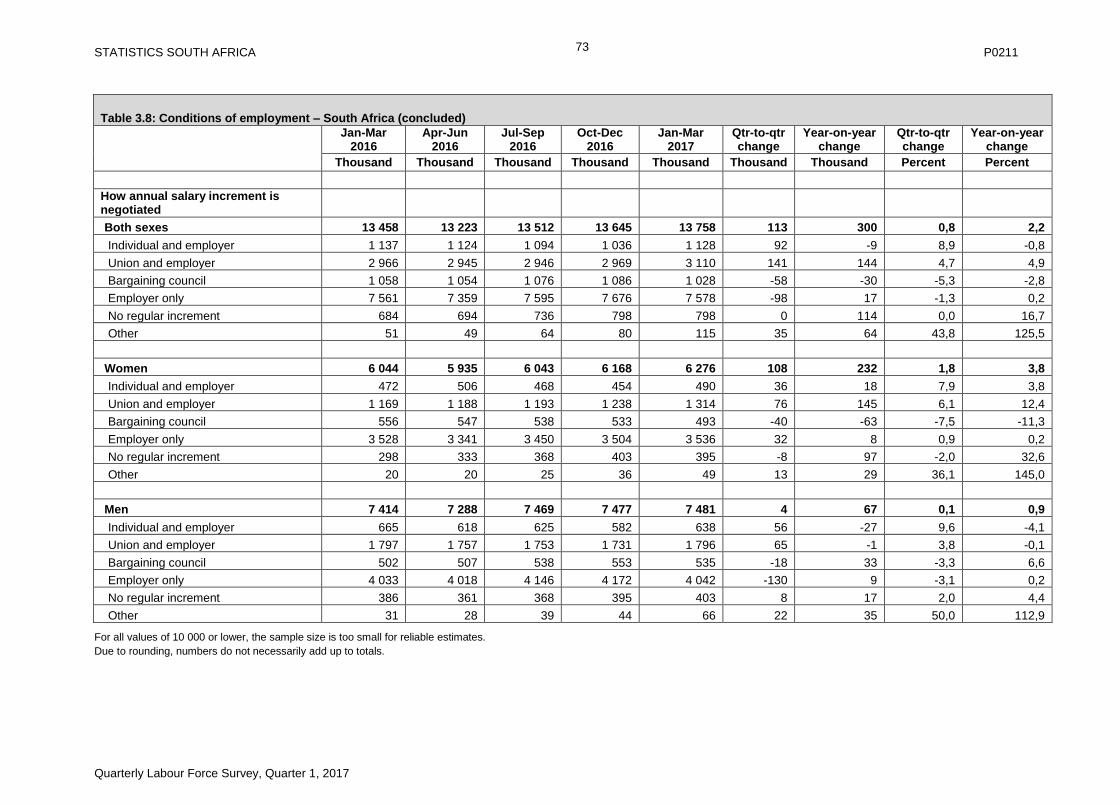
STATISTICS SOUTH AFRICA P0211
Quarterly Labour Force Survey, Quarter 1, 2017
73
Table 3.8: Conditions of employment – South Africa (concluded)
Jan-Mar 2016
Apr-Jun 2016
Jul-Sep 2016
Oct-Dec 2016
Jan-Mar 2017
Qtr-to-qtr change
Year-on-year change
Qtr-to-qtr change
Year-on-year change
Thousand Thousand Thousand Thousand Thousand Thousand Thousand Percent Percent
How annual salary increment is negotiated
Both sexes 13 458 13 223 13 512 13 645 13 758 113 300 0,8 2,2
Individual and employer 1 137 1 124 1 094 1 036 1 128 92 -9 8,9 -0,8
Union and employer 2 966 2 945 2 946 2 969 3 110 141 144 4,7 4,9
Bargaining council 1 058 1 054 1 076 1 086 1 028 -58 -30 -5,3 -2,8
Employer only 7 561 7 359 7 595 7 676 7 578 -98 17 -1,3 0,2
No regular increment 684 694 736 798 798 0 114 0,0 16,7
Other 51 49 64 80 115 35 64 43,8 125,5
Women 6 044 5 935 6 043 6 168 6 276 108 232 1,8 3,8
Individual and employer 472 506 468 454 490 36 18 7,9 3,8
Union and employer 1 169 1 188 1 193 1 238 1 314 76 145 6,1 12,4
Bargaining council 556 547 538 533 493 -40 -63 -7,5 -11,3
Employer only 3 528 3 341 3 450 3 504 3 536 32 8 0,9 0,2
No regular increment 298 333 368 403 395 -8 97 -2,0 32,6
Other 20 20 25 36 49 13 29 36,1 145,0
Men 7 414 7 288 7 469 7 477 7 481 4 67 0,1 0,9
Individual and employer 665 618 625 582 638 56 -27 9,6 -4,1
Union and employer 1 797 1 757 1 753 1 731 1 796 65 -1 3,8 -0,1
Bargaining council 502 507 538 553 535 -18 33 -3,3 6,6
Employer only 4 033 4 018 4 146 4 172 4 042 -130 9 -3,1 0,2
No regular increment 386 361 368 395 403 8 17 2,0 4,4
Other 31 28 39 44 66 22 35 50,0 112,9
For all values of 10 000 or lower, the sample size is too small for reliable estimates.
Due to rounding, numbers do not necessarily add up to totals.
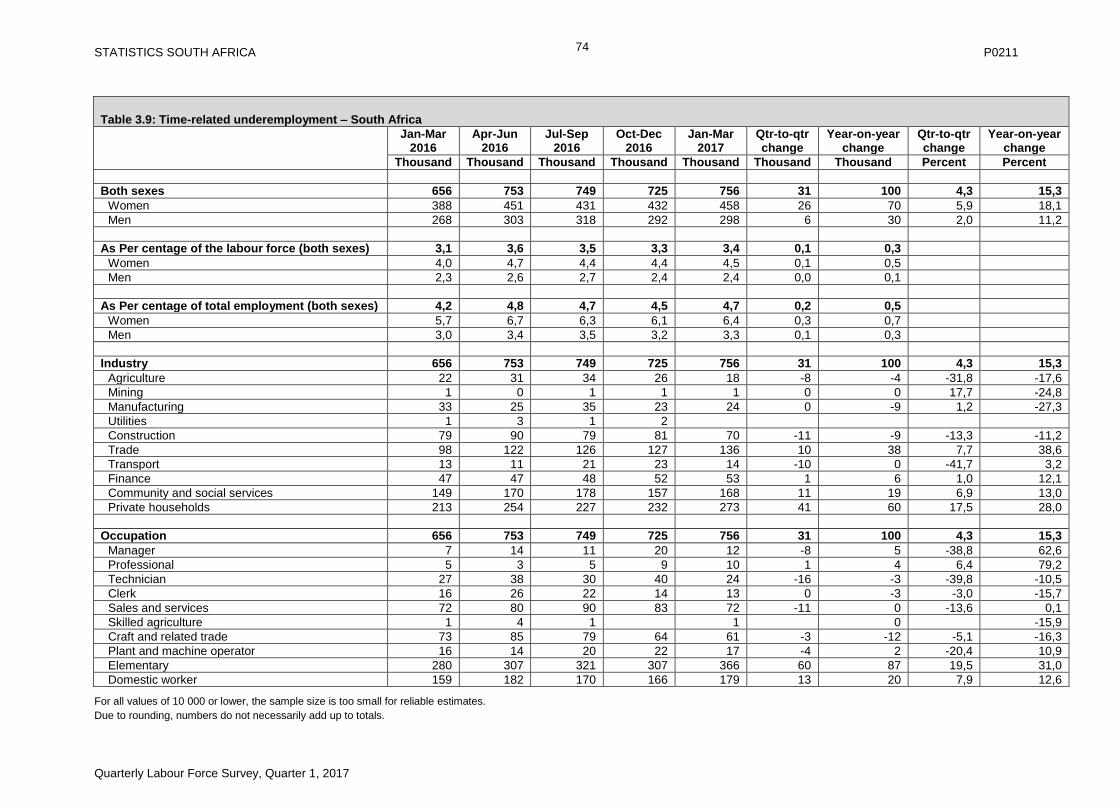
STATISTICS SOUTH AFRICA P0211
Quarterly Labour Force Survey, Quarter 1, 2017
74
Table 3.9: Time-related underemployment – South Africa
Jan-Mar 2016
Apr-Jun 2016
Jul-Sep 2016
Oct-Dec 2016
Jan-Mar 2017
Qtr-to-qtr change
Year-on-year change
Qtr-to-qtr change
Year-on-year change
Thousand Thousand Thousand Thousand Thousand Thousand Thousand Percent Percent
Both sexes 656 753 749 725 756 31 100 4,3 15,3
Women 388 451 431 432 458 26 70 5,9 18,1
Men 268 303 318 292 298 6 30 2,0 11,2
As Per centage of the labour force (both sexes) 3,1 3,6 3,5 3,3 3,4 0,1 0,3
Women 4,0 4,7 4,4 4,4 4,5 0,1 0,5
Men 2,3 2,6 2,7 2,4 2,4 0,0 0,1
As Per centage of total employment (both sexes) 4,2 4,8 4,7 4,5 4,7 0,2 0,5
Women 5,7 6,7 6,3 6,1 6,4 0,3 0,7
Men 3,0 3,4 3,5 3,2 3,3 0,1 0,3
Industry 656 753 749 725 756 31 100 4,3 15,3
Agriculture 22 31 34 26 18 -8 -4 -31,8 -17,6
Mining 1 0 1 1 1 0 0 17,7 -24,8
Manufacturing 33 25 35 23 24 0 -9 1,2 -27,3
Utilities 1 3 1 2
Construction 79 90 79 81 70 -11 -9 -13,3 -11,2
Trade 98 122 126 127 136 10 38 7,7 38,6
Transport 13 11 21 23 14 -10 0 -41,7 3,2
Finance 47 47 48 52 53 1 6 1,0 12,1
Community and social services 149 170 178 157 168 11 19 6,9 13,0
Private households 213 254 227 232 273 41 60 17,5 28,0
Occupation 656 753 749 725 756 31 100 4,3 15,3
Manager 7 14 11 20 12 -8 5 -38,8 62,6
Professional 5 3 5 9 10 1 4 6,4 79,2
Technician 27 38 30 40 24 -16 -3 -39,8 -10,5
Clerk 16 26 22 14 13 0 -3 -3,0 -15,7
Sales and services 72 80 90 83 72 -11 0 -13,6 0,1
Skilled agriculture 1 4 1 1 0 -15,9
Craft and related trade 73 85 79 64 61 -3 -12 -5,1 -16,3
Plant and machine operator 16 14 20 22 17 -4 2 -20,4 10,9
Elementary 280 307 321 307 366 60 87 19,5 31,0
Domestic worker 159 182 170 166 179 13 20 7,9 12,6
For all values of 10 000 or lower, the sample size is too small for reliable estimates.
Due to rounding, numbers do not necessarily add up to totals.
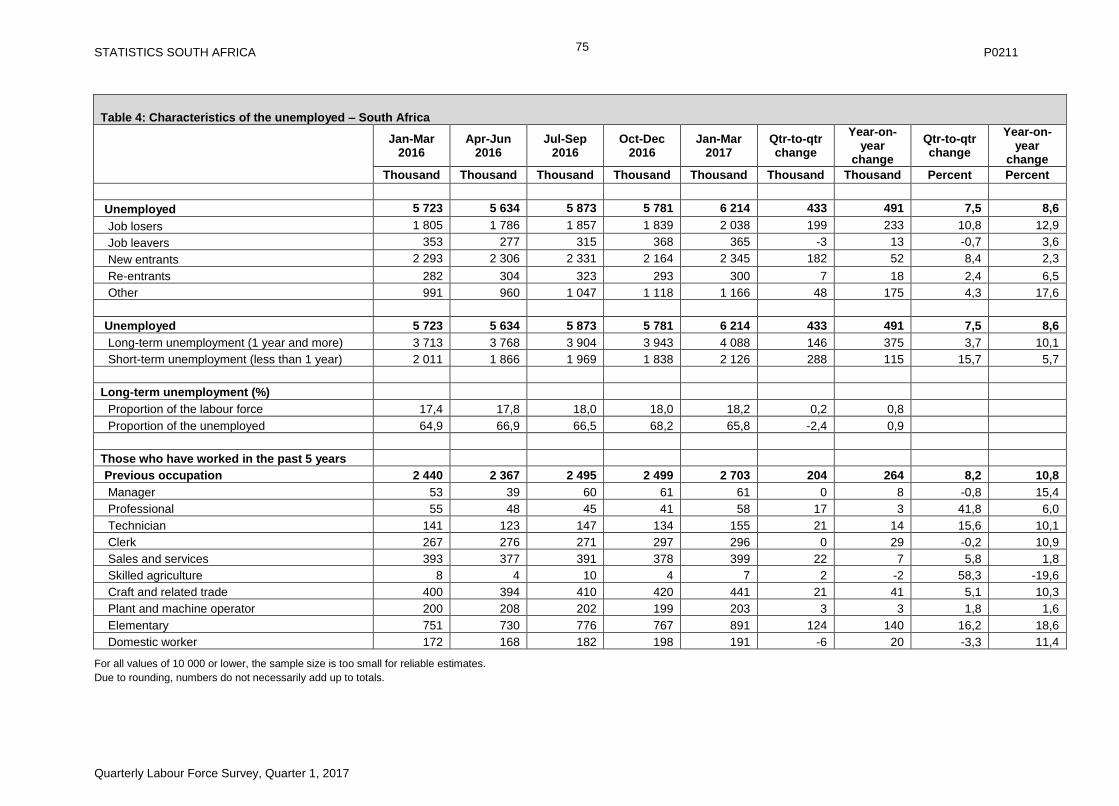
STATISTICS SOUTH AFRICA P0211
Quarterly Labour Force Survey, Quarter 1, 2017
75
Table 4: Characteristics of the unemployed – South Africa
Jan-Mar 2016
Apr-Jun 2016
Jul-Sep 2016
Oct-Dec 2016
Jan-Mar 2017
Qtr-to-qtr change
Year-on-year
change
Qtr-to-qtr change
Year-on-year
change
Thousand Thousand Thousand Thousand Thousand Thousand Thousand Percent Percent
Unemployed 5 723 5 634 5 873 5 781 6 214 433 491 7,5 8,6
Job losers 1 805 1 786 1 857 1 839 2 038 199 233 10,8 12,9
Job leavers 353 277 315 368 365 -3 13 -0,7 3,6
New entrants 2 293 2 306 2 331 2 164 2 345 182 52 8,4 2,3
Re-entrants 282 304 323 293 300 7 18 2,4 6,5
Other 991 960 1 047 1 118 1 166 48 175 4,3 17,6
Unemployed 5 723 5 634 5 873 5 781 6 214 433 491 7,5 8,6
Long-term unemployment (1 year and more) 3 713 3 768 3 904 3 943 4 088 146 375 3,7 10,1
Short-term unemployment (less than 1 year) 2 011 1 866 1 969 1 838 2 126 288 115 15,7 5,7
Long-term unemployment (%)
Proportion of the labour force 17,4 17,8 18,0 18,0 18,2 0,2 0,8
Proportion of the unemployed 64,9 66,9 66,5 68,2 65,8 -2,4 0,9
Those who have worked in the past 5 years
Previous occupation 2 440 2 367 2 495 2 499 2 703 204 264 8,2 10,8
Manager 53 39 60 61 61 0 8 -0,8 15,4
Professional 55 48 45 41 58 17 3 41,8 6,0
Technician 141 123 147 134 155 21 14 15,6 10,1
Clerk 267 276 271 297 296 0 29 -0,2 10,9
Sales and services 393 377 391 378 399 22 7 5,8 1,8
Skilled agriculture 8 4 10 4 7 2 -2 58,3 -19,6
Craft and related trade 400 394 410 420 441 21 41 5,1 10,3
Plant and machine operator 200 208 202 199 203 3 3 1,8 1,6
Elementary 751 730 776 767 891 124 140 16,2 18,6
Domestic worker 172 168 182 198 191 -6 20 -3,3 11,4
For all values of 10 000 or lower, the sample size is too small for reliable estimates.
Due to rounding, numbers do not necessarily add up to totals.
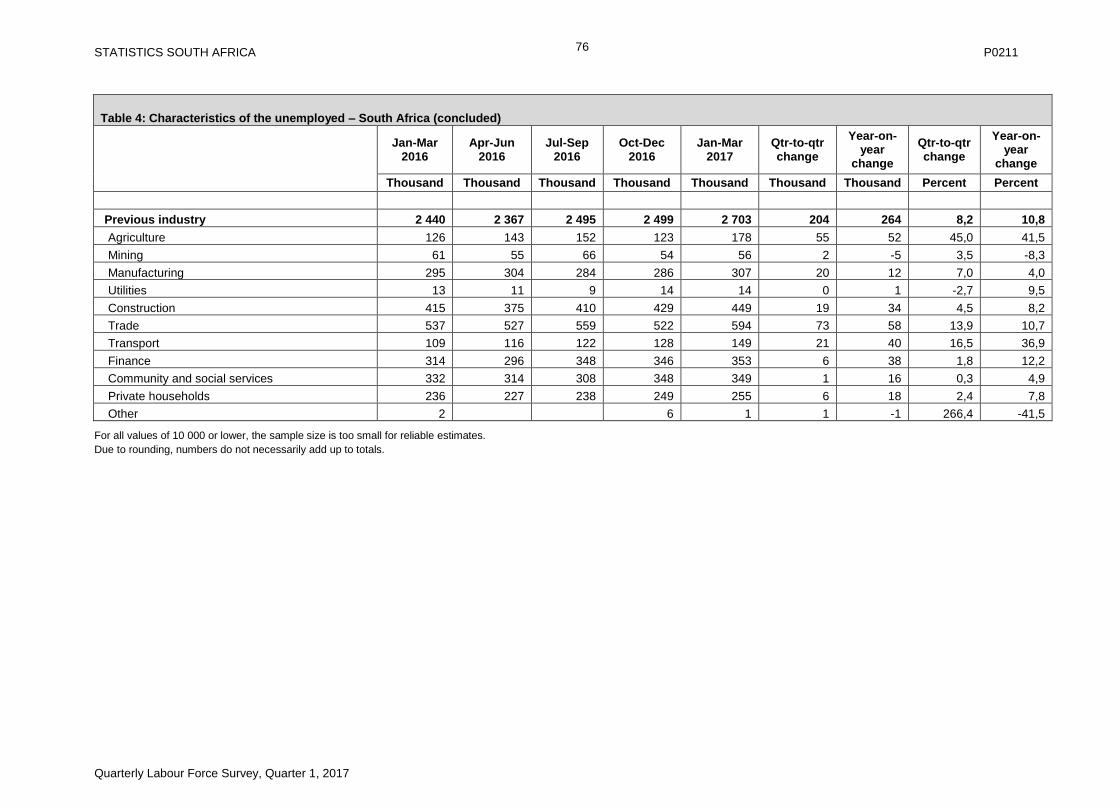
STATISTICS SOUTH AFRICA P0211
Quarterly Labour Force Survey, Quarter 1, 2017
76
Table 4: Characteristics of the unemployed – South Africa (concluded)
Jan-Mar 2016
Apr-Jun 2016
Jul-Sep 2016
Oct-Dec 2016
Jan-Mar 2017
Qtr-to-qtr change
Year-on-year
change
Qtr-to-qtr change
Year-on-year
change
Thousand Thousand Thousand Thousand Thousand Thousand Thousand Percent Percent
Previous industry 2 440 2 367 2 495 2 499 2 703 204 264 8,2 10,8
Agriculture 126 143 152 123 178 55 52 45,0 41,5
Mining 61 55 66 54 56 2 -5 3,5 -8,3
Manufacturing 295 304 284 286 307 20 12 7,0 4,0
Utilities 13 11 9 14 14 0 1 -2,7 9,5
Construction 415 375 410 429 449 19 34 4,5 8,2
Trade 537 527 559 522 594 73 58 13,9 10,7
Transport 109 116 122 128 149 21 40 16,5 36,9
Finance 314 296 348 346 353 6 38 1,8 12,2
Community and social services 332 314 308 348 349 1 16 0,3 4,9
Private households 236 227 238 249 255 6 18 2,4 7,8
Other 2 6 1 1 -1 266,4 -41,5
For all values of 10 000 or lower, the sample size is too small for reliable estimates.
Due to rounding, numbers do not necessarily add up to totals.
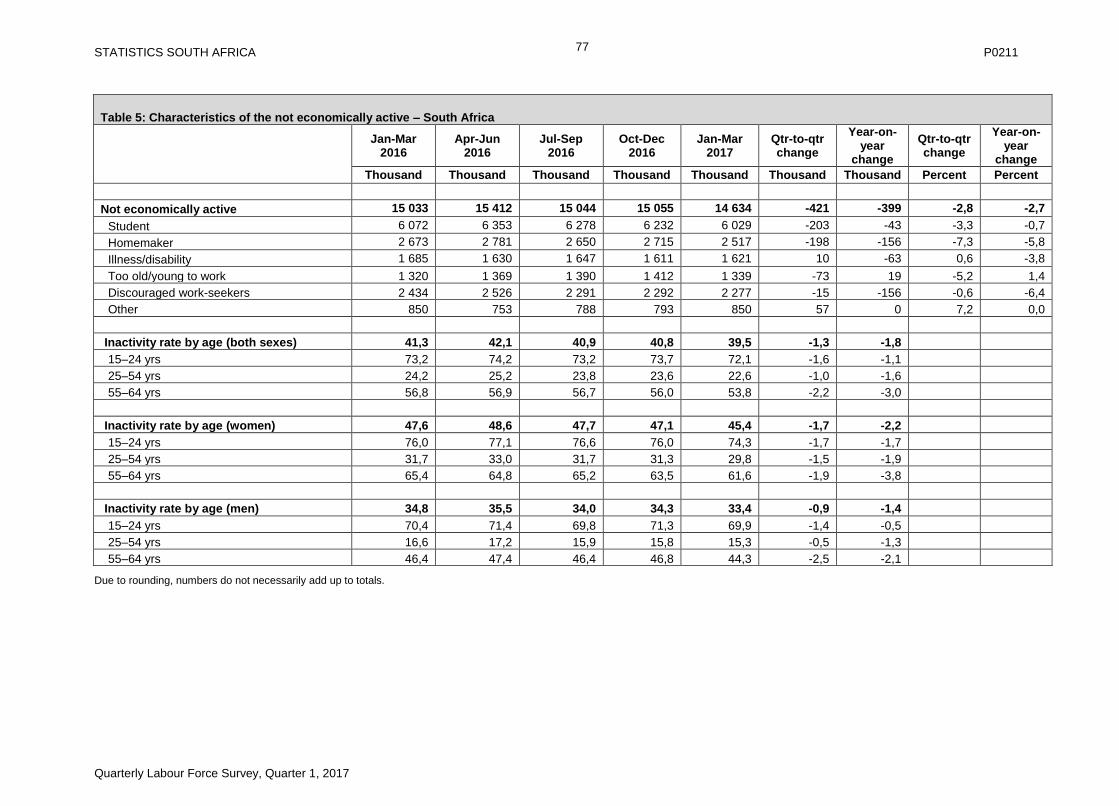
STATISTICS SOUTH AFRICA P0211
Quarterly Labour Force Survey, Quarter 1, 2017
77
Table 5: Characteristics of the not economically active – South Africa
Jan-Mar 2016
Apr-Jun 2016
Jul-Sep 2016
Oct-Dec 2016
Jan-Mar 2017
Qtr-to-qtr change
Year-on-year
change
Qtr-to-qtr change
Year-on-year
change
Thousand Thousand Thousand Thousand Thousand Thousand Thousand Percent Percent
Not economically active 15 033 15 412 15 044 15 055 14 634 -421 -399 -2,8 -2,7
Student 6 072 6 353 6 278 6 232 6 029 -203 -43 -3,3 -0,7
Homemaker 2 673 2 781 2 650 2 715 2 517 -198 -156 -7,3 -5,8
Illness/disability 1 685 1 630 1 647 1 611 1 621 10 -63 0,6 -3,8
Too old/young to work 1 320 1 369 1 390 1 412 1 339 -73 19 -5,2 1,4
Discouraged work-seekers 2 434 2 526 2 291 2 292 2 277 -15 -156 -0,6 -6,4
Other 850 753 788 793 850 57 0 7,2 0,0
Inactivity rate by age (both sexes) 41,3 42,1 40,9 40,8 39,5 -1,3 -1,8
15–24 yrs 73,2 74,2 73,2 73,7 72,1 -1,6 -1,1
25–54 yrs 24,2 25,2 23,8 23,6 22,6 -1,0 -1,6
55–64 yrs 56,8 56,9 56,7 56,0 53,8 -2,2 -3,0
Inactivity rate by age (women) 47,6 48,6 47,7 47,1 45,4 -1,7 -2,2
15–24 yrs 76,0 77,1 76,6 76,0 74,3 -1,7 -1,7
25–54 yrs 31,7 33,0 31,7 31,3 29,8 -1,5 -1,9
55–64 yrs 65,4 64,8 65,2 63,5 61,6 -1,9 -3,8
Inactivity rate by age (men) 34,8 35,5 34,0 34,3 33,4 -0,9 -1,4
15–24 yrs 70,4 71,4 69,8 71,3 69,9 -1,4 -0,5
25–54 yrs 16,6 17,2 15,9 15,8 15,3 -0,5 -1,3
55–64 yrs 46,4 47,4 46,4 46,8 44,3 -2,5 -2,1
Due to rounding, numbers do not necessarily add up to totals.
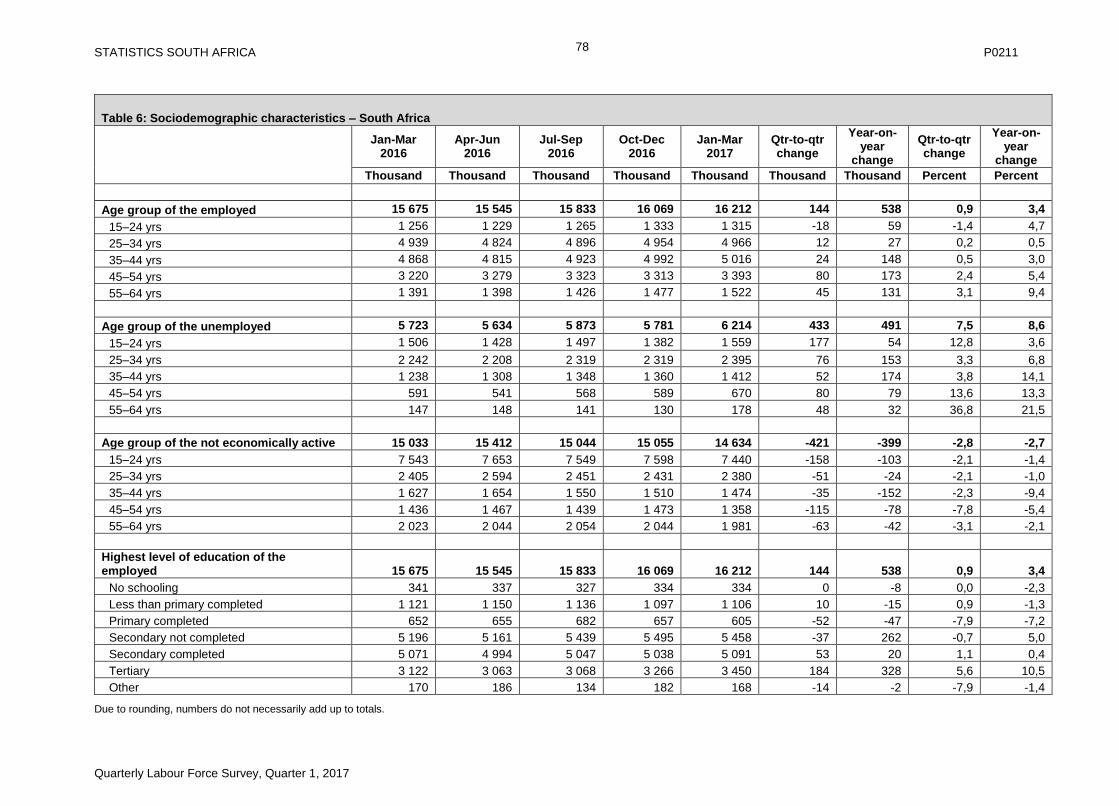
STATISTICS SOUTH AFRICA P0211
Quarterly Labour Force Survey, Quarter 1, 2017
78
Table 6: Sociodemographic characteristics – South Africa
Jan-Mar 2016
Apr-Jun 2016
Jul-Sep 2016
Oct-Dec 2016
Jan-Mar 2017
Qtr-to-qtr change
Year-on-year
change
Qtr-to-qtr change
Year-on-year
change
Thousand Thousand Thousand Thousand Thousand Thousand Thousand Percent Percent
Age group of the employed 15 675 15 545 15 833 16 069 16 212 144 538 0,9 3,4
15–24 yrs 1 256 1 229 1 265 1 333 1 315 -18 59 -1,4 4,7
25–34 yrs 4 939 4 824 4 896 4 954 4 966 12 27 0,2 0,5
35–44 yrs 4 868 4 815 4 923 4 992 5 016 24 148 0,5 3,0
45–54 yrs 3 220 3 279 3 323 3 313 3 393 80 173 2,4 5,4
55–64 yrs 1 391 1 398 1 426 1 477 1 522 45 131 3,1 9,4
Age group of the unemployed 5 723 5 634 5 873 5 781 6 214 433 491 7,5 8,6
15–24 yrs 1 506 1 428 1 497 1 382 1 559 177 54 12,8 3,6
25–34 yrs 2 242 2 208 2 319 2 319 2 395 76 153 3,3 6,8
35–44 yrs 1 238 1 308 1 348 1 360 1 412 52 174 3,8 14,1
45–54 yrs 591 541 568 589 670 80 79 13,6 13,3
55–64 yrs 147 148 141 130 178 48 32 36,8 21,5
Age group of the not economically active 15 033 15 412 15 044 15 055 14 634 -421 -399 -2,8 -2,7
15–24 yrs 7 543 7 653 7 549 7 598 7 440 -158 -103 -2,1 -1,4
25–34 yrs 2 405 2 594 2 451 2 431 2 380 -51 -24 -2,1 -1,0
35–44 yrs 1 627 1 654 1 550 1 510 1 474 -35 -152 -2,3 -9,4
45–54 yrs 1 436 1 467 1 439 1 473 1 358 -115 -78 -7,8 -5,4
55–64 yrs 2 023 2 044 2 054 2 044 1 981 -63 -42 -3,1 -2,1
Highest level of education of the employed 15 675 15 545 15 833 16 069 16 212 144 538 0,9 3,4
No schooling 341 337 327 334 334 0 -8 0,0 -2,3
Less than primary completed 1 121 1 150 1 136 1 097 1 106 10 -15 0,9 -1,3
Primary completed 652 655 682 657 605 -52 -47 -7,9 -7,2
Secondary not completed 5 196 5 161 5 439 5 495 5 458 -37 262 -0,7 5,0
Secondary completed 5 071 4 994 5 047 5 038 5 091 53 20 1,1 0,4
Tertiary 3 122 3 063 3 068 3 266 3 450 184 328 5,6 10,5
Other 170 186 134 182 168 -14 -2 -7,9 -1,4
Due to rounding, numbers do not necessarily add up to totals.
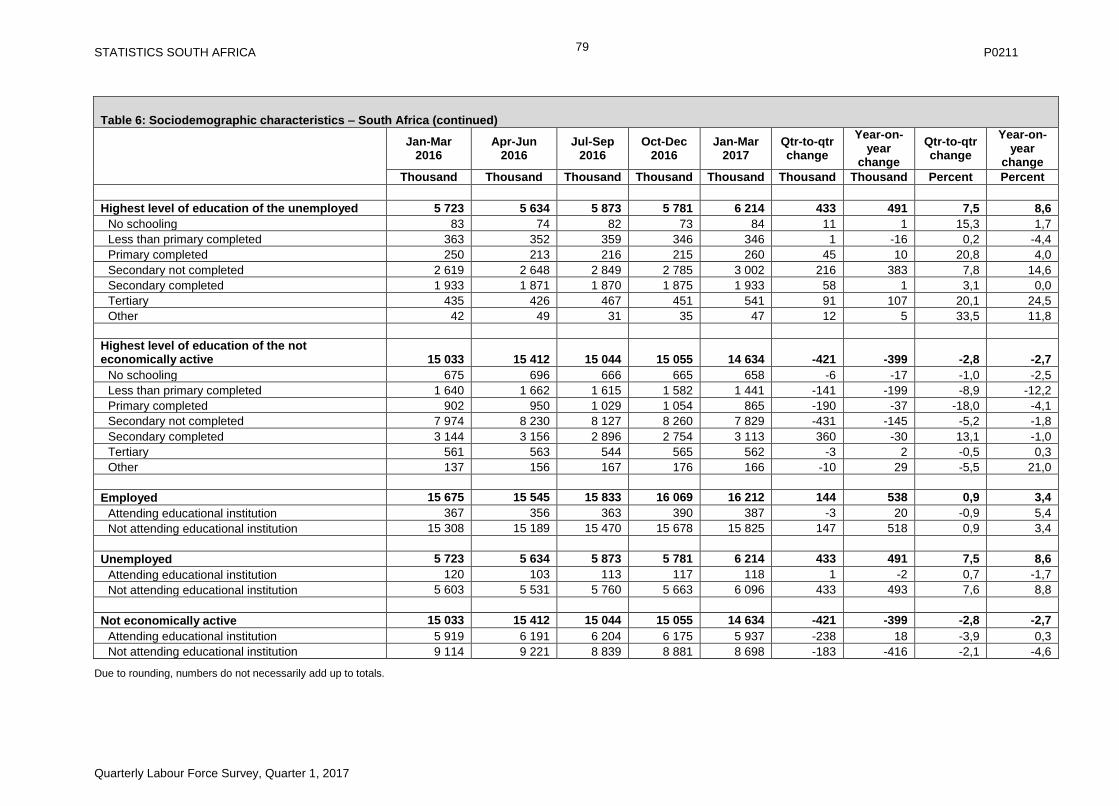
STATISTICS SOUTH AFRICA P0211
Quarterly Labour Force Survey, Quarter 1, 2017
79
Table 6: Sociodemographic characteristics – South Africa (continued)
Jan-Mar 2016
Apr-Jun 2016
Jul-Sep 2016
Oct-Dec 2016
Jan-Mar 2017
Qtr-to-qtr change
Year-on-year
change
Qtr-to-qtr change
Year-on-year
change
Thousand Thousand Thousand Thousand Thousand Thousand Thousand Percent Percent
Highest level of education of the unemployed 5 723 5 634 5 873 5 781 6 214 433 491 7,5 8,6
No schooling 83 74 82 73 84 11 1 15,3 1,7
Less than primary completed 363 352 359 346 346 1 -16 0,2 -4,4
Primary completed 250 213 216 215 260 45 10 20,8 4,0
Secondary not completed 2 619 2 648 2 849 2 785 3 002 216 383 7,8 14,6
Secondary completed 1 933 1 871 1 870 1 875 1 933 58 1 3,1 0,0
Tertiary 435 426 467 451 541 91 107 20,1 24,5
Other 42 49 31 35 47 12 5 33,5 11,8
Highest level of education of the not economically active 15 033 15 412 15 044 15 055 14 634 -421 -399 -2,8 -2,7
No schooling 675 696 666 665 658 -6 -17 -1,0 -2,5
Less than primary completed 1 640 1 662 1 615 1 582 1 441 -141 -199 -8,9 -12,2
Primary completed 902 950 1 029 1 054 865 -190 -37 -18,0 -4,1
Secondary not completed 7 974 8 230 8 127 8 260 7 829 -431 -145 -5,2 -1,8
Secondary completed 3 144 3 156 2 896 2 754 3 113 360 -30 13,1 -1,0
Tertiary 561 563 544 565 562 -3 2 -0,5 0,3
Other 137 156 167 176 166 -10 29 -5,5 21,0
Employed 15 675 15 545 15 833 16 069 16 212 144 538 0,9 3,4
Attending educational institution 367 356 363 390 387 -3 20 -0,9 5,4
Not attending educational institution 15 308 15 189 15 470 15 678 15 825 147 518 0,9 3,4
Unemployed 5 723 5 634 5 873 5 781 6 214 433 491 7,5 8,6
Attending educational institution 120 103 113 117 118 1 -2 0,7 -1,7
Not attending educational institution 5 603 5 531 5 760 5 663 6 096 433 493 7,6 8,8
Not economically active 15 033 15 412 15 044 15 055 14 634 -421 -399 -2,8 -2,7
Attending educational institution 5 919 6 191 6 204 6 175 5 937 -238 18 -3,9 0,3
Not attending educational institution 9 114 9 221 8 839 8 881 8 698 -183 -416 -2,1 -4,6
Due to rounding, numbers do not necessarily add up to totals.

STATISTICS SOUTH AFRICA P0211
Quarterly Labour Force Survey, Quarter 1, 2017
80
Table 6: Sociodemographic characteristics – South Africa (concluded)
Jan-Mar 2016
Apr-Jun 2016
Jul-Sep 2016
Oct-Dec 2016
Jan-Mar 2017
Qtr-to-qtr change
Year-on-year
change
Qtr-to-qtr change
Year-on-year
change
Thousand Thousand Thousand Thousand Thousand Thousand Thousand Percent Percent
Current marital status of the employed 15 675 15 545 15 833 16 069 16 212 144 538 0,9 3,4
Married 6 185 6 111 6 141 6 262 6 326 65 142 1,0 2,3
Living together like husband and wife 1 922 1 972 2 032 2 028 1 995 -33 73 -1,6 3,8
Widow/widower 459 463 474 474 517 43 58 9,0 12,5
Divorced or separated 485 475 500 481 523 42 39 8,8 7,9
Never married 6 623 6 524 6 686 6 824 6 850 26 227 0,4 3,4
Current marital status of the unemployed 5 723 5 634 5 873 5 781 6 214 433 491 7,5 8,6
Married 945 878 938 943 1 044 101 99 10,7 10,5
Living together like husband and wife 642 682 690 655 680 25 38 3,8 5,9
Widow/widower 82 85 81 84 71 -13 -11 -15,6 -13,8
Divorced or separated 109 99 102 108 119 10 10 9,4 9,1
Never married 3 945 3 889 4 063 3 990 4 301 311 355 7,8 9,0
Current marital status of the not economically active 15 033 15 412 15 044 15 055 14 634 -421 -399 -2,8 -2,7
Married 2 815 2 846 2 808 2 814 2 621 -193 -194 -6,8 -6,9
Living together like husband and wife 791 854 784 778 767 -11 -24 -1,4 -3,0
Widow/widower 605 599 597 602 600 -2 -5 -0,4 -0,9
Divorced or separated 263 279 248 246 217 -29 -47 -11,8 -17,8
Never married 10 559 10 833 10 606 10 616 10 430 -186 -129 -1,8 -1,2
Due to rounding, numbers do not necessarily add up to totals.
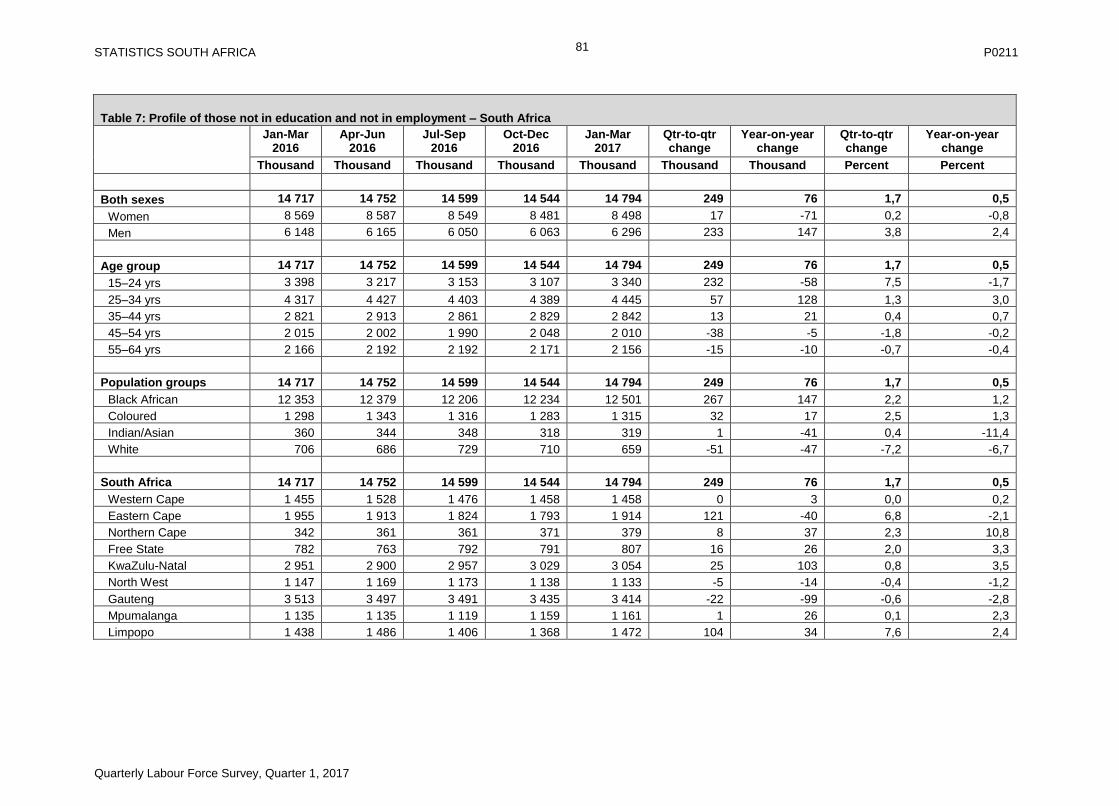
STATISTICS SOUTH AFRICA P0211
Quarterly Labour Force Survey, Quarter 1, 2017
81
Table 7: Profile of those not in education and not in employment – South Africa
Jan-Mar 2016
Apr-Jun 2016
Jul-Sep 2016
Oct-Dec 2016
Jan-Mar 2017
Qtr-to-qtr change
Year-on-year change
Qtr-to-qtr change
Year-on-year change
Thousand Thousand Thousand Thousand Thousand Thousand Thousand Percent Percent
Both sexes 14 717 14 752 14 599 14 544 14 794 249 76 1,7 0,5
Women 8 569 8 587 8 549 8 481 8 498 17 -71 0,2 -0,8
Men 6 148 6 165 6 050 6 063 6 296 233 147 3,8 2,4
Age group 14 717 14 752 14 599 14 544 14 794 249 76 1,7 0,5
15–24 yrs 3 398 3 217 3 153 3 107 3 340 232 -58 7,5 -1,7
25–34 yrs 4 317 4 427 4 403 4 389 4 445 57 128 1,3 3,0
35–44 yrs 2 821 2 913 2 861 2 829 2 842 13 21 0,4 0,7
45–54 yrs 2 015 2 002 1 990 2 048 2 010 -38 -5 -1,8 -0,2
55–64 yrs 2 166 2 192 2 192 2 171 2 156 -15 -10 -0,7 -0,4
Population groups 14 717 14 752 14 599 14 544 14 794 249 76 1,7 0,5
Black African 12 353 12 379 12 206 12 234 12 501 267 147 2,2 1,2
Coloured 1 298 1 343 1 316 1 283 1 315 32 17 2,5 1,3
Indian/Asian 360 344 348 318 319 1 -41 0,4 -11,4
White 706 686 729 710 659 -51 -47 -7,2 -6,7
South Africa 14 717 14 752 14 599 14 544 14 794 249 76 1,7 0,5
Western Cape 1 455 1 528 1 476 1 458 1 458 0 3 0,0 0,2
Eastern Cape 1 955 1 913 1 824 1 793 1 914 121 -40 6,8 -2,1
Northern Cape 342 361 361 371 379 8 37 2,3 10,8
Free State 782 763 792 791 807 16 26 2,0 3,3
KwaZulu-Natal 2 951 2 900 2 957 3 029 3 054 25 103 0,8 3,5
North West 1 147 1 169 1 173 1 138 1 133 -5 -14 -0,4 -1,2
Gauteng 3 513 3 497 3 491 3 435 3 414 -22 -99 -0,6 -2,8
Mpumalanga 1 135 1 135 1 119 1 159 1 161 1 26 0,1 2,3
Limpopo 1 438 1 486 1 406 1 368 1 472 104 34 7,6 2,4
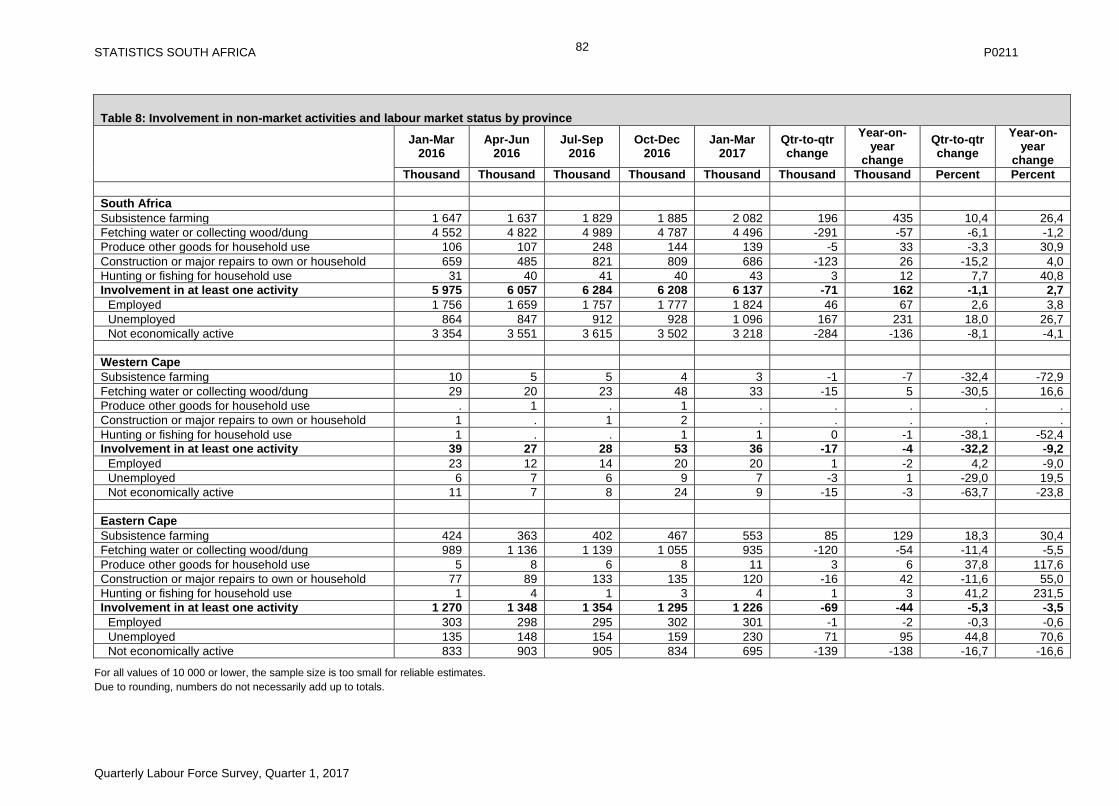
STATISTICS SOUTH AFRICA P0211
Quarterly Labour Force Survey, Quarter 1, 2017
82
Table 8: Involvement in non-market activities and labour market status by province
Jan-Mar 2016
Apr-Jun 2016
Jul-Sep 2016
Oct-Dec 2016
Jan-Mar 2017
Qtr-to-qtr change
Year-on-year
change
Qtr-to-qtr change
Year-on-year
change
Thousand Thousand Thousand Thousand Thousand Thousand Thousand Percent Percent
South Africa
Subsistence farming 1 647 1 637 1 829 1 885 2 082 196 435 10,4 26,4
Fetching water or collecting wood/dung 4 552 4 822 4 989 4 787 4 496 -291 -57 -6,1 -1,2
Produce other goods for household use 106 107 248 144 139 -5 33 -3,3 30,9
Construction or major repairs to own or household 659 485 821 809 686 -123 26 -15,2 4,0
Hunting or fishing for household use 31 40 41 40 43 3 12 7,7 40,8
Involvement in at least one activity 5 975 6 057 6 284 6 208 6 137 -71 162 -1,1 2,7
Employed 1 756 1 659 1 757 1 777 1 824 46 67 2,6 3,8
Unemployed 864 847 912 928 1 096 167 231 18,0 26,7
Not economically active 3 354 3 551 3 615 3 502 3 218 -284 -136 -8,1 -4,1
Western Cape
Subsistence farming 10 5 5 4 3 -1 -7 -32,4 -72,9
Fetching water or collecting wood/dung 29 20 23 48 33 -15 5 -30,5 16,6
Produce other goods for household use . 1 . 1 . . . . .
Construction or major repairs to own or household 1 . 1 2 . . . . .
Hunting or fishing for household use 1 . . 1 1 0 -1 -38,1 -52,4
Involvement in at least one activity 39 27 28 53 36 -17 -4 -32,2 -9,2
Employed 23 12 14 20 20 1 -2 4,2 -9,0
Unemployed 6 7 6 9 7 -3 1 -29,0 19,5
Not economically active 11 7 8 24 9 -15 -3 -63,7 -23,8
Eastern Cape
Subsistence farming 424 363 402 467 553 85 129 18,3 30,4
Fetching water or collecting wood/dung 989 1 136 1 139 1 055 935 -120 -54 -11,4 -5,5
Produce other goods for household use 5 8 6 8 11 3 6 37,8 117,6
Construction or major repairs to own or household 77 89 133 135 120 -16 42 -11,6 55,0
Hunting or fishing for household use 1 4 1 3 4 1 3 41,2 231,5
Involvement in at least one activity 1 270 1 348 1 354 1 295 1 226 -69 -44 -5,3 -3,5
Employed 303 298 295 302 301 -1 -2 -0,3 -0,6
Unemployed 135 148 154 159 230 71 95 44,8 70,6
Not economically active 833 903 905 834 695 -139 -138 -16,7 -16,6
For all values of 10 000 or lower, the sample size is too small for reliable estimates.
Due to rounding, numbers do not necessarily add up to totals.
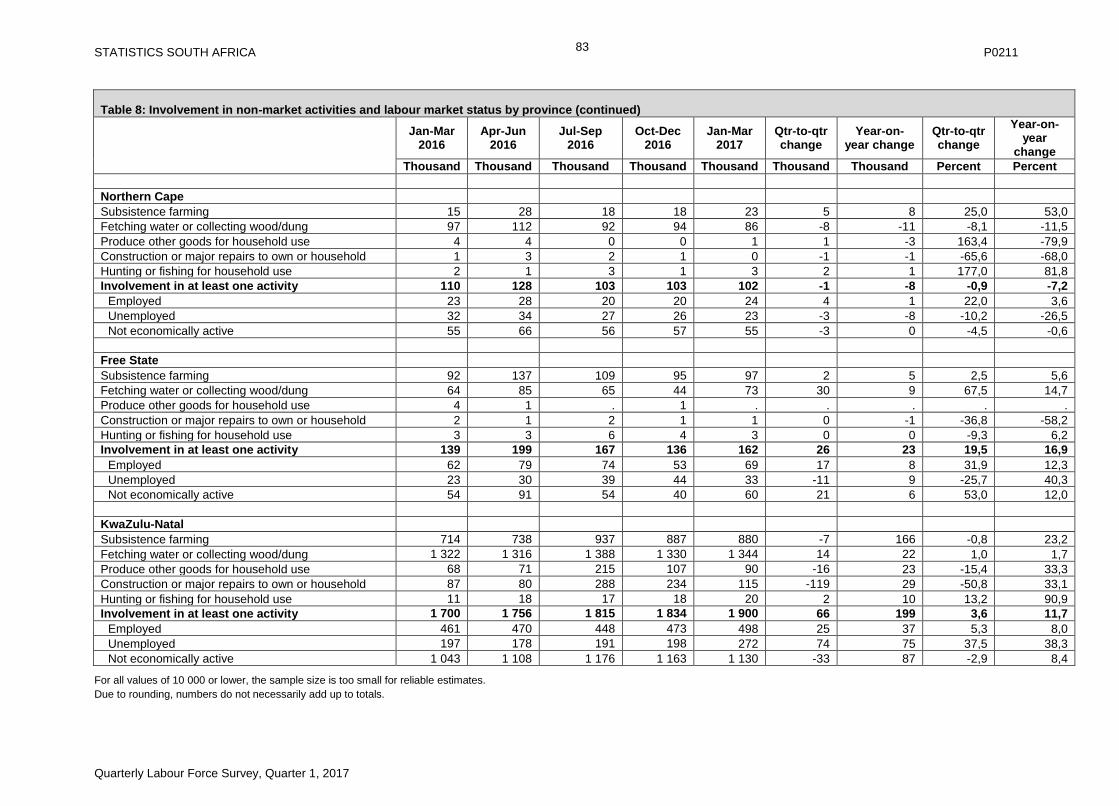
STATISTICS SOUTH AFRICA P0211
Quarterly Labour Force Survey, Quarter 1, 2017
83
Table 8: Involvement in non-market activities and labour market status by province (continued)
Jan-Mar 2016
Apr-Jun 2016
Jul-Sep 2016
Oct-Dec 2016
Jan-Mar 2017
Qtr-to-qtr change
Year-on-year change
Qtr-to-qtr change
Year-on-year
change
Thousand Thousand Thousand Thousand Thousand Thousand Thousand Percent Percent
Northern Cape
Subsistence farming 15 28 18 18 23 5 8 25,0 53,0
Fetching water or collecting wood/dung 97 112 92 94 86 -8 -11 -8,1 -11,5
Produce other goods for household use 4 4 0 0 1 1 -3 163,4 -79,9
Construction or major repairs to own or household 1 3 2 1 0 -1 -1 -65,6 -68,0
Hunting or fishing for household use 2 1 3 1 3 2 1 177,0 81,8
Involvement in at least one activity 110 128 103 103 102 -1 -8 -0,9 -7,2
Employed 23 28 20 20 24 4 1 22,0 3,6
Unemployed 32 34 27 26 23 -3 -8 -10,2 -26,5
Not economically active 55 66 56 57 55 -3 0 -4,5 -0,6
Free State
Subsistence farming 92 137 109 95 97 2 5 2,5 5,6
Fetching water or collecting wood/dung 64 85 65 44 73 30 9 67,5 14,7
Produce other goods for household use 4 1 . 1 . . . . .
Construction or major repairs to own or household 2 1 2 1 1 0 -1 -36,8 -58,2
Hunting or fishing for household use 3 3 6 4 3 0 0 -9,3 6,2
Involvement in at least one activity 139 199 167 136 162 26 23 19,5 16,9
Employed 62 79 74 53 69 17 8 31,9 12,3
Unemployed 23 30 39 44 33 -11 9 -25,7 40,3
Not economically active 54 91 54 40 60 21 6 53,0 12,0
KwaZulu-Natal
Subsistence farming 714 738 937 887 880 -7 166 -0,8 23,2
Fetching water or collecting wood/dung 1 322 1 316 1 388 1 330 1 344 14 22 1,0 1,7
Produce other goods for household use 68 71 215 107 90 -16 23 -15,4 33,3
Construction or major repairs to own or household 87 80 288 234 115 -119 29 -50,8 33,1
Hunting or fishing for household use 11 18 17 18 20 2 10 13,2 90,9
Involvement in at least one activity 1 700 1 756 1 815 1 834 1 900 66 199 3,6 11,7
Employed 461 470 448 473 498 25 37 5,3 8,0
Unemployed 197 178 191 198 272 74 75 37,5 38,3
Not economically active 1 043 1 108 1 176 1 163 1 130 -33 87 -2,9 8,4
For all values of 10 000 or lower, the sample size is too small for reliable estimates.
Due to rounding, numbers do not necessarily add up to totals.
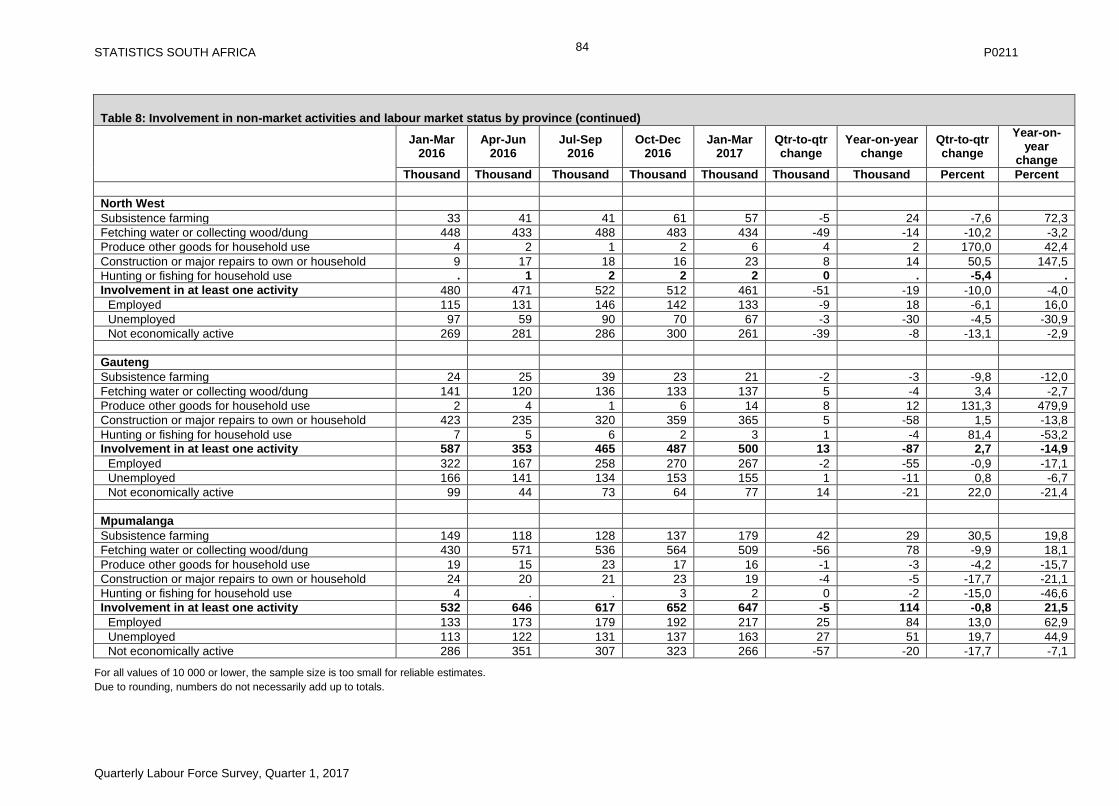
STATISTICS SOUTH AFRICA P0211
Quarterly Labour Force Survey, Quarter 1, 2017
84
Table 8: Involvement in non-market activities and labour market status by province (continued)
Jan-Mar 2016
Apr-Jun 2016
Jul-Sep 2016
Oct-Dec 2016
Jan-Mar 2017
Qtr-to-qtr change
Year-on-year change
Qtr-to-qtr change
Year-on-year
change
Thousand Thousand Thousand Thousand Thousand Thousand Thousand Percent Percent
North West
Subsistence farming 33 41 41 61 57 -5 24 -7,6 72,3
Fetching water or collecting wood/dung 448 433 488 483 434 -49 -14 -10,2 -3,2
Produce other goods for household use 4 2 1 2 6 4 2 170,0 42,4
Construction or major repairs to own or household 9 17 18 16 23 8 14 50,5 147,5
Hunting or fishing for household use . 1 2 2 2 0 . -5,4 .
Involvement in at least one activity 480 471 522 512 461 -51 -19 -10,0 -4,0
Employed 115 131 146 142 133 -9 18 -6,1 16,0
Unemployed 97 59 90 70 67 -3 -30 -4,5 -30,9
Not economically active 269 281 286 300 261 -39 -8 -13,1 -2,9
Gauteng
Subsistence farming 24 25 39 23 21 -2 -3 -9,8 -12,0
Fetching water or collecting wood/dung 141 120 136 133 137 5 -4 3,4 -2,7
Produce other goods for household use 2 4 1 6 14 8 12 131,3 479,9
Construction or major repairs to own or household 423 235 320 359 365 5 -58 1,5 -13,8
Hunting or fishing for household use 7 5 6 2 3 1 -4 81,4 -53,2
Involvement in at least one activity 587 353 465 487 500 13 -87 2,7 -14,9
Employed 322 167 258 270 267 -2 -55 -0,9 -17,1
Unemployed 166 141 134 153 155 1 -11 0,8 -6,7
Not economically active 99 44 73 64 77 14 -21 22,0 -21,4
Mpumalanga
Subsistence farming 149 118 128 137 179 42 29 30,5 19,8
Fetching water or collecting wood/dung 430 571 536 564 509 -56 78 -9,9 18,1
Produce other goods for household use 19 15 23 17 16 -1 -3 -4,2 -15,7
Construction or major repairs to own or household 24 20 21 23 19 -4 -5 -17,7 -21,1
Hunting or fishing for household use 4 . . 3 2 0 -2 -15,0 -46,6
Involvement in at least one activity 532 646 617 652 647 -5 114 -0,8 21,5
Employed 133 173 179 192 217 25 84 13,0 62,9
Unemployed 113 122 131 137 163 27 51 19,7 44,9
Not economically active 286 351 307 323 266 -57 -20 -17,7 -7,1
For all values of 10 000 or lower, the sample size is too small for reliable estimates.
Due to rounding, numbers do not necessarily add up to totals.
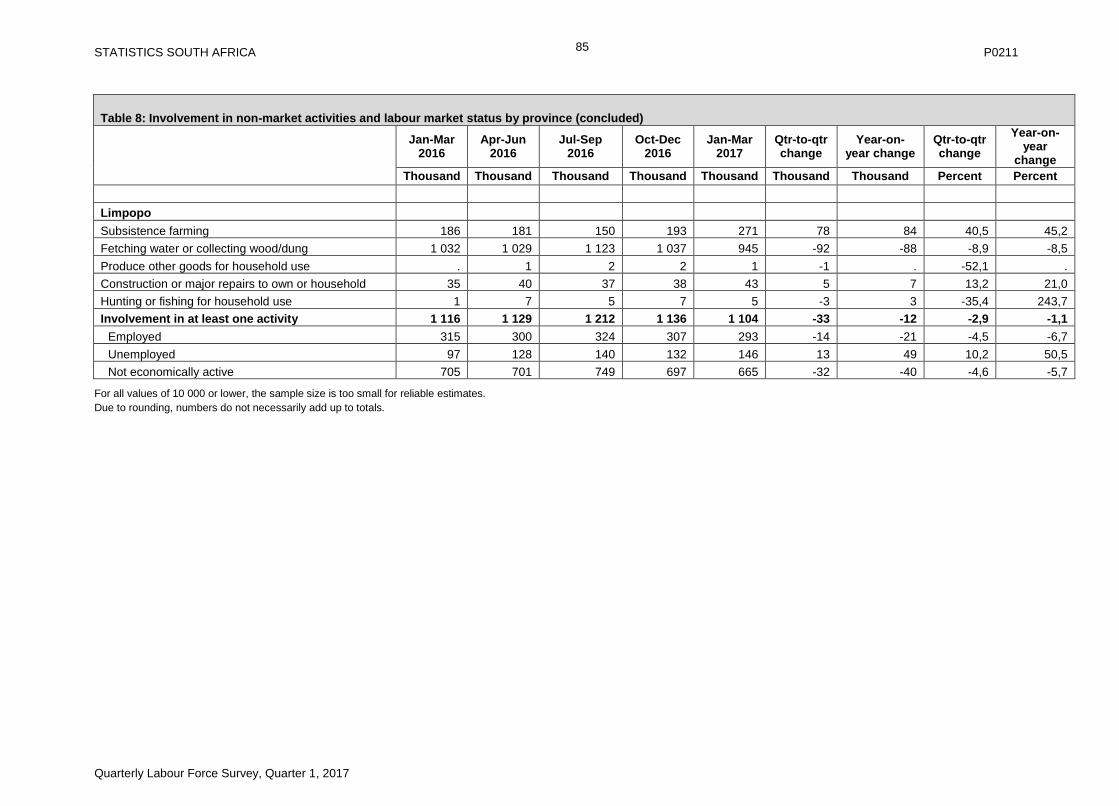
STATISTICS SOUTH AFRICA P0211
Quarterly Labour Force Survey, Quarter 1, 2017
85
Table 8: Involvement in non-market activities and labour market status by province (concluded)
Jan-Mar 2016
Apr-Jun 2016
Jul-Sep 2016
Oct-Dec 2016
Jan-Mar 2017
Qtr-to-qtr change
Year-on-year change
Qtr-to-qtr change
Year-on-year
change
Thousand Thousand Thousand Thousand Thousand Thousand Thousand Percent Percent
Limpopo
Subsistence farming 186 181 150 193 271 78 84 40,5 45,2
Fetching water or collecting wood/dung 1 032 1 029 1 123 1 037 945 -92 -88 -8,9 -8,5
Produce other goods for household use . 1 2 2 1 -1 . -52,1 .
Construction or major repairs to own or household 35 40 37 38 43 5 7 13,2 21,0
Hunting or fishing for household use 1 7 5 7 5 -3 3 -35,4 243,7
Involvement in at least one activity 1 116 1 129 1 212 1 136 1 104 -33 -12 -2,9 -1,1
Employed 315 300 324 307 293 -14 -21 -4,5 -6,7
Unemployed 97 128 140 132 146 13 49 10,2 50,5
Not economically active 705 701 749 697 665 -32 -40 -4,6 -5,7
For all values of 10 000 or lower, the sample size is too small for reliable estimates.
Due to rounding, numbers do not necessarily add up to totals.
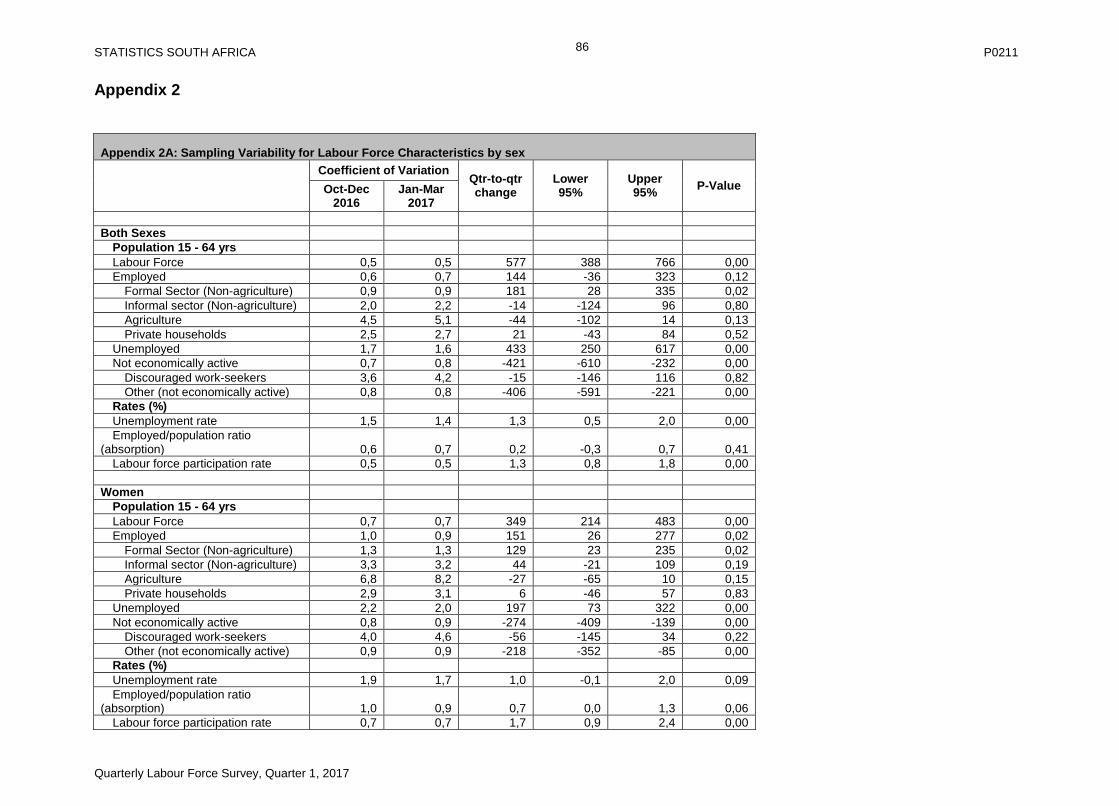
STATISTICS SOUTH AFRICA P0211
Quarterly Labour Force Survey, Quarter 1, 2017
86
Appendix 2
Appendix 2A: Sampling Variability for Labour Force Characteristics by sex
Coefficient of Variation Qtr-to-qtr change
Lower 95%
Upper 95%
P-Value Oct-Dec 2016
Jan-Mar 2017
Both Sexes
Population 15 - 64 yrs
Labour Force 0,5 0,5 577 388 766 0,00
Employed 0,6 0,7 144 -36 323 0,12
Formal Sector (Non-agriculture) 0,9 0,9 181 28 335 0,02
Informal sector (Non-agriculture) 2,0 2,2 -14 -124 96 0,80
Agriculture 4,5 5,1 -44 -102 14 0,13
Private households 2,5 2,7 21 -43 84 0,52
Unemployed 1,7 1,6 433 250 617 0,00
Not economically active 0,7 0,8 -421 -610 -232 0,00
Discouraged work-seekers 3,6 4,2 -15 -146 116 0,82
Other (not economically active) 0,8 0,8 -406 -591 -221 0,00
Rates (%)
Unemployment rate 1,5 1,4 1,3 0,5 2,0 0,00
Employed/population ratio (absorption) 0,6 0,7 0,2 -0,3 0,7 0,41
Labour force participation rate 0,5 0,5 1,3 0,8 1,8 0,00
Women
Population 15 - 64 yrs
Labour Force 0,7 0,7 349 214 483 0,00
Employed 1,0 0,9 151 26 277 0,02
Formal Sector (Non-agriculture) 1,3 1,3 129 23 235 0,02
Informal sector (Non-agriculture) 3,3 3,2 44 -21 109 0,19
Agriculture 6,8 8,2 -27 -65 10 0,15
Private households 2,9 3,1 6 -46 57 0,83
Unemployed 2,2 2,0 197 73 322 0,00
Not economically active 0,8 0,9 -274 -409 -139 0,00
Discouraged work-seekers 4,0 4,6 -56 -145 34 0,22
Other (not economically active) 0,9 0,9 -218 -352 -85 0,00
Rates (%)
Unemployment rate 1,9 1,7 1,0 -0,1 2,0 0,09
Employed/population ratio (absorption) 1,0 0,9 0,7 0,0 1,3 0,06
Labour force participation rate 0,7 0,7 1,7 0,9 2,4 0,00
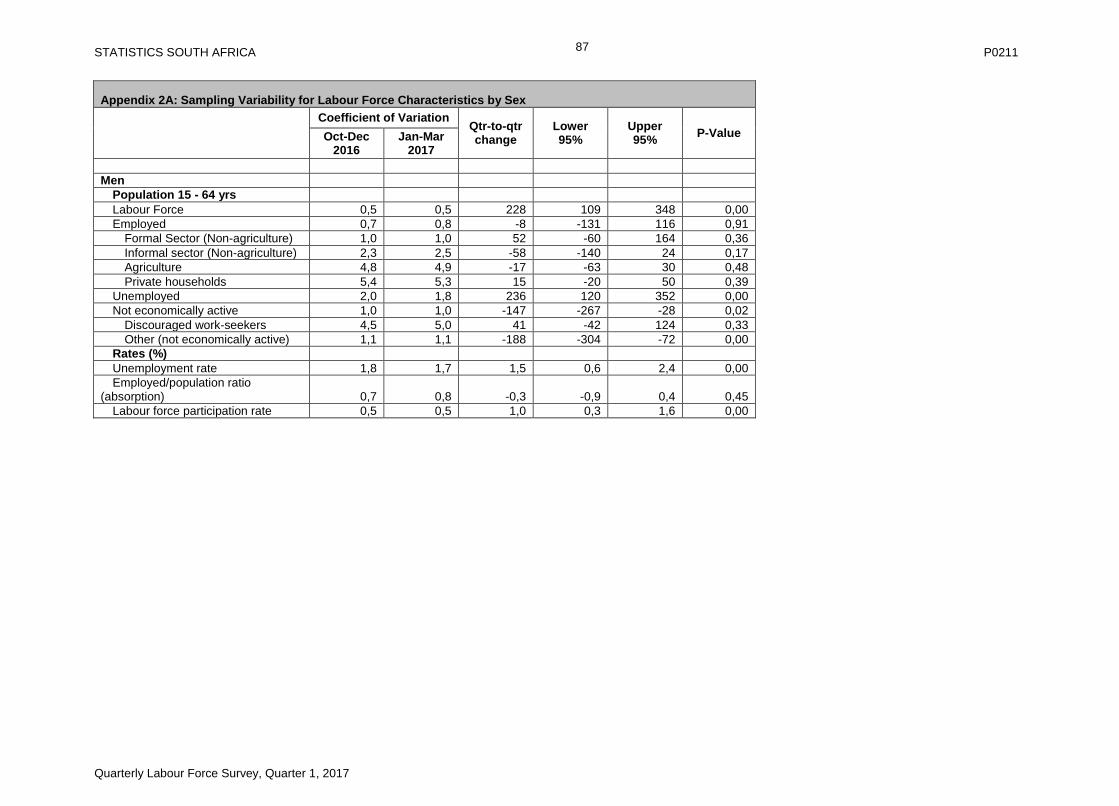
STATISTICS SOUTH AFRICA P0211
Quarterly Labour Force Survey, Quarter 1, 2017
87
Appendix 2A: Sampling Variability for Labour Force Characteristics by Sex
Coefficient of Variation Qtr-to-qtr change
Lower 95%
Upper 95%
P-Value Oct-Dec 2016
Jan-Mar 2017
Men
Population 15 - 64 yrs
Labour Force 0,5 0,5 228 109 348 0,00
Employed 0,7 0,8 -8 -131 116 0,91
Formal Sector (Non-agriculture) 1,0 1,0 52 -60 164 0,36
Informal sector (Non-agriculture) 2,3 2,5 -58 -140 24 0,17
Agriculture 4,8 4,9 -17 -63 30 0,48
Private households 5,4 5,3 15 -20 50 0,39
Unemployed 2,0 1,8 236 120 352 0,00
Not economically active 1,0 1,0 -147 -267 -28 0,02
Discouraged work-seekers 4,5 5,0 41 -42 124 0,33
Other (not economically active) 1,1 1,1 -188 -304 -72 0,00
Rates (%)
Unemployment rate 1,8 1,7 1,5 0,6 2,4 0,00
Employed/population ratio (absorption) 0,7 0,8 -0,3 -0,9 0,4 0,45
Labour force participation rate 0,5 0,5 1,0 0,3 1,6 0,00
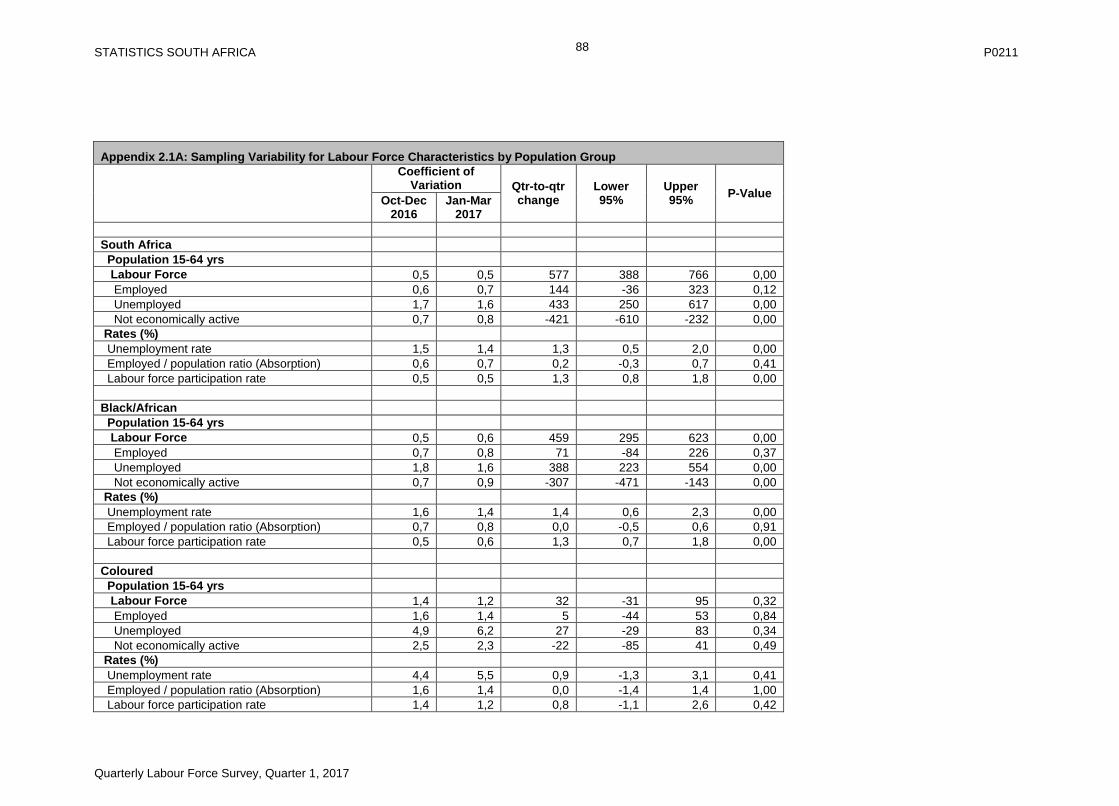
STATISTICS SOUTH AFRICA P0211
Quarterly Labour Force Survey, Quarter 1, 2017
88
Appendix 2.1A: Sampling Variability for Labour Force Characteristics by Population Group
Coefficient of Variation Qtr-to-qtr
change Lower 95%
Upper 95%
P-Value Oct-Dec
2016 Jan-Mar
2017
South Africa
Population 15-64 yrs
Labour Force 0,5 0,5 577 388 766 0,00
Employed 0,6 0,7 144 -36 323 0,12
Unemployed 1,7 1,6 433 250 617 0,00
Not economically active 0,7 0,8 -421 -610 -232 0,00
Rates (%)
Unemployment rate 1,5 1,4 1,3 0,5 2,0 0,00
Employed / population ratio (Absorption) 0,6 0,7 0,2 -0,3 0,7 0,41
Labour force participation rate 0,5 0,5 1,3 0,8 1,8 0,00
Black/African
Population 15-64 yrs
Labour Force 0,5 0,6 459 295 623 0,00
Employed 0,7 0,8 71 -84 226 0,37
Unemployed 1,8 1,6 388 223 554 0,00
Not economically active 0,7 0,9 -307 -471 -143 0,00
Rates (%)
Unemployment rate 1,6 1,4 1,4 0,6 2,3 0,00
Employed / population ratio (Absorption) 0,7 0,8 0,0 -0,5 0,6 0,91
Labour force participation rate 0,5 0,6 1,3 0,7 1,8 0,00
Coloured
Population 15-64 yrs
Labour Force 1,4 1,2 32 -31 95 0,32
Employed 1,6 1,4 5 -44 53 0,84
Unemployed 4,9 6,2 27 -29 83 0,34
Not economically active 2,5 2,3 -22 -85 41 0,49
Rates (%)
Unemployment rate 4,4 5,5 0,9 -1,3 3,1 0,41
Employed / population ratio (Absorption) 1,6 1,4 0,0 -1,4 1,4 1,00
Labour force participation rate 1,4 1,2 0,8 -1,1 2,6 0,42
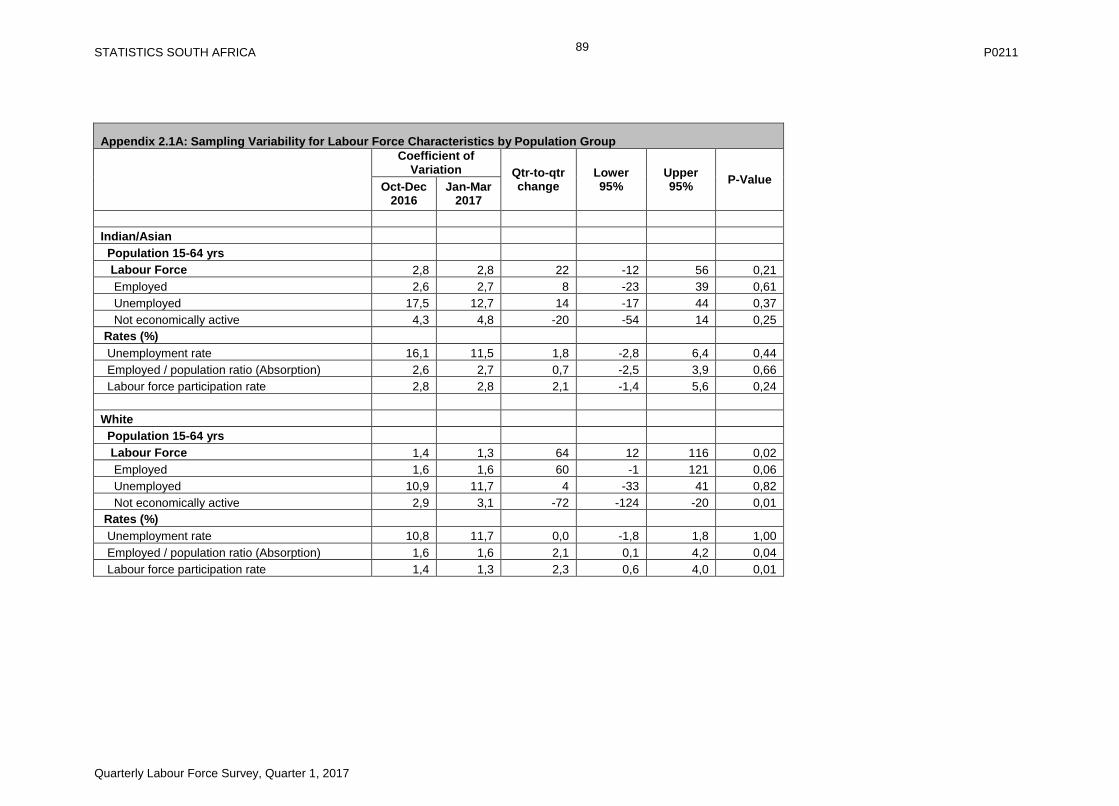
STATISTICS SOUTH AFRICA P0211
Quarterly Labour Force Survey, Quarter 1, 2017
89
Appendix 2.1A: Sampling Variability for Labour Force Characteristics by Population Group
Coefficient of Variation Qtr-to-qtr
change Lower 95%
Upper 95%
P-Value Oct-Dec
2016 Jan-Mar
2017
Indian/Asian
Population 15-64 yrs
Labour Force 2,8 2,8 22 -12 56 0,21
Employed 2,6 2,7 8 -23 39 0,61
Unemployed 17,5 12,7 14 -17 44 0,37
Not economically active 4,3 4,8 -20 -54 14 0,25
Rates (%)
Unemployment rate 16,1 11,5 1,8 -2,8 6,4 0,44
Employed / population ratio (Absorption) 2,6 2,7 0,7 -2,5 3,9 0,66
Labour force participation rate 2,8 2,8 2,1 -1,4 5,6 0,24
White
Population 15-64 yrs
Labour Force 1,4 1,3 64 12 116 0,02
Employed 1,6 1,6 60 -1 121 0,06
Unemployed 10,9 11,7 4 -33 41 0,82
Not economically active 2,9 3,1 -72 -124 -20 0,01
Rates (%)
Unemployment rate 10,8 11,7 0,0 -1,8 1,8 1,00
Employed / population ratio (Absorption) 1,6 1,6 2,1 0,1 4,2 0,04
Labour force participation rate 1,4 1,3 2,3 0,6 4,0 0,01
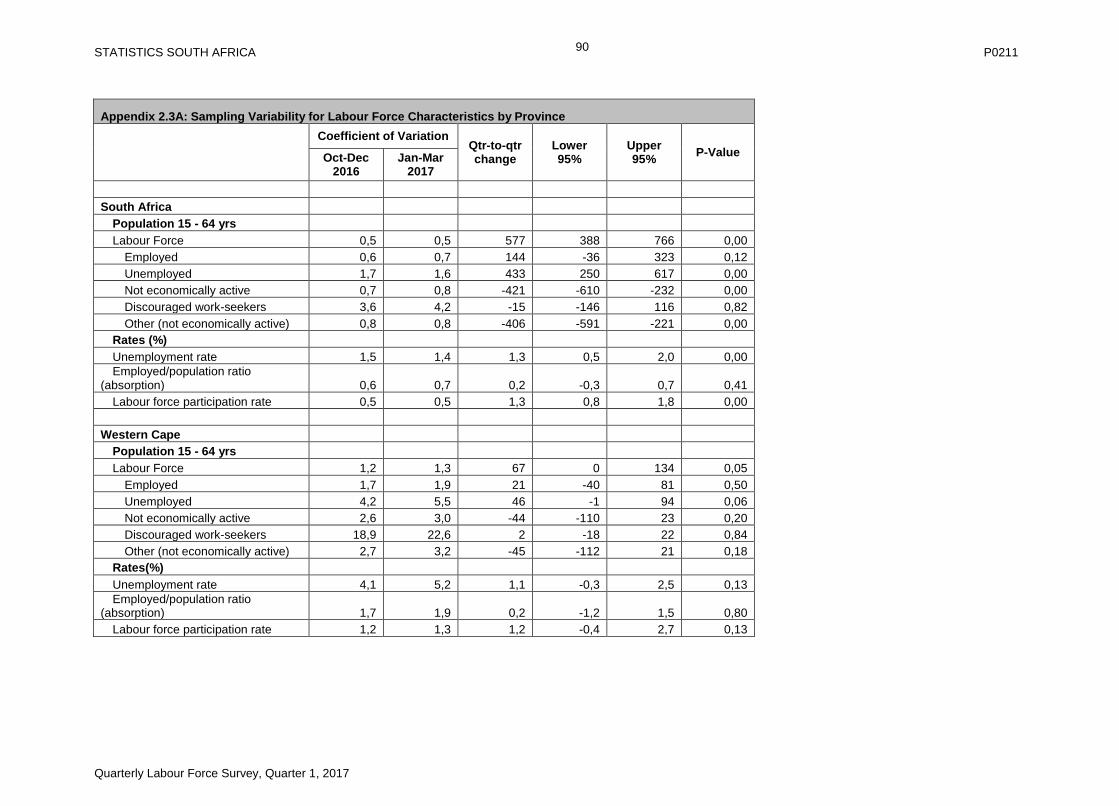
STATISTICS SOUTH AFRICA P0211
Quarterly Labour Force Survey, Quarter 1, 2017
90
Appendix 2.3A: Sampling Variability for Labour Force Characteristics by Province
Coefficient of Variation Qtr-to-qtr change
Lower 95%
Upper 95%
P-Value Oct-Dec 2016
Jan-Mar 2017
South Africa
Population 15 - 64 yrs
Labour Force 0,5 0,5 577 388 766 0,00
Employed 0,6 0,7 144 -36 323 0,12
Unemployed 1,7 1,6 433 250 617 0,00
Not economically active 0,7 0,8 -421 -610 -232 0,00
Discouraged work-seekers 3,6 4,2 -15 -146 116 0,82
Other (not economically active) 0,8 0,8 -406 -591 -221 0,00
Rates (%)
Unemployment rate 1,5 1,4 1,3 0,5 2,0 0,00
Employed/population ratio (absorption) 0,6 0,7 0,2 -0,3 0,7 0,41
Labour force participation rate 0,5 0,5 1,3 0,8 1,8 0,00
Western Cape
Population 15 - 64 yrs
Labour Force 1,2 1,3 67 0 134 0,05
Employed 1,7 1,9 21 -40 81 0,50
Unemployed 4,2 5,5 46 -1 94 0,06
Not economically active 2,6 3,0 -44 -110 23 0,20
Discouraged work-seekers 18,9 22,6 2 -18 22 0,84
Other (not economically active) 2,7 3,2 -45 -112 21 0,18
Rates(%)
Unemployment rate 4,1 5,2 1,1 -0,3 2,5 0,13
Employed/population ratio (absorption) 1,7 1,9 0,2 -1,2 1,5 0,80
Labour force participation rate 1,2 1,3 1,2 -0,4 2,7 0,13
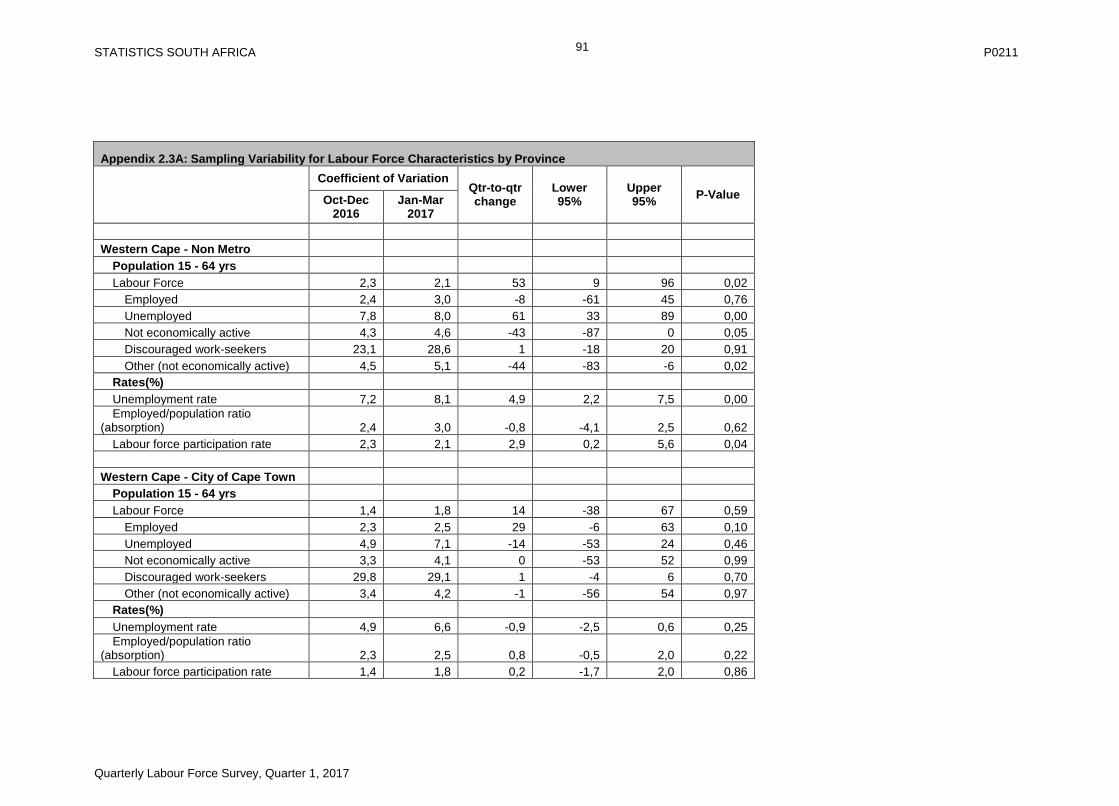
STATISTICS SOUTH AFRICA P0211
Quarterly Labour Force Survey, Quarter 1, 2017
91
Appendix 2.3A: Sampling Variability for Labour Force Characteristics by Province
Coefficient of Variation Qtr-to-qtr change
Lower 95%
Upper 95%
P-Value Oct-Dec 2016
Jan-Mar 2017
Western Cape - Non Metro
Population 15 - 64 yrs
Labour Force 2,3 2,1 53 9 96 0,02
Employed 2,4 3,0 -8 -61 45 0,76
Unemployed 7,8 8,0 61 33 89 0,00
Not economically active 4,3 4,6 -43 -87 0 0,05
Discouraged work-seekers 23,1 28,6 1 -18 20 0,91
Other (not economically active) 4,5 5,1 -44 -83 -6 0,02
Rates(%)
Unemployment rate 7,2 8,1 4,9 2,2 7,5 0,00
Employed/population ratio (absorption) 2,4 3,0 -0,8 -4,1 2,5 0,62
Labour force participation rate 2,3 2,1 2,9 0,2 5,6 0,04
Western Cape - City of Cape Town
Population 15 - 64 yrs
Labour Force 1,4 1,8 14 -38 67 0,59
Employed 2,3 2,5 29 -6 63 0,10
Unemployed 4,9 7,1 -14 -53 24 0,46
Not economically active 3,3 4,1 0 -53 52 0,99
Discouraged work-seekers 29,8 29,1 1 -4 6 0,70
Other (not economically active) 3,4 4,2 -1 -56 54 0,97
Rates(%)
Unemployment rate 4,9 6,6 -0,9 -2,5 0,6 0,25
Employed/population ratio (absorption) 2,3 2,5 0,8 -0,5 2,0 0,22
Labour force participation rate 1,4 1,8 0,2 -1,7 2,0 0,86

STATISTICS SOUTH AFRICA P0211
Quarterly Labour Force Survey, Quarter 1, 2017
92
Appendix 2.3A: Sampling Variability for Labour Force Characteristics by Province
Coefficient of Variation Qtr-to-qtr change
Lower 95%
Upper 95%
P-Value Oct-Dec 2016
Jan-Mar 2017
Eastern Cape
Population 15 - 64 yrs
Labour Force 1,9 1,6 104 30 179 0,01
Employed 1,8 1,9 -5 -52 41 0,82
Unemployed 6,0 3,9 110 39 181 0,00
Not economically active 1,8 1,6 -92 -166 -18 0,02
Discouraged work-seekers 6,2 8,3 -33 -88 23 0,25
Other (not economically active) 2,3 2,2 -59 -142 23 0,16
Rates (%)
Unemployment rate 4,8 3,2 3,8 1,1 6,5 0,01
Employed/population ratio (absorption) 1,8 1,9 -0,2 -1,4 0,9 0,68
Labour force participation rate 1,9 1,6 2,4 0,6 4,1 0,01
Eastern Cape - Non Metro
Population 15 - 64 yrs
Labour Force 3,2 2,2 104 39 169 0,00
Employed 2,6 2,3 -17 -55 22 0,40
Unemployed 10,2 4,6 121 58 184 0,00
Not economically active 2,1 1,7 -96 -161 -31 0,00
Discouraged work-seekers 6,3 8,4 -30 -85 25 0,28
Other (not economically active) 2,8 2,5 -65 -142 11 0,09
Rates (%)
Unemployment rate 7,9 3,3 7,5 3,3 11,7 0,00
Employed/population ratio (absorption) 2,6 2,3 -0,7 -2,0 0,7 0,33
Labour force participation rate 3,2 2,2 3,5 1,2 5,8 0,00
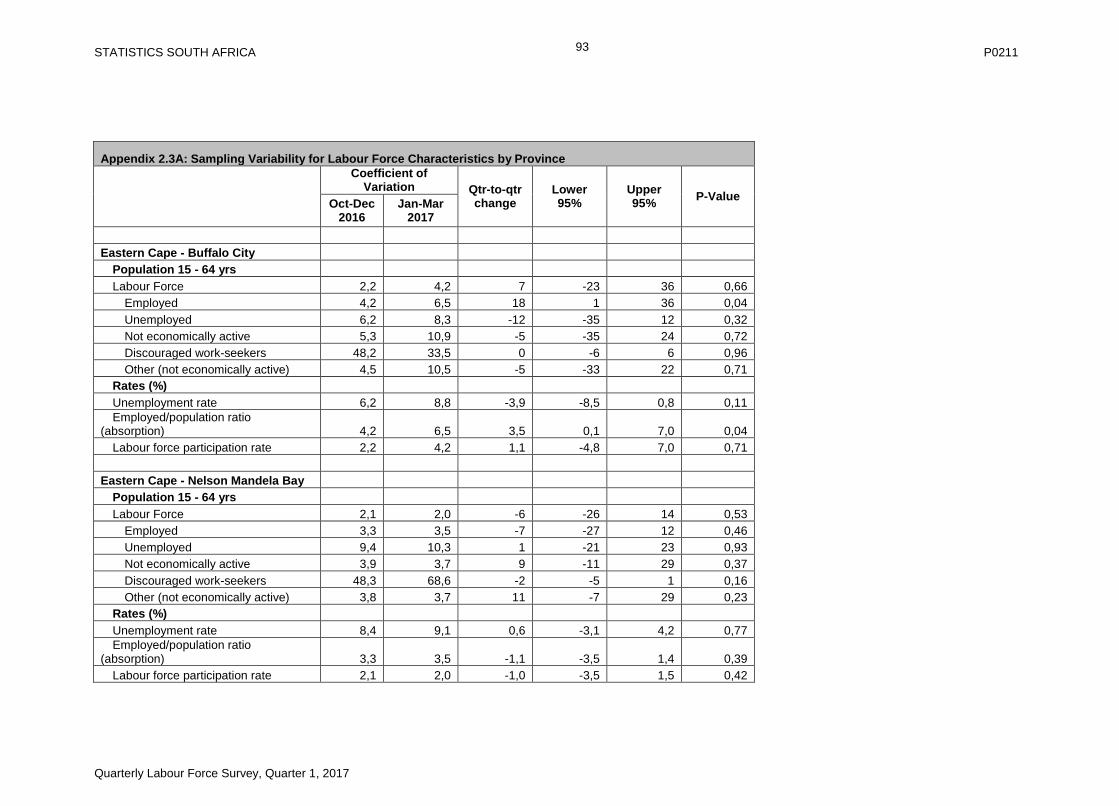
STATISTICS SOUTH AFRICA P0211
Quarterly Labour Force Survey, Quarter 1, 2017
93
Appendix 2.3A: Sampling Variability for Labour Force Characteristics by Province
Coefficient of Variation Qtr-to-qtr
change Lower 95%
Upper 95%
P-Value Oct-Dec
2016 Jan-Mar
2017
Eastern Cape - Buffalo City
Population 15 - 64 yrs
Labour Force 2,2 4,2 7 -23 36 0,66
Employed 4,2 6,5 18 1 36 0,04
Unemployed 6,2 8,3 -12 -35 12 0,32
Not economically active 5,3 10,9 -5 -35 24 0,72
Discouraged work-seekers 48,2 33,5 0 -6 6 0,96
Other (not economically active) 4,5 10,5 -5 -33 22 0,71
Rates (%)
Unemployment rate 6,2 8,8 -3,9 -8,5 0,8 0,11
Employed/population ratio (absorption) 4,2 6,5 3,5 0,1 7,0 0,04
Labour force participation rate 2,2 4,2 1,1 -4,8 7,0 0,71
Eastern Cape - Nelson Mandela Bay
Population 15 - 64 yrs
Labour Force 2,1 2,0 -6 -26 14 0,53
Employed 3,3 3,5 -7 -27 12 0,46
Unemployed 9,4 10,3 1 -21 23 0,93
Not economically active 3,9 3,7 9 -11 29 0,37
Discouraged work-seekers 48,3 68,6 -2 -5 1 0,16
Other (not economically active) 3,8 3,7 11 -7 29 0,23
Rates (%)
Unemployment rate 8,4 9,1 0,6 -3,1 4,2 0,77
Employed/population ratio (absorption) 3,3 3,5 -1,1 -3,5 1,4 0,39
Labour force participation rate 2,1 2,0 -1,0 -3,5 1,5 0,42
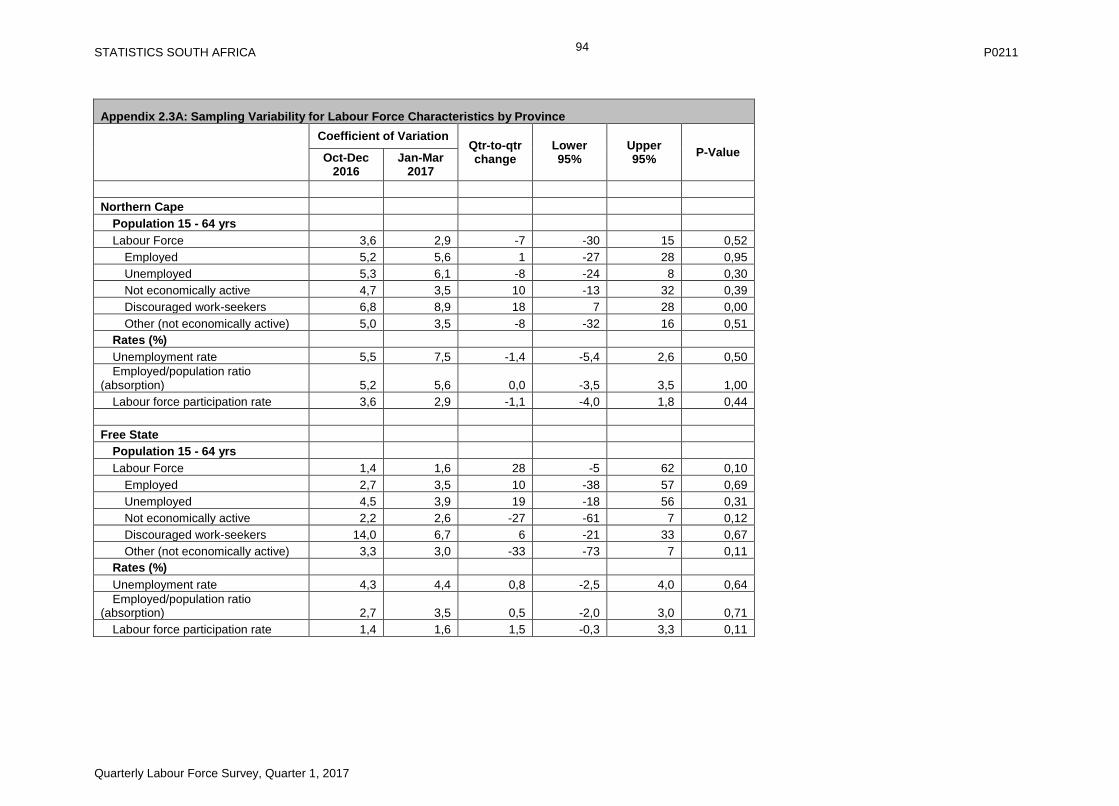
STATISTICS SOUTH AFRICA P0211
Quarterly Labour Force Survey, Quarter 1, 2017
94
Appendix 2.3A: Sampling Variability for Labour Force Characteristics by Province
Coefficient of Variation Qtr-to-qtr change
Lower 95%
Upper 95%
P-Value Oct-Dec 2016
Jan-Mar 2017
Northern Cape
Population 15 - 64 yrs
Labour Force 3,6 2,9 -7 -30 15 0,52
Employed 5,2 5,6 1 -27 28 0,95
Unemployed 5,3 6,1 -8 -24 8 0,30
Not economically active 4,7 3,5 10 -13 32 0,39
Discouraged work-seekers 6,8 8,9 18 7 28 0,00
Other (not economically active) 5,0 3,5 -8 -32 16 0,51
Rates (%)
Unemployment rate 5,5 7,5 -1,4 -5,4 2,6 0,50
Employed/population ratio (absorption) 5,2 5,6 0,0 -3,5 3,5 1,00
Labour force participation rate 3,6 2,9 -1,1 -4,0 1,8 0,44
Free State
Population 15 - 64 yrs
Labour Force 1,4 1,6 28 -5 62 0,10
Employed 2,7 3,5 10 -38 57 0,69
Unemployed 4,5 3,9 19 -18 56 0,31
Not economically active 2,2 2,6 -27 -61 7 0,12
Discouraged work-seekers 14,0 6,7 6 -21 33 0,67
Other (not economically active) 3,3 3,0 -33 -73 7 0,11
Rates (%)
Unemployment rate 4,3 4,4 0,8 -2,5 4,0 0,64
Employed/population ratio (absorption) 2,7 3,5 0,5 -2,0 3,0 0,71
Labour force participation rate 1,4 1,6 1,5 -0,3 3,3 0,11
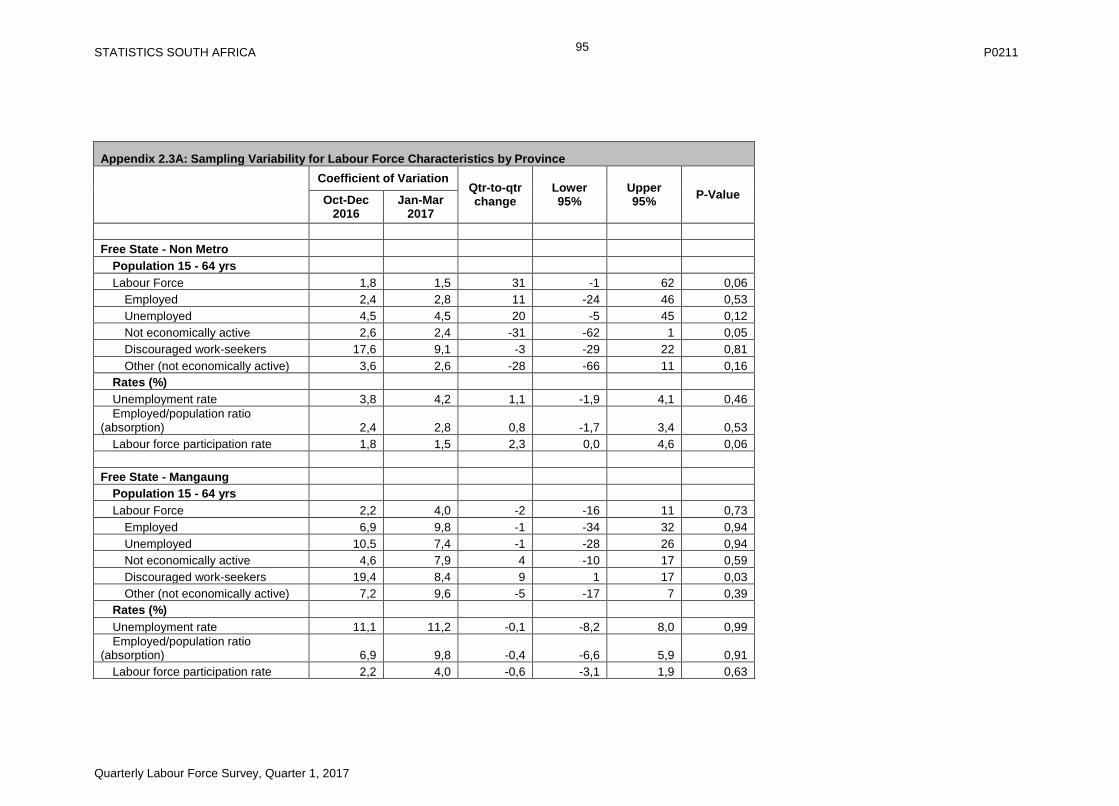
STATISTICS SOUTH AFRICA P0211
Quarterly Labour Force Survey, Quarter 1, 2017
95
Appendix 2.3A: Sampling Variability for Labour Force Characteristics by Province
Coefficient of Variation Qtr-to-qtr change
Lower 95%
Upper 95%
P-Value Oct-Dec 2016
Jan-Mar 2017
Free State - Non Metro
Population 15 - 64 yrs
Labour Force 1,8 1,5 31 -1 62 0,06
Employed 2,4 2,8 11 -24 46 0,53
Unemployed 4,5 4,5 20 -5 45 0,12
Not economically active 2,6 2,4 -31 -62 1 0,05
Discouraged work-seekers 17,6 9,1 -3 -29 22 0,81
Other (not economically active) 3,6 2,6 -28 -66 11 0,16
Rates (%)
Unemployment rate 3,8 4,2 1,1 -1,9 4,1 0,46
Employed/population ratio (absorption) 2,4 2,8 0,8 -1,7 3,4 0,53
Labour force participation rate 1,8 1,5 2,3 0,0 4,6 0,06
Free State - Mangaung
Population 15 - 64 yrs
Labour Force 2,2 4,0 -2 -16 11 0,73
Employed 6,9 9,8 -1 -34 32 0,94
Unemployed 10,5 7,4 -1 -28 26 0,94
Not economically active 4,6 7,9 4 -10 17 0,59
Discouraged work-seekers 19,4 8,4 9 1 17 0,03
Other (not economically active) 7,2 9,6 -5 -17 7 0,39
Rates (%)
Unemployment rate 11,1 11,2 -0,1 -8,2 8,0 0,99
Employed/population ratio (absorption) 6,9 9,8 -0,4 -6,6 5,9 0,91
Labour force participation rate 2,2 4,0 -0,6 -3,1 1,9 0,63

STATISTICS SOUTH AFRICA P0211
Quarterly Labour Force Survey, Quarter 1, 2017
96
Appendix 2.3A: Sampling Variability for Labour Force Characteristics by Province
Coefficient of Variation Qtr-to-qtr change
Lower 95%
Upper 95%
P-Value Oct-Dec 2016
Jan-Mar 2017
KwaZulu Natal
Population 15 - 64 yrs
Labour Force 1,7 1,9 104 10 197 0,03
Employed 1,6 2,0 14 -73 100 0,76
Unemployed 5,3 4,4 90 19 161 0,01
Not economically active 1,6 1,9 -77 -170 16 0,10
Discouraged work-seekers 8,6 10,8 -53 -132 26 0,19
Other (not economically active) 2,8 2,3 -24 -126 77 0,64
Rates (%)
Unemployment rate 4,2 3,5 1,9 0,0 3,8 0,05
Employed/population ratio (absorption) 1,6 2,0 0,1 -1,2 1,3 0,93
Labour force participation rate 1,7 1,9 1,3 0,0 2,7 0,06
KwaZulu Natal - Non Metro
Population 15 - 64 yrs
Labour Force 2,7 3,1 82 3 161 0,04
Employed 2,4 3,4 -6 -84 72 0,87
Unemployed 7,8 6,2 88 26 151 0,01
Not economically active 1,9 2,4 -62 -141 17 0,13
Discouraged work-seekers 9,6 12,9 -80 -158 -2 0,04
Other (not economically active) 3,5 2,9 18 -71 108 0,68
Rates (%)
Unemployment rate 6,1 4,9 3,5 0,4 6,6 0,03
Employed/population ratio (absorption) 2,4 3,4 -0,3 -2,0 1,5 0,75
Labour force participation rate 2,7 3,1 1,6 -0,1 3,4 0,07

STATISTICS SOUTH AFRICA P0211
Quarterly Labour Force Survey, Quarter 1, 2017
97
Appendix 2.3A: Sampling Variability for Labour Force Characteristics by Province
Coefficient of Variation Qtr-to-qtr change
Lower 95%
Upper 95%
P-Value Oct-Dec 2016
Jan-Mar 2017
KwaZulu Natal - eThekwini
Population 15 - 64 yrs
Labour Force 2,0 1,7 22 -27 71 0,39
Employed 1,9 1,7 20 -17 57 0,29
Unemployed 6,7 5,7 2 -31 35 0,92
Not economically active 3,3 2,9 -15 -64 34 0,54
Discouraged work-seekers 12,7 10,1 28 13 42 0,00
Other (not economically active) 4,1 3,1 -43 -92 6 0,09
Rates (%)
Unemployment rate 5,6 4,8 -0,2 -2,0 1,6 0,82
Employed/population ratio (absorption) 1,9 1,7 0,7 -0,9 2,3 0,37
Labour force participation rate 2,0 1,7 0,7 -1,3 2,8 0,48
North West
Population 15 - 64 yrs
Labour Force 2,2 2,5 24 -23 72 0,31
Employed 2,9 3,0 17 -26 60 0,45
Unemployed 7,3 5,9 8 -37 52 0,73
Not economically active 2,4 2,8 -13 -61 34 0,58
Discouraged work-seekers 10,7 10,9 22 -9 54 0,16
Other (not economically active) 3,1 2,9 -36 -91 19 0,20
Rates (%)
Unemployment rate 6,6 5,2 0,1 -2,9 3,1 0,95
Employed/population ratio (absorption) 2,9 3,0 0,5 -1,2 2,2 0,57
Labour force participation rate 2,2 2,5 0,8 -1,2 2,7 0,44
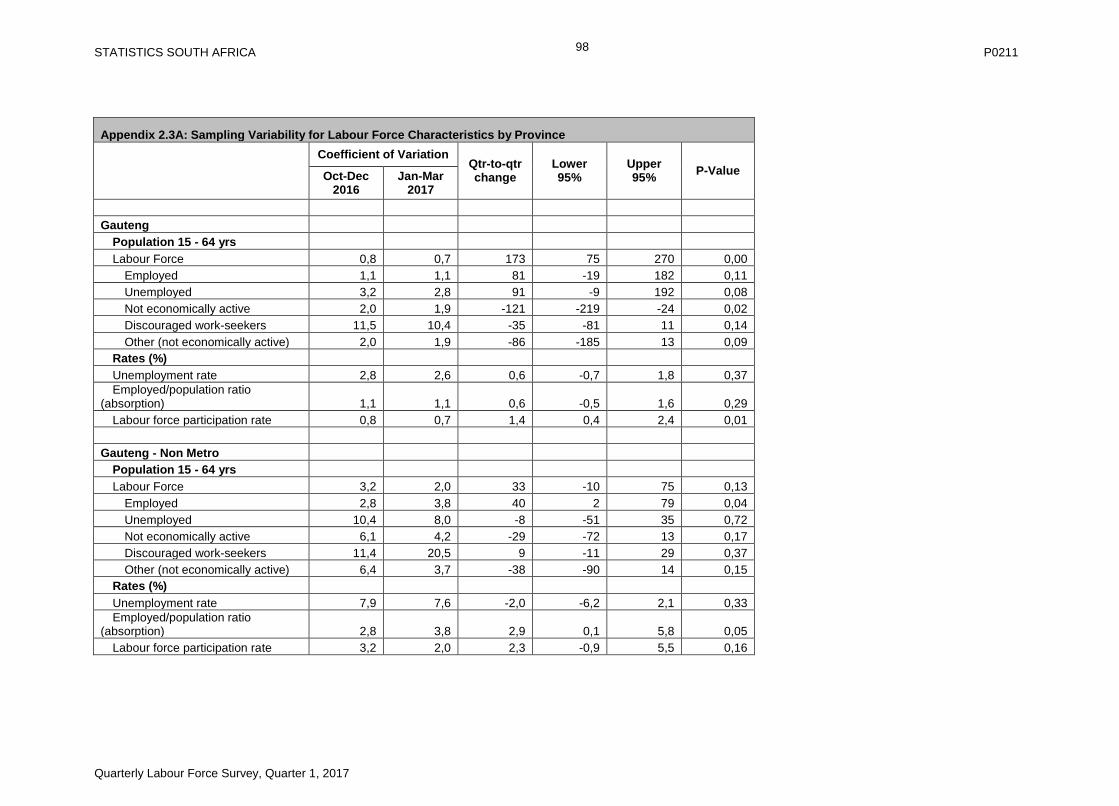
STATISTICS SOUTH AFRICA P0211
Quarterly Labour Force Survey, Quarter 1, 2017
98
Appendix 2.3A: Sampling Variability for Labour Force Characteristics by Province
Coefficient of Variation Qtr-to-qtr change
Lower 95%
Upper 95%
P-Value Oct-Dec 2016
Jan-Mar 2017
Gauteng
Population 15 - 64 yrs
Labour Force 0,8 0,7 173 75 270 0,00
Employed 1,1 1,1 81 -19 182 0,11
Unemployed 3,2 2,8 91 -9 192 0,08
Not economically active 2,0 1,9 -121 -219 -24 0,02
Discouraged work-seekers 11,5 10,4 -35 -81 11 0,14
Other (not economically active) 2,0 1,9 -86 -185 13 0,09
Rates (%)
Unemployment rate 2,8 2,6 0,6 -0,7 1,8 0,37
Employed/population ratio (absorption) 1,1 1,1 0,6 -0,5 1,6 0,29
Labour force participation rate 0,8 0,7 1,4 0,4 2,4 0,01
Gauteng - Non Metro
Population 15 - 64 yrs
Labour Force 3,2 2,0 33 -10 75 0,13
Employed 2,8 3,8 40 2 79 0,04
Unemployed 10,4 8,0 -8 -51 35 0,72
Not economically active 6,1 4,2 -29 -72 13 0,17
Discouraged work-seekers 11,4 20,5 9 -11 29 0,37
Other (not economically active) 6,4 3,7 -38 -90 14 0,15
Rates (%)
Unemployment rate 7,9 7,6 -2,0 -6,2 2,1 0,33
Employed/population ratio (absorption) 2,8 3,8 2,9 0,1 5,8 0,05
Labour force participation rate 3,2 2,0 2,3 -0,9 5,5 0,16

STATISTICS SOUTH AFRICA P0211
Quarterly Labour Force Survey, Quarter 1, 2017
99
Appendix 2.3A: Sampling Variability for Labour Force Characteristics by Province
Coefficient of Variation Qtr-to-qtr change
Lower 95%
Upper 95%
P-Value Oct-Dec 2016
Jan-Mar 2017
Gauteng - Ekurhuleni
Population 15 - 64 yrs
Labour Force 1,3 1,2 51 9 92 0,02
Employed 2,3 2,0 32 -18 81 0,21
Unemployed 6,3 6,0 19 -24 61 0,39
Not economically active 3,4 3,7 -40 -82 1 0,06
Discouraged work-seekers 20,3 13,3 -10 -41 21 0,52
Other (not economically active) 2,8 3,1 -30 -68 8 0,12
Rates (%)
Unemployment rate 5,7 5,2 0,2 -2,0 2,4 0,88
Employed/population ratio (absorption) 2,3 2,0 1,1 -0,9 3,1 0,29
Labour force participation rate 1,3 1,2 1,7 0,1 3,4 0,04
Gauteng - City of Johannesburg
Population 15 - 64 yrs
Labour Force 1,1 1,0 12 -40 65 0,65
Employed 1,2 1,9 -3 -50 45 0,91
Unemployed 4,6 5,2 15 -28 57 0,49
Not economically active 3,5 3,1 12 -41 64 0,66
Discouraged work-seekers 27,7 26,0 -13 -29 4 0,13
Other (not economically active) 3,7 3,2 24 -26 74 0,34
Rates (%)
Unemployment rate 3,8 4,9 0,4 -0,9 1,7 0,54
Employed/population ratio (absorption) 1,2 1,9 -0,4 -1,7 0,9 0,51
Labour force participation rate 1,1 1,0 -0,2 -1,6 1,3 0,82
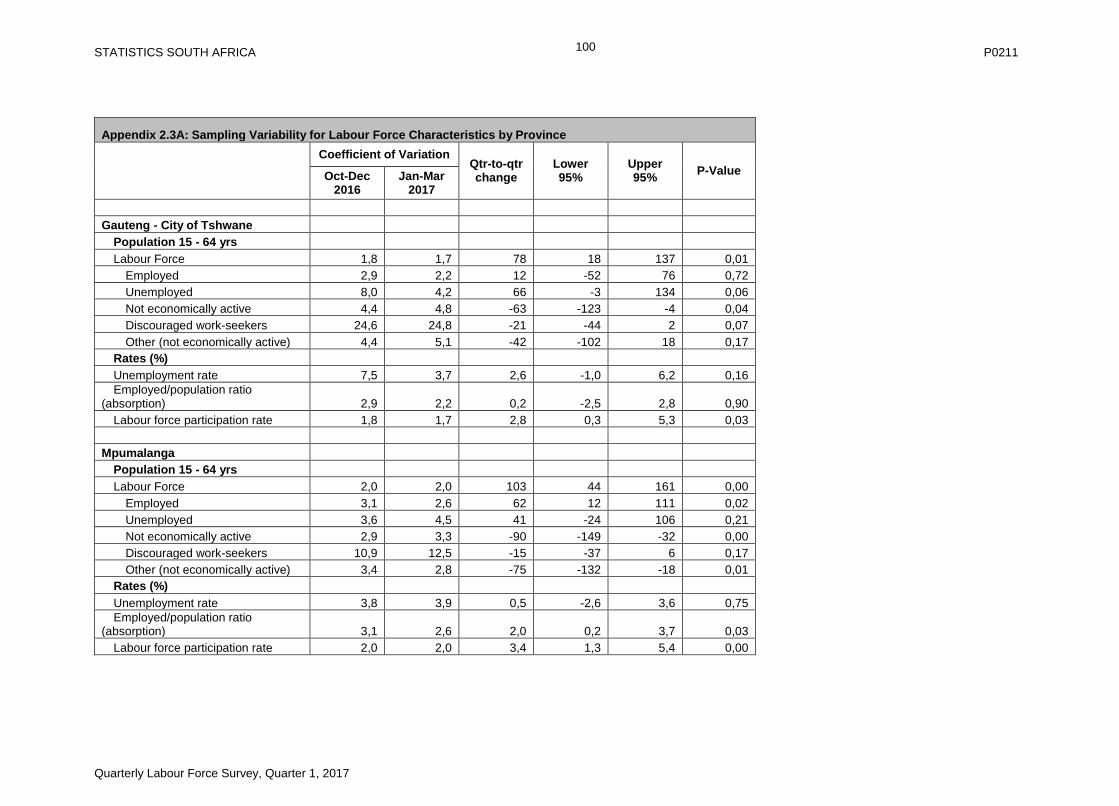
STATISTICS SOUTH AFRICA P0211
Quarterly Labour Force Survey, Quarter 1, 2017
100
Appendix 2.3A: Sampling Variability for Labour Force Characteristics by Province
Coefficient of Variation Qtr-to-qtr change
Lower 95%
Upper 95%
P-Value Oct-Dec 2016
Jan-Mar 2017
Gauteng - City of Tshwane
Population 15 - 64 yrs
Labour Force 1,8 1,7 78 18 137 0,01
Employed 2,9 2,2 12 -52 76 0,72
Unemployed 8,0 4,2 66 -3 134 0,06
Not economically active 4,4 4,8 -63 -123 -4 0,04
Discouraged work-seekers 24,6 24,8 -21 -44 2 0,07
Other (not economically active) 4,4 5,1 -42 -102 18 0,17
Rates (%)
Unemployment rate 7,5 3,7 2,6 -1,0 6,2 0,16
Employed/population ratio (absorption) 2,9 2,2 0,2 -2,5 2,8 0,90
Labour force participation rate 1,8 1,7 2,8 0,3 5,3 0,03
Mpumalanga
Population 15 - 64 yrs
Labour Force 2,0 2,0 103 44 161 0,00
Employed 3,1 2,6 62 12 111 0,02
Unemployed 3,6 4,5 41 -24 106 0,21
Not economically active 2,9 3,3 -90 -149 -32 0,00
Discouraged work-seekers 10,9 12,5 -15 -37 6 0,17
Other (not economically active) 3,4 2,8 -75 -132 -18 0,01
Rates (%)
Unemployment rate 3,8 3,9 0,5 -2,6 3,6 0,75
Employed/population ratio (absorption) 3,1 2,6 2,0 0,2 3,7 0,03
Labour force participation rate 2,0 2,0 3,4 1,3 5,4 0,00
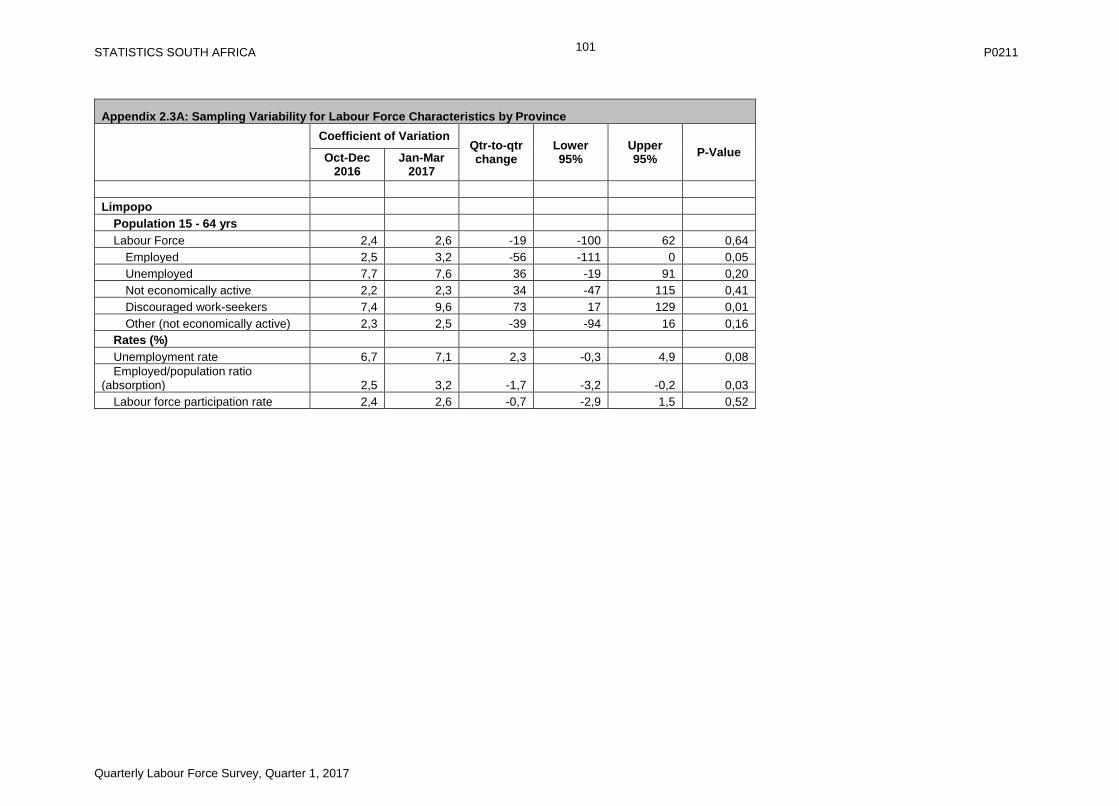
STATISTICS SOUTH AFRICA P0211
Quarterly Labour Force Survey, Quarter 1, 2017
101
Appendix 2.3A: Sampling Variability for Labour Force Characteristics by Province
Coefficient of Variation Qtr-to-qtr change
Lower 95%
Upper 95%
P-Value Oct-Dec 2016
Jan-Mar 2017
Limpopo
Population 15 - 64 yrs
Labour Force 2,4 2,6 -19 -100 62 0,64
Employed 2,5 3,2 -56 -111 0 0,05
Unemployed 7,7 7,6 36 -19 91 0,20
Not economically active 2,2 2,3 34 -47 115 0,41
Discouraged work-seekers 7,4 9,6 73 17 129 0,01
Other (not economically active) 2,3 2,5 -39 -94 16 0,16
Rates (%)
Unemployment rate 6,7 7,1 2,3 -0,3 4,9 0,08
Employed/population ratio (absorption) 2,5 3,2 -1,7 -3,2 -0,2 0,03
Labour force participation rate 2,4 2,6 -0,7 -2,9 1,5 0,52
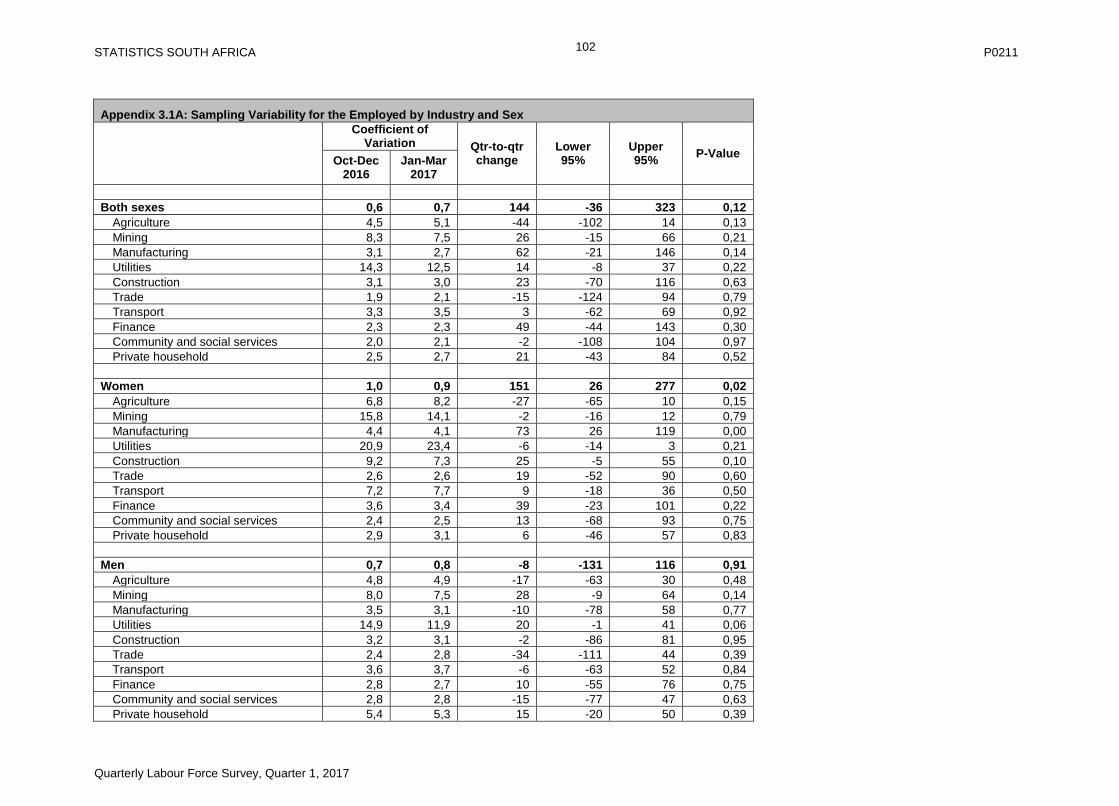
STATISTICS SOUTH AFRICA P0211
Quarterly Labour Force Survey, Quarter 1, 2017
102
Appendix 3.1A: Sampling Variability for the Employed by Industry and Sex
Coefficient of Variation Qtr-to-qtr
change Lower 95%
Upper 95%
P-Value Oct-Dec
2016 Jan-Mar
2017
Both sexes 0,6 0,7 144 -36 323 0,12
Agriculture 4,5 5,1 -44 -102 14 0,13
Mining 8,3 7,5 26 -15 66 0,21
Manufacturing 3,1 2,7 62 -21 146 0,14
Utilities 14,3 12,5 14 -8 37 0,22
Construction 3,1 3,0 23 -70 116 0,63
Trade 1,9 2,1 -15 -124 94 0,79
Transport 3,3 3,5 3 -62 69 0,92
Finance 2,3 2,3 49 -44 143 0,30
Community and social services 2,0 2,1 -2 -108 104 0,97
Private household 2,5 2,7 21 -43 84 0,52
Women 1,0 0,9 151 26 277 0,02
Agriculture 6,8 8,2 -27 -65 10 0,15
Mining 15,8 14,1 -2 -16 12 0,79
Manufacturing 4,4 4,1 73 26 119 0,00
Utilities 20,9 23,4 -6 -14 3 0,21
Construction 9,2 7,3 25 -5 55 0,10
Trade 2,6 2,6 19 -52 90 0,60
Transport 7,2 7,7 9 -18 36 0,50
Finance 3,6 3,4 39 -23 101 0,22
Community and social services 2,4 2,5 13 -68 93 0,75
Private household 2,9 3,1 6 -46 57 0,83
Men 0,7 0,8 -8 -131 116 0,91
Agriculture 4,8 4,9 -17 -63 30 0,48
Mining 8,0 7,5 28 -9 64 0,14
Manufacturing 3,5 3,1 -10 -78 58 0,77
Utilities 14,9 11,9 20 -1 41 0,06
Construction 3,2 3,1 -2 -86 81 0,95
Trade 2,4 2,8 -34 -111 44 0,39
Transport 3,6 3,7 -6 -63 52 0,84
Finance 2,8 2,7 10 -55 76 0,75
Community and social services 2,8 2,8 -15 -77 47 0,63
Private household 5,4 5,3 15 -20 50 0,39

STATISTICS SOUTH AFRICA P0211
Quarterly Labour Force Survey, Quarter 1, 2017
103
Table 3.4A: Sampling Variability for the Employed by Province and Sector
Coefficient of Variation Qtr-to-qtr
change Lower 95%
Upper 95%
P-Value Oct-Dec
2016 Jan-Mar
2017
South Africa 0,6 0,7 144 -36 323 0,12
Formal sector (Non-agricultural) 0,9 0,9 181 28 335 0,02
Informal sector (Non-agricultural) 2,0 2,2 -14 -124 96 0,80
Agriculture 4,5 5,1 -44 -102 14 0,13
Private households 2,5 2,7 21 -43 84 0,52
Western Cape 1,7 1,9 21 -40 81 0,50
Formal sector (Non-agricultural) 2,8 2,7 34 -20 87 0,22
Informal sector (Non-agricultural) 7,5 8,5 26 -3 55 0,08
Agriculture 6,9 9,1 -36 -60 -11 0,01
Private households 7,8 10,6 -3 -35 28 0,84
Western Cape - Non Metro 2,4 3,0 -8 -61 45 0,76
Formal sector (Non-agricultural) 5,6 4,1 24 -15 63 0,23
Informal sector (Non-agricultural) 13,5 14,6 9 -9 26 0,32
Agriculture 7,1 9,4 -37 -61 -14 0,00
Private households 15,5 11,5 -3 -16 9 0,61
Western Cape - City of Cape Town 2,3 2,5 29 -6 63 0,10
Formal sector (Non-agricultural) 3,2 3,4 10 -29 48 0,61
Informal sector (Non-agricultural) 9,3 10,2 17 -6 40 0,14
Agriculture 28,6 40,0 2 -8 11 0,71
Private households 7,8 15,1 0 -29 29 1,00
Eastern Cape 1,8 1,9 -5 -52 41 0,82
Formal sector (Non-agricultural) 2,6 2,3 18 -24 60 0,40
Informal sector (Non-agricultural) 5,0 6,6 -19 -57 19 0,32
Agriculture 10,6 15,6 -2 -29 26 0,92
Private households 8,3 7,0 -3 -20 14 0,75
Eastern Cape - Non Metro 2,6 2,3 -17 -55 22 0,40
Formal sector (Non-agricultural) 4,4 3,4 12 -20 45 0,46
Informal sector (Non-agricultural) 5,5 7,6 -20 -49 9 0,18
Agriculture 11,4 16,4 1 -27 29 0,94
Private households 11,9 10,6 -10 -24 3 0,14
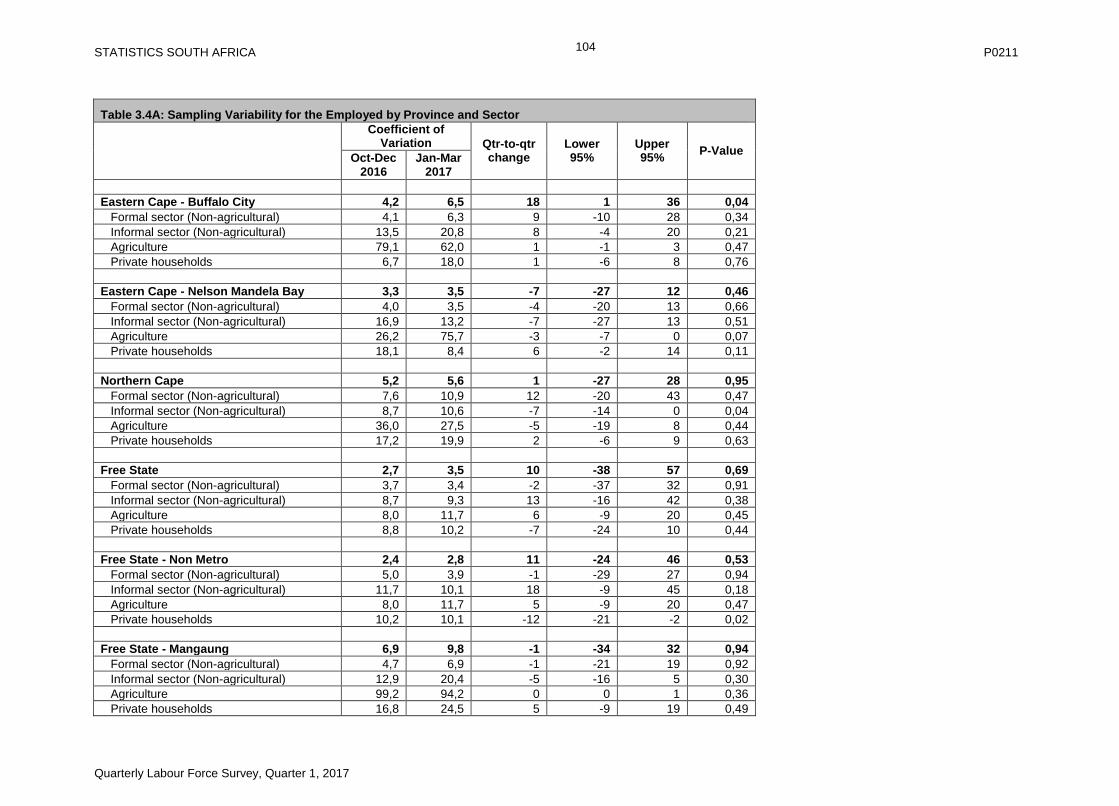
STATISTICS SOUTH AFRICA P0211
Quarterly Labour Force Survey, Quarter 1, 2017
104
Table 3.4A: Sampling Variability for the Employed by Province and Sector
Coefficient of Variation Qtr-to-qtr
change Lower 95%
Upper 95%
P-Value Oct-Dec
2016 Jan-Mar
2017
Eastern Cape - Buffalo City 4,2 6,5 18 1 36 0,04
Formal sector (Non-agricultural) 4,1 6,3 9 -10 28 0,34
Informal sector (Non-agricultural) 13,5 20,8 8 -4 20 0,21
Agriculture 79,1 62,0 1 -1 3 0,47
Private households 6,7 18,0 1 -6 8 0,76
Eastern Cape - Nelson Mandela Bay 3,3 3,5 -7 -27 12 0,46
Formal sector (Non-agricultural) 4,0 3,5 -4 -20 13 0,66
Informal sector (Non-agricultural) 16,9 13,2 -7 -27 13 0,51
Agriculture 26,2 75,7 -3 -7 0 0,07
Private households 18,1 8,4 6 -2 14 0,11
Northern Cape 5,2 5,6 1 -27 28 0,95
Formal sector (Non-agricultural) 7,6 10,9 12 -20 43 0,47
Informal sector (Non-agricultural) 8,7 10,6 -7 -14 0 0,04
Agriculture 36,0 27,5 -5 -19 8 0,44
Private households 17,2 19,9 2 -6 9 0,63
Free State 2,7 3,5 10 -38 57 0,69
Formal sector (Non-agricultural) 3,7 3,4 -2 -37 32 0,91
Informal sector (Non-agricultural) 8,7 9,3 13 -16 42 0,38
Agriculture 8,0 11,7 6 -9 20 0,45
Private households 8,8 10,2 -7 -24 10 0,44
Free State - Non Metro 2,4 2,8 11 -24 46 0,53
Formal sector (Non-agricultural) 5,0 3,9 -1 -29 27 0,94
Informal sector (Non-agricultural) 11,7 10,1 18 -9 45 0,18
Agriculture 8,0 11,7 5 -9 20 0,47
Private households 10,2 10,1 -12 -21 -2 0,02
Free State - Mangaung 6,9 9,8 -1 -34 32 0,94
Formal sector (Non-agricultural) 4,7 6,9 -1 -21 19 0,92
Informal sector (Non-agricultural) 12,9 20,4 -5 -16 5 0,30
Agriculture 99,2 94,2 0 0 1 0,36
Private households 16,8 24,5 5 -9 19 0,49
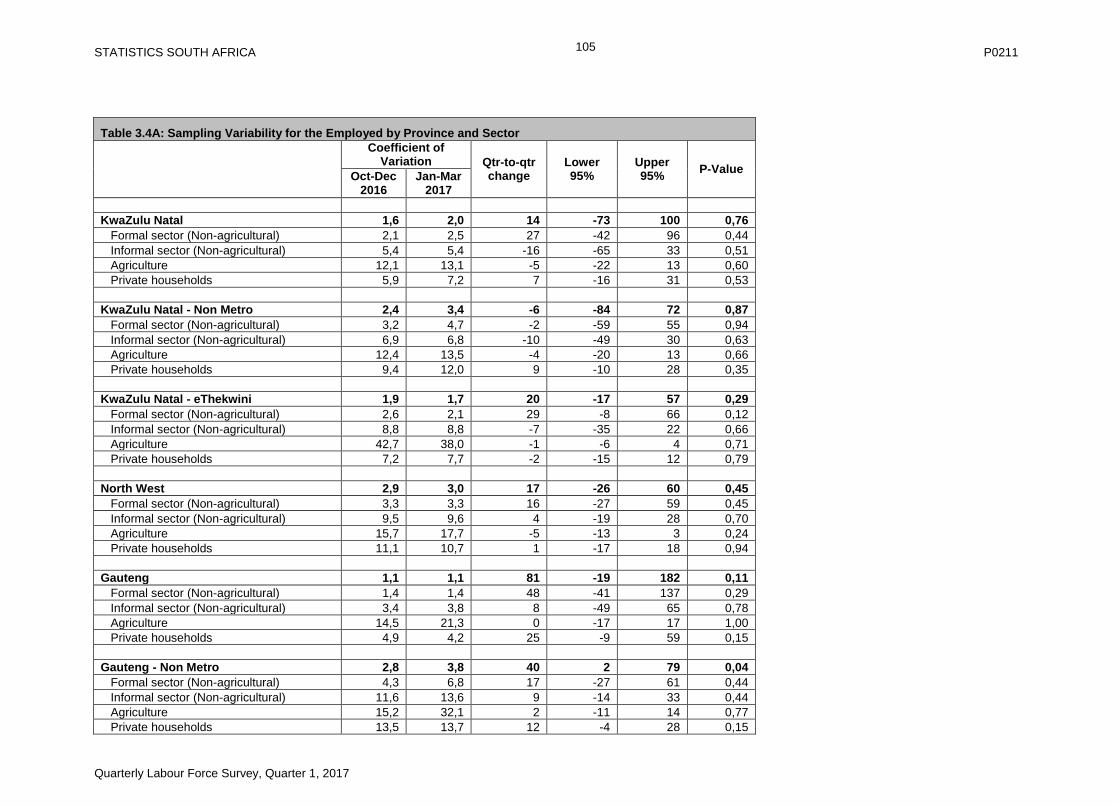
STATISTICS SOUTH AFRICA P0211
Quarterly Labour Force Survey, Quarter 1, 2017
105
Table 3.4A: Sampling Variability for the Employed by Province and Sector
Coefficient of Variation Qtr-to-qtr
change Lower 95%
Upper 95%
P-Value Oct-Dec
2016 Jan-Mar
2017
KwaZulu Natal 1,6 2,0 14 -73 100 0,76
Formal sector (Non-agricultural) 2,1 2,5 27 -42 96 0,44
Informal sector (Non-agricultural) 5,4 5,4 -16 -65 33 0,51
Agriculture 12,1 13,1 -5 -22 13 0,60
Private households 5,9 7,2 7 -16 31 0,53
KwaZulu Natal - Non Metro 2,4 3,4 -6 -84 72 0,87
Formal sector (Non-agricultural) 3,2 4,7 -2 -59 55 0,94
Informal sector (Non-agricultural) 6,9 6,8 -10 -49 30 0,63
Agriculture 12,4 13,5 -4 -20 13 0,66
Private households 9,4 12,0 9 -10 28 0,35
KwaZulu Natal - eThekwini 1,9 1,7 20 -17 57 0,29
Formal sector (Non-agricultural) 2,6 2,1 29 -8 66 0,12
Informal sector (Non-agricultural) 8,8 8,8 -7 -35 22 0,66
Agriculture 42,7 38,0 -1 -6 4 0,71
Private households 7,2 7,7 -2 -15 12 0,79
North West 2,9 3,0 17 -26 60 0,45
Formal sector (Non-agricultural) 3,3 3,3 16 -27 59 0,45
Informal sector (Non-agricultural) 9,5 9,6 4 -19 28 0,70
Agriculture 15,7 17,7 -5 -13 3 0,24
Private households 11,1 10,7 1 -17 18 0,94
Gauteng 1,1 1,1 81 -19 182 0,11
Formal sector (Non-agricultural) 1,4 1,4 48 -41 137 0,29
Informal sector (Non-agricultural) 3,4 3,8 8 -49 65 0,78
Agriculture 14,5 21,3 0 -17 17 1,00
Private households 4,9 4,2 25 -9 59 0,15
Gauteng - Non Metro 2,8 3,8 40 2 79 0,04
Formal sector (Non-agricultural) 4,3 6,8 17 -27 61 0,44
Informal sector (Non-agricultural) 11,6 13,6 9 -14 33 0,44
Agriculture 15,2 32,1 2 -11 14 0,77
Private households 13,5 13,7 12 -4 28 0,15
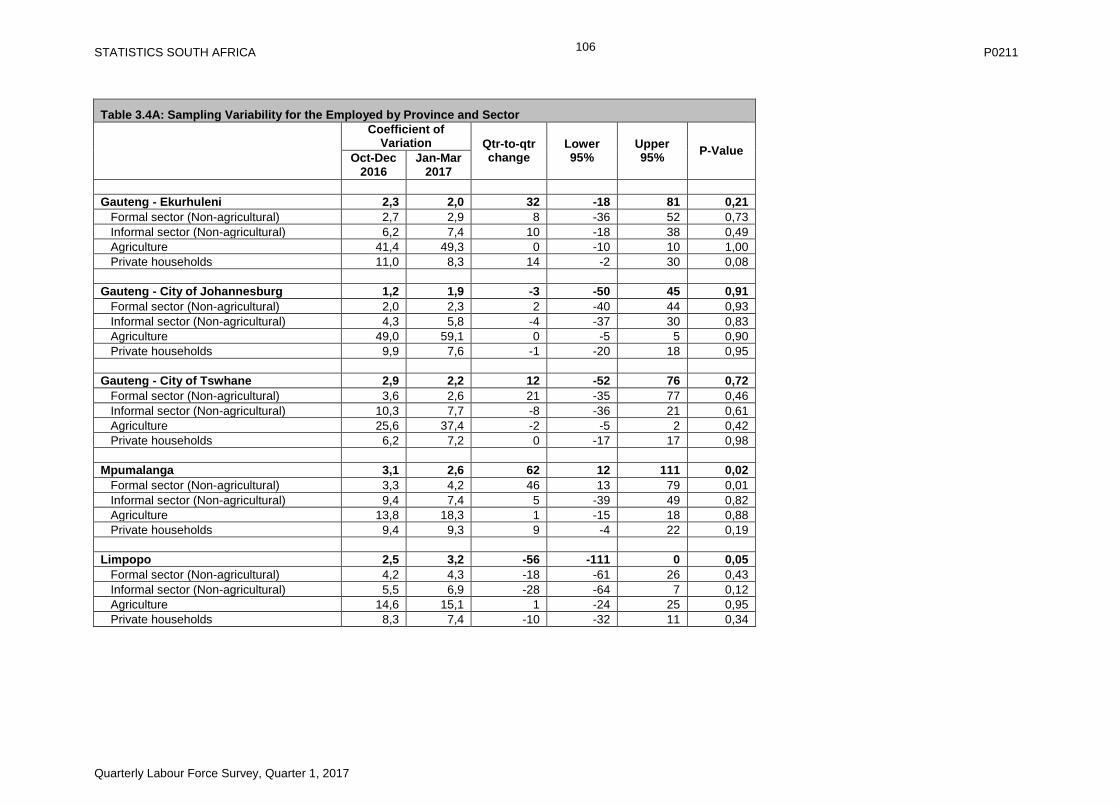
STATISTICS SOUTH AFRICA P0211
Quarterly Labour Force Survey, Quarter 1, 2017
106
Table 3.4A: Sampling Variability for the Employed by Province and Sector
Coefficient of Variation Qtr-to-qtr
change Lower 95%
Upper 95%
P-Value Oct-Dec
2016 Jan-Mar
2017
Gauteng - Ekurhuleni 2,3 2,0 32 -18 81 0,21
Formal sector (Non-agricultural) 2,7 2,9 8 -36 52 0,73
Informal sector (Non-agricultural) 6,2 7,4 10 -18 38 0,49
Agriculture 41,4 49,3 0 -10 10 1,00
Private households 11,0 8,3 14 -2 30 0,08
Gauteng - City of Johannesburg 1,2 1,9 -3 -50 45 0,91
Formal sector (Non-agricultural) 2,0 2,3 2 -40 44 0,93
Informal sector (Non-agricultural) 4,3 5,8 -4 -37 30 0,83
Agriculture 49,0 59,1 0 -5 5 0,90
Private households 9,9 7,6 -1 -20 18 0,95
Gauteng - City of Tswhane 2,9 2,2 12 -52 76 0,72
Formal sector (Non-agricultural) 3,6 2,6 21 -35 77 0,46
Informal sector (Non-agricultural) 10,3 7,7 -8 -36 21 0,61
Agriculture 25,6 37,4 -2 -5 2 0,42
Private households 6,2 7,2 0 -17 17 0,98
Mpumalanga 3,1 2,6 62 12 111 0,02
Formal sector (Non-agricultural) 3,3 4,2 46 13 79 0,01
Informal sector (Non-agricultural) 9,4 7,4 5 -39 49 0,82
Agriculture 13,8 18,3 1 -15 18 0,88
Private households 9,4 9,3 9 -4 22 0,19
Limpopo 2,5 3,2 -56 -111 0 0,05
Formal sector (Non-agricultural) 4,2 4,3 -18 -61 26 0,43
Informal sector (Non-agricultural) 5,5 6,9 -28 -64 7 0,12
Agriculture 14,6 15,1 1 -24 25 0,95
Private households 8,3 7,4 -10 -32 11 0,34
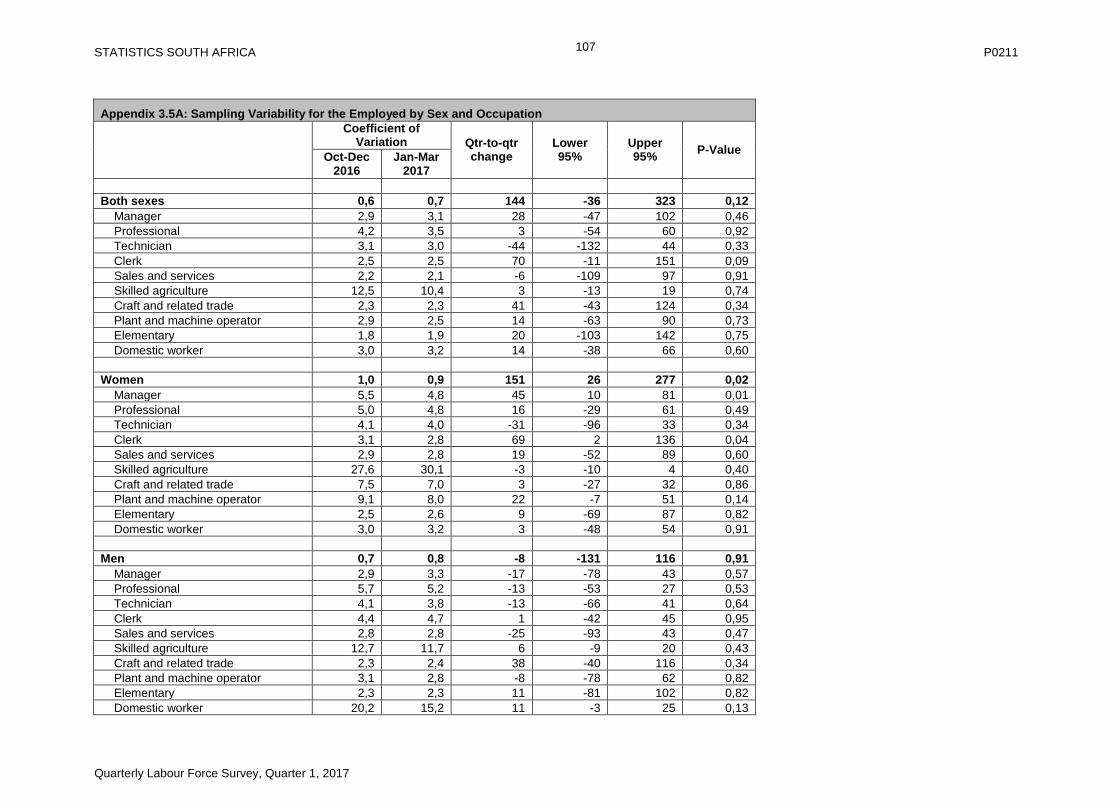
STATISTICS SOUTH AFRICA P0211
Quarterly Labour Force Survey, Quarter 1, 2017
107
Appendix 3.5A: Sampling Variability for the Employed by Sex and Occupation
Coefficient of Variation Qtr-to-qtr
change Lower 95%
Upper 95%
P-Value Oct-Dec
2016 Jan-Mar
2017
Both sexes 0,6 0,7 144 -36 323 0,12
Manager 2,9 3,1 28 -47 102 0,46
Professional 4,2 3,5 3 -54 60 0,92
Technician 3,1 3,0 -44 -132 44 0,33
Clerk 2,5 2,5 70 -11 151 0,09
Sales and services 2,2 2,1 -6 -109 97 0,91
Skilled agriculture 12,5 10,4 3 -13 19 0,74
Craft and related trade 2,3 2,3 41 -43 124 0,34
Plant and machine operator 2,9 2,5 14 -63 90 0,73
Elementary 1,8 1,9 20 -103 142 0,75
Domestic worker 3,0 3,2 14 -38 66 0,60
Women 1,0 0,9 151 26 277 0,02
Manager 5,5 4,8 45 10 81 0,01
Professional 5,0 4,8 16 -29 61 0,49
Technician 4,1 4,0 -31 -96 33 0,34
Clerk 3,1 2,8 69 2 136 0,04
Sales and services 2,9 2,8 19 -52 89 0,60
Skilled agriculture 27,6 30,1 -3 -10 4 0,40
Craft and related trade 7,5 7,0 3 -27 32 0,86
Plant and machine operator 9,1 8,0 22 -7 51 0,14
Elementary 2,5 2,6 9 -69 87 0,82
Domestic worker 3,0 3,2 3 -48 54 0,91
Men 0,7 0,8 -8 -131 116 0,91
Manager 2,9 3,3 -17 -78 43 0,57
Professional 5,7 5,2 -13 -53 27 0,53
Technician 4,1 3,8 -13 -66 41 0,64
Clerk 4,4 4,7 1 -42 45 0,95
Sales and services 2,8 2,8 -25 -93 43 0,47
Skilled agriculture 12,7 11,7 6 -9 20 0,43
Craft and related trade 2,3 2,4 38 -40 116 0,34
Plant and machine operator 3,1 2,8 -8 -78 62 0,82
Elementary 2,3 2,3 11 -81 102 0,82
Domestic worker 20,2 15,2 11 -3 25 0,13
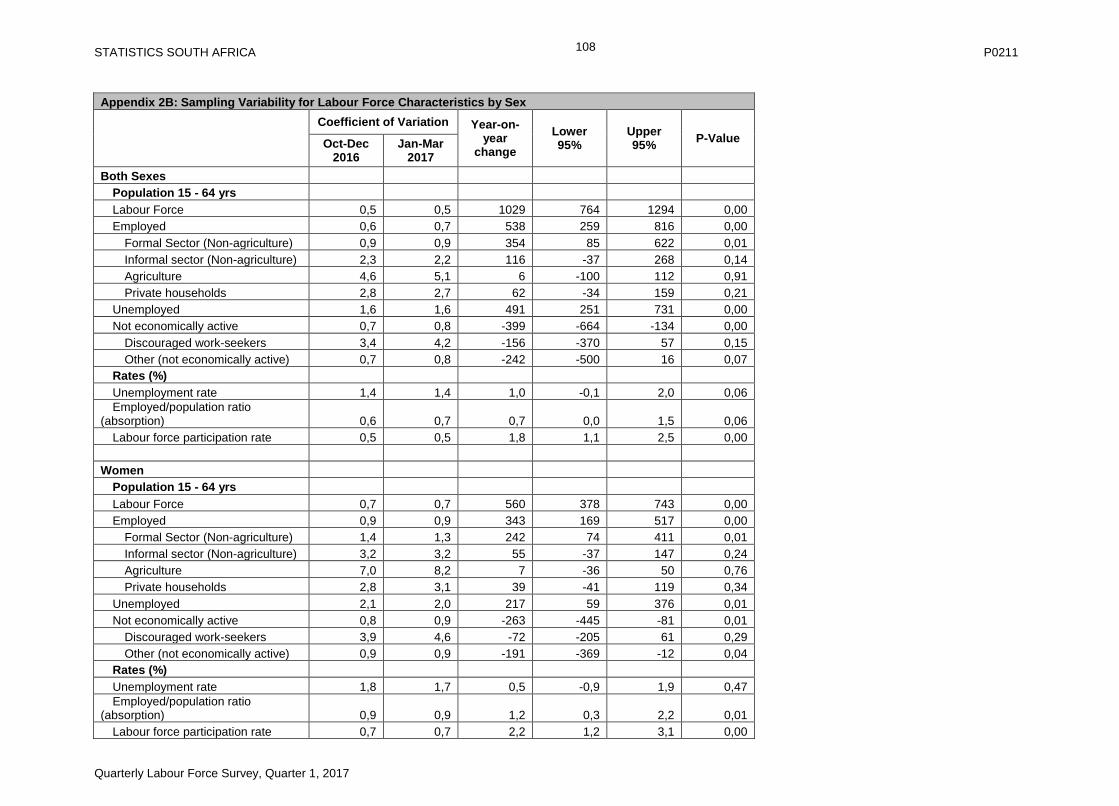
STATISTICS SOUTH AFRICA P0211
Quarterly Labour Force Survey, Quarter 1, 2017
108
Appendix 2B: Sampling Variability for Labour Force Characteristics by Sex
Coefficient of Variation Year-on-year
change
Lower 95%
Upper 95%
P-Value Oct-Dec 2016
Jan-Mar 2017
Both Sexes
Population 15 - 64 yrs
Labour Force 0,5 0,5 1029 764 1294 0,00
Employed 0,6 0,7 538 259 816 0,00
Formal Sector (Non-agriculture) 0,9 0,9 354 85 622 0,01
Informal sector (Non-agriculture) 2,3 2,2 116 -37 268 0,14
Agriculture 4,6 5,1 6 -100 112 0,91
Private households 2,8 2,7 62 -34 159 0,21
Unemployed 1,6 1,6 491 251 731 0,00
Not economically active 0,7 0,8 -399 -664 -134 0,00
Discouraged work-seekers 3,4 4,2 -156 -370 57 0,15
Other (not economically active) 0,7 0,8 -242 -500 16 0,07
Rates (%)
Unemployment rate 1,4 1,4 1,0 -0,1 2,0 0,06
Employed/population ratio (absorption) 0,6 0,7 0,7 0,0 1,5 0,06
Labour force participation rate 0,5 0,5 1,8 1,1 2,5 0,00
Women
Population 15 - 64 yrs
Labour Force 0,7 0,7 560 378 743 0,00
Employed 0,9 0,9 343 169 517 0,00
Formal Sector (Non-agriculture) 1,4 1,3 242 74 411 0,01
Informal sector (Non-agriculture) 3,2 3,2 55 -37 147 0,24
Agriculture 7,0 8,2 7 -36 50 0,76
Private households 2,8 3,1 39 -41 119 0,34
Unemployed 2,1 2,0 217 59 376 0,01
Not economically active 0,8 0,9 -263 -445 -81 0,01
Discouraged work-seekers 3,9 4,6 -72 -205 61 0,29
Other (not economically active) 0,9 0,9 -191 -369 -12 0,04
Rates (%)
Unemployment rate 1,8 1,7 0,5 -0,9 1,9 0,47
Employed/population ratio (absorption) 0,9 0,9 1,2 0,3 2,2 0,01
Labour force participation rate 0,7 0,7 2,2 1,2 3,1 0,00
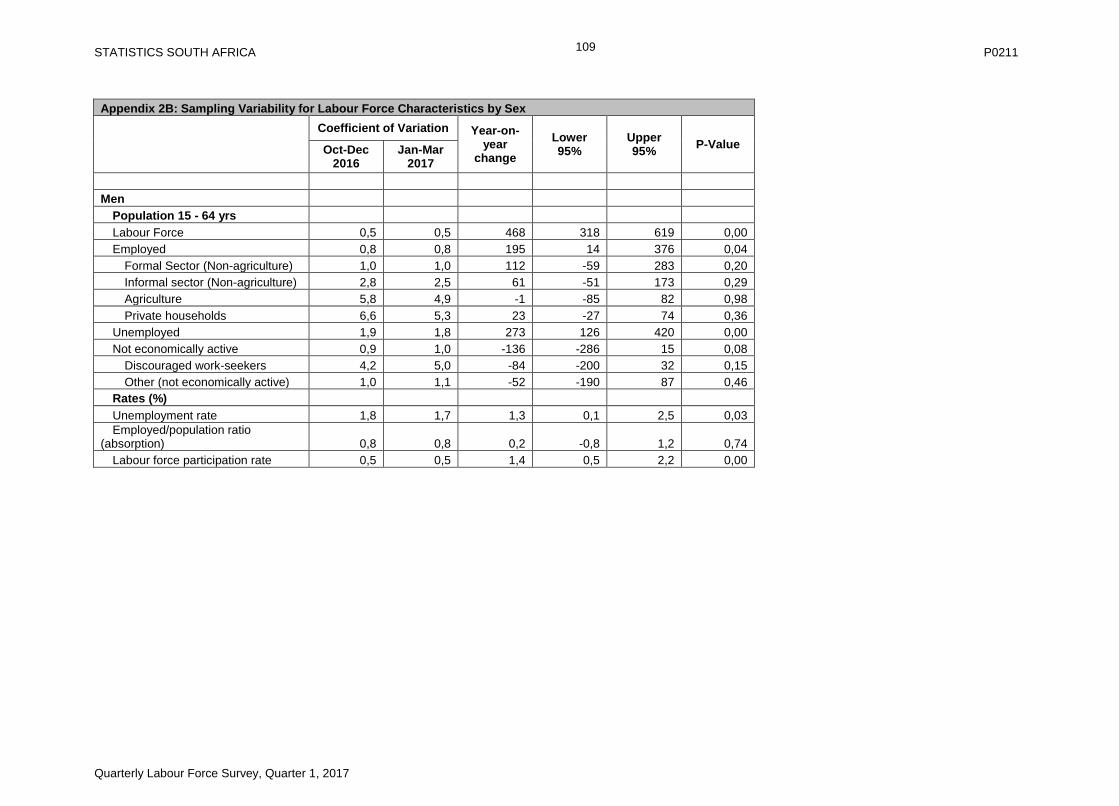
STATISTICS SOUTH AFRICA P0211
Quarterly Labour Force Survey, Quarter 1, 2017
109
Appendix 2B: Sampling Variability for Labour Force Characteristics by Sex
Coefficient of Variation Year-on-year
change
Lower 95%
Upper 95%
P-Value Oct-Dec 2016
Jan-Mar 2017
Men
Population 15 - 64 yrs
Labour Force 0,5 0,5 468 318 619 0,00
Employed 0,8 0,8 195 14 376 0,04
Formal Sector (Non-agriculture) 1,0 1,0 112 -59 283 0,20
Informal sector (Non-agriculture) 2,8 2,5 61 -51 173 0,29
Agriculture 5,8 4,9 -1 -85 82 0,98
Private households 6,6 5,3 23 -27 74 0,36
Unemployed 1,9 1,8 273 126 420 0,00
Not economically active 0,9 1,0 -136 -286 15 0,08
Discouraged work-seekers 4,2 5,0 -84 -200 32 0,15
Other (not economically active) 1,0 1,1 -52 -190 87 0,46
Rates (%)
Unemployment rate 1,8 1,7 1,3 0,1 2,5 0,03
Employed/population ratio (absorption) 0,8 0,8 0,2 -0,8 1,2 0,74
Labour force participation rate 0,5 0,5 1,4 0,5 2,2 0,00
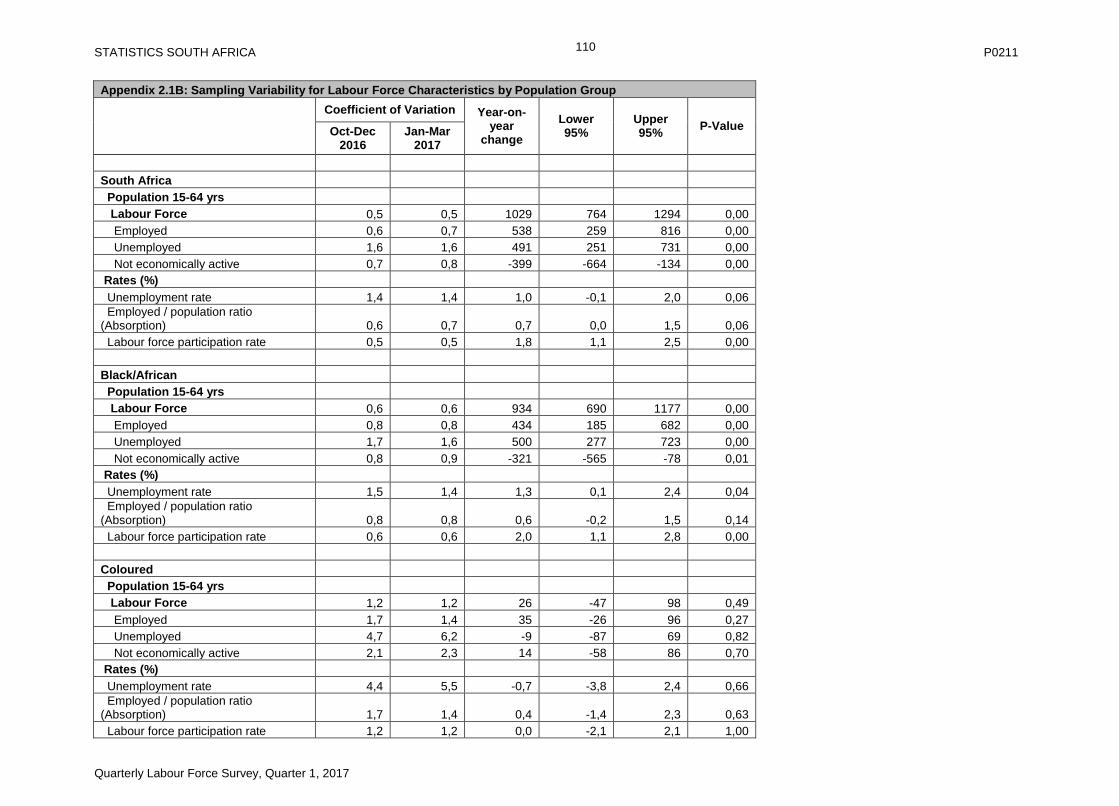
STATISTICS SOUTH AFRICA P0211
Quarterly Labour Force Survey, Quarter 1, 2017
110
Appendix 2.1B: Sampling Variability for Labour Force Characteristics by Population Group
Coefficient of Variation Year-on-year
change
Lower 95%
Upper 95%
P-Value Oct-Dec 2016
Jan-Mar 2017
South Africa
Population 15-64 yrs
Labour Force 0,5 0,5 1029 764 1294 0,00
Employed 0,6 0,7 538 259 816 0,00
Unemployed 1,6 1,6 491 251 731 0,00
Not economically active 0,7 0,8 -399 -664 -134 0,00
Rates (%)
Unemployment rate 1,4 1,4 1,0 -0,1 2,0 0,06
Employed / population ratio (Absorption) 0,6 0,7 0,7 0,0 1,5 0,06
Labour force participation rate 0,5 0,5 1,8 1,1 2,5 0,00
Black/African
Population 15-64 yrs
Labour Force 0,6 0,6 934 690 1177 0,00
Employed 0,8 0,8 434 185 682 0,00
Unemployed 1,7 1,6 500 277 723 0,00
Not economically active 0,8 0,9 -321 -565 -78 0,01
Rates (%)
Unemployment rate 1,5 1,4 1,3 0,1 2,4 0,04
Employed / population ratio (Absorption) 0,8 0,8 0,6 -0,2 1,5 0,14
Labour force participation rate 0,6 0,6 2,0 1,1 2,8 0,00
Coloured
Population 15-64 yrs
Labour Force 1,2 1,2 26 -47 98 0,49
Employed 1,7 1,4 35 -26 96 0,27
Unemployed 4,7 6,2 -9 -87 69 0,82
Not economically active 2,1 2,3 14 -58 86 0,70
Rates (%)
Unemployment rate 4,4 5,5 -0,7 -3,8 2,4 0,66
Employed / population ratio (Absorption) 1,7 1,4 0,4 -1,4 2,3 0,63
Labour force participation rate 1,2 1,2 0,0 -2,1 2,1 1,00
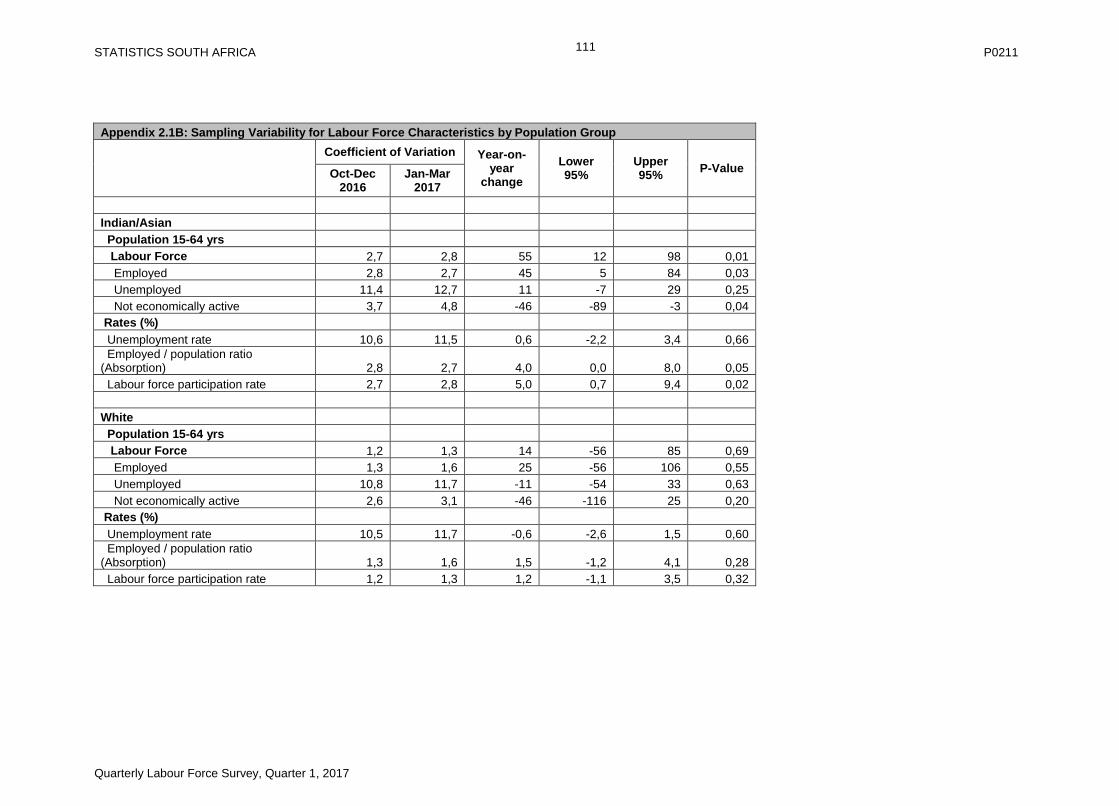
STATISTICS SOUTH AFRICA P0211
Quarterly Labour Force Survey, Quarter 1, 2017
111
Appendix 2.1B: Sampling Variability for Labour Force Characteristics by Population Group
Coefficient of Variation Year-on-year
change
Lower 95%
Upper 95%
P-Value Oct-Dec 2016
Jan-Mar 2017
Indian/Asian
Population 15-64 yrs
Labour Force 2,7 2,8 55 12 98 0,01
Employed 2,8 2,7 45 5 84 0,03
Unemployed 11,4 12,7 11 -7 29 0,25
Not economically active 3,7 4,8 -46 -89 -3 0,04
Rates (%)
Unemployment rate 10,6 11,5 0,6 -2,2 3,4 0,66
Employed / population ratio (Absorption) 2,8 2,7 4,0 0,0 8,0 0,05
Labour force participation rate 2,7 2,8 5,0 0,7 9,4 0,02
White
Population 15-64 yrs
Labour Force 1,2 1,3 14 -56 85 0,69
Employed 1,3 1,6 25 -56 106 0,55
Unemployed 10,8 11,7 -11 -54 33 0,63
Not economically active 2,6 3,1 -46 -116 25 0,20
Rates (%)
Unemployment rate 10,5 11,7 -0,6 -2,6 1,5 0,60
Employed / population ratio (Absorption) 1,3 1,6 1,5 -1,2 4,1 0,28
Labour force participation rate 1,2 1,3 1,2 -1,1 3,5 0,32
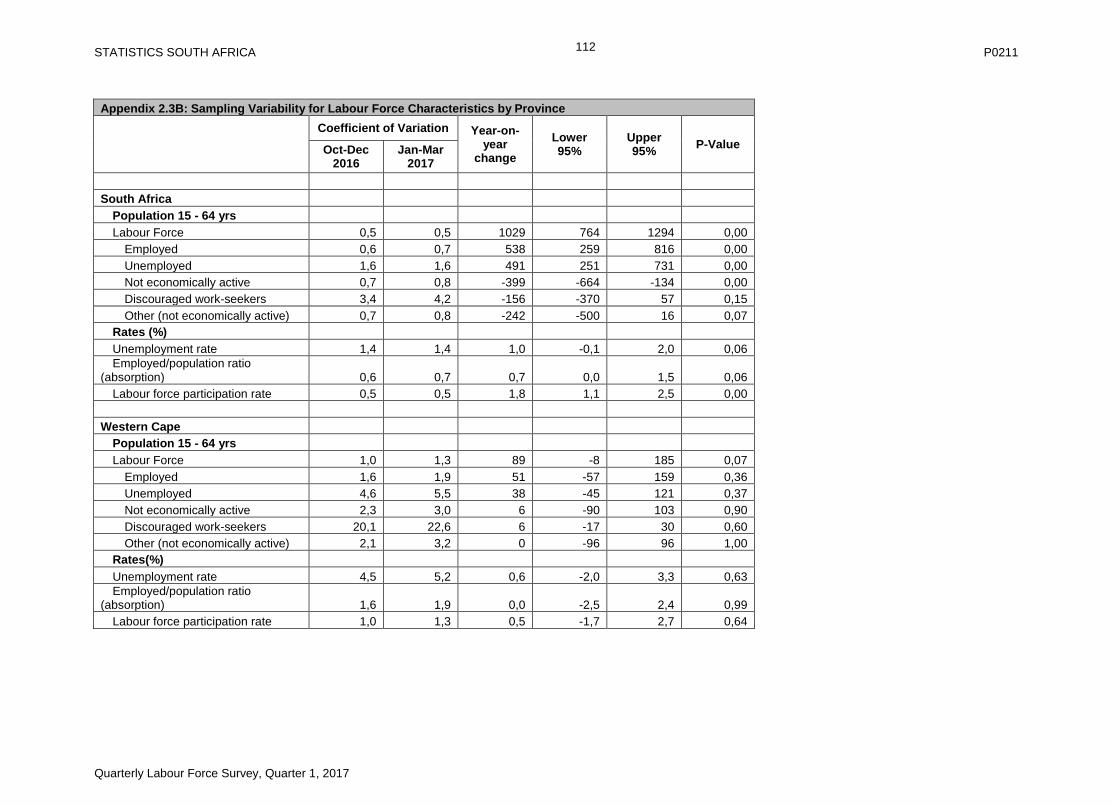
STATISTICS SOUTH AFRICA P0211
Quarterly Labour Force Survey, Quarter 1, 2017
112
Appendix 2.3B: Sampling Variability for Labour Force Characteristics by Province
Coefficient of Variation Year-on-year
change
Lower 95%
Upper 95%
P-Value Oct-Dec 2016
Jan-Mar 2017
South Africa
Population 15 - 64 yrs
Labour Force 0,5 0,5 1029 764 1294 0,00
Employed 0,6 0,7 538 259 816 0,00
Unemployed 1,6 1,6 491 251 731 0,00
Not economically active 0,7 0,8 -399 -664 -134 0,00
Discouraged work-seekers 3,4 4,2 -156 -370 57 0,15
Other (not economically active) 0,7 0,8 -242 -500 16 0,07
Rates (%)
Unemployment rate 1,4 1,4 1,0 -0,1 2,0 0,06
Employed/population ratio (absorption) 0,6 0,7 0,7 0,0 1,5 0,06
Labour force participation rate 0,5 0,5 1,8 1,1 2,5 0,00
Western Cape
Population 15 - 64 yrs
Labour Force 1,0 1,3 89 -8 185 0,07
Employed 1,6 1,9 51 -57 159 0,36
Unemployed 4,6 5,5 38 -45 121 0,37
Not economically active 2,3 3,0 6 -90 103 0,90
Discouraged work-seekers 20,1 22,6 6 -17 30 0,60
Other (not economically active) 2,1 3,2 0 -96 96 1,00
Rates(%)
Unemployment rate 4,5 5,2 0,6 -2,0 3,3 0,63
Employed/population ratio (absorption) 1,6 1,9 0,0 -2,5 2,4 0,99
Labour force participation rate 1,0 1,3 0,5 -1,7 2,7 0,64

STATISTICS SOUTH AFRICA P0211
Quarterly Labour Force Survey, Quarter 1, 2017
113
Appendix 2.3B: Sampling Variability for Labour Force Characteristics by Province
Coefficient of Variation Year-on-year
change
Lower 95%
Upper 95%
P-Value Oct-Dec 2016
Jan-Mar 2017
Western Cape - Non Metro
Population 15 - 64 yrs
Labour Force 1,5 2,1 47 -1 95 0,06
Employed 2,1 3,0 56 -6 119 0,08
Unemployed 9,2 8,0 -9 -66 48 0,75
Not economically active 3,1 4,6 -9 -57 40 0,73
Discouraged work-seekers 21,5 28,6 -1 -23 22 0,94
Other (not economically active) 2,6 5,1 -8 -59 43 0,77
Rates(%)
Unemployment rate 8,5 8,1 -1,7 -6,8 3,4 0,51
Employed/population ratio (absorption) 2,1 3,0 2,2 -1,7 6,1 0,27
Labour force participation rate 1,5 2,1 1,3 -1,7 4,3 0,39
Western Cape - City of Cape Town
Population 15 - 64 yrs
Labour Force 1,4 1,8 42 -38 122 0,30
Employed 2,2 2,5 -5 -94 83 0,90
Unemployed 5,1 7,1 47 -12 107 0,12
Not economically active 3,3 4,1 15 -65 95 0,71
Discouraged work-seekers 51,5 29,1 7 0 14 0,04
Other (not economically active) 3,2 4,2 8 -72 87 0,85
Rates(%)
Unemployment rate 5,1 6,6 2,0 -1,0 4,9 0,20
Employed/population ratio (absorption) 2,2 2,5 -1,3 -4,4 1,9 0,42
Labour force participation rate 1,4 1,8 0,1 -2,8 2,9 0,95
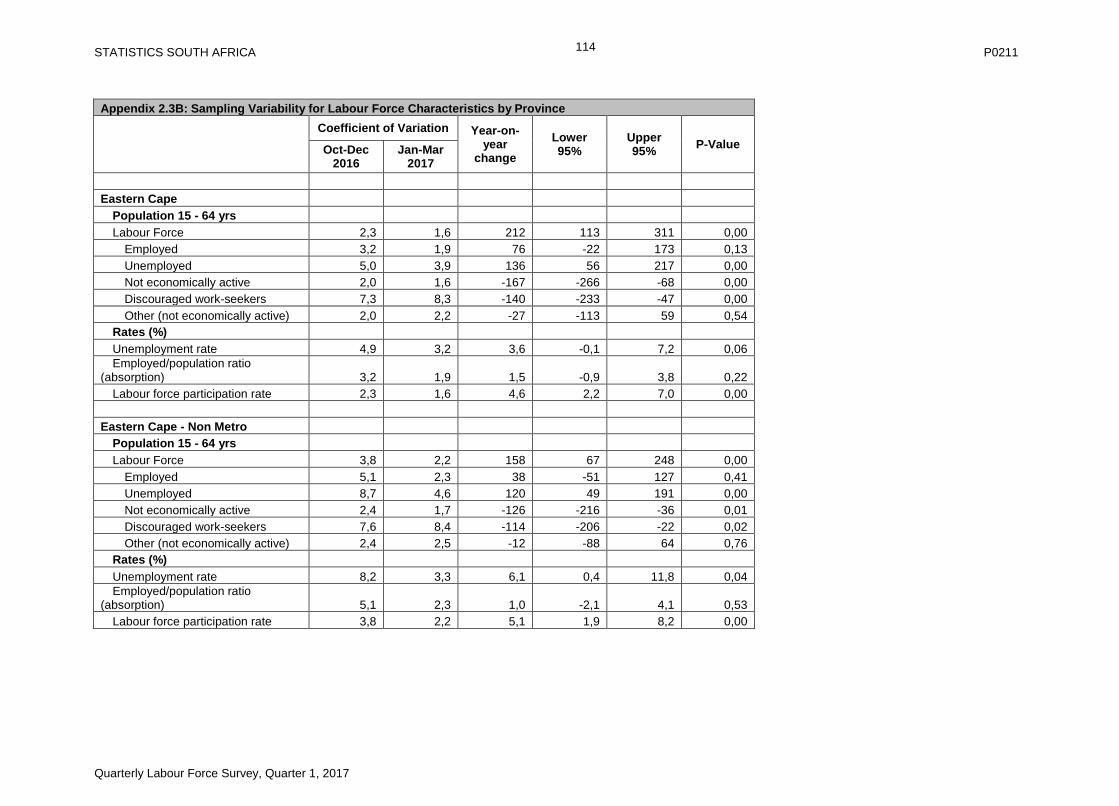
STATISTICS SOUTH AFRICA P0211
Quarterly Labour Force Survey, Quarter 1, 2017
114
Appendix 2.3B: Sampling Variability for Labour Force Characteristics by Province
Coefficient of Variation Year-on-year
change
Lower 95%
Upper 95%
P-Value Oct-Dec 2016
Jan-Mar 2017
Eastern Cape
Population 15 - 64 yrs
Labour Force 2,3 1,6 212 113 311 0,00
Employed 3,2 1,9 76 -22 173 0,13
Unemployed 5,0 3,9 136 56 217 0,00
Not economically active 2,0 1,6 -167 -266 -68 0,00
Discouraged work-seekers 7,3 8,3 -140 -233 -47 0,00
Other (not economically active) 2,0 2,2 -27 -113 59 0,54
Rates (%)
Unemployment rate 4,9 3,2 3,6 -0,1 7,2 0,06
Employed/population ratio (absorption) 3,2 1,9 1,5 -0,9 3,8 0,22
Labour force participation rate 2,3 1,6 4,6 2,2 7,0 0,00
Eastern Cape - Non Metro
Population 15 - 64 yrs
Labour Force 3,8 2,2 158 67 248 0,00
Employed 5,1 2,3 38 -51 127 0,41
Unemployed 8,7 4,6 120 49 191 0,00
Not economically active 2,4 1,7 -126 -216 -36 0,01
Discouraged work-seekers 7,6 8,4 -114 -206 -22 0,02
Other (not economically active) 2,4 2,5 -12 -88 64 0,76
Rates (%)
Unemployment rate 8,2 3,3 6,1 0,4 11,8 0,04
Employed/population ratio (absorption) 5,1 2,3 1,0 -2,1 4,1 0,53
Labour force participation rate 3,8 2,2 5,1 1,9 8,2 0,00

STATISTICS SOUTH AFRICA P0211
Quarterly Labour Force Survey, Quarter 1, 2017
115
Appendix 2.3B: Sampling Variability for Labour Force Characteristics by Province
Coefficient of Variation Year-on-year
change
Lower 95%
Upper 95%
P-Value Oct-Dec 2016
Jan-Mar 2017
Eastern Cape - Buffalo City
Population 15 - 64 yrs
Labour Force 2,6 4,2 59 28 90 0,00
Employed 5,6 6,5 25 -2 53 0,07
Unemployed 7,3 8,3 34 19 48 0,00
Not economically active 4,1 10,9 -55 -86 -24 0,00
Discouraged work-seekers 20,9 33,5 -27 -39 -14 0,00
Other (not economically active) 2,3 10,5 -28 -59 2 0,07
Rates (%)
Unemployment rate 9,6 8,8 5,4 1,6 9,2 0,01
Employed/population ratio (absorption) 5,6 6,5 4,6 -0,9 10,2 0,10
Labour force participation rate 2,6 4,2 11,2 5,0 17,4 0,00
Eastern Cape - Nelson Mandela Bay
Population 15 - 64 yrs
Labour Force 2,4 2,0 -5 -31 21 0,70
Employed 3,7 3,5 13 -16 41 0,39
Unemployed 3,0 10,3 -18 -52 16 0,31
Not economically active 4,6 3,7 14 -12 40 0,28
Discouraged work-seekers . 68,6 1 0 3 0,15
Other (not economically active) 4,6 3,7 13 -13 39 0,33
Rates (%)
Unemployment rate 3,6 9,1 -3,1 -9,0 2,7 0,30
Employed/population ratio (absorption) 3,7 3,5 1,1 -2,5 4,7 0,56
Labour force participation rate 2,4 2,0 -1,4 -4,7 1,9 0,40

STATISTICS SOUTH AFRICA P0211
Quarterly Labour Force Survey, Quarter 1, 2017
116
Appendix 2.3B: Sampling Variability for Labour Force Characteristics by Province
Coefficient of Variation Year-on-year
change
Lower 95%
Upper 95%
P-Value Oct-Dec 2016
Jan-Mar 2017
Northern Cape
Population 15 - 64 yrs
Labour Force 3,4 2,9 -2 -19 14 0,78
Employed 3,7 5,6 -14 -51 23 0,45
Unemployed 10,0 6,1 12 -25 48 0,53
Not economically active 4,4 3,5 12 -5 29 0,16
Discouraged work-seekers 11,4 8,9 21 14 28 0,00
Other (not economically active) 3,6 3,5 -9 -28 10 0,36
Rates (%)
Unemployment rate 8,2 7,5 2,9 -5,6 11,3 0,51
Employed/population ratio (absorption) 3,7 5,6 -2,3 -7,0 2,4 0,34
Labour force participation rate 3,4 2,9 -1,0 -3,2 1,2 0,37
Free State
Population 15 - 64 yrs
Labour Force 2,1 1,6 -7 -57 42 0,77
Employed 3,2 3,5 -24 -93 46 0,51
Unemployed 4,6 3,9 16 -34 66 0,53
Not economically active 3,7 2,6 16 -34 65 0,54
Discouraged work-seekers 12,1 6,7 21 6 37 0,01
Other (not economically active) 3,7 3,0 -6 -57 46 0,82
Rates (%)
Unemployment rate 4,3 4,4 1,6 -2,9 6,0 0,49
Employed/population ratio (absorption) 3,2 3,5 -1,4 -5,1 2,3 0,45
Labour force participation rate 2,1 1,6 -0,7 -3,3 2,0 0,62

STATISTICS SOUTH AFRICA P0211
Quarterly Labour Force Survey, Quarter 1, 2017
117
Appendix 2.3B: Sampling Variability for Labour Force Characteristics by Province
Coefficient of Variation Year-on-year
change
Lower 95%
Upper 95%
P-Value Oct-Dec 2016
Jan-Mar 2017
Free State - Non Metro
Population 15 - 64 yrs
Labour Force 2,6 1,5 -13 -53 28 0,54
Employed 3,6 2,8 -5 -55 45 0,83
Unemployed 5,9 4,5 -7 -52 38 0,75
Not economically active 4,4 2,4 14 -26 55 0,49
Discouraged work-seekers 17,9 9,1 15 2 29 0,03
Other (not economically active) 4,4 2,6 -1 -46 44 0,95
Rates (%)
Unemployment rate 4,9 4,2 -0,3 -5,4 4,8 0,90
Employed/population ratio (absorption) 3,6 2,8 -0,4 -4,1 3,3 0,82
Labour force participation rate 2,6 1,5 -1,0 -4,0 2,0 0,51
Free State - Mangaung
Population 15 - 64 yrs
Labour Force 3,4 4,0 5 -25 35 0,73
Employed 6,5 9,8 -18 -68 32 0,48
Unemployed 5,6 7,4 23 2 45 0,03
Not economically active 6,8 7,9 1 -29 32 0,93
Discouraged work-seekers 9,3 8,4 6 -2 13 0,13
Other (not economically active) 7,0 9,6 -4 -30 22 0,74
Rates (%)
Unemployment rate 8,3 11,2 6,2 -2,5 14,9 0,16
Employed/population ratio (absorption) 6,5 9,8 -4,0 -13,4 5,4 0,40
Labour force participation rate 3,4 4,0 0,2 -5,5 5,9 0,96
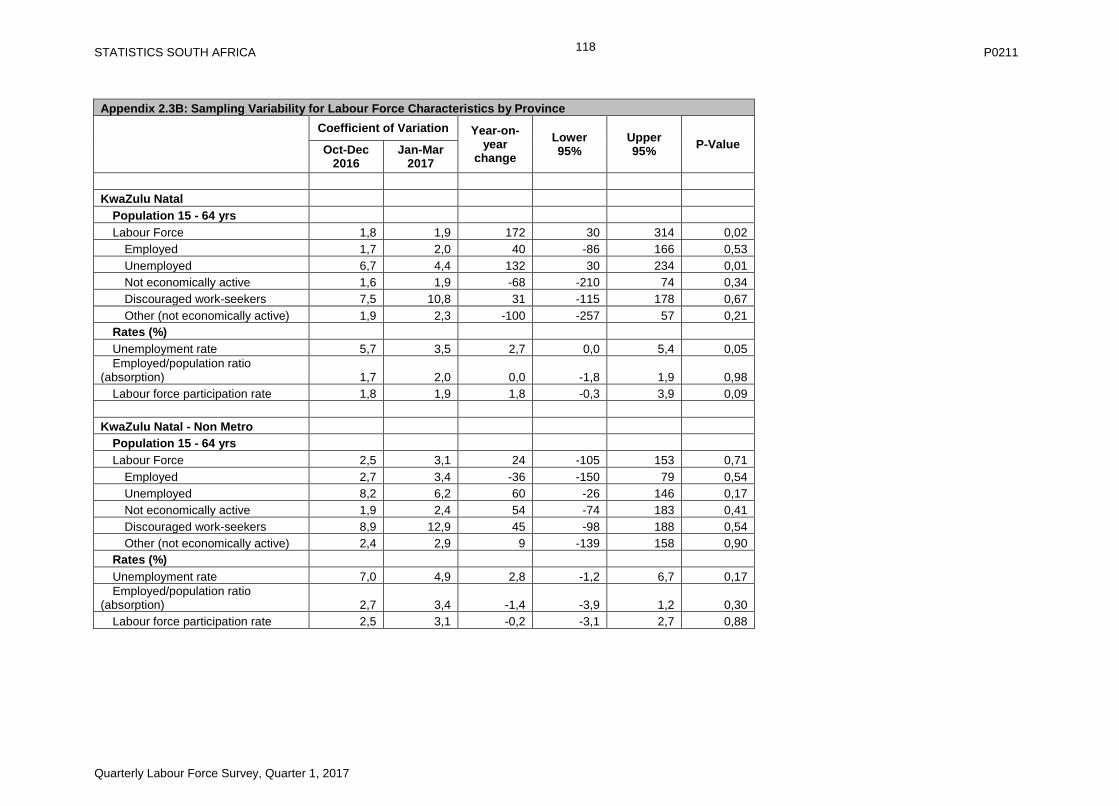
STATISTICS SOUTH AFRICA P0211
Quarterly Labour Force Survey, Quarter 1, 2017
118
Appendix 2.3B: Sampling Variability for Labour Force Characteristics by Province
Coefficient of Variation Year-on-year
change
Lower 95%
Upper 95%
P-Value Oct-Dec 2016
Jan-Mar 2017
KwaZulu Natal
Population 15 - 64 yrs
Labour Force 1,8 1,9 172 30 314 0,02
Employed 1,7 2,0 40 -86 166 0,53
Unemployed 6,7 4,4 132 30 234 0,01
Not economically active 1,6 1,9 -68 -210 74 0,34
Discouraged work-seekers 7,5 10,8 31 -115 178 0,67
Other (not economically active) 1,9 2,3 -100 -257 57 0,21
Rates (%)
Unemployment rate 5,7 3,5 2,7 0,0 5,4 0,05
Employed/population ratio (absorption) 1,7 2,0 0,0 -1,8 1,9 0,98
Labour force participation rate 1,8 1,9 1,8 -0,3 3,9 0,09
KwaZulu Natal - Non Metro
Population 15 - 64 yrs
Labour Force 2,5 3,1 24 -105 153 0,71
Employed 2,7 3,4 -36 -150 79 0,54
Unemployed 8,2 6,2 60 -26 146 0,17
Not economically active 1,9 2,4 54 -74 183 0,41
Discouraged work-seekers 8,9 12,9 45 -98 188 0,54
Other (not economically active) 2,4 2,9 9 -139 158 0,90
Rates (%)
Unemployment rate 7,0 4,9 2,8 -1,2 6,7 0,17
Employed/population ratio (absorption) 2,7 3,4 -1,4 -3,9 1,2 0,30
Labour force participation rate 2,5 3,1 -0,2 -3,1 2,7 0,88
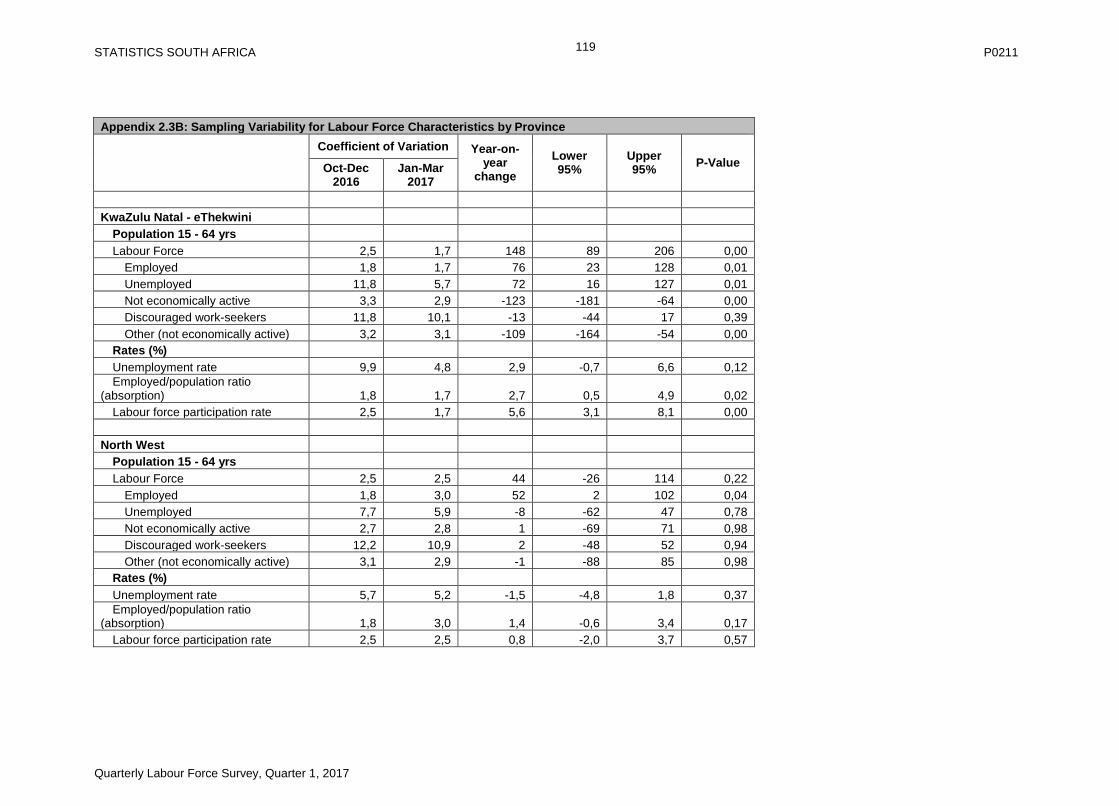
STATISTICS SOUTH AFRICA P0211
Quarterly Labour Force Survey, Quarter 1, 2017
119
Appendix 2.3B: Sampling Variability for Labour Force Characteristics by Province
Coefficient of Variation Year-on-year
change
Lower 95%
Upper 95%
P-Value Oct-Dec 2016
Jan-Mar 2017
KwaZulu Natal - eThekwini
Population 15 - 64 yrs
Labour Force 2,5 1,7 148 89 206 0,00
Employed 1,8 1,7 76 23 128 0,01
Unemployed 11,8 5,7 72 16 127 0,01
Not economically active 3,3 2,9 -123 -181 -64 0,00
Discouraged work-seekers 11,8 10,1 -13 -44 17 0,39
Other (not economically active) 3,2 3,1 -109 -164 -54 0,00
Rates (%)
Unemployment rate 9,9 4,8 2,9 -0,7 6,6 0,12
Employed/population ratio (absorption) 1,8 1,7 2,7 0,5 4,9 0,02
Labour force participation rate 2,5 1,7 5,6 3,1 8,1 0,00
North West
Population 15 - 64 yrs
Labour Force 2,5 2,5 44 -26 114 0,22
Employed 1,8 3,0 52 2 102 0,04
Unemployed 7,7 5,9 -8 -62 47 0,78
Not economically active 2,7 2,8 1 -69 71 0,98
Discouraged work-seekers 12,2 10,9 2 -48 52 0,94
Other (not economically active) 3,1 2,9 -1 -88 85 0,98
Rates (%)
Unemployment rate 5,7 5,2 -1,5 -4,8 1,8 0,37
Employed/population ratio (absorption) 1,8 3,0 1,4 -0,6 3,4 0,17
Labour force participation rate 2,5 2,5 0,8 -2,0 3,7 0,57

STATISTICS SOUTH AFRICA P0211
Quarterly Labour Force Survey, Quarter 1, 2017
120
Appendix 2.3B: Sampling Variability for Labour Force Characteristics by Province
Coefficient of Variation Year-on-year
change
Lower 95%
Upper 95%
P-Value Oct-Dec 2016
Jan-Mar 2017
Gauteng
Population 15 - 64 yrs
Labour Force 0,7 0,7 325 222 428 0,00
Employed 1,2 1,1 298 144 451 0,00
Unemployed 2,2 2,8 27 -107 161 0,69
Not economically active 1,8 1,9 -111 -214 -9 0,03
Discouraged work-seekers 11,4 10,4 -8 -64 47 0,76
Other (not economically active) 1,9 1,9 -103 -202 -4 0,04
Rates (%)
Unemployment rate 2,1 2,6 -1,0 -2,8 0,9 0,30
Employed/population ratio (absorption) 1,2 1,1 1,9 0,4 3,5 0,02
Labour force participation rate 0,7 0,7 1,7 0,7 2,8 0,00
Gauteng - Non Metro
Population 15 - 64 yrs
Labour Force 2,7 2,0 47 3 91 0,04
Employed 4,7 3,8 30 -36 96 0,37
Unemployed 10,0 8,0 17 -21 55 0,37
Not economically active 5,1 4,2 -32 -76 12 0,15
Discouraged work-seekers 23,2 20,5 -14 -36 9 0,23
Other (not economically active) 4,5 3,7 -19 -65 28 0,43
Rates (%)
Unemployment rate 9,3 7,6 0,3 -4,7 5,4 0,90
Employed/population ratio (absorption) 4,7 3,8 1,7 -3,3 6,7 0,50
Labour force participation rate 2,7 2,0 2,8 -0,5 6,2 0,10

STATISTICS SOUTH AFRICA P0211
Quarterly Labour Force Survey, Quarter 1, 2017
121
Appendix 2.3B: Sampling Variability for Labour Force Characteristics by Province
Coefficient of Variation Year-on-year
change
Lower 95%
Upper 95%
P-Value Oct-Dec 2016
Jan-Mar 2017
Gauteng - Ekurhuleni
Population 15 - 64 yrs
Labour Force 1,1 1,2 125 73 177 0,00
Employed 2,9 2,0 152 55 248 0,00
Unemployed 5,5 6,0 -26 -119 66 0,57
Not economically active 2,7 3,7 -82 -134 -30 0,00
Discouraged work-seekers 20,6 13,3 6 -23 35 0,68
Other (not economically active) 3,3 3,1 -88 -140 -35 0,00
Rates (%)
Unemployment rate 5,3 5,2 -3,7 -8,8 1,3 0,15
Employed/population ratio (absorption) 2,9 2,0 5,3 1,4 9,2 0,01
Labour force participation rate 1,1 1,2 3,8 1,7 5,9 0,00
Gauteng - City of Johannesburg
Population 15 - 64 yrs
Labour Force 0,9 1,0 31 -24 86 0,27
Employed 1,4 1,9 66 -16 149 0,12
Unemployed 2,3 5,2 -35 -116 45 0,39
Not economically active 3,0 3,1 65 10 120 0,02
Discouraged work-seekers 23,2 26,0 33 5 61 0,02
Other (not economically active) 2,8 3,2 32 -20 83 0,22
Rates (%)
Unemployment rate 2,3 4,9 -1,6 -4,4 1,2 0,26
Employed/population ratio (absorption) 1,4 1,9 0,4 -1,9 2,7 0,74
Labour force participation rate 0,9 1,0 -1,2 -2,7 0,3 0,12

STATISTICS SOUTH AFRICA P0211
Quarterly Labour Force Survey, Quarter 1, 2017
122
Appendix 2.3B: Sampling Variability for Labour Force Characteristics by Province
Coefficient of Variation Year-on-year
change
Lower 95%
Upper 95%
P-Value Oct-Dec 2016
Jan-Mar 2017
Gauteng - City of Tshwane
Population 15 - 64 yrs
Labour Force 1,7 1,7 122 68 175 0,00
Employed 2,3 2,2 50 -10 110 0,10
Unemployed 4,2 4,2 72 30 114 0,00
Not economically active 4,1 4,8 -63 -116 -10 0,02
Discouraged work-seekers 19,9 24,8 -34 -65 -4 0,03
Other (not economically active) 4,9 5,1 -29 -78 21 0,26
Rates (%)
Unemployment rate 3,9 3,7 2,3 -0,1 4,6 0,06
Employed/population ratio (absorption) 2,3 2,2 0,8 -1,7 3,3 0,54
Labour force participation rate 1,7 1,7 3,3 1,1 5,5 0,00
Mpumalanga
Population 15 - 64 yrs
Labour Force 1,5 2,0 123 50 196 0,00
Employed 2,2 2,6 57 2 111 0,04
Unemployed 4,6 4,5 67 6 128 0,03
Not economically active 2,1 3,3 -72 -145 1 0,05
Discouraged work-seekers 10,4 12,5 -18 -70 34 0,49
Other (not economically active) 2,4 2,8 -54 -112 4 0,07
Rates (%)
Unemployment rate 4,2 3,9 1,7 -1,1 4,5 0,24
Employed/population ratio (absorption) 2,2 2,6 1,2 -0,7 3,2 0,21
Labour force participation rate 1,5 2,0 3,3 0,7 5,9 0,01
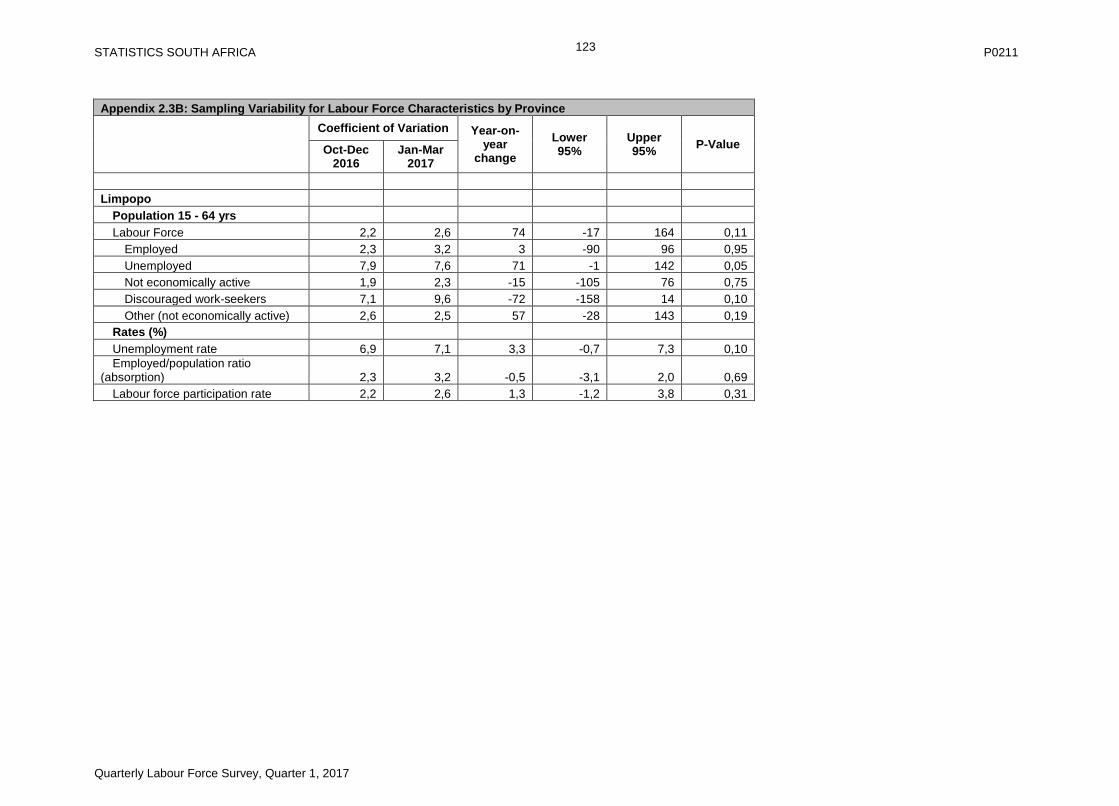
STATISTICS SOUTH AFRICA P0211
Quarterly Labour Force Survey, Quarter 1, 2017
123
Appendix 2.3B: Sampling Variability for Labour Force Characteristics by Province
Coefficient of Variation Year-on-year
change
Lower 95%
Upper 95%
P-Value Oct-Dec 2016
Jan-Mar 2017
Limpopo
Population 15 - 64 yrs
Labour Force 2,2 2,6 74 -17 164 0,11
Employed 2,3 3,2 3 -90 96 0,95
Unemployed 7,9 7,6 71 -1 142 0,05
Not economically active 1,9 2,3 -15 -105 76 0,75
Discouraged work-seekers 7,1 9,6 -72 -158 14 0,10
Other (not economically active) 2,6 2,5 57 -28 143 0,19
Rates (%)
Unemployment rate 6,9 7,1 3,3 -0,7 7,3 0,10
Employed/population ratio (absorption) 2,3 3,2 -0,5 -3,1 2,0 0,69
Labour force participation rate 2,2 2,6 1,3 -1,2 3,8 0,31
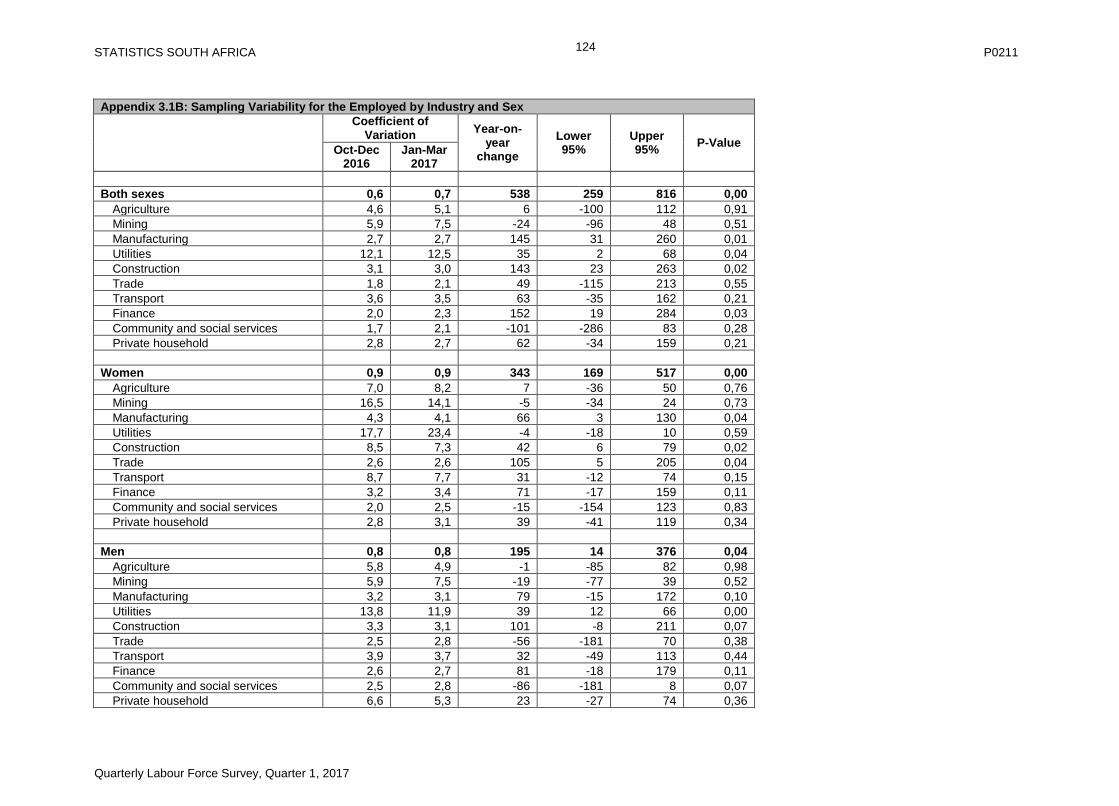
STATISTICS SOUTH AFRICA P0211
Quarterly Labour Force Survey, Quarter 1, 2017
124
Appendix 3.1B: Sampling Variability for the Employed by Industry and Sex
Coefficient of Variation
Year-on-year
change
Lower 95%
Upper 95%
P-Value Oct-Dec
2016 Jan-Mar
2017
Both sexes 0,6 0,7 538 259 816 0,00
Agriculture 4,6 5,1 6 -100 112 0,91
Mining 5,9 7,5 -24 -96 48 0,51
Manufacturing 2,7 2,7 145 31 260 0,01
Utilities 12,1 12,5 35 2 68 0,04
Construction 3,1 3,0 143 23 263 0,02
Trade 1,8 2,1 49 -115 213 0,55
Transport 3,6 3,5 63 -35 162 0,21
Finance 2,0 2,3 152 19 284 0,03
Community and social services 1,7 2,1 -101 -286 83 0,28
Private household 2,8 2,7 62 -34 159 0,21
Women 0,9 0,9 343 169 517 0,00
Agriculture 7,0 8,2 7 -36 50 0,76
Mining 16,5 14,1 -5 -34 24 0,73
Manufacturing 4,3 4,1 66 3 130 0,04
Utilities 17,7 23,4 -4 -18 10 0,59
Construction 8,5 7,3 42 6 79 0,02
Trade 2,6 2,6 105 5 205 0,04
Transport 8,7 7,7 31 -12 74 0,15
Finance 3,2 3,4 71 -17 159 0,11
Community and social services 2,0 2,5 -15 -154 123 0,83
Private household 2,8 3,1 39 -41 119 0,34
Men 0,8 0,8 195 14 376 0,04
Agriculture 5,8 4,9 -1 -85 82 0,98
Mining 5,9 7,5 -19 -77 39 0,52
Manufacturing 3,2 3,1 79 -15 172 0,10
Utilities 13,8 11,9 39 12 66 0,00
Construction 3,3 3,1 101 -8 211 0,07
Trade 2,5 2,8 -56 -181 70 0,38
Transport 3,9 3,7 32 -49 113 0,44
Finance 2,6 2,7 81 -18 179 0,11
Community and social services 2,5 2,8 -86 -181 8 0,07
Private household 6,6 5,3 23 -27 74 0,36
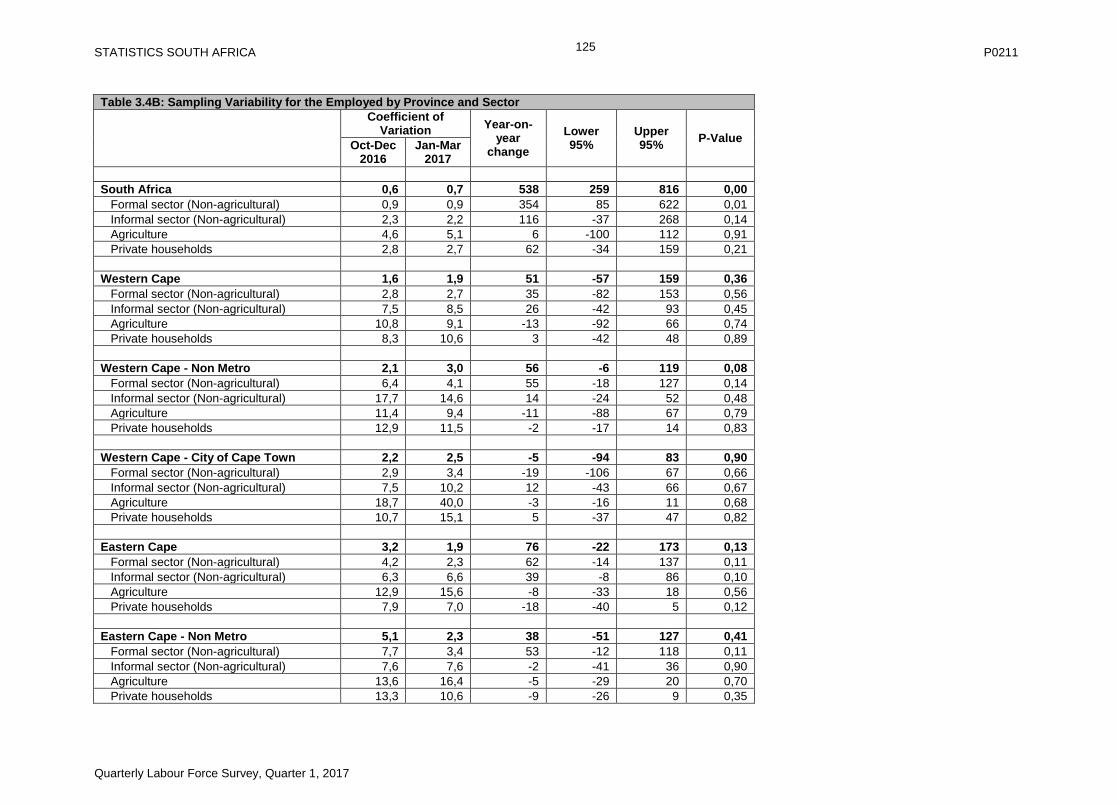
STATISTICS SOUTH AFRICA P0211
Quarterly Labour Force Survey, Quarter 1, 2017
125
Table 3.4B: Sampling Variability for the Employed by Province and Sector
Coefficient of Variation
Year-on-year
change
Lower 95%
Upper 95%
P-Value Oct-Dec
2016 Jan-Mar
2017
South Africa 0,6 0,7 538 259 816 0,00
Formal sector (Non-agricultural) 0,9 0,9 354 85 622 0,01
Informal sector (Non-agricultural) 2,3 2,2 116 -37 268 0,14
Agriculture 4,6 5,1 6 -100 112 0,91
Private households 2,8 2,7 62 -34 159 0,21
Western Cape 1,6 1,9 51 -57 159 0,36
Formal sector (Non-agricultural) 2,8 2,7 35 -82 153 0,56
Informal sector (Non-agricultural) 7,5 8,5 26 -42 93 0,45
Agriculture 10,8 9,1 -13 -92 66 0,74
Private households 8,3 10,6 3 -42 48 0,89
Western Cape - Non Metro 2,1 3,0 56 -6 119 0,08
Formal sector (Non-agricultural) 6,4 4,1 55 -18 127 0,14
Informal sector (Non-agricultural) 17,7 14,6 14 -24 52 0,48
Agriculture 11,4 9,4 -11 -88 67 0,79
Private households 12,9 11,5 -2 -17 14 0,83
Western Cape - City of Cape Town 2,2 2,5 -5 -94 83 0,90
Formal sector (Non-agricultural) 2,9 3,4 -19 -106 67 0,66
Informal sector (Non-agricultural) 7,5 10,2 12 -43 66 0,67
Agriculture 18,7 40,0 -3 -16 11 0,68
Private households 10,7 15,1 5 -37 47 0,82
Eastern Cape 3,2 1,9 76 -22 173 0,13
Formal sector (Non-agricultural) 4,2 2,3 62 -14 137 0,11
Informal sector (Non-agricultural) 6,3 6,6 39 -8 86 0,10
Agriculture 12,9 15,6 -8 -33 18 0,56
Private households 7,9 7,0 -18 -40 5 0,12
Eastern Cape - Non Metro 5,1 2,3 38 -51 127 0,41
Formal sector (Non-agricultural) 7,7 3,4 53 -12 118 0,11
Informal sector (Non-agricultural) 7,6 7,6 -2 -41 36 0,90
Agriculture 13,6 16,4 -5 -29 20 0,70
Private households 13,3 10,6 -9 -26 9 0,35
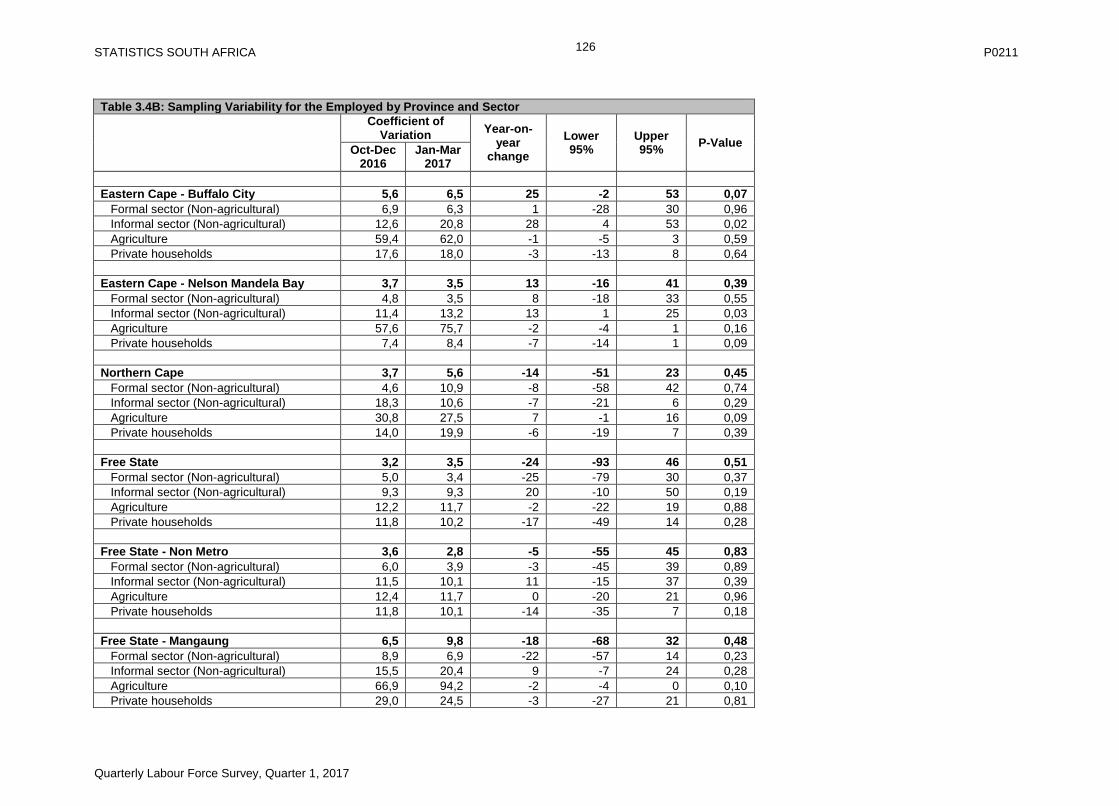
STATISTICS SOUTH AFRICA P0211
Quarterly Labour Force Survey, Quarter 1, 2017
126
Table 3.4B: Sampling Variability for the Employed by Province and Sector
Coefficient of Variation
Year-on-year
change
Lower 95%
Upper 95%
P-Value Oct-Dec
2016 Jan-Mar
2017
Eastern Cape - Buffalo City 5,6 6,5 25 -2 53 0,07
Formal sector (Non-agricultural) 6,9 6,3 1 -28 30 0,96
Informal sector (Non-agricultural) 12,6 20,8 28 4 53 0,02
Agriculture 59,4 62,0 -1 -5 3 0,59
Private households 17,6 18,0 -3 -13 8 0,64
Eastern Cape - Nelson Mandela Bay 3,7 3,5 13 -16 41 0,39
Formal sector (Non-agricultural) 4,8 3,5 8 -18 33 0,55
Informal sector (Non-agricultural) 11,4 13,2 13 1 25 0,03
Agriculture 57,6 75,7 -2 -4 1 0,16
Private households 7,4 8,4 -7 -14 1 0,09
Northern Cape 3,7 5,6 -14 -51 23 0,45
Formal sector (Non-agricultural) 4,6 10,9 -8 -58 42 0,74
Informal sector (Non-agricultural) 18,3 10,6 -7 -21 6 0,29
Agriculture 30,8 27,5 7 -1 16 0,09
Private households 14,0 19,9 -6 -19 7 0,39
Free State 3,2 3,5 -24 -93 46 0,51
Formal sector (Non-agricultural) 5,0 3,4 -25 -79 30 0,37
Informal sector (Non-agricultural) 9,3 9,3 20 -10 50 0,19
Agriculture 12,2 11,7 -2 -22 19 0,88
Private households 11,8 10,2 -17 -49 14 0,28
Free State - Non Metro 3,6 2,8 -5 -55 45 0,83
Formal sector (Non-agricultural) 6,0 3,9 -3 -45 39 0,89
Informal sector (Non-agricultural) 11,5 10,1 11 -15 37 0,39
Agriculture 12,4 11,7 0 -20 21 0,96
Private households 11,8 10,1 -14 -35 7 0,18
Free State - Mangaung 6,5 9,8 -18 -68 32 0,48
Formal sector (Non-agricultural) 8,9 6,9 -22 -57 14 0,23
Informal sector (Non-agricultural) 15,5 20,4 9 -7 24 0,28
Agriculture 66,9 94,2 -2 -4 0 0,10
Private households 29,0 24,5 -3 -27 21 0,81
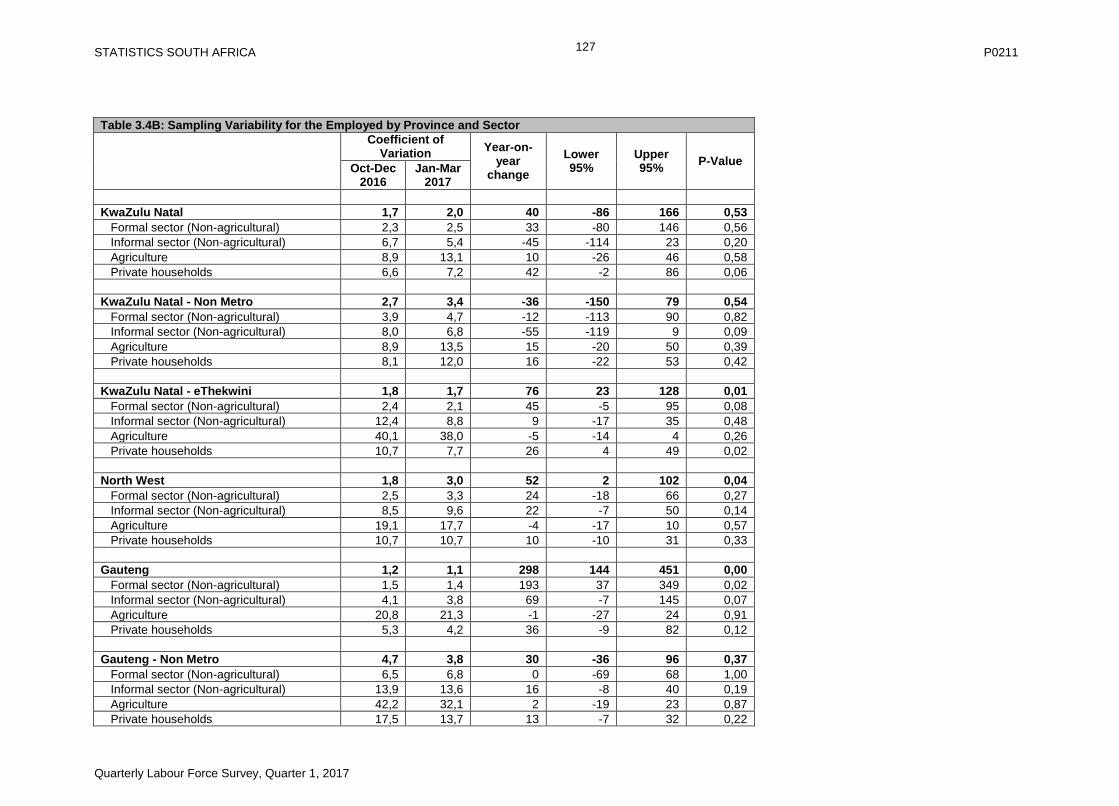
STATISTICS SOUTH AFRICA P0211
Quarterly Labour Force Survey, Quarter 1, 2017
127
Table 3.4B: Sampling Variability for the Employed by Province and Sector
Coefficient of Variation
Year-on-year
change
Lower 95%
Upper 95%
P-Value Oct-Dec
2016 Jan-Mar
2017
KwaZulu Natal 1,7 2,0 40 -86 166 0,53
Formal sector (Non-agricultural) 2,3 2,5 33 -80 146 0,56
Informal sector (Non-agricultural) 6,7 5,4 -45 -114 23 0,20
Agriculture 8,9 13,1 10 -26 46 0,58
Private households 6,6 7,2 42 -2 86 0,06
KwaZulu Natal - Non Metro 2,7 3,4 -36 -150 79 0,54
Formal sector (Non-agricultural) 3,9 4,7 -12 -113 90 0,82
Informal sector (Non-agricultural) 8,0 6,8 -55 -119 9 0,09
Agriculture 8,9 13,5 15 -20 50 0,39
Private households 8,1 12,0 16 -22 53 0,42
KwaZulu Natal - eThekwini 1,8 1,7 76 23 128 0,01
Formal sector (Non-agricultural) 2,4 2,1 45 -5 95 0,08
Informal sector (Non-agricultural) 12,4 8,8 9 -17 35 0,48
Agriculture 40,1 38,0 -5 -14 4 0,26
Private households 10,7 7,7 26 4 49 0,02
North West 1,8 3,0 52 2 102 0,04
Formal sector (Non-agricultural) 2,5 3,3 24 -18 66 0,27
Informal sector (Non-agricultural) 8,5 9,6 22 -7 50 0,14
Agriculture 19,1 17,7 -4 -17 10 0,57
Private households 10,7 10,7 10 -10 31 0,33
Gauteng 1,2 1,1 298 144 451 0,00
Formal sector (Non-agricultural) 1,5 1,4 193 37 349 0,02
Informal sector (Non-agricultural) 4,1 3,8 69 -7 145 0,07
Agriculture 20,8 21,3 -1 -27 24 0,91
Private households 5,3 4,2 36 -9 82 0,12
Gauteng - Non Metro 4,7 3,8 30 -36 96 0,37
Formal sector (Non-agricultural) 6,5 6,8 0 -69 68 1,00
Informal sector (Non-agricultural) 13,9 13,6 16 -8 40 0,19
Agriculture 42,2 32,1 2 -19 23 0,87
Private households 17,5 13,7 13 -7 32 0,22
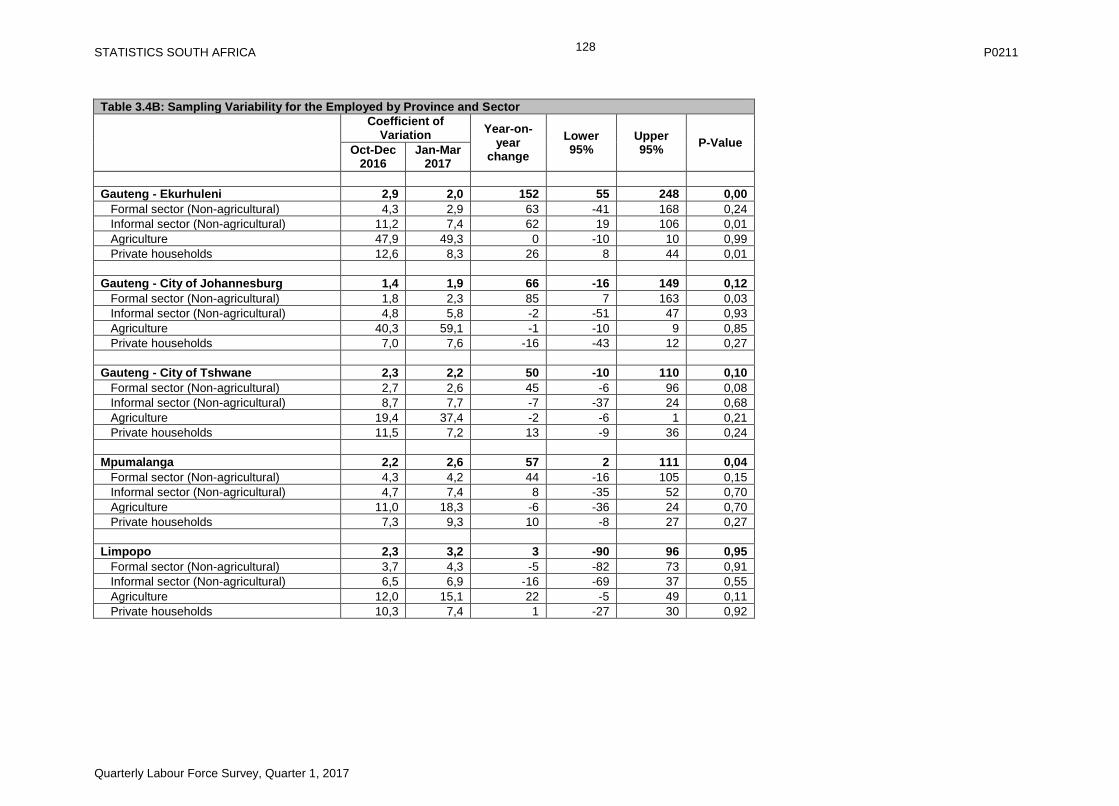
STATISTICS SOUTH AFRICA P0211
Quarterly Labour Force Survey, Quarter 1, 2017
128
Table 3.4B: Sampling Variability for the Employed by Province and Sector
Coefficient of Variation
Year-on-year
change
Lower 95%
Upper 95%
P-Value Oct-Dec
2016 Jan-Mar
2017
Gauteng - Ekurhuleni 2,9 2,0 152 55 248 0,00
Formal sector (Non-agricultural) 4,3 2,9 63 -41 168 0,24
Informal sector (Non-agricultural) 11,2 7,4 62 19 106 0,01
Agriculture 47,9 49,3 0 -10 10 0,99
Private households 12,6 8,3 26 8 44 0,01
Gauteng - City of Johannesburg 1,4 1,9 66 -16 149 0,12
Formal sector (Non-agricultural) 1,8 2,3 85 7 163 0,03
Informal sector (Non-agricultural) 4,8 5,8 -2 -51 47 0,93
Agriculture 40,3 59,1 -1 -10 9 0,85
Private households 7,0 7,6 -16 -43 12 0,27
Gauteng - City of Tshwane 2,3 2,2 50 -10 110 0,10
Formal sector (Non-agricultural) 2,7 2,6 45 -6 96 0,08
Informal sector (Non-agricultural) 8,7 7,7 -7 -37 24 0,68
Agriculture 19,4 37,4 -2 -6 1 0,21
Private households 11,5 7,2 13 -9 36 0,24
Mpumalanga 2,2 2,6 57 2 111 0,04
Formal sector (Non-agricultural) 4,3 4,2 44 -16 105 0,15
Informal sector (Non-agricultural) 4,7 7,4 8 -35 52 0,70
Agriculture 11,0 18,3 -6 -36 24 0,70
Private households 7,3 9,3 10 -8 27 0,27
Limpopo 2,3 3,2 3 -90 96 0,95
Formal sector (Non-agricultural) 3,7 4,3 -5 -82 73 0,91
Informal sector (Non-agricultural) 6,5 6,9 -16 -69 37 0,55
Agriculture 12,0 15,1 22 -5 49 0,11
Private households 10,3 7,4 1 -27 30 0,92
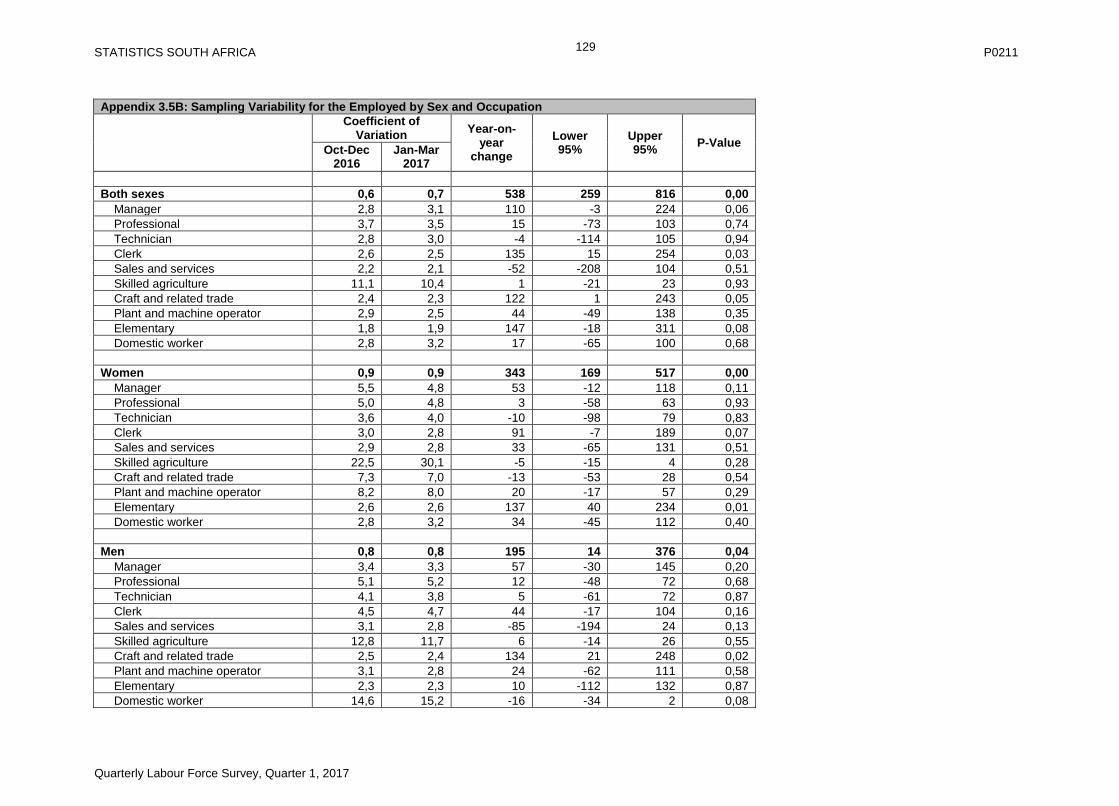
STATISTICS SOUTH AFRICA P0211
Quarterly Labour Force Survey, Quarter 1, 2017
129
Appendix 3.5B: Sampling Variability for the Employed by Sex and Occupation
Coefficient of Variation
Year-on-year
change
Lower 95%
Upper 95%
P-Value Oct-Dec
2016 Jan-Mar
2017
Both sexes 0,6 0,7 538 259 816 0,00
Manager 2,8 3,1 110 -3 224 0,06
Professional 3,7 3,5 15 -73 103 0,74
Technician 2,8 3,0 -4 -114 105 0,94
Clerk 2,6 2,5 135 15 254 0,03
Sales and services 2,2 2,1 -52 -208 104 0,51
Skilled agriculture 11,1 10,4 1 -21 23 0,93
Craft and related trade 2,4 2,3 122 1 243 0,05
Plant and machine operator 2,9 2,5 44 -49 138 0,35
Elementary 1,8 1,9 147 -18 311 0,08
Domestic worker 2,8 3,2 17 -65 100 0,68
Women 0,9 0,9 343 169 517 0,00
Manager 5,5 4,8 53 -12 118 0,11
Professional 5,0 4,8 3 -58 63 0,93
Technician 3,6 4,0 -10 -98 79 0,83
Clerk 3,0 2,8 91 -7 189 0,07
Sales and services 2,9 2,8 33 -65 131 0,51
Skilled agriculture 22,5 30,1 -5 -15 4 0,28
Craft and related trade 7,3 7,0 -13 -53 28 0,54
Plant and machine operator 8,2 8,0 20 -17 57 0,29
Elementary 2,6 2,6 137 40 234 0,01
Domestic worker 2,8 3,2 34 -45 112 0,40
Men 0,8 0,8 195 14 376 0,04
Manager 3,4 3,3 57 -30 145 0,20
Professional 5,1 5,2 12 -48 72 0,68
Technician 4,1 3,8 5 -61 72 0,87
Clerk 4,5 4,7 44 -17 104 0,16
Sales and services 3,1 2,8 -85 -194 24 0,13
Skilled agriculture 12,8 11,7 6 -14 26 0,55
Craft and related trade 2,5 2,4 134 21 248 0,02
Plant and machine operator 3,1 2,8 24 -62 111 0,58
Elementary 2,3 2,3 10 -112 132 0,87
Domestic worker 14,6 15,2 -16 -34 2 0,08