GUIDANCE PACK FOR APPLICATION OF THE EMISSION LICENCE …
49
GUIDANCE PACK FOR APPLICATION OF THE EMISSION LICENCE FOR STATIONARY SOURCES AS PER AIR QUALITY REGULATIONS, 2014. Contents (1) Form IV: Application for Initial Emission License (2) Annex 1: Guidelines on Filling the Emission License Application Form (3) Annex 2: Stack Emission Report Format (4) Annex 3: Ambient Air Quality Monitoring Report Format (5) Annex 4: Guidelines for Construction of Particulate Matter Sampling and Testing Facilities (6) Annex 5: List of laboratories designated by NEMA to carry out air quality measurements (7) Annex 6: Emission License Fees as per the 13 th Schedule (8) Annex 7: List of Controlled Areas as per 6 th Schedule (9) Annex 8 : Emission Limits for Controlled and Non-Controlled Facilities 3 rd Schedule (10) Annex 9: Acceptable Emission Control Technologies 8 th Schedule 1
Transcript of GUIDANCE PACK FOR APPLICATION OF THE EMISSION LICENCE …

GUIDANCE PACK FOR APPLICATION OF THE EMISSION LICENCE FOR STATIONARY
SOURCES AS PER AIR QUALITY REGULATIONS, 2014.
Contents (1) Form IV: Application for Initial Emission License (2) Annex 1: Guidelines on Filling the Emission License Application Form (3) Annex 2: Stack Emission Report Format (4) Annex 3: Ambient Air Quality Monitoring Report Format (5) Annex 4: Guidelines for Construction of Particulate Matter Sampling and Testing
Facilities (6) Annex 5: List of laboratories designated by NEMA to carry out air
quality measurements (7) Annex 6: Emission License Fees as per the 13th Schedule (8) Annex 7: List of Controlled Areas as per 6th Schedule (9) Annex 8 : Emission Limits for Controlled and Non-Controlled Facilities 3rd Schedule (10) Annex 9: Acceptable Emission Control Technologies 8th Schedule
1

NINTH SCHEDULE
EMISSION LICENSES
r41
Form IV: Application for Initial Emission License
1. Name of Company ………………………………………….. 2. Address
P.O. Box……………………..
Tel………… …….Fax……………… E-mail………… ……….
Name of Contact Person …………………………….
3. Location
LR No…………… Street………… Area………. Division……….
Town………….District………………….. Province………………
4. Type of Industry………………………………………………………………………..
5. Name(s) of emitting Equipment…………………… ……………………………………………………………………………………………………… ……………………………………………………………………………………………………… ……………………………………………………………………………………… ……………………………………………………………………………………………………… ……………………………………………………………………………………………
6. Site Plan Layout, (attach sketch)
(a) Distance of the Stack to the nearest building…………………………………
(b) Height of the above referred building……………………………………………… (c) Nearest sensitive area or facility………………………………………………………
(d) Immission (fall-out) point……………………………………………………………..
7. Operating Emission levels (i) ……………………………………………………………………………………
(ii) …………………………………………………………………………………… (iii) ……………………………………………………………………………………
(iv) ……………………………………………………………………………………
8. Proposed Emission Control Mitigation Measures
(v) …………………………………………………………………………………… (vi) ……………………………………………………………………………………
(vii) …………………………………………………………………………………… (viii) ……………………………………………………………………………………
2

9. Additional information required …………………………………………………
10. Start-up, and shut-down of the equipment a) Methods………………………………………………………
b) Expected Frequency of Occurrence ……………………… c) Duration of occurrence…………………………………….…
d) Projected emitted Pollutants
(i) ………………………………………………………………… (ii) …………………………………………………………………
(iii) ………………………………………………………………… (iv) …………………………………………………………………
11. (a) Nature of emissions (gaseous, Particulates)
(i) …………………………………………………………………
(ii) ………………………………………………………………… (iii) …………………………………………………………………
(iv) …………………………………………………………………
(b) Concentration of the emissions (i) ………………………………………………………………………………
(ii) …………………………………………………………………………………
(iii) …………………………………………………………………………………
Signature of Applicant ……………..Date……………………………
Position ……….………………………………………
FOR OFFICIAL USE
Approved/Not approved…………………………………………………….
Dated this………………….day…………….of 20…….
Signature……………………………………
(Seal)
3

ANNEX 1: GUIDELINES ON FILLING THE EMISSION LICENCE APPLICATION
FORM
Form IV: Application for Initial Emission License r41
1. Name of Company: (As indicated in the Certificate of Registration) 2. Address:
P.O. Box: (As indicated in the Letter Head)
Tel: (As above); Fax: (As above); E-mail: (official email details)
Name of Contact Person: (Legal Entity of the company)
3. Location LR No. (As indicated in the title deed); Street: (Name of road or street); Area: (Name of the location); Division: (Name of Sub-County); Town: (Name of
urban center); District: (Name of County); Province: NA
4. Type of Industry: (Indicate production sector)
5. Name(s) of emitting Equipment: e.g.:
a) Generators;
b) Boilers
c) Incinerators d) Production equipment
6. Site Plan Layout, (attach sketch) (a) Distance of the Stack to the nearest building (X meters) (b) Height of the above referred building(Y meters)
(c)Nearest sensitive area or facility (As guided under 6th Schedule - Annex 6) (d) Immission (fall-out) point (Point determined from the dispersion model)
7. Operating Emission levels: (Allowable emission limits as indicated in the 3rd Schedule –Annex 7)
For instance:
(a) Parameter: V µg/Nm3
(b) Parameter: X µg/Nm3 (c) Parameter: Y µg/Nm3
(d) Parameter: Z µg/Nm3
8. Proposed Emission Control Mitigation Measures: (As guided under 7th Schedule-
Annex 8) For instance:
(a) PM – Mechanical Collectors (cyclones) (b) VOC – Adsorption/absorption systems, flares, oxidizers and bio filters
4

(c) SOX – dry or wet scrubbers
(d) NOX – Catalytic reduction systems or EGR
9. Additional information required: Attach Stack Emission Report and Ambient Air Quality Monitoring Report as per the attached report format – Annex 2 and Annex
3 respectively.
NB. Stack Emission and Ambient Air Quality Measurements shall be carried out
by a laboratory designated by NEMA for the Air media. (List of designated
laboratories indicated under Annex-4)
10. Start-up, and shut-down of the equipment a) Methods. Emission Reduction measures b) Expected Frequency of Occurrence: (Number of times in a day) c) Duration of occurrence: (Time in minutes and start time of the
occurrence)
d) Projected emitted Pollutants For instance:
(i) Particulate Matter
(ii) Volatile Organic Compounds (iii) Sulphur Oxides
11. (a).Nature of emissions (gaseous, Particulates) (i) Particulates
(ii) Gaseous (iii) Odour
(b) Concentration of the emissions Emission Results from the stack emission report. (a) Parameter: V1 µg/Nm3
(b) Parameter: X1 µg/Nm3
(c) Parameter: Y1 µg/Nm3 (d) Parameter: Z1 µg/Nm3
Signature of Applicant ……………..Date……………………………
Position (Designation of the legal entity
FOR OFFICIAL USE
Approved/Not approved…………………………………………………….
Dated this………………….day…………….of 20…….
Signature…………………………………… (Seal)
NB. Attach a copy of bank deposit slip for payment of Emission licence and its
application fees as guided under Annex 5.
5

Annex 2: Stack Emission Measurement Report Format
The results summary report must be signed by the licensee.
2(a) Format for the Stack Emission Measurement Report
The stack emission measurements report must include:
1.0 General Source Information
1.1 Name of facility
1.2 Location of plant (Physical address)
1.3 GPS Reference
1.4 Legal Entity at the facility including their telephone numbers and Email
1.5 Certification by the legal
2.0 Testing Firm Information
2.1 Name and address of the firm conducting the testing and Analysis.
2.2 Responsible person at the testing firm and telephone number.
2.3 Certification by team leader
2.4 Certification by reviewer
3.0 Introduction
3.1 Purpose of the test
3.2 Date and time of the test
3.3 Test location
3.4 Type of process
3.5 Air Pollutants tested
3.6 Aim of the Measurements
3.6 Observers' names if available
3.7 Any other important background information
4.0 Objective
4.1 Statement of objectives of the monitoring plan
4.2 Specific objectives
5.0 Production Process Information
5.1 Representative raw materials and operation
5.2 Types of fuel used in production
5.3 A description of the process equipment, including a process flow sheet.
5.4 Type and quantity of raw materials, catalysts, and products being used or
produced in the process.
5.5 Maximum rated capacity of the process.
5.6 Actual maximum operating capacity of the process.
5.7 Operating capacity during the previous six-months period.
5.8 Process data being monitored and recorded to ensure representative operation
throughout the test, including during the sampling interval.
5.9 Normal process operating schedule during a 24-hour period.
5.10 Normal maintenance schedule for this process.
.

6.0 Emission Control Equipment:
6.1 Description of emission control system, including the types of control equipment,
manufacturer of control equipment, the rated capacity and efficiency of the control
equipment.
6.2 Schematic diagram identifying gas flow from source point to exit point, including
identification of all control devices, fans and bypasses
6.3 Data to be monitored and recorded to ensure representative operation of the
control equipment during testing and the sampling period for recording.
6.4 Minimum acceptable values of all control devices parameters such as flow rates,
pressure drops, temperature, and voltage of electrical input.
6.5 Description of any preconditioning of gases used with control equipment.
6.6 Normal maintenance schedule on control equipment for the previous year
6.7 Description of source and control devises.
6.7 Process and control equipment diagram.
6.8 Process and control equipment data.
6.9 Demonstration of any specially-required operation
8.0 Operating Conditions
8.1 Type of process.
8.2 Plant operating conditions during the test
8.3 Brief description of the section of the plant under test relating it to the
entire plant
9.0 Monitoring Plan Details:
9.1 Name and model of equipment used,
9.2 A description of the emission sampling and analysis equipment including a
schematic diagram of the sampling train.
9.3 Calibration certificates of the equipment;
9.4 Methods of measurement applied, and
9.5 Quality assurance program; and
9.6 Relevant quality control steps for the monitoring
10.0 Stack Details:
10.1 Internal stack/duct diameters or stack/duct dimensions (metres) at the test
plane;
10.2 Internal stack/duct diameter or stack/duct dimensions (metres) at the outlet of
the stack;
10.3 Stack height in metres above ground level;
10.4 Location of sampling plane with respect to the nearest upstream and
downstream flow disturbances
10.5 Stack/duct location (latitude and longitude with datum reference) and reference
within the plant altitude above mean sea level of the base of the stack;
10.6 Attach photographs of the full stack showing measurements in progress.
10.7 Attach photographs of the full emission plume from the stack outlet while
measurements are ongoing
11.0 Details of the Sampling Point:

11.1 Description of the number of sampling ports;
11.2 A scale diagram showing each discharge point with each testing access
port; and
11.3 Distances from upstream and downstream flow disturbances;
11.4 A scale diagram showing the sampling platform and access;
11.5 the dimensions of all access ports.
11.6 Sampling port location and cross-section with dimensions.
11.7 Sampling port description, including labeling systems
12.0 Emission Point Information:
12.1 A diagram of the stack showing the dimensions, and the configuration of the
sampling location, location of continuous emission monitor (CEM) probes, and the
distances to the nearest upstream and downstream flow interferences.
12.2 A cross-sectional sketch of the stack at the sampling location, showing the
locations of the sampling traverse points.
12.3 Estimated flue gas conditions at the sampling location, including temperature,
moisture content, and velocity.
13.0 Test Methods
13.1Types of pollutants to be sampled and analysed
13.2 A description of the sampling and analysis procedures
13.3 Brief description of test procedure(s) used and any variations from those
procedure(s) and reasons for selecting non-recommended methods;
13.4 Description of analysis procedures, and any deviations from standard
procedures
13.5 Documentation for any proposed variations from approved/standard
procedures
13.6 Sample time if different than recommended
13.7 Table of results from the run summaries and raw data
13.8 Provide sample calculations
13.9 Attach raw data countersigned by the Proponent and Authority
Representative(Observer)
14.0 Data and Results
14.1 Gaseous Emissions
a) A photograph of the whole stack presenting sampling in progress for gaseous
emissions and of the stack sampling point.
b) Legible copies of the measuring equipment data-Logger print-outs.
c) Table of raw data
d) Table of results referenced to STP and corrected for the relevant gas
concentration
14.2 Particulate Matter Emissions
a) Sampling dates
b) Sampling time (min)
c) End of run dry gas meter reading (m3)
d) Start of run dry gas meter reading (m3)

e) Total Volume sampled (≥1m3)
f) Standard volume sampled (dsm3)
g) Moisture content, % v/v or w/v;
h) Average stack/duct gas temperature, K or degrees Celsius;
i) Average stack/duct gas velocity (metres/second) at STP;
j) Average ambient barometric pressure during the test (kilopascals);
k) Average stack/duct gas pressure during the test (Pascals);
l) Average stack/duct gas flow rate, (cubic metres/second) at STP
m) Dry standard particulate concentration corrected (mg corr.Dsm-3 )
n) Average Oxygen content
o) Percent isokinetic (%I)
p) Composition of stack/duct gas where applicable, % volume, dry basis;
q) Concentration of the pollutant under test such as total particulates, heavy
r) metals, or any specific gaseous pollutant, mg/m3 at STP, dry basis, adjusted if
s) necessary to reference conditions;
t) Particulate emission rate(kghr-1 )
u) Estimate of the measure of uncertainty for the test results;
v) Comments on whether data exceed the Authority emission limits and any
other factors which may have affected results.
w) Photographs of the used particulate matter filters for all the runs x) Ensure that the number of runs conform to statistical norms
15.0 Data Sheets:
Copies of all field data sheets used during the test, including data sheets used to
record process and control equipment parameters.
16.0 Chain of Custody:
a) A description of the procedures that were followed to maintain the integrity of the
samples collected.
b) Copies of chain of custody seals and data sheets.
17.0 Quality Control:
a) Calibration sheets for the dry gas meter, pitot tube, nozzle, and other equipment
requiring calibration.
b) Quality assurance control charts for the analytical procedures used in the analysis of
the test samples.
c) A list of pre-weighed filters during particulate emissions testing.
18.0 Summary of Results
a) Process data
b) Emission results.
c) Allowable emissions.
d) Discussion of errors, both real and apparent.
19.0 Discussion and Recommendations
20.0 Annexes
a) Complete results with example calculations.
b) Copies of original field and laboratory data sheets.

c) Copies of original production data signed by plant official.
d) Test log- data loggers
e) Project participants and titles.
f) Related correspondence.
NB.
(i) If an air pollutant cannot be detected, results must not be quoted as zero but as less
than the method’s limit of detection.
(ii) All volumes and concentrations are normally reported as dry at a temperature of 0°C
and at an absolute pressure of 101.3 kilopascals (kPa). (iii) Attach a photograph indicating the relative location of the sampling point along
the stack length.
(iv) Indicate the last volume sampled and the serial numbers of the equipment
(Note: STP is 0º Celsius and 1 standard atmosphere pressure.)
Other Requirements:
1) Submission of the Stack Emission Measurement Report
The Submission of the Stack Emission Measurement Report/Test results
must be forwarded to the Authority as outlined in the Emission Licence
conditions, and in any case within Eight (8) weeks after the test date.
The report should be spiral bound.
2) Where testing for reporting to the Authority is of a continuous nature over an
extended period of time (greater than that for a corresponding manual stack
emission test), the results must be reported as indicated in the emission
licence or as agreed beforehand with the Authority.
3) Reports must be submitted to the Authority in the format required by the
Authority
4) This is to be accompanied by a letter of certification from the licencee (facility).
5) The letter of certification is a statement by a person authorised to sign on
behalf of the licencee that the provided report is a true and correct record of
the testing conducted on the premises.
6) Testing and analytical laboratory information: All information concerning testing,
monitoring and ancillary equipment, charts, raw data, calibration records and other relevant documentation must be attached to the report as indicated under item 11
below.
7) Monitoring equipment includes both ambient and stack monitoring equipment for
both continuous or discrete testing. All data gathered from the monitoring
equipment, along with a copy of the test report, must be stored on a computer data
system available through the company premises for seven years or the operational
period of the plant whichever is the lesser.

8) Information supplied may, at the discretion of the Authority, be published in full,
in summary form, in annual or other reports with reference to the source.
9) The test and analytical laboratories must determine a person who is a director, or
legally responsible person in the company to sign documents on behalf of the
company, to verify the correctness of any reports or documents submitted to the
Authority. All documents related to a test, submitted to the Authority or under
emission licence requirement must be signed by the nominated person.
10. Adjustment to reference conditions
10.1 Under the Air Quality Regulations, it is a mandatory requirement that all stack
emissions must be reported to 0ºC, 1 standard atmosphere pressure and on a dry
basis (STP dry).
10.2 In addition some emissions defined under the emission standards must be
adjusted to a reference concentration of oxygen or carbon dioxide. This requires
that oxygen and/or carbon dioxide concentration must also be measured.
Adjustments are to be made as follows:
10.2.1 Adjustment to a reference concentration of carbon dioxide
Ca = Ci x (CO2r)/(CO2m)
where:
Ca = adjusted emission concentration at 0 ºC and 1 standard atmosphere on a dry
basis having a specified reference concentration of carbon dioxide volume %
CO2r
Ci = initial unadjusted pollutant emission concentration at 0 ºC and 1 standard
atmosphere on a dry basis and at known carbon dioxide concentration (CO2m)
before admixture with air or other gases
CO2r = a specified reference concentration of carbon dioxide (volume %)
CO2m = actual measured carbon dioxide concentration (volume %)
10.2.2. Adjustment to a reference concentration of oxygen
Cb = Ci x (20.9 - O2r)/(20.9 - O2m)
where:
Cb = adjusted emission concentration at 0 ºC and 1 standard atmosphere pressure
having a specified reference concentration of oxygen volume % O2r
O2r = a specified reference concentration of oxygen (volume %)

Ci = initial unadjusted emission concentration at 0 ºC and 1 standard atmosphere on
a dry basis and at a known oxygen concentration (O2m) before admixture with
air or other gases
O2m = actual measured oxygen concentration (volume %)
In both adjustments, the value reported to the Authority for purposes of compliance
is the adjusted value (Ca or Cb) at its reference carbon monoxide or oxygen
concentration along with the measured oxygen and/or carbon monoxide
concentration.
11. Data Charts
USEPA Method 1a
USEPA Method 1— Sample and Velocity Traverses for Stationary Sources
Table 1 Required Number of Traverse Point for Sampling Sites (Clause 5.3)
Range of Stack Diameter m Total No. of Traverse Number of Traverse
Plane 1 Plane 2
(2) (3) (4) (5)
ID up to 0.3
ID>0.3 up to 0.6
ID>0.6 up to 1.2
ID>1.2 up to 2.4
ID>2.4 up to 5.0
ID > 5.0
Signed by: Laboratory Analyst ……………………………………………Date………………………………..
Countersigned by Facility Representative……………………………….Date………………………………..
Countersigned by Authority Observer Representative…………………Date……………………………….
USEPA Method 2a USEPA Method 2: Velocity Traverse Determination
Table: Velocity Traverse Data
a) Plant or Facility____________________
b) Date____________________
c) Run No.____________________
d) Stack Dia. or Dimensions, (M.)____________________
e) Stack Height. or Dimensions, (M.)____________________
f) Barometric Press., (mm. Hg)____________________
g) Cross Sectional Area, (M2 )____________________
h) Operators____________________
i) Pitot Tube I.D. No.____________________
j) Avg. Coefficient, Cp =____________________
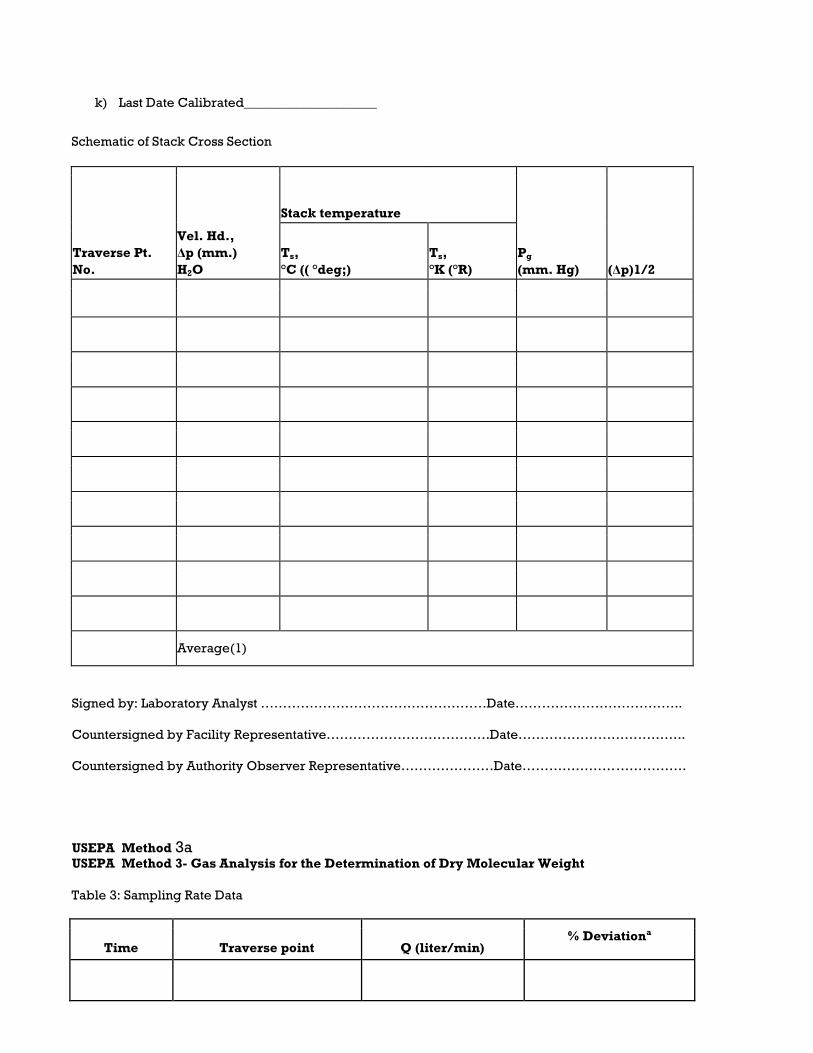
k) Last Date Calibrated____________________
Schematic of Stack Cross Section
Traverse Pt.
No.
Vel. Hd.,
Δp (mm.)
H2O
Stack temperature
Pg
(mm. Hg) (Δp)1/2
Ts,
°C (( °deg;)
Ts,
°K (°R)
Average(1)
Signed by: Laboratory Analyst ……………………………………………Date………………………………..
Countersigned by Facility Representative……………………………….Date………………………………..
Countersigned by Authority Observer Representative…………………Date……………………………….
USEPA Method 3a USEPA Method 3- Gas Analysis for the Determination of Dry Molecular Weight
Table 3: Sampling Rate Data
Time Traverse point Q (liter/min) % Deviationa

Average
a % Dev.=[(Q−Qavg)/Qavg]×100 (Must be ≤±10%)
Signed by: Laboratory Analyst ……………………………………………Date………………………………..
Countersigned by Facility Representative……………………………….Date………………………………..
Countersigned by Authority Observer Representative…………………Date…………………………..
USEPA Method 4a USEPA Method 4-1 Moisture Content Determination Table 4: Moisture Content
Traverse Pt.
No.
Sampling
time (Δ), min
Stack
temperature °C ((
°deg;F)
Pressure
differential
across orifice
meter ΔH
mm (in.) H2O
Meter
reading
gas sample volume
m3 (ft
3)
ΔVm m3
(ft3)
Gas sample
temperature at
dry gas meter Temperature
of gas leaving
condenser
or last impinger
°C (( °deg;F)
Inlet Tmin
°C (( °deg;F)
Outlet Tmout °C (( °deg;F)
Average
Signed by: Laboratory Analyst ……………………………………………Date………………………………..
Countersigned by Facility Representative……………………………….Date………………………………..
Countersigned by Authority Observer Representative…………………Date……………………………….

USEPA Method 5a USEPA Method 5: Particulate Matter Field Data Sheet
l) Plant or Facility____________________
m) Date____________________
n) Run No.____________________
o) Stack Dia. Or Dimensions, (M.)____________________
p) Stack Height. Or Dimensions, (M.)____________________
q) Barometric Press., (mm. Hg)____________________
r) Cross Sectional Area, (M2 )____________________
s) Operators____________________
t) Pitot Tube I.D. No.____________________
u) Avg. Coefficient, Cp =____________________
v) Last Date Calibrated____________________
Traver
se
Point
Numb
er
Sampli
ng
Time
(Min)
Vacuu
m
(mm
Hg)
Stack
Temperat
ure (oC)
Velocity
Head
(ΔP)mmH
2O
Pressure
Different
ial
across
orifice
meter
(mmH2O
)
Gas
Meter
Readi
ng
Gas
Sample
Temperat
ure at Dry
Gas Meter
Temperat
ure
Temperat
ure of Gas
leaving
condense
r or last
Impinger
Inl
et
(oC
)
Outl
et
(oC)
Signed by: Laboratory Analyst ……………………………………………Date………………………………..
Countersigned by Facility Representative……………………………….Date………………………………..
Countersigned by Authority Observer Representative…………………Date……………………………….
2(b) Elements of an Emission Compliance Plan
The Emission Compliance Plan must include the following:
a) Description of compliance status with respect to all applicable requirements.
b) A statement that source will continue to comply with all requirements with which the
source is in compliance.
c) A statement that source will comply with any requirement that becomes effective
during term of permit.
d) For requirements not being complied with, a detailed narrative description of how
you will achieve compliance.
e) A schedule of remedial measures to come into compliance with any requirement not
being met. Include any outstanding Environmental Improvement Orders and their
dates

f) An enforceable sequence of proposed actions, with target dates, leading to
compliance.
g) A schedule for submission of certified progress reports at least every 6 months for
sources out of compliance

Annex 4: Guidelines for Construction of Particulate Matter
Sampling and Testing Facilities
Introduction
Most often the installation of sampling/testing ports is an afterthought in the process of
stack construction. However, sampling ports are essential to the stack testing process
which is a requirement for demonstrating compliance. The Authority recommends that
EPA method 1 should be taken into consideration before stack construction begins.
1.1. Selection of a sampling site
Selection of a proper sampling site is vital to assure representative measurement of
pollutant emissions and accurate volumetric flow rate from a stationary source is
obtained. Safety and accessibility are essential considerations of site selection. Clearance
for sampling equipment, access to electrical power, exposure of personnel to weather,
process heat, and presence of hazardous gases must also be considered in construction of
sampling facilities.
1 Regulatory Basis
The Air Quality Regulations, 2014 states:
61 (2)An owner or operator of a controlled facility shall provide portholes, and
platforms which shall be conveniently located for easy access and all other facilities
required for taking samples of air or emission from any chimney, flue or duct, plant
or vessel or any other outlets.
62. Where the Authority requires stack emission tests to be performed under these
Regulations, an owner of a facility shall provide the following- (a) sampling ports which are adequate for the test methods applicable to
the facility; (b) safe sampling platforms or other suitable and safe permanent or
temporary structures or equipment; and (c) safe access to sampling platforms.
2 Sampling Ports
The ideal sample location would have flow characteristics such that the gas flows in a
linear pattern parallel to the axis of the stack or duct, have a uniform velocity profile and
not flow in a cyclonic or swirling pattern. The following port location directions are
provided to guide you in selecting a stack sampling location close to ideal.
17

1.1. Port Location.
Ports should be located at least eight stack or duct diameters downstream and two
diameters upstream from any flow disturbance such as a bend, expansion, or
contraction in the stack, or from a visible flame. For a rectangular stack or duct utilize an
equivalent diameter to determine distances from flow disturbances. Calculate the
equivalent diameter as follows:
Equivalent Diameter =De
where
De = equivalent diameter, in m;
L = length of the rectangle, in m; and
W = width of the rectangle, in m.
3.2. Port Type
A sampling port should be a welded pipe nipple with screw cap or a pipe with flange. A
gate valve should be used for stacks handling hazardous gases or gases over 94oC
under positive pressure. Stacks or ducts having a thin wall may be provided with ports
consisting of appropriately sized surface holes with plugs. For determination of Total
Suspended Particulate (TSP) emissions, the sampling ports must be at least
87.5mm I. D. (Inside Diameter) pipe nipple. Particulate sampling to determine the PM10 or
PM2.5 (Particulate Matter less than 10 or 2.5 microns) fraction of the TSP emissions requires
sampling ports be 150mm I. D. pipe nipples.
3.3 Port Installation
Ports must be flush with the interior stack wall and extend outward from the exterior wall
at least 50mm and not more than 150mm. Ports must be located at least 1.2m and not more
than 1.5m above the work platform floor and meet clearance zone requirements described
below. The ports must be located parallel and in a plane perpendicular to longitudinal
axis of the stack.
3.4. Number of Ports
For circular stacks, if the sum of the stack inside diameter plus the port length is 1.625m
or less, two ports must be installed 90 degrees apart. If this sum is over 1.625m, four ports
must be installed 90 degrees apart. See Figure 1.
18

2.1 Figure 1
Example of port location for a round stack requiring four ports
In the case of rectangular stacks, an equivalent diameter will be calculated, and a cross
section layout (matrix layout) applied. The cross section layout is specified in the Method
1 (EPA Method 1-Sample and Velocity Traverses for Stationary Sources). Locate the
number of ports required by the cross section layout on the widest of the two stack sides.
Contact the facility manager to provide assistance in determining the correct cross section
layout (matrix layout) for rectangular port placement. See Figure 2.
3 Work Platform
1.2. Size
For a round stack with two-port installation the platform must serve that quarter of the stack
and extend at least 900mm beyond each port. It must be at least 1200mm wide. For a
circular stack with four-port installation the platform must serve the full circumference of
the stack and be at least 1500mm wide. For a rectangular stack the platform must serve the
side containing the ports. It must be at least 1200mm wide and extend across the full width
of the stack.
19

3.1 Figure 2
Example of port location for a rectangular stack with a 4X3 traverse point
matrix 4.2. Construction
Safe and easy access to the work platform must be provided by stairway, caged ladder, or
other suitable means. The platform must have a guardrail and toeboard. It must be able to
support 500Kg live load. All construction must conform to the OSHA, 2007 requirements.
Platforms more than 21m high require a swinging arm and pulley to assist the lifting of
test apparatus.
2.0. Clearances
Insertion of a long stack sampling probe with filter assembly on its end is a difficult task.
See Figure 3 for a diagram of the sampling probe and equipment. There must be a
clearance zone, with no obstructions, around each port extending 300mm above,
600mm below, and 600mm on each side of the port. The zone must extend outward from
the end of the port at least one stack diameter plus 900mm. Guardrails that enter the
clearance zone must be equipped with removable sections or chains.
Conducting PM10 or PM2.5 sampling requires site-specific clearances and probe
support devices, i.e. a support rail system/bracket. See Figure 4. Contact the
Facility Manager for site-specific guidance.
20

3.2 Figure 3 Particulate Sampling Probe and Equipment
21

Figure 4: Typical Stack Sampling Access Requirements
22

4 Power Supply
Sampling platforms over 21m high require two electrical outlets, each capable of
supplying 230/115-volt, 15-ampere, 60 cycle AC. Sampling platforms less than 21m high
require that two electrical outlets, each capable of supplying 115-volt, 15-ampere, 60
cycle AC be located within 15m of the sampling site.
5 Additional Requirements
Additional requirements may be specified for situations with special needs such as flow
pattern adjustment, hoist equipment, or variations in the number and location of
sampling ports.
Mark the Pitot tube at the points to be sampled accordingly as explained above. Mark with tape, asbestos rope or other suitable material compatible with flue gas conditions the required length of Pitot for each
of the points.
Table 1 Required Number of Traverse Point for Sampling Sites
(Clause 5.3)
SI No. Range of Stack Diameter m Total No. of Traverse Number of Traverse
Plane 1 Plane 2
(1) (2) (3) (4) (5)
i) ID up to 0.3 4 4 –
ii) ID>0.3 up to 0.6 8 8 –
iii) ID>0.6 up to 1.2 12 12 –
iv) ID>1.2 up to 2.4 20 10 10
v) ID>2.4 up to 5.0 32 16 16
vi) ID > 5.0 52 26 26
3
23

Fig. 3 Diagrammatic Representation of Equal Rectangular Sub-Areas for a Rectangular Duct
24

Fig. 4 Sampling Port
6
25

Fig. 5 Typical Sampling Provision 6.0 Guidance for Small Stacks/Ducts ≤ 0.1m
6.1 Selection of Measurement Site for Particulate Measurements—Steady or Unsteady
Flow.
a) Select a particulate measurement site located preferably at least eight equivalent
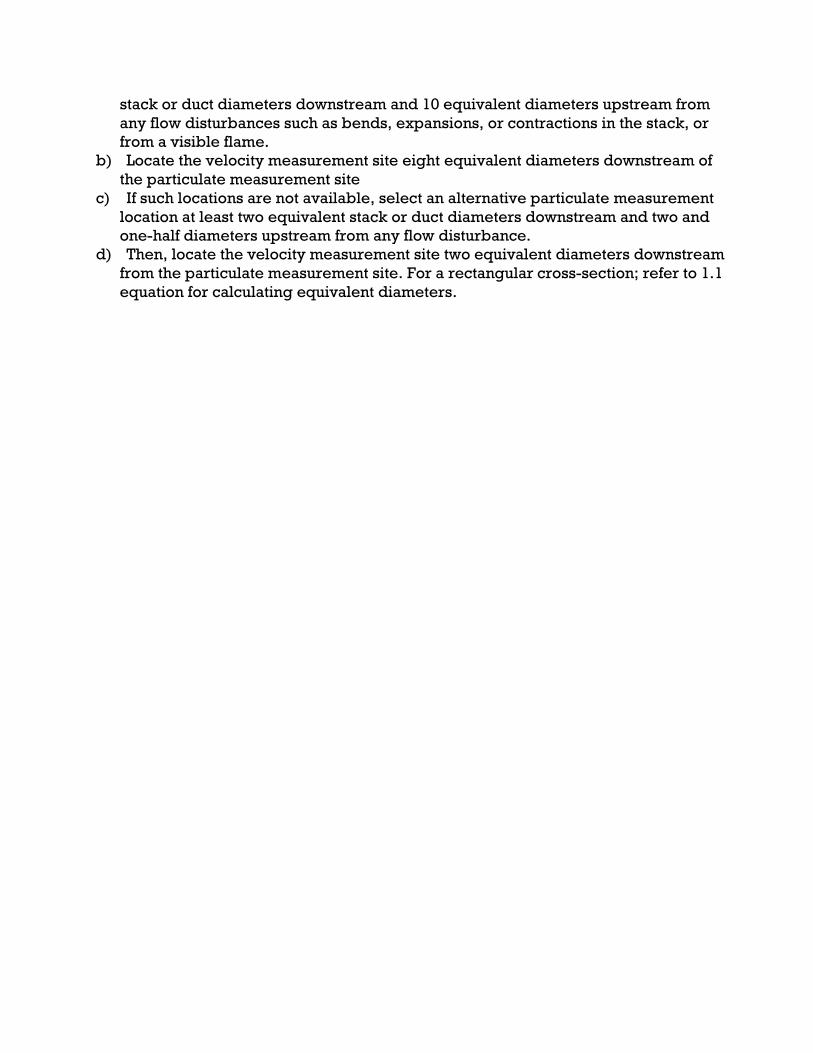
stack or duct diameters downstream and 10 equivalent diameters upstream from
any flow disturbances such as bends, expansions, or contractions in the stack, or
from a visible flame.
b) Locate the velocity measurement site eight equivalent diameters downstream of
the particulate measurement site
c) If such locations are not available, select an alternative particulate measurement
location at least two equivalent stack or duct diameters downstream and two and
one-half diameters upstream from any flow disturbance.
d) Then, locate the velocity measurement site two equivalent diameters downstream
from the particulate measurement site. For a rectangular cross-section; refer to 1.1
equation for calculating equivalent diameters.

Annex 5: List of laboratories designated by NEMA to carry out air quality
measurements: Available on the NEMA website- www.nema.go.ke; gazetted
designated laboratories
Laboratory Scope Measurement sn Email & Mobile Stack Ambient Indoor Air
Contact. Emission Air Quality
Quality
PM Gase PM Gase PM Gase
s s s
1 SGS Kenya [email protected] Yes Yes Yes Yes Yes Yes
Limited Landline +254 02
P.O. Box 72118- 2733690/99
00200, NAIROBI Tel: 0709633400,
0733637142
2 Ecoscience 0713566825/0711632342/
Yes Yes Yes Yes Yes Yes
Engineering
Ecoscience.engineering
Services
@gmail.com or
info@ecoscience and
engineering.co.ke 3 Eurolab Services [email protected] Yes Yes Yes Yes Yes Yes
Limited [email protected]
P.O Box 5050- om
00200 NAIROBI 0722241766,0752435126 4 Labworks [email protected] Yes Yes Yes Yes No No
P.O.Box 9648 - Tel: 0726209641
00100, NAIROBI 5 Polucon Services [email protected] Yes Yes Yes Yes No No
P.O. Box 99344 - Tel: 0722229944
80100, MOMBASA 6 CSI International info@csiinternationalke Yes Yes Yes Yes No No
Ltd. .co.ke
P.O.Box 47846 - Tel:0712603528/072347
00100,NAIROBI 9111/0705204610 7 Ecoserv gachanja@ecoservkeny Yes Yes Yes Yes No No
Laboratory, a.com
P.O.Box 1303 - Tel: 0722882879
00100, NAIROBI 8 Instrumentation info@instrumentation- No Yes No No No No
Engineers(EA) engineers.com
Limited Tel: 0722357991/+254- P.O Box 18986- 20-2108606
00500, NAIROBI
27

Laboratory Scope Measurement sn Email & Mobile Stack Ambient Indoor Air
Contact. Emission Air Quality
Quality
9 Kenya Bureau of [email protected] No Yes Yes No No No Standards Tel: 0722203137 P.O.Box 54974-
00200, NAIROBI 10 Institute of Nuclear [email protected] No No Yes No No No
Science & Tel: 020-318262
Technology P.O.Box 3097 -
00100, NAIROBI
Key:
(i) PM: Particulate Matter/Dust (ii) Yes: Capacity exists to measure the indicated parameters
(iii) No: No capacity to measure the indicated parameters
(iv) Equipment Inventory available for verification
28
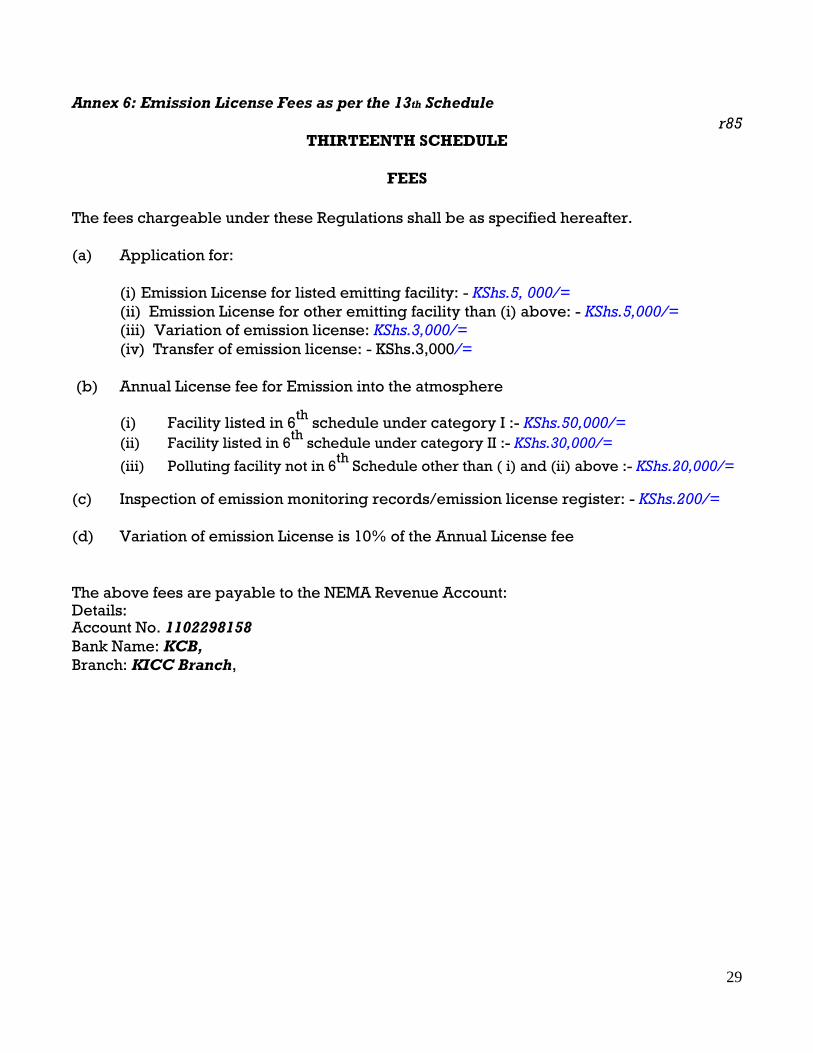
Annex 6: Emission License Fees as per the 13th Schedule
r85 THIRTEENTH SCHEDULE
FEES
The fees chargeable under these Regulations shall be as specified hereafter.
(a) Application for:
(i) Emission License for listed emitting facility: - KShs.5, 000/= (ii) Emission License for other emitting facility than (i) above: - KShs.5,000/=
(iii) Variation of emission license: KShs.3,000/= (iv) Transfer of emission license: - KShs.3,000/=
(b) Annual License fee for Emission into the atmosphere
(i) Facility listed in 6th
schedule under category I :- KShs.50,000/=
(ii) Facility listed in 6th
schedule under category II :- KShs.30,000/=
(iii) Polluting facility not in 6th
Schedule other than ( i) and (ii) above :- KShs.20,000/=
(c) Inspection of emission monitoring records/emission license register: - KShs.200/=
(d) Variation of emission License is 10% of the Annual License fee
The above fees are payable to the NEMA Revenue Account: Details: Account No. 1102298158 Bank Name: KCB,
Branch: KICC Branch,
29

Annex 7: List of Controlled Areas
SIXTH SCHEDULE
LIST OF CONTROLLED AREAS
a) Residential areas, Hospitals,
b) National Parks,
c) Reserves and Sanctuaries,
d) Conservation areas,
e) Central Business Districts
f) Any other area declared by the Authority from time to time
30
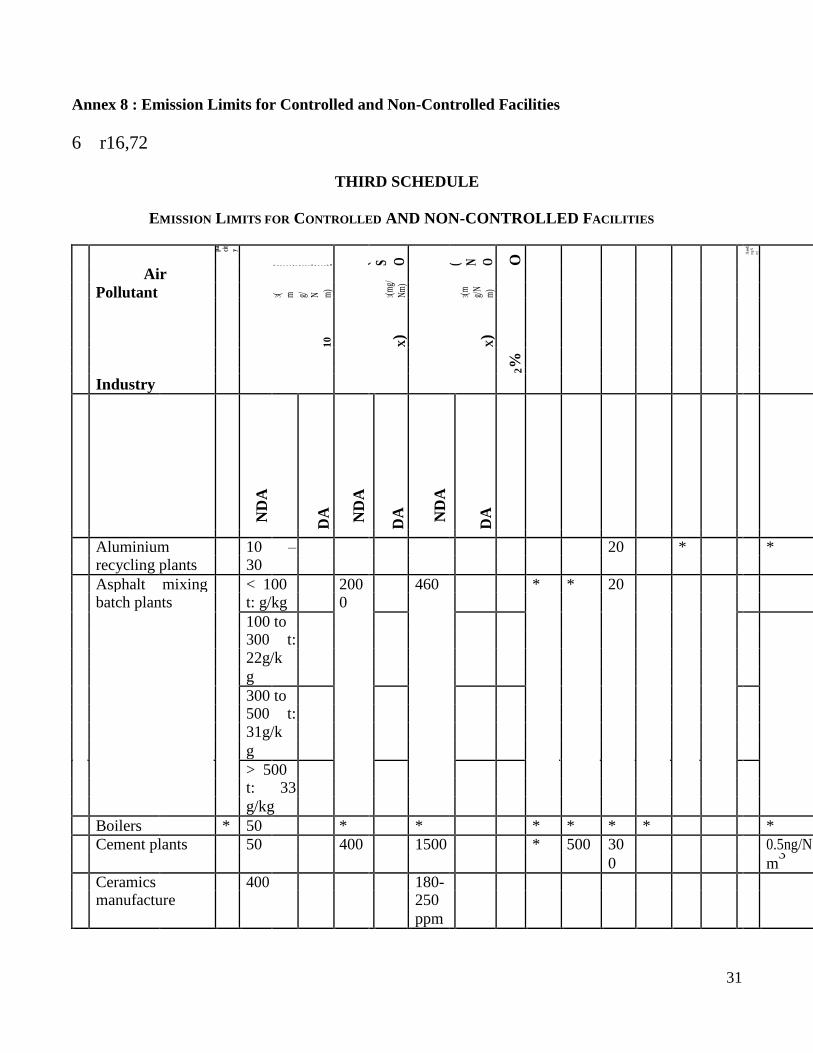
Annex 8 : Emission Limits for Controlled and Non-Controlled Facilities
6 r16,72
THIRD SCHEDULE
EMISSION LIMITS FOR CONTROLLED AND NON-CONTROLLED FACILITIES
Air
O pa cit
y
P a r t i c u l a t e ( D u s t ) P M
S u l p h u r o x i d e ( S O
N i t r o g e n o x i d e s
( N O
O
C a r b o n m o n o x i d e 3 ( m g / N m )
C a r b o n d i o x i d e 3 ( m g / N m )
H y d r o c a r b o n s 3 ( m g / N m )
H y d r o g e n S u l p h i d e 3 ( m g / N m )
H y d r o g e n C h l o r i d e
H y d r o g e n F l u o r i d e 3 ( m g / N m )
3Lea
d(
mg/
N
m)
D i o x i n s / F u r a n s
3( m g/ N m
)
3(m
g/
Nm
)
3(m
g/N
m)
Pollutant
1
0 ) )
X
X
%
2
Industry
ND
A
DA
ND
A
DA
ND
A
DA
Aluminium 10 – 20 * * recycling plants 30
Asphalt mixing < 100 200 460 * * 20
batch plants t: g/kg 0
100 to
300 t:
22g/k
g
300 to
500 t:
31g/k
g
> 500
t: 33
g/kg
Boilers * 50 * * * * * * *
Cement plants 50 400 1500 * 500 30 0.5ng/N
0 m3
Ceramics 400 180-
manufacture 250
ppm
31

Air
O pa cit
y
P a r t i c u l a t e ( D u s t ) P M
S u l p h u r o x i d e ( S O
N i t r o g e n o x i d e s
( N O
O
C a r b o n m o n o x i d e 3 ( m g / N m )
C a r b o n d i o x i d e 3 ( m g / N m )
H y d r o c a r b o n s 3 ( m g / N m )
H y d r o g e n S u l p h i d e 3 ( m g / N m )
H y d r o g e n C h l o r i d e
H y d r o g e n F l u o r i d e 3 ( m g / N m )
3Lea
d(
mg/
N
m)
D i o x i n s / F u r a n s
3( m g/ N m)
3(m
g/
Nm
)
3(m
g/N
m)
Pollutant
10
) ) X
X
%
2
Industry
ND
A
DA
ND
A
DA
ND
A
DA
Coke & coal * * * * * * * *
plants
Dairy 50
Fertilizer plant 50 * 500 20 30 50
Iron Foundry 50 560 * * 5
Brass bronze 50 20 -
Foundry 50
Glass 20-50 Oil 1000 5 5
Manufacture fire - 0
d: 2000
1,8
00 Gas
fire
d:
700
Galvanizing * 50
operations
Incinera * < 10 t: 500 Exis * * 2.0 – tors 4g/kg ting: ng
10 to 130- TEQ/N 30 t: 600 3
10g/k ppm
g
30 to
50 t:
10g/k
g
32

Air
Pollutant
Industry
Munic
ipal
waste Medic
al
waste Indust
rial
waste Kraft pulp mills
Lead Recycling plants
Opa
c
ity
P a rt ic ul at e( D u st ) P M
Sul
phu
roxi
de(
SO
Nit
roge
n
oxid
es(N
O O
C a r b o n m o n o x i d e 3 ( m g / N m )
C a r b o n d i o x i d e 3 ( m g / N m ) H y d r o c a r b o n s 3 ( m g / N m )
H y d r o g e n S u l p h i d e 3 ( m g / N m )
Hy
dr og en Ch
lor
ide
H y d r o g e n F l u o r i d e 3 ( m g / N m )
3 L e a d ( m g / N m ) D i o x i n s / F u r a n s
3(m
g/
Nm
)
3(m
g/N
m)
3(m
g/N
m)
1 0 ) )
X
X
%
2
ND
A
DA
ND
A
DA
ND
A
DA
> 50 t: New 0.1–5
17.5 : 60- –
g/kg 400 TEQ/N ppm 3
100 300 * *
20 500 300 * * * * *
(PM2.5
)
* 50 150 460 * * * * * *
100- 500 600 * * 20 15 * * *
150
20 400 5 *
(PM2.5 0
) (
B
&
R
F
u
r
n
a
c
e
)
33

Air
Pollutant
Industry O
paci
ty
Mineral
Processing Mining & Quarry 2
0 %
Non-ferrous
secondary
smelters
Non-ferrous * secondary
smelters
P a rt ic ul at e( D u st ) P M
Sul
phu
roxi
de(
SO
Nit
roge
n
oxid
es(N
O O
C a r b o n m o n o x i d e 3 ( m g / N m )
C a r b o n d i o x i d e 3 ( m g / N m ) H y d r o c a r b o n s 3 ( m g / N m )
H y d r o g e n S u l p h i d e 3 ( m g / N m )
Hy
dr og en Ch
lor
ide
H y d r o g e n F l u o r i d e 3 ( m g / N m )
3 L e a d ( m g / N m ) D i o x i n s / F u r a n s
3(m
g/
Nm
)
3(m
g/N
m)
3(m
g/N
m)
1 0 ) )
X
X
%
2
ND
A
DA
ND
A
DA
ND
A
DA
1
0
P
o
t
F
u
r
n
a
c
e
)
50
400
50 20 * * * * *
< 10 t: 800 * * * 20 15 *
7.5
g/kg
(PM2.5
)
34
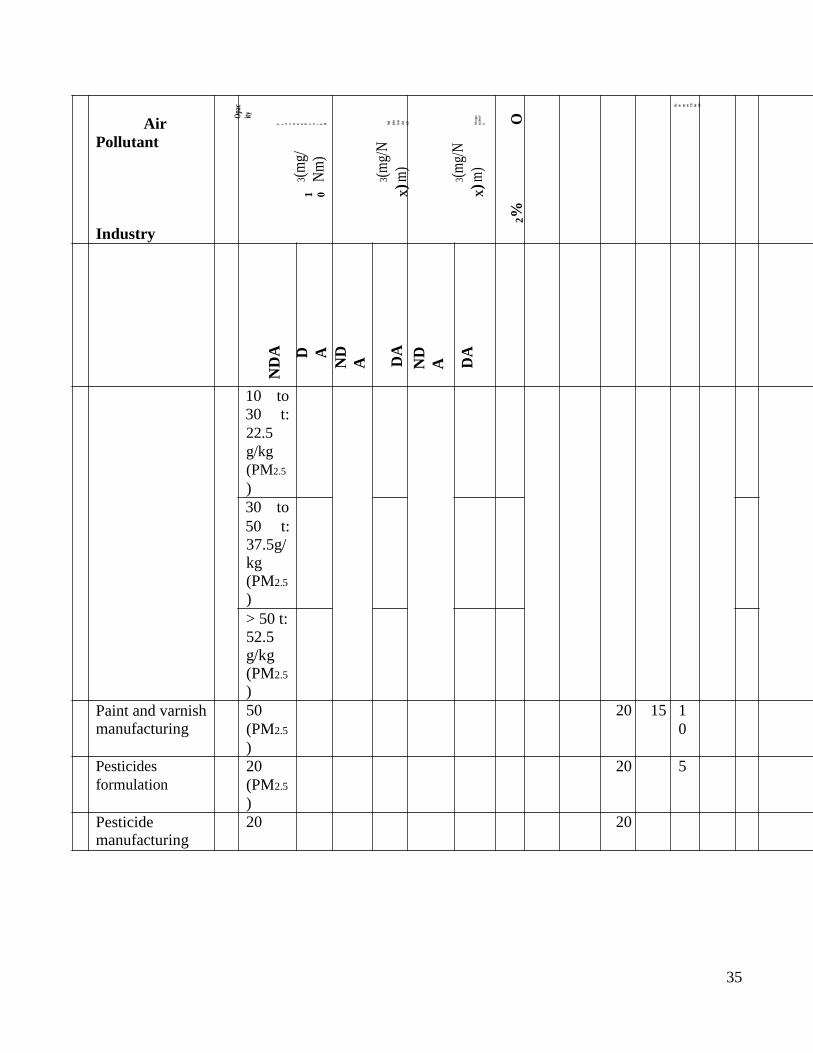
Air
Pollutant
Industry
Paint and varnish manufacturing
Pesticides
formulation
Pesticide manufacturing
Opa
c
ity
P a rt ic ul at e( D u st ) P M
Sul
phu
roxi
de(
SO
Nit
roge
n
oxid
es(N
O O
C a r b o n m o n o x i d e 3 ( m g / N m )
C a r b o n d i o x i d e 3 ( m g / N m ) H y d r o c a r b o n s 3 ( m g / N m )
H y d r o g e n S u l p h i d e 3 ( m g / N m )
Hy
dr og en Ch
lor
ide
H y d r o g e n F l u o r i d e 3 ( m g / N m )
3 L e a d ( m g / N m ) D i o x i n s / F u r a n s
3(m
g/
Nm
)
3(m
g/N
m)
3(m
g/N
m)
1 0 ) )
X
X
%
2
ND
A
D A
ND
A
DA
ND
A
DA
10 to
30 t: 22.5
g/kg
(PM2.5
) 30 to 50 t:
37.5g/
kg
(PM2.5 ) > 50 t:
52.5
g/kg
(PM2.5
) 50 20 15 1
(PM2.5 0
)
20 20 5
(PM2.5
)
20 20
35

Air
Pollutant
Industry
Petroleum
Refineries
Pharmaceuticals
manufacturing
plants Printing industry
Steel mills
Opa
c
ity
P a rt ic ul at e( D u st ) P M
Sul
phu
roxi
de(
SO
Nit
roge
n
oxid
es(N
O O
C a r b o n m o n o x i d e 3 ( m g / N m )
C a r b o n d i o x i d e 3 ( m g / N m ) H y d r o c a r b o n s 3 ( m g / N m )
H y d r o g e n S u l p h i d e 3 ( m g / N m )
Hy
dr og en Ch
lor
ide
H y d r o g e n F l u o r i d e 3 ( m g / N m )
3 L e a d ( m g / N m ) D i o x i n s / F u r a n s
3(m
g/
Nm
)
3(m
g/N
m)
3(m
g/N
m)
1 0 ) )
X
X
%
2
ND
A
DA
ND
A
DA
ND
A
D A
50 Sul 460 20 15 phu 2
r
rec
ove
ry:
150
Co
mb
usti
on
unit
s:5
00
20 80 1
0
20 1
0
* Existi 500 200 *
ng-
240
(PM2.5
)
New- 180
120
(PM2.5
)
36

Air
O p a c i t y
P a r t i c u l a t e ( D u s t ) P M
S u l p h u r o x i d e ( S O
N it r o g e n o x i d e s ( N O O
C a r b o n m o n o x i d e 3 ( m g / N m )
C a r b o n d i o x i d e 3 ( m g / N m ) H y d r o c a r b o n s 3 ( m g / N m )
H y d r o g e n S u l p h i d e 3 ( m g / N m )
H y d r o g e n C h l o r i d e
H y d r o g e n F l u o r i d e 3 ( m g / N m )
3 L e a d ( m g / N m ) D i o x i n s / F u r a n s
3(m
g/N
m)
3(m
g/N
m)
3(m
g/
Nm
)
Pollutant
10
) ) X
X
%
2
Industry
N D A
D A
ND
A
DA
ND
A D A
Sulphuricacid 50 SO
Plants 2: 2
kg/t
aci
d SO
3:
0.1
5
kg/t
aci
d <
100
t:
3.7
5
g/k
g 100
to
300 t:
10.
5
g/k
g
37
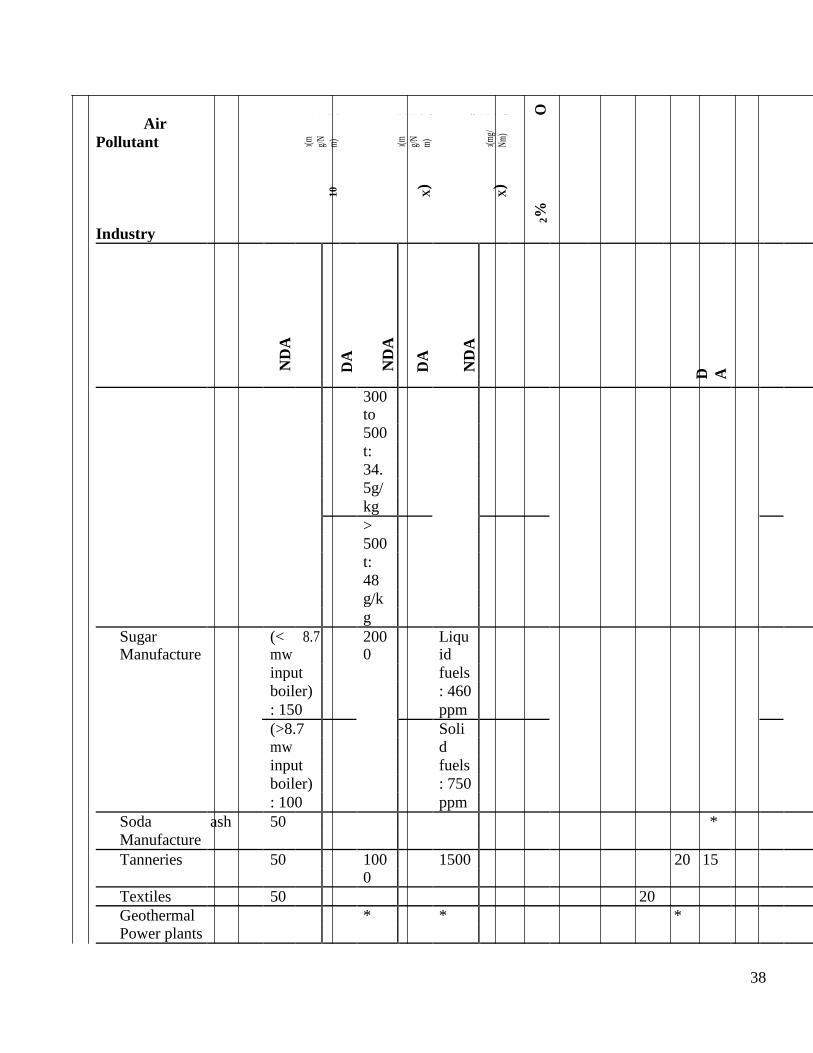
Air
O p a c i t y
P a r t i c u l a t e ( D u s t ) P M
S u l p h u r o x i d e ( S O
N it r o g e n o x i d e s ( N O O
C a r b o n m o n o x i d e 3 ( m g / N m )
C a r b o n d i o x i d e 3 ( m g / N m ) H y d r o c a r b o n s 3 ( m g / N m )
H y d r o g e n S u l p h i d e 3 ( m g / N m )
H y d r o g e n C h l o r i d e
H y d r o g e n F l u o r i d e 3 ( m g / N m )
3 L e a d ( m g / N m ) D i o x i n s / F u r a n s
3(m
g/N
m)
3(m
g/N
m)
3(m
g/
Nm
)
Pollutant
10
) ) X
X
%
2
Industry
ND
A
DA
ND
A
DA
ND
A
D A
300
to
500
t:
34.
5g/
kg
>
500
t:
48
g/k
g
Sugar (< 8.7 200 Liqu
Manufacture mw 0 id
input fuels
boiler) : 460
: 150 ppm
(>8.7 Soli
mw d
input fuels
boiler) : 750
: 100 ppm
Soda ash 50 *
Manufacture
Tanneries 50 100 1500 20 15
0
Textiles 50 20
Geothermal * * *
Power plants
38

Air
Pollutant
Industry
Thermal Power Plants Small
combustion
facilities(3MWth
– 50NMWth)Recip
rocating internal Combustion
Engine (RICE) Engine (Gas)
Liquid
Turbine
Natural Gas
Opa
c
ity
P a rt ic ul at e( D u st ) P M
Sul
phu
roxi
de(
SO
Nit
roge
n
oxid
es(N
O O
C a r b o n m o n o x i d e 3 ( m g / N m )
C a r b o n d i o x i d e 3 ( m g / N m ) H y d r o c a r b o n s 3 ( m g / N m )
H y d r o g e n S u l p h i d e 3 ( m g / N m )
Hy
dr og en Ch
lor
ide
H y d r o g e n F l u o r i d e 3 ( m g / N m )
3 L e a d ( m g / N m ) D i o x i n s / F u r a n s
3(m
g/
Nm
)
3(m
g/N
m)
3(m
g/N
m)
1 0 ) )
X
X
%
2
ND
A
D A
ND
A
DA
ND
A
DA
N/A N/ 200(
A SI)
1,60
0(CI
)
K 50 Use Bore
S 1.5 ø<4
1 % 00m
5 sul m:
1 phu 1460
5 r Bore
fuel ø≥4
(SF 00m
)* m:
1,85
0
39

Air
O p a c i t y
P a r t i c u l a t e ( D u s t ) P M
S u l p h u r o x i d e ( S O
N it r o g e n o x i d e s ( N O O
C a r b o n m o n o x i d e 3 ( m g / N m )
C a r b o n d i o x i d e 3 ( m g / N m ) H y d r o c a r b o n s 3 ( m g / N m )
H y d r o g e n S u l p h i d e 3 ( m g / N m )
H y d r o g e n C h l o r i d e
H y d r o g e n F l u o r i d e 3 ( m g / N m )
3 L e a d ( m g / N m ) D i o x i n s / F u r a n s
3(m
g/N
m)
3(m
g/N
m)
3(m
g/
Nm
)
Pollutant
10
) ) X
X
%
2
Industry
ND
A
DA
ND
A
DA
ND
A
DA
3MWth to < N/A N/ 42pp
15MWth A m(El
ectri
c
Gen
erati
on)(
EG)
100p
pm(
Mec
hani
cal
Driv
e)(M
D)
15MWth to < N/A N/ 25pp
50MWth A m
Other fuels
3MWth to < N/A 0.5 96pp
15MWth %S m(E
F G)
150p
pm(
MD)
40

Air
3(m
g/N
m)
3(m
g/N
m)
3(m
g/N
m)
Car
bon
mon
oxid
e3(m
g/N
m)
Car
bon
diox
ide3
(mg/
Nm
)
Hyd
roge
n
Sulp
hide
3(m
g/N
m)
Hy
dro
gen
Ch
lori
de
Hyd
roge
n
Fluo
ride
3(m
g/N
m)
Pollutant
1 0 ) )
X
X
O
paci
t
y
Part
icul
a
te(D
ust)
P
M
Sulp
h
urox
i
de
(SO
Nitr
oge
nox
ides
(N O
%
Hyd
roc
arbo
ns3
(mg/
Nm
)
3Lea
d(m
g/
Nm
)
Dio
xins
/F
uran
s
2
Industry O
ND
A
DA
ND
A
DA
ND
A
DA
15MWth to < N/A 0.5 74pp
50MWth % m
SF
or
low
er
Boiler
Gas N/A N/ 320
A
Liquid 50 or 200 460
150 * 0
Solid 50 or 200 650
150 * 0
Combustion
Technology/Fuel
RICE
Natural Gas N/A N/ N/ N/ 200( 200 1
A A A SI) (SI) 5
400( 400 %
DF) (DF
/CI)
41

Air
3(m
g/N
m)
3(m
g/N
m)
3(m
g/N
m)
Car
bon
mon
oxid
e3(m
g/N
m)
Car
bon
diox
ide3
(mg/
Nm
)
Hyd
roge
n
Sulp
hide
3(m
g/N
m)
Hy
dro
gen
Ch
lori
de
Hyd
roge
n
Fluo
ride
3(m
g/N
m)
Pollutant
10
) )
X
X
O
paci
t
y
Part
icul
ate(
Dus
t)P
M
Sulp
h
urox
i
de
(SO
Nitr
oge
nox
ides
(N O
%
Hyd
roc
arbo
ns3
(mg/
Nm
)
3Lea
d(m
g/
Nm
)
Dio
xins
/F
uran
s
2
Industry O
ND
A
DA
ND
A
DA
ND
A
DA
Liquid 50 30 1,1 0.5 1,46 1
fuels(>=50MWth 70 % 0(CI 5
to < 300MWth or SF ,Bor %
≤2 e
%S ø<4
F 00m
m)
1,85
0(CI
,
Bore
ø≥4
00m
m)
2,00
0(D
F)
Liquid 50 30 585 0.2 740* 400 1
fuels(plant≥ or ≤ % * 5
300MWth 1% SF %
SF
42

Air
Part
icu
late
(Du
st)
3(m
g/N
m)
Su
lph
ur
oxid
e
3(m
g/N
m)
Nit
rog
en o
xid
es
3(m
g/N
m)
Car
bon
mon
oxid
e3(m
g/N
m)
Car
bon
diox
ide3
(mg/
Nm
)
Hyd
roge
n
Sulp
hide
3(m
g/N
m)
Hy
dro
gen
Ch
lori
de
Hyd
roge
n
Fluo
ride
3(m
g/N
m)
3L
ead
(mg/N
m)
Dio
xin
s/F
ura
ns
Pollutant
Hyd
roca
rbon
s3(m
g/
Nm
)
Op
aci
ty
1 0 ) )
X
X
P M
(SO
(N O %
2
Industry
O
ND
A
DA
ND
A
DA
ND
A
DA
Biofuels/Gaseou 50 30 N/ N/ 30%
s fuels other than A A >
Natural Gas Natu
ral
Gas
&
Liqu
id
Fuel
s
Combustion
Turbine
Natural Gas (All N/A N/ N/ N/ 51 25
turbine types of A A A
unit> 50MWth)
Fuels other than 50 30 Use Us
Natural 1% e
Gas(unit> SF 0.5
50MWth) %
SF
Boiler
Natural Gas N/A N/ N/ N/ 240 240 3
A A A %
Other Gaseous 50 30 400 40 240 240 3
fuels 0 %
43

Air
O pa cit
y
P a r t i c u l a t e ( D u s t ) P M
S u l p h u r o x i d e ( S O
N i t r o g e n o x i d e s
( N O O
C a r b o n m o n o x i d e 3 ( m g / N m )
C a r b o n d i o x i d e 3 ( m g / N m )
H y d r o c a r b o n s 3 ( m g / N m )
H y d r o g e n S u l p h i d e 3 ( m g / N m )
H y d r o g e n C h l o r i d e
H y d r o g e n F l u o r i d e 3 ( m g / N m )
3L ea d( m g/ N m) D i o x i n s / F u r a n s
3( m g/ N m)
3(m
g/
Nm
)
3(m
g/N
m)
Pollutant
10
) ) X
X
%
2
Industry
ND
A
DA
ND
A
DA
ND
A
DA
Liquid 50 30 900 40 400 200 3
Fuels(Plant - 0 %
>=50MWth to < 150
600MWth) 0
Liquid 50 30 200 20 400 200 3
Fuels(>=600MW - 0 %
th) 850
Solid 50 30 900 40 510 200 6
Fuels>=50MWth - 0 %
to < 600MWth) 150
0
Solid 50 30 200 20 1,10 200 6
Fuels(>=600MW - 0 0 %
th) 850 upto
volat
ile
matt
er of
fuel
<
10%
Waste water NH3 40 50
treatment plants (100 0- -
- 2,0 20
400) 00 0
And any other parameter as may be prescribed by the Authority from time to time
Legend SF: Suphur Fuel
44

* 1.5-3.0% only justified by project specific considerations i.e. add secondary treatment to meet levels of
1.5% Sulphur
** dependent on water availability for injection
CI: Compression Ignition
SI: Spark Ignition
DF: Dual Fuel
DA: Degraded Area
NDA: Non-degraded Area The chimney or stack should have a minimum height of 10 metres above ground level and clear the highest of the building by not less than 3 metres for all roofs. The topography and height of adjacent buildings within 50 metres radius should be taken into account.
Toxic Equivalent (TEQ) is the sum of the toxic equivalent factors (TEF) of a mixture congeners
contained in a compound. The compound 2,3,7,8-tetrachlorodibenzo-p-dioxin(TCDD) was assigned a
TEF of 1 after being identified, by International Association of Radiology and Cancer (IARC) and
World Health Organisation (WHO), as the most toxic of all compounds, and as carcinogenic to humans,
based mainly on studies of cases involving accidental or occupational heavy exposure. Therefore the
TEF is a weighting factor.
g - gram
µg- microgram
kg – kilogram (1,000g)
mg - milligram
µg- microgram
m3 – cubic metre
ppm – Parts per million t – tonne
7
45

Annex 9: Acceptable Emission Control Technologies
SEVENTH SCHEDULE
Acceptable Emission Control Technologies
List of Acceptable Emission Control Technologies
Air Pollutants Emission Control technologies Remarks
1. Particulate Matter Mechanical collectors (dust cyclones,
multicyclones)
Electrostatic precipitators
Fabric filters (baghouses)
Particulate scrubbers
2. Nitrogen Oxides (Nox) * Low NOx burners
Selective catalytic reduction (SCR)
Selective non-catalytic reduction (SNCR)
NOx scrubbers
Exhaust gas recirculation
Catalytic converter
3. Volatile Organic Adsorption systems, such as activated
Compounds (VOC), carbon
hydrocarbons
Flares
Thermal oxidizers
Catalytic oxidizers
Biofilters
Absorption (scrubbing)
Cryogenic condensers
46

Air Pollutants Emission Control technologies Remarks
4. Sulphur Oxides (SOx) Wet scrubbers
Dry scrubbers
Flue gas desulphurization
5. Carbon Oxides Thermal oxidizers
6. Hydrogen Sulphides Absorption (scrubbing)
7. Hydrogen Chloride Dry Scrubbers,
Adsorption systems, such as activated
carbon
8. Dioxins & Furans Cyclone
Electrostatic precipitator
Bag filter
Wet scrubber
Quenching & subsequent wet scrubber
Catalytic oxidation (selective catalytic
reaction)
Catalytic bag filter
Dry absorption in resins (carbon Particles
dispersed in a polymer matrix)
Entrained flow reactor with added activated
carbon or coke/lime or limestone solutions
and subsequent fabric filter
47

Air Pollutants Emission Control technologies Remarks
Fixed bed or circulating fluidized bed
reactor, adsorption with activated carbon or
open hearth coke
9. Metals (Hg, Pb, ) Sorbent Injection Technology
Electro-Catalytic Oxidation (ECO)
K-Fuel
10. Any other technology approved by the Authority from time to time
7.1.1.1.1.1.1
7.1.1.1.1.1.2 * Notes Best Available Technology (BAT) for this category of equipment will
consist of combustion modification technology including either:
(a) low NO burner technology with low excess air (b) Air if technically feasible; or
(c) flue gas re-circulation with low excess air.
48