Growth of Manganese Oxide
6
Growth of Manganese Oxide Nanostructures Alters the Layout of Adhesion on a Carbonate Substrate CHONGZHENG NA AND SCOT T. MARTIN* School of Engineering and Applied Sciences & Department of Earth and Planetary Sciences, Harvard University, Cambridge, Massachusetts 02138 Received February 16, 2009. Revised manuscript received May 11, 2009. Accepted May 12, 2009. Nanostructures grown under natural conditions can modify the layout of adhesion on mineral surfaces. Using force-volume microscopy and a silicon-nitride probe, we measure changes in adhesion when a patchy overgrowth of manganese oxide nanostructures forms on the surface of rhodochrosite. For the most part, the observations show that the adhesive force to the nanostructures is dominated by van-der-Waals attraction. Measurements made across an area of the surface provide a frequency distribution of adhesive forces, and the mode of this distribution is 166 pN at pH 5.0, increasing to a maximum of 692 pN at pH 7.1, followed by a decrease to 275 pN at pH 9.7. At a few sampling locations over some nanostructures, electrostatic repulsion overtakes van-der-Waals attraction and thus results in negative adhesive forces (i.e., repulsion). Local roughness causes this effect. In comparison to the oxide nanostructures, the exposed rhodochrosite substrate has negligible adhesive force with the probe over the same pH range, suggesting both weak van-der-Waals attraction and weak electrostatic repulsion over this pH range. The quantitative mapping of adhesive force applied more generally to the study of other nanostructures can lead to an improved mechanistic understanding of how nanostructure growth influences contaminant immobilization and bacterial attachment. 1. Introduction The immobilization of metal ions, colloidal particles, and bacterial cells by lacustrine, riparian, and hypogeal minerals can be influenced by the overgrowth of nanosized surface structures (1-3). Such structures have been observed on many mineral surfaces under environmentally relevant conditions (4-9). They are often formed by heteroepitaxial nucleation and oriented growth, and their atomic arrange- ments and physicochemical properties may not have bulk- phase equivalents (8, 10). The morphologies of the nano- structures are guided by the underlying substrate lattices and self-limit to heights in the nanometer range. Under- standing the changes in surface properties and mineral reactivity caused by nanostructure growth is important for advancing the mechanistic modeling of the fate and transport of environmental contaminants (11, 12). Manganese oxide (MnO x ) nanostructures grown on rhodochrosite (MnCO 3 ) are one prototypical example of nanostructure growth that alters surface properties and mineral reactivity. Rhodochrosite is an important constituent of anoxic soils and sediments (2, 13, 14). Rhodochrosite reacts with dissolved oxygen, causing the epitaxial overgrowth of MnO x nanostructures (8, 10, 15). Compared to the substrate, the nanostructures have different surface potentials (16), ion mobilities (17), and interfacial forces (18). For example, although the nanostructures are only a few nanometers high (8, 10), they can have surface potentials several hundred millivolts greater than the substrate (16) and acquire 10 times more surface charge (18). As a result, the nanostructures exhibit noncontact repulsive interfacial forces of up to 100 pN and greater (compared to a baseline of 0 pN over substrate) when probed by a silicon-nitride atomic-force- microscope (AFM) tip under acidic and alkaline conditions (18). A reasonable hypothesis, on the basis of the different noncontact interfacial forces between the oxide nanostruc- tures and the rhodochrosite substrate, is that the contact adhesive forces also differ. The rationalization for this hypothesis is that van-der-Waals and electric forces con- tribute to both noncontact and contact interactions (19, 20). In comparison to the noncontact interfacial forces that affect the approach of an adsorbate to a surface, the contact adhesive force influences whether an adsorbate can readily desorb under the effect of hydraulic shear (21, 22). The adhesive force is the minimum force required for the separation of an adsorbate from a surface (21) and is, therefore, an important regulator of contaminant sorption and mobility. Adhesive forces and their heterogeneity across a surface can be measured using force-volume microscopy (FVM). At a sampling location, the adhesive force is measured by pulling on an AFM tip that is in contact with the surface. As the tip is pulled, forces such as van-der-Waals attraction and electrostatic repulsion are balanced by the force of mechan- ical deflection of the tip cantilever. The adhesive force f adh is, by definition, the deflective force f cant on the cantilever just prior to tip-surface separation: where the asterisk represents the condition of “just prior to tip-surface separation”. Measurements made of the adhesive force at each x-y lateral location provide a map f adh (x,y) of the heterogeneity of the adhesive forces over the oxide- carbonate surface. The objectives of this research were to quantify the different adhesive forces over the oxide nanostructures and the exposed rhodochrosite using FVM and to separate the contribution to adhesion of electrostatic repulsion from that of van-der-Waals attraction. Specifically, we measured the adhesive forces for an ionic strength of 1 mM and varied pH from 5.0 to 9.7. Compared to our previous companion study that quantified the interfacial forces influencing adsorption (18), the present study quantifies the adhesive forces that affect desorption. 2. Experimental Methods Manganese oxide nanostructures were grown by reacting freshly cleaved rhodochrosite samples with dissolved oxygen for 2 h at pH 6.3, as described previously (8, 16, 18). The samples were then transferred to the fluid cell of a Veeco multimode scanning probe microscope for the measurement of the adhesive force between the surface and a silicon-nitride AFM tip (Veeco DNP-S, spring constant: 48.8 pN nm -1 ) (Supporting Information (SI) Figure S1). In the fluid cell, both the sample and the AFM tip were immersed in aqueous * Corresponding author e-mail: [email protected]. f adh ) f cant ∗ (1) Environ. Sci. Technol. 2009, 43, 4967–4972 10.1021/es900500k CCC: $40.75 2009 American Chemical Society VOL. 43, NO. 13, 2009 / ENVIRONMENTAL SCIENCE & TECHNOLOGY 9 4967 Published on Web 05/29/2009 Downloaded by HARVARD UNIV on June 29, 2009 Published on June 29, 2009 on http://pubs.acs.org | doi: 10.1021/es900500k
Transcript of Growth of Manganese Oxide
Growth of Manganese OxideNanostructures Alters the Layout ofAdhesion on a Carbonate SubstrateC H O N G Z H E N G N A A N D S C O T T . M A R T I N *
School of Engineering and Applied Sciences & Department ofEarth and Planetary Sciences, Harvard University,Cambridge, Massachusetts 02138
Received February 16, 2009. Revised manuscript receivedMay 11, 2009. Accepted May 12, 2009.
Nanostructures grown under natural conditions can modifythe layout of adhesion on mineral surfaces. Using force-volumemicroscopy and a silicon-nitride probe, we measure changesin adhesion when a patchy overgrowth of manganeseoxide nanostructures forms on the surface of rhodochrosite.For the most part, the observations show that the adhesive forceto the nanostructures is dominated by van-der-Waalsattraction. Measurements made across an area of the surfaceprovide a frequency distribution of adhesive forces, and themode of this distribution is 166 pN at pH 5.0, increasing to amaximum of 692 pN at pH 7.1, followed by a decrease to 275 pNat pH 9.7. At a few sampling locations over some nanostructures,electrostatic repulsion overtakes van-der-Waals attractionand thus results in negative adhesive forces (i.e., repulsion).Local roughness causes this effect. In comparison to the oxidenanostructures, the exposed rhodochrosite substrate hasnegligible adhesive force with the probe over the same pHrange, suggesting both weak van-der-Waals attraction and weakelectrostatic repulsion over this pH range. The quantitativemapping of adhesive force applied more generally to the studyof other nanostructures can lead to an improved mechanisticunderstanding of how nanostructure growth influencescontaminant immobilization and bacterial attachment.
1. IntroductionThe immobilization of metal ions, colloidal particles, andbacterial cells by lacustrine, riparian, and hypogeal mineralscan be influenced by the overgrowth of nanosized surfacestructures (1-3). Such structures have been observed onmany mineral surfaces under environmentally relevantconditions (4-9). They are often formed by heteroepitaxialnucleation and oriented growth, and their atomic arrange-ments and physicochemical properties may not have bulk-phase equivalents (8, 10). The morphologies of the nano-structures are guided by the underlying substrate latticesand self-limit to heights in the nanometer range. Under-standing the changes in surface properties and mineralreactivity caused by nanostructure growth is important foradvancing the mechanistic modeling of the fate and transportof environmental contaminants (11, 12).
Manganese oxide (MnOx) nanostructures grown onrhodochrosite (MnCO3) are one prototypical example ofnanostructure growth that alters surface properties andmineral reactivity. Rhodochrosite is an important constituentof anoxic soils and sediments (2, 13, 14). Rhodochrosite reacts
with dissolved oxygen, causing the epitaxial overgrowth ofMnOx nanostructures (8, 10, 15). Compared to the substrate,the nanostructures have different surface potentials (16), ionmobilities (17), and interfacial forces (18). For example,although the nanostructures are only a few nanometers high(8, 10), they can have surface potentials several hundredmillivolts greater than the substrate (16) and acquire 10 timesmore surface charge (18). As a result, the nanostructuresexhibit noncontact repulsive interfacial forces of up to 100pN and greater (compared to a baseline of 0 pN oversubstrate) when probed by a silicon-nitride atomic-force-microscope (AFM) tip under acidic and alkaline conditions(18).
A reasonable hypothesis, on the basis of the differentnoncontact interfacial forces between the oxide nanostruc-tures and the rhodochrosite substrate, is that the contactadhesive forces also differ. The rationalization for thishypothesis is that van-der-Waals and electric forces con-tribute to both noncontact and contact interactions (19, 20).In comparison to the noncontact interfacial forces that affectthe approach of an adsorbate to a surface, the contactadhesive force influences whether an adsorbate can readilydesorb under the effect of hydraulic shear (21, 22). Theadhesive force is the minimum force required for theseparation of an adsorbate from a surface (21) and is,therefore, an important regulator of contaminant sorptionand mobility.
Adhesive forces and their heterogeneity across a surfacecan be measured using force-volume microscopy (FVM). Ata sampling location, the adhesive force is measured by pullingon an AFM tip that is in contact with the surface. As the tipis pulled, forces such as van-der-Waals attraction andelectrostatic repulsion are balanced by the force of mechan-ical deflection of the tip cantilever. The adhesive force fadh
is, by definition, the deflective force fcant on the cantileverjust prior to tip-surface separation:
where the asterisk represents the condition of “just prior totip-surface separation”. Measurements made of the adhesiveforce at each x-y lateral location provide a map fadh(x,y) ofthe heterogeneity of the adhesive forces over the oxide-carbonate surface.
The objectives of this research were to quantify thedifferent adhesive forces over the oxide nanostructures andthe exposed rhodochrosite using FVM and to separate thecontribution to adhesion of electrostatic repulsion from thatof van-der-Waals attraction. Specifically, we measured theadhesive forces for an ionic strength of 1 mM and varied pHfrom 5.0 to 9.7. Compared to our previous companion studythat quantified the interfacial forces influencing adsorption(18), the present study quantifies the adhesive forces thataffect desorption.
2. Experimental MethodsManganese oxide nanostructures were grown by reactingfreshly cleaved rhodochrosite samples with dissolved oxygenfor 2 h at pH 6.3, as described previously (8, 16, 18). Thesamples were then transferred to the fluid cell of a Veecomultimode scanning probe microscope for the measurementof the adhesive force between the surface and a silicon-nitrideAFM tip (Veeco DNP-S, spring constant: 48.8 pN nm-1)(Supporting Information (SI) Figure S1). In the fluid cell,both the sample and the AFM tip were immersed in aqueous* Corresponding author e-mail: [email protected].
fadh ) fcant∗ (1)
Environ. Sci. Technol. 2009, 43, 4967–4972
10.1021/es900500k CCC: $40.75 2009 American Chemical Society VOL. 43, NO. 13, 2009 / ENVIRONMENTAL SCIENCE & TECHNOLOGY 9 4967
Published on Web 05/29/2009
solution. The aqueous solution was adjusted to 1 mM ionicstrength using sodium nitrate. The pH was adjusted between5.0 and 9.7 using nitric acid and sodium hydroxide.
A typical experiment was performed as follows. Contact-mode microscopy was first used to locate a representative1 × 1 µm2 region that contained both manganese oxidenanostructures and the exposed rhodochrosite substrate(8, 10, 16-18). Force-volume microscopy, using the imple-mentation described in ref 18, was performed to measureadhesive forces in a lateral matrix of 16 × 16 samplinglocations. The FVM measurements were performed at25((2)°C after the experimental assembly had reachedthermal equilibrium (23).
Each measurement of adhesive force during an FVM scanbegan by pressing the tip into contact with the surface usinga force of ca. +1000 pN. The pressing force was applied bybringing the sample stage toward the AFM tip, which wasmounted to an end of a cantilever. The fixed end of thecantilever was secured at constant height. When thetip-surface contact was established, further elevation ofthe sample stage pressed the tip on the surface and bent thecantilever. After the force fcant reached its preset value of+1000 pN, the sample stage was gradually lowered to releasethe force at a rate of less than 3750 pN s-1. Eventually theforce reversed from pressing (i.e., a positive force) to pulling(i.e., a negative force), representing a switch of the tip-surfaceinteraction from repulsion to attraction. While the cantileverforce fcant was being released, the tip-surface distance z wassimultaneously obtained from cantilever deflection and themovement of the sample stage. The basic informationobtained at each x-y lateral location of the FVM scan was,therefore, a set of fcant-z data pairs defining a force-distancecurve. For each such curve, the local surface adhesion fadh
was determined through eq 1. Scanning in the x-y planeprovided a map of fadh(x,y) every 15 min.
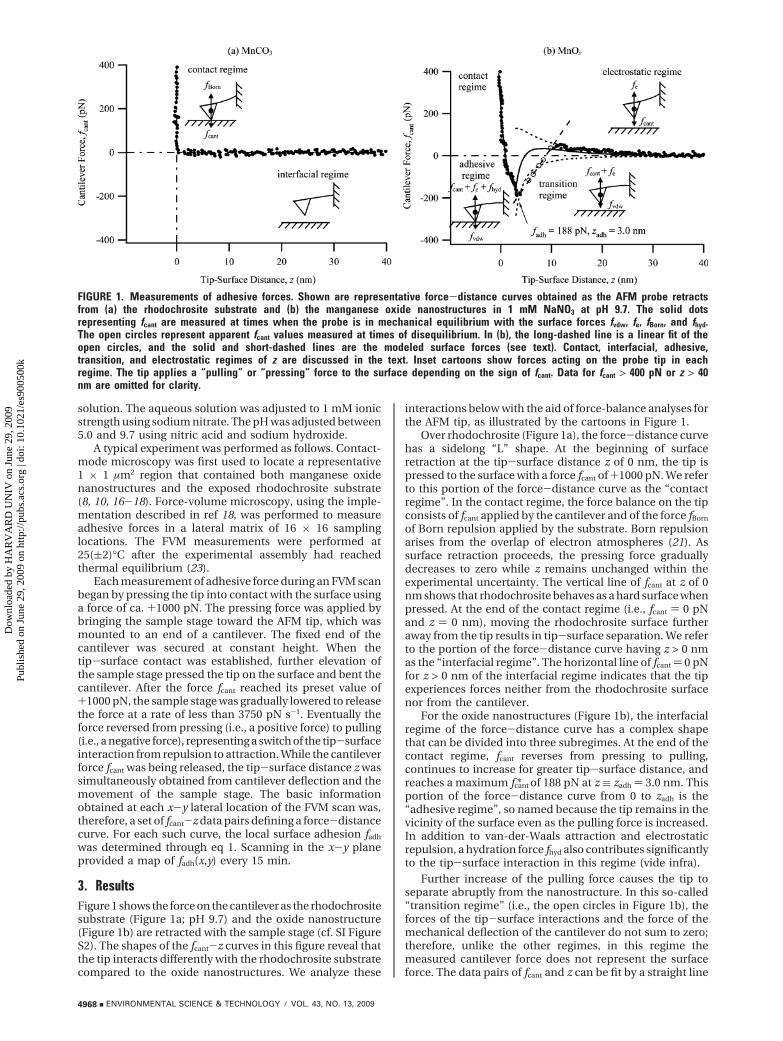
3. ResultsFigure 1 shows the force on the cantilever as the rhodochrositesubstrate (Figure 1a; pH 9.7) and the oxide nanostructure(Figure 1b) are retracted with the sample stage (cf. SI FigureS2). The shapes of the fcant-z curves in this figure reveal thatthe tip interacts differently with the rhodochrosite substratecompared to the oxide nanostructures. We analyze these
interactions below with the aid of force-balance analyses forthe AFM tip, as illustrated by the cartoons in Figure 1.
Over rhodochrosite (Figure 1a), the force-distance curvehas a sidelong “L” shape. At the beginning of surfaceretraction at the tip-surface distance z of 0 nm, the tip ispressed to the surface with a force fcant of +1000 pN. We referto this portion of the force-distance curve as the “contactregime”. In the contact regime, the force balance on the tipconsists of fcant applied by the cantilever and of the force fBorn
of Born repulsion applied by the substrate. Born repulsionarises from the overlap of electron atmospheres (21). Assurface retraction proceeds, the pressing force graduallydecreases to zero while z remains unchanged within theexperimental uncertainty. The vertical line of fcant at z of 0nm shows that rhodochrosite behaves as a hard surface whenpressed. At the end of the contact regime (i.e., fcant ) 0 pNand z ) 0 nm), moving the rhodochrosite surface furtheraway from the tip results in tip-surface separation. We referto the portion of the force-distance curve having z > 0 nmas the “interfacial regime”. The horizontal line of fcant ) 0 pNfor z > 0 nm of the interfacial regime indicates that the tipexperiences forces neither from the rhodochrosite surfacenor from the cantilever.
For the oxide nanostructures (Figure 1b), the interfacialregime of the force-distance curve has a complex shapethat can be divided into three subregimes. At the end of thecontact regime, fcant reverses from pressing to pulling,continues to increase for greater tip-surface distance, andreaches a maximum fcant* of 188 pN at z ≡ zadh ) 3.0 nm. Thisportion of the force-distance curve from 0 to zadh is the“adhesive regime”, so named because the tip remains in thevicinity of the surface even as the pulling force is increased.In addition to van-der-Waals attraction and electrostaticrepulsion, a hydration force fhyd also contributes significantlyto the tip-surface interaction in this regime (vide infra).
Further increase of the pulling force causes the tip toseparate abruptly from the nanostructure. In this so-called“transition regime” (i.e., the open circles in Figure 1b), theforces of the tip-surface interactions and the force of themechanical deflection of the cantilever do not sum to zero;therefore, unlike the other regimes, in this regime themeasured cantilever force does not represent the surfaceforce. The data pairs of fcant and z can be fit by a straight line
FIGURE 1. Measurements of adhesive forces. Shown are representative force-distance curves obtained as the AFM probe retractsfrom (a) the rhodochrosite substrate and (b) the manganese oxide nanostructures in 1 mM NaNO3 at pH 9.7. The solid dotsrepresenting fcant are measured at times when the probe is in mechanical equilibrium with the surface forces fvdw, fe, fBorn, and fhyd.The open circles represent apparent fcant values measured at times of disequilibrium. In (b), the long-dashed line is a linear fit of theopen circles, and the solid and short-dashed lines are the modeled surface forces (see text). Contact, interfacial, adhesive,transition, and electrostatic regimes of z are discussed in the text. Inset cartoons show forces acting on the probe tip in eachregime. The tip applies a “pulling” or “pressing” force to the surface depending on the sign of fcant. Data for fcant > 400 pN or z > 40nm are omitted for clarity.
4968 9 ENVIRONMENTAL SCIENCE & TECHNOLOGY / VOL. 43, NO. 13, 2009
with a slope of 49.4((0.1) pN nm-1, including an adjustmentfor the movement of the sample stage (cf. SI Figure S3). Themagnitude of the slope agrees well with the spring constantk of the cantilever, which is indicative of the breakdown offorce balance. This phenomenon is often referred to as the“snapping back” of the cantilever, which occurs when theforce gradient exceeds the spring constant of the cantilever(19).
Force balance is restored for the cantilever by z of 10.4nm, after which the force that the cantilever applies to thetip through mechanical deflection is again balanced by thoserelated to the surface. Long-range repulsive forces (i.e., z >10.4 nm) associated with the surface are electrostatic. Thisportion of the force-distance curve for retraction thereforecoincides with that for approach at the same location (cf. SIFigure S2). We therefore term this portion of the force-distance curve as the “electrostatic regime”. An electrostaticregime of repulsion is also consistent with our earlier workthat established that both the AFM tip and the oxidenanostructures are negatively charged at pH 9.7 (18). As zfurther increases beyond approximately 25 nm, fcant fallstoward zero because the electrostatic repulsion diminishes(18).
Application of eq 1 to the observations shown in Figure1b yields an adhesive force fadh(MnOx) of 188 pN. Incomparison, a typical measurement over rhodochrosite hasan adhesive force of 0 pN, within experimental uncertainty.For context, literature values are 56 400, and 1760 pN formica, gold, and silica, respectively, for adhesion to a similartip near circumneutral pH (24). The nanostructures therefore
have appreciable adhesion, at least to the AFM tip and anychemical or biological adsorbates similar to it.
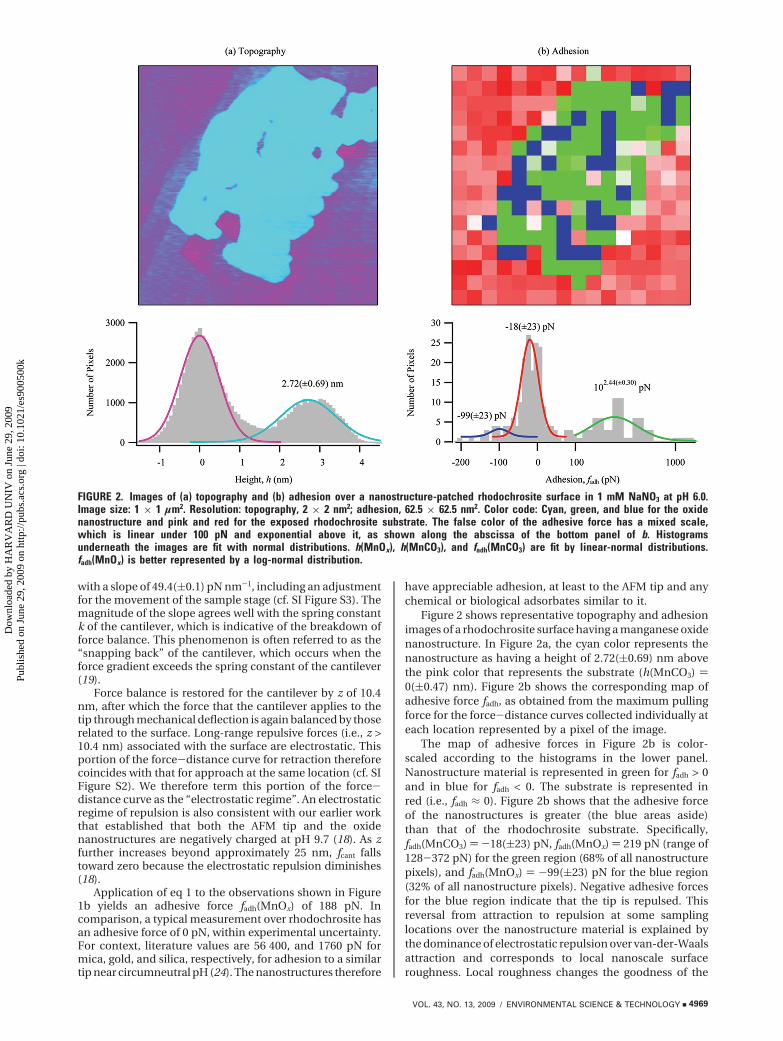
Figure 2 shows representative topography and adhesionimages of a rhodochrosite surface having a manganese oxidenanostructure. In Figure 2a, the cyan color represents thenanostructure as having a height of 2.72((0.69) nm abovethe pink color that represents the substrate (h(MnCO3) )0((0.47) nm). Figure 2b shows the corresponding map ofadhesive force fadh, as obtained from the maximum pullingforce for the force-distance curves collected individually ateach location represented by a pixel of the image.
The map of adhesive forces in Figure 2b is color-scaled according to the histograms in the lower panel.Nanostructure material is represented in green for fadh > 0and in blue for fadh < 0. The substrate is represented inred (i.e., fadh ≈ 0). Figure 2b shows that the adhesive forceof the nanostructures is greater (the blue areas aside)than that of the rhodochrosite substrate. Specifically,fadh(MnCO3) ) -18((23) pN, fadh(MnOx) ) 219 pN (range of128-372 pN) for the green region (68% of all nanostructurepixels), and fadh(MnOx) ) -99((23) pN for the blue region(32% of all nanostructure pixels). Negative adhesive forcesfor the blue region indicate that the tip is repulsed. Thisreversal from attraction to repulsion at some samplinglocations over the nanostructure material is explained bythe dominance of electrostatic repulsion over van-der-Waalsattraction and corresponds to local nanoscale surfaceroughness. Local roughness changes the goodness of the
FIGURE 2. Images of (a) topography and (b) adhesion over a nanostructure-patched rhodochrosite surface in 1 mM NaNO3 at pH 6.0.Image size: 1 × 1 µm2. Resolution: topography, 2 × 2 nm2; adhesion, 62.5 × 62.5 nm2. Color code: Cyan, green, and blue for the oxidenanostructure and pink and red for the exposed rhodochrosite substrate. The false color of the adhesive force has a mixed scale,which is linear under 100 pN and exponential above it, as shown along the abscissa of the bottom panel of b. Histogramsunderneath the images are fit with normal distributions. h(MnOx), h(MnCO3), and fadh(MnCO3) are fit by linear-normal distributions.fadh(MnOx) is better represented by a log-normal distribution.
VOL. 43, NO. 13, 2009 / ENVIRONMENTAL SCIENCE & TECHNOLOGY 9 4969

tip-surface contact and hence the ratio of the force ofelectrostatic repulsion to that of van-der-Waals attraction(vide infra).
Figure 3 shows the dependence of adhesive force on pH.Results, corresponding to the green and red regions in Figure2b, are shown for the oxide nanostructures (i.e., fadh > 0) andfor the exposed rhodochrosite substrate. The central valuein the frequency distribution of the adhesive forces over thenanostructures increases from 166 to 692 pN for pH from 5.0to 7.1, reaches a maximum, and then decreases from 692 to275 pN for pH from 7.1 to 9.7. The trend is described by apiecewise linear regression (cf. SI Table S2):
The pH dependence cannot be attributed to nano-structure topography, which does not vary with pH (18).Using these data, we estimate at 95% confidence thatpHpzc(MnOx) ) 7.1((0.4). The uncertainty follows fromtwice the uncertainty of the force measurements, asestimated using data for z > 40 nm (i.e., ca. 15 pN). Thisvalue of 7.1((0.4) agrees with pHpzc(MnOx) ) 6.5((0.7)estimated in earlier work that employed noncontactmethods (18). In contrast to fadh(MnOx), the regression offadh(MnCO3) with pH is not statistically significant (cf. SI TableS3), indicating no detectable dependence on pH. For this reason,its average is shown in Figure 3 as a horizontal dashed linerepresenting fjadh(MnCO3) ) 8((22) pN.
4. DiscussionAdhesion between a surface and an adsorbate is a compre-hensive parameter that includes contributions by severaldifferent forces. In the following sections, our discussion isorganized as follows: (1) van-der-Waals and electrostaticforces over the nanostructures (i.e., DLVO forces; Section
4.1), (2) hydration and Born forces over the nanostructures(i.e., non-DLVO forces; Section 4.2, (3) effects of surfaceroughness on adhesion (Section 4.3), and (4) the adhesiveforces over the exposed rhodochrosite substrate (Section 4.4).
4.1. van-der-Waals and Electrostatic Forces over theNanostructures. For the portion of the force-distance curveover which the tip and the surface are not in contact, thevan-der-Waals attraction and the electrostatic repulsion canbe modeled as a sphere over a plane, as described by theDerjaguin-Landau-Verwey-Overbeek (DLVO) theory(18, 19):
The Hamaker coefficient H characterizes the dispersioninteraction between the electron cloud of the nanostructureand that of the tip (25). The radius R corresponds to thecurvature of the tip, with is nominally 10 nm, but can be aslarge as 40 nm, according to the manufacturer. The atomicspacing z0 is 0.165 nm (21). The reciprocal κ of the Debyelength characterizes the thinness of the electrical double layernext to the charged surface. The term equals 0.11 nm-1 for1 mM NaNO3 at 25 °C. Other terms in eq 4 include thedielectric constant ε of water, the vacuum permittivity ε0,and the charge densities σtip and σsurf on the AFM tip and thesurface, respectively. The term σsurf is further categorized aseither σnano or σsub depending on whether the tip is over thenanostructures or the remaining exposed rhodochrositesubstrate, respectively. The term H is similarly subcategorizedas Hnano or Hsub.
Using σtip )-0.013((0.002) C m-2 (18), we fit the data forz > 10.4 nm of Figure 1b by eq 4, obtaining σnano )-0.005((0.0002) C m-2 for R ) 10 nm. The fit is shown bythe positive dashed line in Figure 1b for z > 10.4 nm and isextrapolated to z > 3 nm. To consider how uncertainty in thetip radius propagates into uncertainty in σnano, we employ alog-normal probability distribution for R using a mode of 10nm and a geometric standard deviation of 1.5 nm (cf. SIFigure S4). This distribution is consistent with the manu-facturer’s specifications that the nominal and maximumvalues of R are 10 and 40 nm, respectively. For one standarddeviation, we obtain σnano ) {-0.008((0.0003) C m-2,-0.003((0.0002) C m-2}. The estimated σnano is consistentwith the value of-0.002 ((0.0005) C m-2 estimated previouslyusing the data of a force-distance curve obtained onapproach (18). In that earlier work, however, the adhesiveregime was not considered. Reanalysis of those earlier datayields an updated estimate of -0.003 ((0.0005) C m-2.
Application of eqs 3 and 4 to the adhesive regime of Figure1b, in conjunction with the relationship fadh) fcant*) fvdw(zadh)+ fe(zadh), allows the Hamaker coefficient to be estimated.Using fadh ) 188((15) pN, fe(zadh) < 180((23) pN, zadh )3.0((0.42) nm, and R of 10(×/÷1.5) nm, we calculate that12((6) × 10-19 J < Hnano < 22((11) × 10-19 J. This range bracketsan estimate of 7((1) × 10-19 J obtained using complementarydata of a force-distance curve obtained on approach (i.e.,ref 18 with reanalysis described above). For a central valueHnano of 17((9) × 10-19 J, the contributions of fvdw(z) and fe(z< 10.4 nm) to the force-distance curve are represented inFigure 1b by the dashed lines. The magnitude of Hnano ischaracteristic of semiconducting and conducting materials.For comparison, Hamaker coefficients of insulators arearound 10-20 J (19). An implication of semiconductingproperties for the oxide nanostructures is consistent withour previous observation that these structures have greater
FIGURE 3. Dependence of adhesive forces on pH in 1 mMNaNO3. The solid lines are piecewise least-squares linearregressions of log fadh(MnOx) and pH over the green region ofthe nanostructures (i.e., fadh > 0) in Figure 2b. The dashed lineis the average of the surface adhesion over the exposedrhodochrosite represented in red. The regression equations(solid lines) and the average value (dashed line) are providedin the text. The ordinate of fadh is a mixed linear-exponentialscale having a switching point at 100 pN.
log fadh(MnOx) )
{0.64((0.63) + 0.29((0.10)pH for pH < 7.13.41((0.10) - 0.10((0.08)pH for pH > 7.1
(2)
fvdw ) - HR
6(z + z0)2(3)
fe ) 4πRεε0κ
[σtipσsurfexp(-κz) + 12
(σtip2 + σsurf
2 )exp(-2κz)](4)
4970 9 ENVIRONMENTAL SCIENCE & TECHNOLOGY / VOL. 43, NO. 13, 2009