Urban Agriculture in Naga City: Growing Food, Growing Partnerships, Growing Naga

A n n u a l R e p o r t 2 0 0 9G r o w i n gP a r t n e r s h i p sW o r l d w i d e

Fenner is a world leader in reinforced polymer technology.
Our strategy is to increase market share and target newvalue added product areas.
We will continue to concentrate on growing thosebusinesses where we already demonstrate leadershipthrough our skills in applications, design, materialstechnology and dedication to customer service as well asby carefully planned acquisitions.
G r o w i n gP a r t n e r s h i p sW o r l d w i d e
Contents
1 Financial Highlights
2 Chairman’s Statement
4 Business Review - ChiefExecutive Officer’s Review
1 2 Business Review - GroupFinance Director’s Review
1 5 Business Review - Definition ofKey Performance Indicators Used
1 6 The Board
1 7 Corporate Governance
2 2 Corporate Responsibility Report
2 7 Board Remuneration Report
3 4 Directors’ Report
3 8 Independent Auditors’ Report
3 9 Group Financial Statements
7 7 Independent Auditors’ Report- Company
7 8 Company Financial Statements
8 3 Five Year Summary of the Group
8 4 Annual General MeetingAdvisorsFinancial Calendar

F i n a n c i a l H i g h l i g h t s
F e n n e r p l c 1
2009 2008£m £m
Revenue 499.4 437.8
Underlying operating profit 1 41.3 49.3
Exceptional items (17.4) (3.4)
Operating profit 17.1 43.8
Underlying profit before taxation 2 31.1 42.1
Profit before taxation 5.6 36.3
Underlying earnings per share 2 12.8p 17.7p
Basic earnings per share 2.6p 15.5p
Dividend per share 6.6p 6.6p
1 Underlying operating profit is before amortisation of intangible assets acquired and exceptional items
2 Underlying profit before taxation and underlying earnings per share are before amortisation of intangibleassets acquired, exceptional items and notional interest
O u r c o a l r e l a t e db u s i n e s s e s h a v ep e r f o r m e d e x t r e m e l yw e l l t o d e l i v e r g r o w t h
C h a i r m a n ’ s S t a t e m e n t
FINANCIAL HIGHLIGHTSRevenue increased by 14% to £499.4m(2008 £437.8m). This increase included£46.6m from the net effect of acquisitionsand disposals and £73.8m of favourablecurrency translation.
Underlying operating profit of £41.3m (2008£49.3m) held up well through the globaleconomic downturn, underpinned by thestrength of demand from the mining andmedical sectors, together with the earlyimplementation of cost reduction initiatives inthose parts of the Group which wereexposed to reduced demand levels. Thefavourable net effects of acquisitions anddisposals was £5.0m and currencytranslation was £8.5m.
Exceptional items of £17.4m (2008 £3.4m)principally comprised restructuring andreorganisation costs associated with ourmajor investment projects and downsizingcosts associated with the global economicdownturn. Regretfully, the effects of thedownturn resulted in a reduction in employeesof 832. The associated annual cost savingsare estimated to be in excess of £23.0m.Operating profit was £17.1m (2008 £43.8m).
Net finance costs increased to £11.5m (2008£7.5m), comprising £10.2m (2008 £7.2m) ofnet interest payable and a non-cash notionalcharge of £1.3m (2008 £0.3m) relating to theunwinding of discount on provisions. The
increase in interest was due to the plannedhigher level of borrowings from ourinvestment programmes and unfavourableexchange rate movements.
The headline and underlying tax rates were18% and 28% respectively. Underlyingearnings per share was 12.8p (2008 17.7p)and basic earnings per share was 2.6p(2008 15.5p).
Net cash from operating activities generated£36.4m (2008 £28.2m), assisted by stringentmanagement of working capital levels whichgenerated a cash inflow of £16.5m (2008outflow of £8.2m). Investing activities relatingto capital expenditure and acquisition ofbusinesses amounted to £71.4m (2008£104.2m). Of this amount, £37.6m wasinvested in acquisitions, principally theassets and liabilities of the ConveyorServices Corporation group of companies(Conveyor Services) and the entire sharecapital of Solid Systems Engineering, LLC(Solid Systems). Capital expenditureamounted to £34.3m of which £18.4mrelated to our recently commissioned steelcord facility in Western Australia. The effectof exchange rate movements gave rise to anincrease in debt of £21.2m. The resultant netdebt was in accordance with our forecasts at£165.4m (2008 £97.6m) which gave aheadroom of approximately £70m overavailable facilities. Interest cover was 4.0times (2008 6.8 times).
The strength of the Group’s businesses with their geographical spread has been
demonstrated throughout the year despite economic conditions unseen for many
years. Our coal related businesses have performed extremely well to deliver growth.
The industrial businesses were presented with many business challenges and
reacted swiftly where necessary to the changing environment to manage
performance levels, whilst protecting our core competencies.
2 F e n n e r p l c

None of the Group’s major committed debtfacilities are due for re-negotiation until 2012.
The Board is recommending a maintainedfinal dividend of 4.4p per share which givesa total dividend for the year of 6.6p per share(2008 6.6p).
OPERATIONSThe Conveyor Belting Division’s resultbenefited from robust demand from the coalsector, in particular the energy drivendemand for thermal coal. Our recentinvestment programmes across a network ofglobal business units has led to growth inour coal related businesses, increasedflexibility in our manufacturing choices andenhanced our ability to exceed ourcustomers’ expectations. In Asia Pacific, ourgrowth projections were exceeded throughthe continuing development of our productand service offerings across a widergeographical area. At the end of the year,another strategic milestone was completedin the development of the Division when ournew world-class manufacturing facility inWestern Australia was commissioned. Thiswill contribute to operational performance inthe current financial year. In North Americaand Europe, mining volumes were strongwhich somewhat mitigated the softerindustrial revenues experienced. In October2008, our service network was significantlyenhanced through the acquisitions ofConveyor Services and Solid Systems which,together with prior year acquisitions, are nowintegrated in the Americas as Fenner DunlopConveyor Services. These provide a platformfor growth through range extension andservice channels into both existing and newsectors.
In the Advanced Engineered ProductsDivision, the overall performance, in anenvironment severely depressed byeconomic conditions, was noteworthy withthe achievement of an underlying return onsales in excess of 11%. A strong result wasdelivered by our technical weaving businesswhich was made possible by furtherprogress in developments in the medical
sector. Elsewhere, the Division suffered fromthe effects of deteriorating economicconditions which filtered through the supplychain during the second half of the year.Downstream de-stocking activities furtherexacerbated the position with lows in thecycle seen around late spring beforelevelling out in the summer. Signs ofimprovement emerged around our financialyear end as enquiry levels started to pick up.With the cost reduction initiativesimplemented through the downturn and afocus on maintaining service levels, theDivision is well positioned to benefit from itsoperational gearing and ability to respond tocustomer demand.
PEOPLEOn behalf of the Board, I would like to thankall our employees for their continuing supportduring a period which has presented manychallenges to our businesses around theworld.
OUTLOOKEach of our businesses have restructuredcosts appropriately to meet demand levelsprevalent during the year, however, they haveretained the skills and ability to respond tothe current volume pick-up. We are seeingearly but clear signs of underlyingimprovements in our markets and thebenefits of market share gains in a numberof areas.
For several months our Advanced EngineeredProducts Division has seen benefits from theend of customer de-stocking. This iscombined with increasingly encouragingsigns that the worst effects of the recessionare behind us, although we expect growthand recovery to be slow.
Our Conveyor Belting businesses have madea positive start to the year with the prospectof Asia Pacific continuing its growth trend.
colin cooke
Chairman
F e n n e r p l c 3
Financial performance measures described as “underlying” within this statement are before amortisation ofintangible assets acquired and exceptional items and, where applicable, notional interest.

INTRODUCTION AND STRATEGYOur strategy is to increase market share andtarget new value added product areas. Wecontinue to concentrate on growing thosebusinesses where we already demonstrateleadership through our skills in applications,design, materials technology and dedicationto customer service as well as by carefullyplanned acquisitions. This common aimacross a wide range of industrial marketsgives Fenner a solid basis for long termgrowth, stability and shareholder value.Fenner is proud to be a world-class globalmanufacturer, with a strong commitment tohealth and safety, operating in key territoriesin established and emerging markets.
During the year under review, Fenner hasresponded to the global economic downturnin a swift, controlled and systematic manner.All operations that were impacted by thedownturn ensured that costs and cash werecontained by reducing headcount, strippingout non-essential expenditure, reducinginventory and ensuring both margin andmarket share were protected. None of ouroperations cut headcount beyond what wasessential to maintain a healthy business. Inmany cases we were able to retain key skillsby reducing employment costs throughsalary sacrifice, temporary lay-offs andshort-time working. This has ensured thatthe operations are well positioned to benefitfrom a subsequent improvement in theeconomy. New product developmentcontinued during the downturn as this is akey component of future growth andpositions the operations favourably againstcompetitors in our ability to servicecustomer expectations.
The Fenner Group consists of two Divisions,the Conveyor Belting (“CB”) Division and theAdvanced Engineered Products (“AEP”)Division.
Both CB and AEP provide high quality,comprehensive, whole life value products fortheir customers and both have a strongbrand and reputation in their chosenmarkets. These characteristics areconsidered to be key to the success of theGroup over its long history. Customersatisfaction is of importance to all businessunits, who ensure they are meeting theircustomer expectations which are specific toeach market. Experienced sales teamsmaintain close contact with customers,providing feedback on expectations andperformance. These qualitative indicatorsare complemented by quantitativemeasurements including customer surveysand “on time in full” performance.
As a diversified Group, Fenner uses a widerange of materials, from thousands of tonnesof rubber compound to a few hundredgrammes of metallic and polymericbiomaterials. Not only do we use significantvolumes of some materials, we also workclosely with selected suppliers to ensurethat our customers benefit from the latesttechnical developments in materials andprocesses. The majority of theserelationships are in the normal course ofbusiness, ensuring quality, continuity ofsupply and reasonable commercial terms.Where appropriate, and usually relating totechnical developments, relationships areformally documented. Operations remainvigilant to potential problems in the supplychain to ensure continued stability andcontinuity of supply.
CONVEYOR BELTINGThe CB Division is a recognised worldleader in the global conveyor belting market.It manufactures heavyweight ply, solidwoven and steel cord conveyor belting formining, power generation and industrialapplications and has growing servicebusinesses, mainly in Australia and the USA,
“We responded swiftly to the challenges of global recession whilst retaining, and in
carefully selected markets investing in, the capability and capacity to benefit fully from
the recovery.”
Mark Abrahams - Chief Executive Officer
R e s i l i e n t a n dr e s p o n s i v e
B u s i n e s s R e v i e wC h i e f E x e c u t i v e O f f i c e r ’ s R e v i e w
4 F e n n e r p l c

F e n n e r p l c 5
Sept 09 Sept 07 Sept 08Sept 06
which install, monitor and service conveyorsystems for our mining customers.
In November 2008, following the acquisitionsof the businesses of the Conveyor ServicesCorporation group of companies and SolidSystems Engineering, LLC, Fenner DunlopConveyor Services was launched, providinga full service offering to our US coalcustomers on their conveyor systems. Inaddition to branch locations matching thoseof our US customers, we also acquired ourfirst CB business in South America which islocated in Antofagasta, Chile.
By December 2008, the two new belt lines inour Port Clinton, Ohio facility were fullycommissioned and January 2009 saw thecompletion of our weaving facility inLavonia, Georgia. These give Fennerunrivalled integrated facilities for theproduction of steel cord and rubber plyconveyor belting in the Americas.
The formal opening of our facility in Kwinananear Perth, Western Australia was in July2009. This purpose built plant houses theworld’s largest steel cord press, calenderand related equipment and is strategicallylocated to service the iron ore miners ofNorth Western Australia and elsewhere in theworld through the nearby port of Fremantle.
As expected, and illustrated by theMcCloskey graph below, energy coal pricesfell from the unsustainable levels seen in thefirst half of 2008. Whilst the fall wasprecipitous, prices did not fall below the“trigger” value at which coal companies buybelt. In recent months, prices for bothenergy coal and metallurgical coal appearto be firming. Australian export volumes inthe first eight months of the year are up onthe same period in 2008.
With the exception of those parts of theoperations which serve the industrialmarkets, CB experienced positive trading
conditions throughout the year under review;although all faced a variety of challengesincluding the effects of the lack of liquidityon customers and suppliers, competitivethreats and delays in new projects.
The Australian business has continued itsgrowth year on year. Much of this isattributable to a strong first half followed bythe implementation of the BHP Billiton ironore service contract in Western Australia.Coal and iron ore are the main tradingexports for the country and the biggestinfluence on the trading performance of ourAustralian operations and both of thesecommodities continue to have a positiveoutlook. It is widely reported that the recentround of iron ore contract negotiationsbetween Rio Tinto, Vale, BHP and Chinese /Asian steel mills are expected to set thepricing at higher levels than the long termaverage. Coking Coal with the lower pricingis once more at record production andexport levels. The Chinese have beenresponsible for much of the extra volumeuptake although India is expected to grow itscoal imports significantly.
The Australian service branches not alignedto coal and iron ore have experiencedtougher market conditions although we haveplaced our service operations in regions ofsignificant future mining growth and ensuredour belt supply offers are aligned with theneeds of our major clients. The sale ofbelting has been above budget overall and,whilst we expect competition to be tight,market share will be maintained.
The Western Australian business is now wellpositioned to be part of the fastest growingsector of the Australian economy. Theresources boom followed by the globalrecession stalled most major projects overrecent months but the second wave of newprojects is just recommencing with agrowing confidence for 2010, particularly thesecond half.
The economic downturn in the Americassignificantly impacted the trading volume inall market segments, in particular, theindustrial segment. The aggregate, cement,construction and wood products markets aredepressed by an estimated 30%-40% withlittle sign of recovery until mid 2010. Ourdistributors that service this market aretaking a conservative approach to re-stockingas cash flow is the critical component totheir survival. In this situation, our dedicationto rapid service will be a key differentiator.
NW EUROPE - STEAM COAL MARKER
MONTHLY AVERAGE

B u s i n e s s R e v i e wC h i e f E x e c u t i v e O f f i c e r ’ s R e v i e w c o n t i n u e d
In the USA, most major coal miningcompanies reported strong earnings duringthe first quarter of 2009 but, due to mildweather and excessive coal stocks, havesubsequently experienced a slowdown incoal sales. Economic and meteorologicalfactors decreased electricity demandthroughout 2009, reducing demand forenergy coal which was further compoundedby historically high stocks. Together withreduced exports of metallurgical coal andlow natural gas pricing, this is expected tolead to a 5%-8% reduction in demand forcoal in the calendar year. Peabody, ArchCoal and Consol all cut production early andreport that their current capacities are soldout into 2010.
For over 50 years Fenner has manufacturedfire resistant belts to the highest standardsfor use in underground coal mines. Wewelcome the introduction in the USA of anew, higher standard of fire resistanceMSHA 30CFR14 (B.E.L.T.). From 31December 2009, conveyor belts installed inunderground mines in the USA need to bemanufactured to B.E.L.T. standard. We havesuccessfully launched the new Firebossrange of belts, including belts reinforcedwith our superior UsFlex fabric made at ourLavonia plant. The combination of the newFireboss compound and UsFlex fabric willgreatly improve the safety of the belt andimprove its durability.
Despite a drop in sales volume of industrialbelts, market share was maintained.European distributors, largely serving thesteel, cement and automotive industries,have seen a substantial drop in sales whichhas resulted in a similar drop in sales fromstock at Dunlop Conveyor Belting, based inDrachten, Netherlands. This drop was offsetto a degree by a better than averageperformance in Africa and the Middle Eastwhich, when combined with tight costmanagement initiatives, minimised theimpact.
The solid woven businesses have performedwell this year, largely due to high demandfrom both coal and potash producers in theirtarget markets. Raw material prices wereextremely volatile in the early part of theyear; in some areas the financial crisiscaused suppliers to offer large discounts,but signs towards the end of the year werepointing to a resumption of price increases.Spare capacity in India has been used tohelp meet demand elsewhere. Solid wovenbelting remains the core of the business
although the new steel cord offering in SouthAfrica is progressing well, building on theincreasing recognition of belt quality by itscustomers.
In India and China, there will be a continuedeffort to introduce heavy duty belts toappropriate customers. The Indian operationwill initially source these products from ourUK plant, leaving spare capacity which willbe used to facilitate a stronger exportoffering. In the latter case, Fenner India hasthe advantage of the ability to produce PVCbelts that meet all the relevant safetystandards throughout the world. In SouthAfrica, entry into Black EconomicEmpowerment mining juniors and non-coalapplications remains important. Theexpansion of the conveyor service offer willprove significant in a market which isincreasingly looking for total conveyormaintenance.
With ten locations throughout the USA andone in Chile, the newly formed FennerDunlop Conveyor Services offers allconveyor related needs including: conveyorbelting, conveyor components, conveyorstructures, installation, vulcanized splicing,system repairs, contract maintenance,transfer point technology, conveyor systemdesign, belt scanning, coal transport andengineering services. In addition, under thename of Classic Conveyor Components, wemanufacture and supply conveyor idlers,scrapers and structure. Based in Paonia,Colorado, LoadOut Services offers contractlabour and management to run coal washplants and train loading facilities.
ADVANCED ENGINEERED PRODUCTSThe AEP Division is divided into five productgroup businesses which are managed on aglobal basis. These businesses are:• Fenner Precision, which is a leading
supplier of performance critical polymercomponents to the office automationindustry;
• Fenner Drives, which designs,manufactures and sells an extensiverange of bespoke solutions formechanical power transmission andmotion transfer applications;
• The supply of silicone and EPDMspeciality hoses for the diesel engine,truck, bus and off-road equipment OEMmarket, trading as James Dawson;
• Fenner Advanced Sealing Technologies("FAST"), which comprises performancecritical hydraulic and pneumatic seals forthe global fluid power industry, trading
6 F e n n e r p l c

F e n n e r p l c 7
as Hallite and bespoke sealing productsfor process applications including oil andgas, electronics, pumps, valves,compressors and aerospaceapplications, trading as CDI/EGC; and
• Secant Medical, a leading developer andmanufacturer of custom-engineeredbiomedical textile structures for medicaldevices and Prodesco, providingspecialist industrial fabrics.
All operations within AEP aim to providehigh value added solutions to theircustomers’ needs using advancedpolymeric materials, expertise in applicationdesign, effective manufacturing design skillsand timely delivery. Expansion into furthermission critical applications is a key part ofthe AEP strategy as this supports the highadded value, niche nature of the productrange across the various AEP businessesand provides added protection against thefull effects of economic volatility.
All the AEP operations benefited from anoticeable flight to quality as customersbecame increasingly focused on quality,reliability and stability in the supply chainduring the year under review. Service levelshave been maintained throughout thetrading period with some of the AEPbusinesses continuing to invest in improvingcustomer service and infrastructure duringthe downturn.
The Hose business at James Dawson wasthe first of the AEP businesses to beimpacted by the global downturn as its OEMcustomer base experienced a severecontraction in the construction industry, witha subsequent and immediate reduction inthe number of off-road vehicles beingmanufactured using Dawson hoses. Thiscontraction was exacerbated by de-stockingin the supply chain, causing order levels tofall even further. Dawson responded to theslow down by controlling costs, reducing thework force and consolidating its satelliteoperation to the main facility in Lincoln,thereby streamlining production andimproving capability and efficiencies. Theproduct development team continued to bebusy throughout the period meaning thatDawson is well placed to promote hosesthat are compliant with changing emissionsregulations worldwide.
Fenner Drives and Fenner Precision werealso impacted by rapid de-stocking in theircustomer supply chains, with only a fewserved markets remaining unaffected. Both
businesses were fleet enough to counter theworst effects of the downturn by proactivelymanaging costs to enable variable marginsto be maintained. Fenner Drives enhancedits online trading capabilities andgeographic coverage, including the openingof a branch in Dubai; demonstratingcommitment behind their slogan “solvingmore problems in more places for morecustomers”. Fenner Precision completed theintegration of the Winfield acquisition,increased its Asian sales force anddeveloped new products, some for newmarkets like offshore wind farms.
The FAST businesses have enjoyed sixyears of continuous growth but saw areduction in demand for hydraulic and oiland gas equipment in the first quarter.However, the work of the preceding years toimprove production efficiencies, expand theproduct offering and increase service levelsmeant that FAST had gained market shareand did not suffer as marked a contractionin sales as many of its competitors. FASTreacted quickly to the downturn by cuttingcosts, overheads and employee numberswhilst still protecting its core businesscapability. The strategic aim of FASTcontinues to be to generate a healthy returnon sales whilst using the most advancedmaterials and technology to supply bettersolutions for performance criticalapplications ahead of its competitors. FASTcontinues to expand its global presence andmaintain its reputation for high qualityproducts.
The medical and technical textilebusinesses represented by Secant Medicaland Prodesco were not impacted as sharplyby the economic downturn and continued totrade well during the year. Furtherinvestment in the medical business tobroaden the technical capability andproduct platform is seen as a key strategyfor these businesses and continues to beprogressed as a priority. Whilst not having asignificant impact, the potential changes inUS healthcare are creating someuncertainty, however demographic trendswill inexorably increase demand over thenext 10 to 20 years.
By the end of the fiscal year, order levelshad stabilised and there are increasingsigns that de-stocking by the customer baseis coming to an end. All the businesses arepoised to take advantage of opportunities asthey arise.

SALES PER EMPLOYEE
YEAR
£’00
0
B u s i n e s s R e v i e wC h i e f E x e c u t i v e O f f i c e r ’ s R e v i e w c o n t i n u e d
SUMMARY AND OUTLOOKThe last year has been one of the mostchallenging ever experienced in the face ofrapidly deteriorating economies around theworld. However, the robustness of ourstrategy has enabled us to demonstrate ourresilience with roughly half of the Group stillgrowing in this tough environment. Theother half, which was adversely impacted bythe economy, responded incisively andswiftly to realign its cost base whilstretaining our long term values of safety,customer service and product development.
This has left the Group very stronglypositioned to benefit from the recovery,although we expect the speed of anyimprovement in demand will vary across ourend markets.
EMPLOYEESIn this period of economic uncertainty, allbusiness units have managed costsproactively throughout the year. Difficultdecisions have been made promptly whichhas, unfortunately, led to the elimination ofmore than 800 jobs, approximately 20% ofthe total workforce. In addition, a largeproportion of the remaining workforce hasparticipated in short-time working, salarysacrifice or temporary lay-off programmes.These actions made a significantcontribution to maintaining variable marginsclose to prior year levels across the Groupas a whole.
By the end of 2009, our North AmericanService business had increased itsheadcount by almost 400 through theacquisition of the Conveyor ServicesCorporation group of companies and SolidSystems Engineering, LLC.
Overall, the Group headcount fell by closeto 400 during the year.
Productivity is a key factor to success. Dueto the increasing diversity of our operations,productivity for the Group as a whole is bestmeasured by total sales per employee.
The graph shows that, despite the growth inour service businesses, which generateslower sales per employee than ourmanufacturing businesses, and the globalrecession, sales per employee has beenmaintained at last year’s level.
All our businesses have processes thatrequire high levels of proficiency andtechnical expertise and Fenner continues tobenefit from a skilled and committedworkforce in both our acquired and existingbusinesses. We acknowledge theimportance of our employees’ contribution tothe performance of the Group.
HEALTH AND SAFETYThe Group is growing. That growth bringswith it greater responsibilities and greaterexpectations from our customers,employees and neighbours. We live in aworld of continuous improvement and healthand safety is no different in this regard; toachieve our goals we need to embed rigourand continuous improvement in the way weapproach health and safety. Fenner looksfor, and promotes, health and safety as akey element in the culture of each of itsbusinesses. The Health & SafetyManagement System Framework (“TheFramework”) is a set of Expectations whichwill help both individuals, business units andnew acquisitions understand what isrequired of them. It provides structure andguidance to all operations, irrespective ofsize, to deliver outstanding performance,protecting their unique culture andautonomy.
In order to implement The Framework, eachbusiness unit initially assesses its currentlevel of compliance with the Expectations,taking into account their operational riskprofile and the applicable regulatoryrequirements. The unit then develops animprovement plan which can incorporateand build on their existing health and safetymanagement programmes. Plans, and theprogress against those plans, are monitoredand updated annually and will be subject toindependent assessment.
Given the challenges set by the 89Expectations, it is envisioned that our wellestablished operations will take two to threeyears to fully implement The Framework andup to five years for some of our acquiredbusinesses.
An increasing number of our employeeswork on customers' sites and job safetyassessments are mandatory prior to work
8 F e n n e r p l c
100
2003/04 2004/05 2005/06 2006/07 2007/08 2008/09
105
110
115
120
125
130

F e n n e r p l c 9
commencing. For these businesses, ourhealth and safety management systems area significant unique selling proposition. Accidents and near misses are recordedand reviewed operationally and safesystems of work updated if necessary.Accidents involving lost time are reportedthrough divisional management and up tothe main Board. The process for sharing thedetails of an incident and the measurestaken around Group operations to preventsimilar accidents elsewhere has beenformalised and extended to includeguidance on wider health issues with abusiness impact, including swine flu.
The absolute number of lost time incidents("LTIs") is the KPI chosen to measure thesuccess of our health and safety policy. Theselection of an absolute measure across thewhole Group, which does not reflectchanges in employee numbers or hoursworked, demonstrates our belief thateveryone who works for Fenner shouldreturn home in the same fit and healthy statein which they came to work. We aredelighted to report that in such a difficultyear our LTIs have fallen to 81. The followinggraph shows the results over the last sixyears:
Also shown by the blue line is the number ofLTIs per 200,000 hours worked (“LTIFR”).Even with The Framework maintaining focuson health and safety, delivering continuousimprovement year on year is challenging,particularly as our operations respond toincreasing demand with higher output andadditional working hours.
ENVIRONMENTThe Group is committed to identifying andassessing the risks of pollution and otherforms of environmental impairment arisingout of its activities. We seek to reduce ourimpact on the environment to the lowestpractical levels and with each newinvestment, ensure that we exemplify thebest contemporary practice in respect of theenvironment. At Board level, the ChiefExecutive Officer has specific responsibility
for the development of policy andmanagement systems. Responsibility forenvironmental matters in each operatingdivision is designated to the DivisionalManaging Director and, at a local level, to asenior manager on each site. EachDivisional Managing Director is required toreport to the Board on a regular basis and toadvise the Board immediately of anyenvironmental risks or other incidents likelyto be significant to the business. No newrisks or incidents were reported to the Boardin the last year.
All acquisitions are subject to appropriateenvironmental due diligence which isspecifically extended to includeenvironmental management systems andoperational compliance. Given that therecent acquisition activity has given us anadditional 15 sites in the USA of a size thatcannot support specialist environmentalknowledge, we have, with our advisors,devised an assessment questionnaire toensure any issues identified at acquisitionare addressed and continuing compliance isensured.
Compliance with applicable regulatorystandards is a minimum which is subject toofficial audit; larger facilities validate theirmanagement systems by independent audit.Despite restraints on cost and staffreductions, progress continues onenvironmental management systems and wenow have eight sites implementing ISO14001 with one already accredited and theother seven scheduled for accreditation overthe next two years.
A small number of business units continueto assess their carbon footprint with a viewto seeing if some meaningful actions canresult from such measures and to preparefor, or comply with, local requirements.Although within the UK and other jurisdictionsa local consensus is developing, carbonfootprint estimates are not yet a validconsistent measure comparable across thewide range of sizes, technologies andlocations of the Group’s units. However, wehave now established a baseline for allenergy sources used in manufacturing at alevel of detail which will enable theintroduction of an appropriate standardwhen identified.
In the UK, work has been undertaken inresponse to the Carbon ReductionCommitment scheme (“CRC”), a keycomponent of the Climate Change Act. TheCRC is a UK based carbon trading scheme
2003/04 2004/05 2005/06 2006/07 2007/08 2008/09
40
20 0.5
1.0
1.5
2.0
2.5
3.0
3.5
4.0
4.5
60
80
100
120
LTIs
LTI LTIFR
LTIF
R
LOST TIME INCIDENTS
YEAR

B u s i n e s s R e v i e wC h i e f E x e c u t i v e O f f i c e r ’ s R e v i e w c o n t i n u e d
affecting large organisations that willcommence in 2010. We have undertakensite surveys at our major UK manufacturingfacilities to determine the energy baselinefor the trading scheme. We are alsopursuing an application to join a ClimateChange Agreement hosted by the BritishPlastics Federation, which will identifyenergy saving potential in each location anddraw up a plan for implementation.
In addition to our environmentalresponsibilities, there are sound commercialreasons to minimise and recycle waste. As amanufacturing Group, the obvious focus is onraw materials as the reduction opportunitiesare well known and, for the residual waste,recycling is well understood. We are workingto develop consistent and comparablereporting to capture data on all significantwaste generated throughout the Group. Air quality can be adversely affected bysome of our processes and significantinvestment and maintenance costs areincurred to ensure this does not happen.A number of locations use processes whichinvolve a range of chemicals which aregenerically referred to as volatile organiccompounds (“VOCs”). These chemicals aresubject to strict regulation with their storageand use carefully controlled. In addition tominimising any emissions to air of VOCs,potential substitutes are assessed as soonas they become commercially available.
The majority of the Group’s businesses haveoccupied their sites for many years, somefor over 100 years. The Group thereforerecognises and manages risk of exposure toenvironmental legacy issues.
Fenner continues to be committed toundertaking regular reviews of its activitiesand the workings of the environmental policyto ensure that it is comprehensive andeffective, identifying objectives andstandards that will enable a demonstrablecontinuous improvement in environmentalmatters.
PRINCIPAL RISKS AND UNCERTAINTIES Fenner considers the following to be themost significant risk factors for Fenner toconsider, but the risk factors listed do notnecessarily comprise all those associatedwith Fenner and are not set out in anyparticular order of priority.
Additional risks and uncertainties notpresently known to Fenner or that Fennercurrently deems immaterial may also havean adverse effect on its business.
Strength of key marketsAlthough there are signs that the globalrecession may be over, many marketsremain weak and we expect the recovery tobe slow. However, Fenner is well positionedto benefit from the underlying volume growthin energy markets, particularly oil and coaland recovery in industrial markets. AlthoughFenner has successfully traded throughprevious cycles, a substantial downturn inone or more of these key markets couldhave a material adverse impact on thebusiness. Fenner continues to look foropportunities that are counter cyclical tohelp balance out any market downturn.
Fluctuations in raw material costs andavailabilityVolatility in raw material costs continues tobe a key risk for the Group as there is adirect impact on the costs of production andmanaging customer expectation. The Groupcontinues to manage raw material costs. Forexample, where materials are a significantcost of sale, we have long term supplyagreements and arrangements which aredriven by the constraints of the markets intowhich we sell. However, increases in suchcosts could have a material adverse impactupon the Group’s profitability and cash flowif such increases cannot be recoveredthrough increased sales prices.
In addition, liquidity problems can adverselyaffect the availability of materials with limitedsources of supply. All business units havebeen assessing their exposure and, wherenecessary, have approved, or continue towork on approving, alternative sources.
Climate changeIn the run up to the United Nations ClimateChange Conference in Copenhagen,increasing media attention is being given toclimate change and the political will to actappears to be responding to that coverage.Fenner takes full account of the substantivepublicised research in evaluating itsstrategic projects. In advance of theCopenhagen negotiations, the InternationalEnergy Agency recently released their 450Scenario which sets out a policy frameworkand the impact on power generation todeliver a long term greenhouse gasconcentration of 450ppm CO2 equivalent,less than half the level that would be emittedunder current policies. Even under the 450Scenario, coal fired power generation willincrease over the next 20 years.
1 0 F e n n e r p l c

F e n n e r p l c 1 1
Fluctuations in foreign currencyDue to the global nature of the Group,Fenner derives a large proportion of itsrevenues from overseas and hence has anexposure to foreign currency fluctuations.Whilst the Group seeks to reduce this riskthrough formal contracts and borrowings,adverse movements in foreign currencies,particularly the US dollar relative to sterling,could lead to material adverse movementsin reported earnings.
CompetitionProducts are available which competedirectly or indirectly with the Group’sproducts. New technology, changingcommercial circumstances and new entrantsto the markets in which the Group operatesmay adversely affect the Group’s business.One source of competition comes from thelow cost economies but whilst these cancompete on price, they cannot alwayscompete on quality or service. Aggressive orpredatory pricing from competitors couldlead to a reduction in margin or volume.
Dependence on key personnelThe future success of Fenner is dependenton the continued services of key personnel.Although the Group has succession plansand seeks to develop and promote fromwithin, the loss of the services of theexecutive officers of the Group and otherkey employees could have a materialadverse affect on the business.
Fluctuations of revenues, expenses andoperating resultsFenner’s revenues, expenses and operatingresults could vary from period to period as aresult of a variety of factors, some of whichare outside Fenner’s control. These factors,which are actively monitored andconsidered in all relevant managementdecisions, include general economicconditions, adverse movements in interestrates, conditions specific to the energymarkets, seasonal trends in revenues,capital expenditure, other costs and theintroduction of new products by Fenner or itscompetitors.
In response to a changing competitiveenvironment, Fenner may elect from time totime to make certain pricing, service ormarketing decisions or acquisitions thatcould have a material adverse effect on theGroup’s revenues, results of operations andfinancial condition.
Employee benefit schemesThe Group has a number of employeebenefit schemes, including defined benefitpension schemes and US healthcareprogrammes. These schemes expose theGroup to changes in interest rates, otherinvestment returns and inflation as well asthe effects of the longevity of schememembers. Developments in medical scienceand changes in healthcare managementcan significantly increase the cost ofmaintaining benefits in the future.Appropriate financial and legal advice istaken on the rules and funding of all suchschemes. Changes in regulatory oversighthave resulted in increased costs andmanagement time without any real benefitsfor our employees.
FORWARD-LOOKING STATEMENTSCertain statements contained in thisdocument, including those under thecaptions “Summary and Outlook” and“Principal Risks and Uncertainties”,constitute forward-looking statements. Suchforward-looking statements involve risks,uncertainties and other factors which maycause the actual results, performance orachievements of Fenner, or industry results,to be materially different from any futureresults, performance or achievementsexpressed or implied by such statements.Such risks, uncertainties and other factorsinclude, among others: growth in the energymarkets, general economic conditions andthe business environment.
Mark Abrahams
Chief Executive Officer

B u s i n e s s R e v i e wG r o u p F i n a n c e D i r e c t o r ’ s R e v i e w
ACCOUNTING POLICIESThe Group financial statements have beenprepared in accordance with the accountingpolicies described in note 1 to the Groupfinancial statements, in accordance withIFRS as adopted by the European Union.
The Company financial statements havebeen prepared in accordance with theaccounting policies described in note 1 tothe Company financial statements, inaccordance with UK GAAP.
REVENUE AND OPERATING PROFITGroup revenue increased by 14% to£499.4m (2008 £437.8m). Of this increase,£46.6m was generated from the full yeareffect of prior year acquisitions and disposalsand current year acquisitions. The effect offavourable exchange rate movementsamounted to £73.8m, the largest componentrelating to the weakening of sterling againstthe US dollar.
In the CB Division, revenue increased to£361.8m (2008 £292.2m). Mining marketsremained strong and our service networkwas significantly enhanced throughacquisition activity in North America.
In the AEP Division, revenue decreased to£137.6m (2008 £145.6m) due to its greaterexposure to industrial segments and theimpact upon them from the global economicdownturn.
Underlying operating profit reduced to£41.3m (2008 £49.3m). The net effect ofacquisition and disposal activity contributed£5.0m and the favourable translation effectof exchange rate movements was £8.5m.Divisional profits contributed were £30.8m(2008 £29.1m) from the CB Division and£15.8m (2008 £26.1m) from the AEPDivision.
Exceptional items incurred amounted to£17.4m (2008 £3.4m), the largest componentrelating to global restructuring activitiesassociated with the economic downturn. Seenote 6 to the Group financial statements forfurther details of exceptional items.
Amortisation of intangible assets acquiredincreased to £6.8m (2008 £2.1m) due to thefull year effect of acquisitions in the prior yearand acquisitions completed during the year.
Group operating profit reduced to £17.1m(2008 £43.8m).
INTERESTNet interest payable was £10.2m (2008£7.2m). The increase in the net chargereflected the growth in net debt as a resultof the planned acquisitions and capitalexpenditure. The weakening of sterlingduring the year increased the cost on thetranslation of foreign currency denominatedinterest, albeit mitigated by reductions inshort-term interest rates.
In addition, notional interest on theunwinding of discount on provisionsincreased to £1.3m (2008 £0.3m) due to theincrease in contingent deferredconsideration on acquisitions.
TAXATIONThe underlying tax rate was 28% (200830%). The reduction in the rate reflected agreater proportion of profits generatedoutside the USA where tax rates aregenerally lower and tax assets, includinglosses, and tax holidays have been utilised.
The headline rate of tax of 18% (2008 29%)principally reflected the higher rate of taxrelief in the USA for exceptional itemsincurred in that territory.
EARNINGS PER SHARE AND DIVIDENDSUnderlying earnings per share was 12.8p(2008 17.7p) and basic earnings per sharewas 2.6p (2008 15.5p).
The interim dividend of 2.2p per share (20082.2p) was paid on 7 September 2009. TheBoard is recommending a final dividend of4.4p per share (2008 4.4p) to make a totaldividend for the year of 6.6p per share(2008 6.6p).
ACQUISITIONS AND DISPOSALSThe Group completed two acquisitionsduring the year and one after the year end.One non-core product line was divestedduring the year.
In October 2008, the assets and liabilities ofthe Conveyor Services Corporation group ofcompanies, including LoadOut Services,were acquired. The consideration paidduring the year amounted to £30.1m,including acquisition costs, and outstandingcontingent and deferred considerationpayable is estimated at £17.3m.
Also in October 2008, the entire sharecapital of Solid Systems Engineering, LLCwas acquired for £5.4m plus deferredconsideration estimated at £1.3m.
1 2 F e n n e r p l c

F e n n e r p l c 1 3
As required under IFRS, a review of the fairvalue of assets and liabilities wasundertaken at the dates of acquisition. Thisresulted in a provisional fair value of netassets acquired of £42.8m. This amountcomprises the valuation of separatelyidentifiable intangible assets of £31.0m,which include trade names and customerrelationships that will be amortised over theireconomic lives, and other net assetsacquired of £11.8m. Goodwill of £9.1m hasbeen recorded which comprises £11.4m foracquisitions in the year less £2.3m from there-assessment of contingent deferredconsideration on prior year acquisitions.
Further acquisition disclosures are given innote 33 to the Group financial statements.
In March 2009, a non-core product line inAEP which generated small revenue streamswas disposed of for an initial considerationof £0.1m with deferred amounts of £0.4m.
In September 2009, after the year end,certain business assets and liabilities of BeltService Srl were acquired for an initialconsideration of £0.2m with deferredamounts of £0.5m. The business, located inItaly, further strengthens our conveyorbelting service network in Europe.
CASH FLOW, NET DEBT AND FINANCINGNet cash from operating activities increasedto £36.4m (2008 £28.2m), benefiting fromstringent working capital controls throughthe economic downturn. The reduction inworking capital levels generated cash of£16.5m (2008 cash outflow of £8.2m).
Capital expenditure reduced to £34.3m(2008 £63.7m). The major spend during theyear related to the strategic investment in anew steel cord facility in Western Australia.This compares to a depreciation charge of£15.0m (2008 £10.1m). After disposing ofplant and equipment of £0.1m (2008 £0.5m),the free cash inflow was £2.2m (2008outflow of £35.0m).
The net outflow on acquisition and disposalactivity was £37.2m (2008 £41.0m). Dividendspaid of £11.5m (2008 £9.9m) and an outflowfrom other financing activities of £0.1m(2008 inflow of £35.5m, principally relating toa share placing) gave an increase in netdebt before the effects of exchange ratemovements of £46.6m (2008 £50.4m). Thetranslation effect of a weakening of sterlingincreased this amount by £21.2m (2008£10.9m) which resulted in an increase in netdebt of £67.8m to £165.4m (2008 £97.6m).
Gross debt at the year end amounted to£200.4m (2008 £141.2m). Cash andshort-term deposits at the year end were£35.0m (2008 £43.6m).
The Group is financed principally by a mixof equity, retained earnings, US dollarprivate placement loan notes and committedbank facilities. The principal loan facilitiesare raised centrally whilst operatingcompanies supplement this funding withlocal overdraft and working capital facilities.
At the year end, the Group's committedbank facilities primarily consisted of a£100m revolving credit facility with three UKbanks which expires in June 2012. Inaddition, the Group's Australian operationshad committed bank borrowings ofAustralian $35m (£18.1m) which expire inMay 2013.
The Group's other principal source ofcommitted debt financing remain two USdollar private placements. $90.0m (£55.2m)of Senior Notes repayable in June 2017carry a fixed interest coupon of 5.78% and$20.4m (£12.5m) of Senior Notes repayablebetween 2010 and 2012 carry a fixedinterest coupon of 7.29%.
In addition to its undrawn committedfacilities at the year end of £12.4m (2008£51.3m), the Group has access toapproximately £50m of uncommittedworking capital facilities.
The financial covenants relating to thecommitted bank facilities and the 2017private placement are aligned. The principalcovenants are interest cover - underlyingoperating profit being at least 2 times thenet interest charge, and the net debt toEBITDA ratio - net debt being less than 3.5times adjusted EBITDA.
At 31 August 2009, the Group comfortablycomplied with its loan covenants. Interestcover was 4.0 times (2008 6.8 times) whilstnet debt to reported EBITDA was 2.9 times(2008 1.7 times). In addition, for compliancewith loan covenants, reported EBITDA isadjusted for, inter alia, acquisitions andnon-cash items, thus the net debt toadjusted EBITDA ratio is significantly lowerwhen adjusted for these items.
The Group remains well placed to fund andsupport its operations, with continuingaccess to medium and long term debtfinance, cash resources and, wherenecessary, shorter term facilities.

B u s i n e s s R e v i e wG r o u p F i n a n c e D i r e c t o r ’ s R e v i e w c o n t i n u e d
1 4 F e n n e r p l c
FINANCIAL RISK MANAGEMENTIn the normal course of business, the Groupis exposed to certain financial risks,principally foreign exchange risk, interestrate risk, liquidity risk and credit risk. Theserisks are managed by the central treasuryfunction in conjunction with the operatingunits, in accordance with risk managementpolicies that are designed to minimise thepotential adverse effects of these risks onfinancial performance. The policies arereviewed and approved by the Board.
The exposures are managed through theuse of foreign currency and sterlingborrowings, derivatives and creditmanagement procedures. The use ofderivatives is undertaken only where theunderlying interest or currency risk arisesfrom the Group’s operations or sources offinance. No speculative trading inderivatives is permitted.
In the normal course of business, derivativeshave been used to hedge future non-functionalcurrency cash flows arising from tradingtransactions relating to the sale and purchaseof goods and services. The Group haschosen not to hedge account for suchtransactions under the requirements of IAS39 ‘Financial Instruments: Recognition andMeasurement’, recognising that cash flowsthrough to the maturity of the derivative areunaffected. In compliance with IAS 39, allfinancial instruments have been measuredat their fair value as at the balance sheetdate. A charge or credit to the incomestatement has been recognised for the lossor gain on these instruments. In addition, inaccordance with IAS 21 ‘The Effects ofChanges in Foreign Exchange Rates’, allforeign currency monetary items have beenre-translated at the closing rate, withchanges in value charged or credited to theincome statement.
The interest rate swap to hedge interest ratecash flows, entered into in 2006, continuedduring the year. This instrument fixes theinterest rate on $40m of floating rate bankborrowings until 2011. At 31 August 2009,the fair value of this instrument was a liabilityof £2.5m (2008 £1.5m). In 2007, the Groupalso swapped $27.2m of the 2017 privateplacement into €20.0m, with cash flowsmirroring the private placement at a fixedrate of 5.05%. This swap matures in June2017 when the private placement isrepayable. At 31 August 2009, the fair valueof this instrument was a liability of £0.9m
(2008 £0.3m). These swaps have beenaccounted for as hedges in accordance withIAS 39, with the charge or credit recogniseddirectly in equity.
RETURN ON GROSS CAPITAL EMPLOYEDThe average gross capital employedincreased due to the effect of the Group’sstrategic expansion plans to £379.2m (2008£266.9m) and underlying operating profitamounted to £41.3m (2008 £49.3m),adversely affected by the economicdownturn. As a consequence, the return ongross capital employed reduced to 11%(2008 18%).
POST-RETIREMENT BENEFITSThe Group operates a number of definedbenefit post-retirement schemes for qualifyingemployees in operations around the world.
The principal scheme is the Fenner PensionScheme which is based in the UK. The mostrecent triennial valuation of the FennerPension Scheme was carried out as at 31March 2008. The total defined benefitpost-retirement liability, as calculated by theschemes' actuaries in accordance with IAS19 'Employee Benefits' and recorded on thebalance sheet at 31 August 2009, increasedto £42.1m (2008 £19.1m). Of this amount, theFenner Pension Scheme represents £37.6m(2008 £15.5m) and the overseas schemestotalled £4.5m (2008 £3.6m). During the year,the fair value of assets of the schemesreduced by £5.8m and the present value ofrecognised obligations increased by £17.2m,principally as a result of a reduction incorporate bond yields used to discountobligations. Further details of post-retirementbenefits are disclosed in note 25 to the Groupfinancial statements.
KEY FINANCIAL PERFORMANCEINDICATORS
Richard perry
Group Finance Director
2009 2008
Adjusted earnings per share 12.8p 17.7p
Interest cover (times) 4.0 6.8
Net debt to EBITDA (ratio) 2.9 1.7
Return on gross capital employed 11% 18%
Financial performance measures described as “underlying” within this statement are before amortisation ofintangible assets acquired and exceptional items and, where applicable, notional interest.

. F e n n e r p l c 1 5
B u s i n e s s R e v i e wD e f i n i t i o n o f K e y P e r f o r m a n c e I n d i c a t o r s U s e d
INTERNATIONALLY TRADED COAL PRICESAs published by, and used with thepermission of, the McCloskey GroupLimited, the coal industry recognised marketanalysis and trade reporting company.These bi-weekly prices reflect the deliveredto port price of coal for the two major coalimporting markets.
SALES PER EMPLOYEETotal annual third party revenue at constantexchange rates divided by the averagenumber of employees derived from a simpletotal head count with no distinction betweenfull time, part time, temporary or casualemployees. Where employees are employedfor part of a year, the average number iscalculated on a pro-rata basis.
LOST TIME INCIDENTSThe number of incidents connected withwork which results in an injured personbeing away from work or unable to do thefull range of their normal duties, notincluding the day of the incident.
LOST TIME INCIDENT FREQUENCYThe Lost Time Incident Frequency Rate(“LTIFR”) is the number of Lost TimeIncidents per 200,000 hours worked.
UNDERLYING EARNINGS PER SHAREThis is a measure of performance andgrowth. It is calculated by dividing theunderlying profit for the year by theweighted average number of shares in issueand ranking for dividend.
INTEREST COVERThis measure provides an indication ofwhether the Group’s profit is sufficient tocover its interest obligations. It is calculatedby dividing the underlying operating profitby net interest payable on bank overdraftsand loans, other loans and bank interestreceivable.
NET DEBT TO EBITDAThis is a measure of the Group’s ability toservice its debt obligations. It is calculatedby dividing net debt, defined as short andlong term borrowings less cash andshort-term deposits, by the profit for the yearafter adding back net finance costs,taxation, depreciation, amortisation andexceptional items.
RETURN ON GROSS CAPITAL EMPLOYEDThis is a measure of performance relative toamounts invested. It is calculated bydividing underlying operating profit by grosscapital employed. Gross capital employed isdefined as the average of the opening andclosing non-current assets (excludingdeferred tax), inventories, trade and otherreceivables and trade and other payables.

T h e B o a r d
Appointed in May 1993 as executive Chairmanand became non-executive Chairman in May1994. He is also non-executive Chairman ofAltitude Group plc and non-executiveChairman of Energybuild Group Plc.
Appointed to the Board as Group FinanceDirector in 1990 and became Chief ExecutiveOfficer in May 1994. He is also non-executiveChairman of Inditherm plc and non-executivedirector of The Leeds Teaching HospitalsNHS Trust.
Appointed to the Board in September 1994.He is also a non-executive director of ScapaGroup plc.
Appointed to the Board in January 2003, hewas formerly an executive director ofD S Smith Plc.
Appointed to the Board in November 2005,he was formerly Chief Executive of BritishVita plc and is a non-executive director ofZotefoams Plc.
Joined the Company in 2001 and wasappointed Company Secretary in July 2002.
COLIN COOKE (69)* r n
Chairman
MarK abrahaMs (54) n
Chief Executive Officer
rIChard PErry (59)
Group Finance Director
daVId bUTTFIELd (63)* a r n
Senior Independent Director
daVId CaMPbELL (59)* a r n
dEbra bradbUry (44)
Company Secretary
* Non-executive a Audit Committeer Remuneration Committeen Nomination Committee
1 6 F e n n e r p l c

F e n n e r p l c 1 7
The Group remains committed to maintaining high standards of corporate governance as set out in the Combined Code onCorporate Governance (“Combined Code”), revised in June 2008. A copy of the Combined Code is available from the FinancialReporting Council or online at www.frc.org.uk.
Compliance with the Combined CodeThe Group has complied with the provisions of the Combined Code during the year ended 31 August 2009 and this statementexplains how the Principles of Corporate Governance are applied within the Group. It should be read in conjunction with theBusiness Review and the Board Remuneration Report on pages 4 to 15 and pages 27 to 33 respectively.
The BoardAs at 31 August 2009, the Board comprised a non-executive Chairman, two executive directors and two non-executive directorsand is collectively responsible to shareholders for the proper management of the Group. Biographical details of the directors areset out on page 16.
The roles of the Chairman and Chief Executive Officer are separate and distinct from one another in accordance with best practice.
The Board is satisfied that it has met the Combined Code’s requirements for its effective operation. Specific matters are reserved forthe Board’s consideration under a formal schedule. These include developing Group strategy, reviewing trading performance,considering senior management appointments, formulating policy on key issues (including the approval of significant capitalexpenditure, acquisitions and disposals) and reporting to shareholders. The schedule is reviewed at least annually. Various othermatters are delegated to duly authorised sub-committees of the Board consisting of directors and senior executives. Details of theircomposition and purpose are outlined below. In addition, the Chairman and non-executive directors meet several times a yearwithout the executive directors being present.
All directors are subject to election by shareholders at the first Annual General Meeting ("AGM") following their appointment and tore-election thereafter at intervals of no more than three years. Due to his length of tenure, the Chairman seeks annual re-election inaccordance with best practice.
The Group holds appropriate Director’s and Officer’s liability insurance.
Board balance and independenceThe Board is satisfied that the current balance of skills and experience continues to be appropriate for the requirements of thebusiness. Over half of the Board comprises non-executive directors, inclusive of the Chairman, and they are deemed by the Board tobe independent of management and do not have any business relationships which could interfere with the exercise of their judgement.
The Senior Independent Director is David Buttfield.
Information and professional developmentPrior to each Board, Committee or General Meeting, the Board is provided with timely, appropriate and sufficient information toenable it to discharge its duties proficiently. The Board also receives appropriate documentation, financial information, regulatoryupdates and briefing notes on a regular basis to ensure it is kept fully informed and up to date.
Non-executive directors receive an induction to the Group and its operations when they are appointed to the Board. They are alsoencouraged to visit the Group’s offices and factories whenever the opportunity presents itself, where they meet management andare briefed on local business operations. At least one Board meeting during the year is held at an operational site outside of theUK, although this was deemed inappropriate in the year under review whilst the operations were rationalising costs in response tothe global economic downturn.
All directors have access to the Company Secretary, who is responsible for ensuring that Board procedures are followed and thatthe Group complies with all applicable rules, regulations and obligations governing its operations. A procedure exists for directorsto take independent professional advice, if necessary, at the Group’s expense, in the furtherance of their duties.
Performance evaluationA Board performance evaluation was carried out in the year which comprised of a questionnaire. The review looked at Boardresponsibilities, duties, strategy, information flows, monitoring, Board structure including sucession planning and the effectivenessof the whole Board and its committees. The performance of the Chairman was also evaluated by the Senior Independent Directorafter a review with the other members of the Board. The Chairman evaluated the performance of the individual directors as part ofthe review. It was concluded that the composition, experience and effectiveness of the Board was appropriate and robust and nosignificant issues were raised during the evaluation.
Corporate Governance

ConflictsThe Company amended its Articles in January 2009 to deal with, amongst other things, the provisions on conflicts of interest in theCompanies Act 2006 which came into force in October 2008. No conflicts arose during the year and the Board continues to monitorevents with a view to ensuring any conflicts are handled appropriately.
Audit CommitteeThe Audit Committee comprises the two non-executive directors and is chaired by David Buttfield, who has recent and relevantfinancial experience. The Company Secretary acts as a secretary to the Committee. In undertaking its duties, the Committee hasaccess to the services of the Group Finance Director and the Company Secretary as well as access to external professional advice.The Committee has the power to request the attendance at meetings of any director, external auditor, internal auditor or Groupemployee as considered appropriate. The Committee also meets external auditors without the executive directors being present.
The principal duties of the Committee are to monitor the integrity of the financial statements, to review the internal controls and riskmanagement systems, to review the work of internal audit and to consider all aspects of the relationship with the external auditors.The Committee has the authority to obtain external legal or other professional advice on any matter within its terms of reference.
The work of the Audit CommitteeDuring the year, the Committee carried out the following work:
- review, prior to Board approval, of the Preliminary and Half Year Results, the Annual Report and the Half Yearly FinancialReport;
- consideration of the Group’s key business risks, including the arrangements for the identification and management of risk;- overseeing the implementation of a Group-wide risk management system;- receive the reports on internal control and review the effectiveness of the internal control function and arrangements, monitor
progress and evaluate the internal control reports at least twice a year, including a meeting with the Head of Internal Control;- meet with the external auditors, both with and without the executive management being present, to discuss audit issues;- approve the external auditors' terms of engagement and associated fees;- monitor the level of non-audit work of the external auditors;- review the terms of reference of the Audit Committee and the Whistleblowing Policy; and- review the financial statements of the UK Fenner Pension Scheme.
No non-routine matters of concern were drawn to the Committee’s attention by either the external or internal auditors during theyear. Matters of material concern are immediately drawn to the Committee’s attention if and when they arise.
There is a policy on the provision of non-audit services by the external auditors. Certain services such as due diligence in relationto acquisitions and disposals, taxation services and actuarial advice are permitted but others, for example, internal audit,information technology and HR consultancy are generally considered inappropriate. Non-audit fees are reported to the Committee.
The Committee has received and reviewed written confirmation from the external auditors on all relationships that, in theirjudgement, may bear on their independence. The external auditors have also confirmed that they consider themselves independentwithin the meaning of UK regulatory and professional requirements.
Audit Committee and internal controlThe Audit Committee reviews the effectiveness of the Group’s system of internal control and receives a report on internal control atleast twice a year. This review covers all controls, including operational, financial, compliance and risk management.
In accordance with the requirements of the Combined Code and the recommendations of the Turnbull Guidance on internal control,the directors have reviewed the effectiveness of the internal control system and arrangements. During the period under review, nosignificant changes to the material risks were identified and no control failings or weaknesses were identified that resulted inunforeseen material losses.
The directors are responsible for the Group’s system of internal control which, like any system of internal control, can only providereasonable and not absolute assurance against material misstatement or loss.
The key procedures within the control structure are: - the identification of major business and insurance risks faced by the Group’s operations, by both the Board and senior
management, and the determination of the most appropriate course of action to deal with these risks; - central review and approval procedures in respect of major areas of risk such as acquisitions and disposals, litigation,
treasury management, taxation and environmental issues; - a clear management structure with well defined lines of responsibility and the appropriate levels of delegation; - regular review of the Group’s business units by operational and executive management and monthly reports from the
Divisional Directors;
1 8 F e n n e r p l c
Corporate Governance continued

F e n n e r p l c 1 9
- a structured process for appraising and authorising capital projects, which includes clearly defined authorisation levels.Projects are subject to post-investment appraisals;
- well established consolidation and reporting systems for both the statutory and monthly management accounts, with allBoard members receiving a monthly statement of the financial results;
- comprehensive budgeting systems with an annual budget approved by the Board. Monthly results are reported againstbudget and revised forecasts for the year are prepared regularly;
- an internal programme of monitoring visits by the internal audit team, as agreed with the Audit Committee, reviews thecompliance of each business unit with the Group's standard internal financial control procedures;
- competition compliance programmes are in place in several jurisdictions and the Group-wide Whistleblowing Policycontinues to be applied; and
- a programme of business risk reviews with operational management focusing on non-financial controls and riskmanagement.
Remuneration CommitteeThe Remuneration Committee comprises the Chairman and the non-executive directors and is chaired by David Campbell. TheChief Executive Officer also attends the meetings by invitation but does not participate in any decision in relation to his ownremuneration. The Committee has the power to request the attendance at meetings of any director or Group employee asconsidered appropriate.
The Committee is responsible to the Board for determining the remuneration packages of the executive directors and other seniorexecutives and advises on executive remuneration policy issues. The Committee administers the long term Performance Share Plan(“PSP”) and the expired Long Term Share Incentive Plan (“LTIP”). It also approves the granting to certain employees of a long termShadow Performance Share Plan which is a cash incentive scheme with performance aligned to the PSP.
The Remuneration Committee received advice during the year from Hewitt New Bridge Street Consultants LLP (“HNBSC”), whoadvised the Committee in relation to director and senior executive remuneration and the PSP. MM&K Ltd assisted the Committee inconsideration of matters in relation to the expired LTIP which ended in November 2008.
Nomination CommitteeThe Nomination Committee comprises the Chairman, the non-executive directors and the Chief Executive Officer. The Committee ischaired by the Chairman and generally meets at least annually and/or as required. The Committee has the power to request theattendance at meetings of any director or Group employee as considered appropriate.
Terms of reference set out the Committee’s role and duties which include reviewing the composition of the Board, havingresponsibility for the identification and nomination of candidates to fill Board vacancies and considering succession planning for allBoard positions and senior executives.
Candidates for appointment to the Board are considered by the Committee, taking advice from external consultants whereappropriate.
Meetings of the BoardThe attendance of each director at Board, Audit Committee, Remuneration Committee and Nomination Committee meetings is setout below.
Number of meetings during the year
Chairman C I Cooke
Executive directorsM S Abrahams
R J Perry
Non-executive directorsD F Buttfield
D A Campbell
* By invitation
6
6
6
6
6
6
Board
3
3*
3*
3*
3
3
Audit Committee
RemunerationCommittee
2
2
2*
0
2
2
1
1
1
1*
1
1
NominationCommittee

Terms of referenceThe terms of reference of the Audit, Remuneration and Nomination Committees are reviewed at least annually and are available toview on the Group’s website at www.fenner.com or upon request to the Company Secretary.
Executive CommitteeThe Executive Committee is chaired by the Chief Executive Officer and consists of the two executive directors, the CompanySecretary and five members of the Group’s senior management including senior executives from the operations. The ExecutiveCommittee meets at least six times a year and deals with the daily management of the Group through powers delegated to it by theBoard. Two strategic planning days were held in the year in addition to the routine Executive Committee meetings.
Directors' remunerationPolicy and procedure are set out in the Board Remuneration Report on pages 27 to 33.
Relations with shareholdersThe Company encourages regular dialogue with its institutional shareholders inclusive of client brokers and also with privateinvestors at the AGM. The Chief Executive Officer and Group Finance Director hold update meetings with institutional shareholdersand private client brokers following the announcement of Preliminary and Half Yearly Results and as requested throughout the year.The Chairman and non-executive directors are offered the opportunity to attend meetings with major shareholders and attend ifrequested. There were no requests received from shareholders for meetings with the Chairman or non-executive directors in theyear.
The Board is provided with broker reports and feedback from shareholder meetings on a regular basis.
The Group’s website provides comprehensive investor relations information for shareholders to view. The website includes analystpresentations, the current share price, regulatory announcements, financial performance information, shareholder information andan investor relations contact address.
Annual General MeetingIn relation to the Company’s AGM:
- proxy forms allow for voting either for a resolution, against a resolution or for a vote to be withheld;- a separate resolution is proposed for each substantially separate issue, including the receipt of the Annual Report;- the proxy count in respect of each resolution is announced after it has been dealt with on a show of hands;- all executive and non-executive Board members normally attend the meeting;- the Notice of Meeting, the Annual Report and any other related papers are normally sent to shareholders more than one
month before the meeting; and- shareholders are invited to ask questions during the AGM and have an opportunity to meet the Board directors before and
after the formal meeting.
Statement of directors’ responsibilitiesThe directors are responsible for preparing the Annual Report, the Board Remuneration Report and the financial statements inaccordance with applicable law and regulations.
Company law requires the directors to prepare financial statements for each financial year. Under that law the directors haveelected to prepare the Group financial statements in accordance with International Financial Reporting Standards (“IFRS”) asadopted by the European Union and the parent company financial statements in accordance with United Kingdom GenerallyAccepted Accounting Practice (United Kingdom Accounting Standards and applicable law). Under company law the directors mustnot approve the financial statements unless they are satisfied that they give a true and fair view of the state of affairs of the Groupand the Company and of the profit or loss of the Group for that period. In preparing these financial statements, the directors arerequired to:
- select suitable accounting policies and then apply them consistently;- make judgements and accounting estimates that are reasonable and prudent;- state whether IFRS as adopted by the European Union and applicable United Kingdom Accounting Standards have been
followed, subject to any material departures disclosed and explained in the Group and parent company financial statementsrespectively; and
- prepare the financial statements on the going concern basis unless it is inappropriate to presume that the Company willcontinue in business.
The directors are responsible for keeping adequate accounting records that are sufficient to show and explain the Company’stransactions and disclose with reasonable accuracy at any time the financial position of the Company and the Group and enablethem to ensure that the financial statements and the Board Remuneration Report comply with the Companies Act 2006 and, as
Corporate Governance continued
2 0 F e n n e r p l c

F e n n e r p l c 2 1
regards the Group financial statements, Article 4 of the IAS Regulation. They are also responsible for safeguarding the assets of theCompany and the Group and hence for taking reasonable steps for the prevention and detection of fraud and other irregularities.
The directors are responsible for the maintenance and integrity of the Company’s website. Legislation in the United Kingdomgoverning the preparation and dissemination of financial statements may differ from legislation in other jurisdictions.
Each of the directors, whose names and functions are listed in The Board on page 16 confirm that, to the best of their knowledge:
- the Group financial statements, which have been prepared in accordance with IFRS as adopted by the European Union give a true and fair view of the assets, liabilities, financial position and profit of the Group; and
- the Business Review contained on pages 4 to 15 includes a fair review of the development and performance of the businessand the position of the Group, together with a description of the principal risks and uncertainties that it faces.
Going concernAfter making enquiries, the directors have formed a judgment at the time of approving the financial statements that there is areasonable expectation that the Company and Group have adequate resources to continue in operational existence for theforeseeable future. For this reason, the directors continue to adopt the going concern basis in preparing the financial statements.
C I Cooke Chairman11 November 2009

2 2 F e n n e r p l c
The Fenner Group is a leader in reinforced polymer technology across the globe. It designs, manufactures and distributessophisticated reinforced plastic polymer products such as conveyor belts, seals, medical textiles, industrial textiles, hoses andbespoke critical polymer components for a broad base of international customers including high technology industries and miningcompanies. Its markets include industrial automation, office equipment, oil and gas, aerospace and bulk material handling.
The Group acknowledges that its market leading position means it has social and environmental responsibilities that must beembedded within the business decision making process. This Report describes the actions taken in the five key areas of Healthand Safety, Valuing our People, Business Behaviours, Environmental Impact and Community Involvement that have been taken overthe past year to ensure that the Group’s commitment and approach to these responsibilities continues to contribute to its overallbusiness success; bringing with it an enhancement to reputation, profitability and shareholder return.
The risks associated with each area are managed within the Group’s risk management framework and are continuously monitoredand assessed, with necessary controls put in place in order to reduce the potential impact.
The Chief Executive Officer has overall responsibility for the development and monitoring of the Group’s policies related toCorporate Responsibility. The task of ensuring these policies are communicated and applied at a Divisional and Business Unit levelis delegated through the Divisional Managing Directors to each Business Unit’s senior management. The policies and associatedmanagement systems are reviewed at least annually and at any time when significant changes in the business, legislation orindustry standard demand. Each Division is also responsible for ensuring that, as a minimum, it meets local statutory requirementsand is encouraged to reflect identified best practice within the Group.
All employees are expected to take personal responsibility for their conduct and Fenner recognises the need to create a cultureand behavioural environment within the Group to facilitate the successful implementation of the Group’s policies.
The Group’s Health & Safety Policy and Environmental Policy are available to view on the Company’s website www.fenner.comor by contacting the Company Secretary.
The Company is proud to continue to be a member of the FTSE4Good UK Index which measures the performance of companiesthat meet globally recognised Corporate Responsibility standards and facilitates investment into those companies.
Health and SafetyFenner promotes a strong health and safety (“H&S”) culture where it is expected that everyone who works for Fenner, wherever theyare, is responsible for the safety of themselves and their colleagues. This individual and collective responsibility helps ensure theenvironment they work in is safe for themselves, colleagues, customers and all those with whom we work.
The Group endeavours to set the highest practical H&S standards; as a minimum each Business Unit will always comply fully withits local statutory obligations and all employees are trained to recognise that the health and safety of themselves and others is theirfirst priority.
All Business Units have a H&S committee which meet regularly to discuss H&S topics and concerns, make recommendations andimplement and monitor any improvements or initiatives. H&S issues and key measurements are also routinely reviewed anddiscussed at management meetings, with accidents, serious incidents and near misses reported and escalated to the ExecutiveCommittee and Board where appropriate.
The dissemination of information on a Group-wide basis is also important to ensure continual improvement in all H&S matters.The findings of H&S investigations relevant to the wider organisation are communicated across locations and a general exchangeof information and resources between operations is actively encouraged.
From March 2009, in line with published advice from the World Health Organisation, a number of Group-wide health alerts wereissued in response to the heightened risk levels resulting from Influenza A(H1N1) (swine flu). The health alerts informed ouremployees as to the risks associated with infection; recommended preventative practices; the need to undertake travel riskassessments; and a requirement for each location to review its business continuity plans with respect to a pandemic outbreak.
Group Health and Safety Management System FrameworkThe Group Health and Safety Management System Framework, now known as “The Framework”, was launched in January 2009.To reinforce the concept of embedding The Framework in each Business Unit, the roll out was led by management in each Divisionwith help and coordination from Group to ensure a consistent message was communicated.
Corporate Responsibility Report

F e n n e r p l c 2 3
As part of this programme a multilingual DVD has been developed with the Chief Executive Officer’s unambiguous messageregarding the commitment to The Framework and continuous improvement in H&S performance. This message is supported by fourcase studies from the Group, highlighting systems which are considered to be world-class in our operations:
- Incident investigationFenner Drives in Manheim, USA has used a Safety Investigation Database for a number of years to capture data about injuriesand illness that have occurred within their facility. The inclusion of Near Miss reporting has enhanced the process andencouraged greater employee engagement, which in turn has resulted in improved safety performance.
- Handover of plant and equipmentAt the FAST operations in Hampton, UK, H&S procedures are centrally available on the intranet to provide the greatest possibleaccess for all. The ‘handover of plant and equipment’ procedure ensures that there is direct communication between the WorksEngineer, Health and Safety Department and Production Managers. It also confirms that all work equipment on site complieswith relevant legislation and is risk assessed before being put into operation.
- Health screeningAt the conveyor belting facility in Johannesburg, South Africa healthcare screening is provided for all employees. This work isespecially important in a country like South Africa with over 20 per cent of the young population infected with HIV/AIDS andwhere not everyone has access to adequate primary healthcare. As well as offering screening for common aliments,occupational healthcare is provided for eye tests, hearing tests and lung function.
- Take 5Across Australia, the Apex Fenner Conveyor Services risk assessment procedure ‘Take 5’ has been developed. It is focused onmaking employees stop and think before undertaking a task. The process is focused on five steps: thinking through the task;spotting the hazards; assessing the risk; making changes to control the hazards; and undertaking the task safely.
The Framework covers those areas key to ensuring a robust, all encompassing and continually improving H&S culture within theGroup:
- Accountability and Leadership;- Risk Assessment and Management;- Training and Behaviours;- Operations and Maintenance;- Information and Documentation;- Customers and Products;- Incident Analysis and Prevention;- Monitoring, Assurance and Improvement;- Crisis Management and Business Continuity Planning;- Management of Change;- Working with Third Parties;- Design and Construction of Facilities; and- Community and Stakeholder Awareness.
The response within the Group to the structure and clarity provided by The Framework has been extremely positive. Our BusinessUnits fully embraced the concepts and have completed the required self-assessments, enabling them to develop localimplementation plans tailored to their local environment and culture.
Health and safety awardsA number of the Group’s Business Units have received external recognition and awards during the year for their performance inH&S. These included:
- The conveyor belting operation in India gained the OHSAS 18001 accreditation and become the first Fenner facility toachieve ISO 9001, ISO14001 and OHSAS 18001 accreditations.
- The FAST operations in Hampton, UK secured the prestigious RoSPA Gold Award for the third successive year highlightingthe site’s continued excellence in the management and control of H&S.
In 2008 we launched the Fenner Group Health and Safety Improvement Award with the conveyor belting operations at Drachten,Netherlands being the inaugural winner.
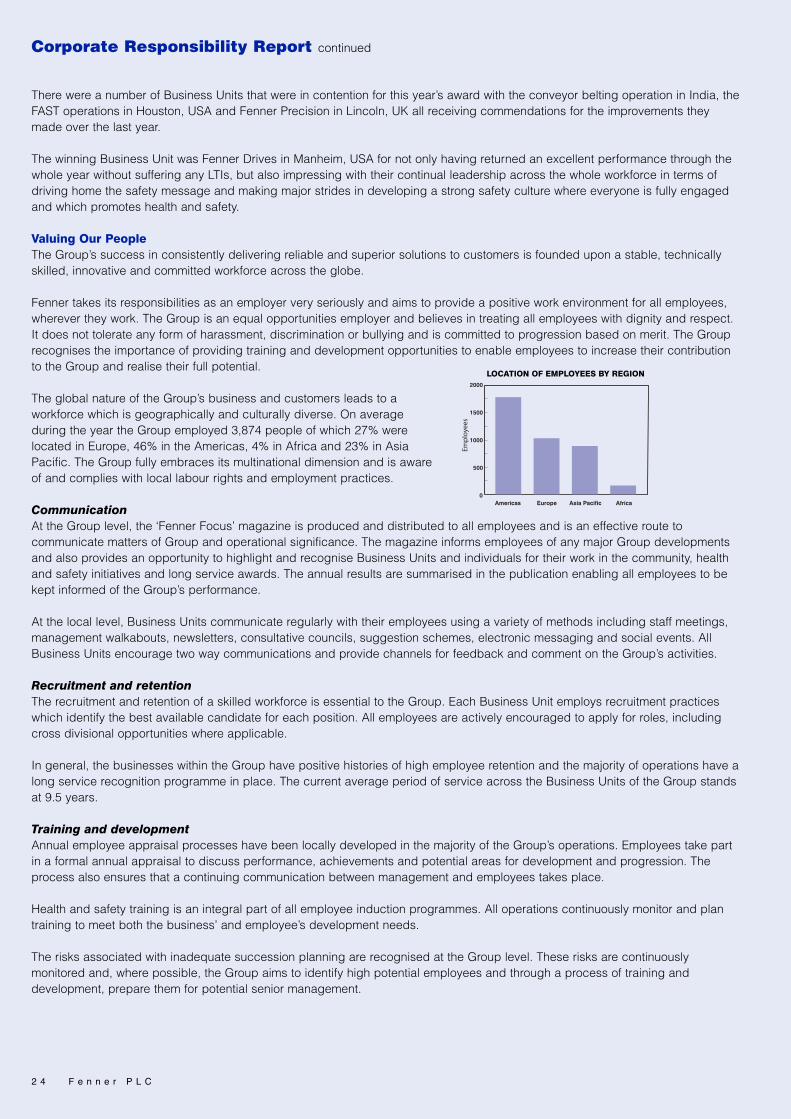
2 4 F e n n e r p l c
There were a number of Business Units that were in contention for this year’s award with the conveyor belting operation in India, theFAST operations in Houston, USA and Fenner Precision in Lincoln, UK all receiving commendations for the improvements theymade over the last year.
The winning Business Unit was Fenner Drives in Manheim, USA for not only having returned an excellent performance through thewhole year without suffering any LTIs, but also impressing with their continual leadership across the whole workforce in terms ofdriving home the safety message and making major strides in developing a strong safety culture where everyone is fully engagedand which promotes health and safety.
Valuing Our People The Group’s success in consistently delivering reliable and superior solutions to customers is founded upon a stable, technicallyskilled, innovative and committed workforce across the globe.
Fenner takes its responsibilities as an employer very seriously and aims to provide a positive work environment for all employees,wherever they work. The Group is an equal opportunities employer and believes in treating all employees with dignity and respect.It does not tolerate any form of harassment, discrimination or bullying and is committed to progression based on merit. The Grouprecognises the importance of providing training and development opportunities to enable employees to increase their contributionto the Group and realise their full potential.
The global nature of the Group’s business and customers leads to aworkforce which is geographically and culturally diverse. On averageduring the year the Group employed 3,874 people of which 27% werelocated in Europe, 46% in the Americas, 4% in Africa and 23% in AsiaPacific. The Group fully embraces its multinational dimension and is awareof and complies with local labour rights and employment practices.
CommunicationAt the Group level, the ‘Fenner Focus’ magazine is produced and distributed to all employees and is an effective route tocommunicate matters of Group and operational significance. The magazine informs employees of any major Group developmentsand also provides an opportunity to highlight and recognise Business Units and individuals for their work in the community, healthand safety initiatives and long service awards. The annual results are summarised in the publication enabling all employees to bekept informed of the Group’s performance.
At the local level, Business Units communicate regularly with their employees using a variety of methods including staff meetings,management walkabouts, newsletters, consultative councils, suggestion schemes, electronic messaging and social events. AllBusiness Units encourage two way communications and provide channels for feedback and comment on the Group’s activities.
Recruitment and retentionThe recruitment and retention of a skilled workforce is essential to the Group. Each Business Unit employs recruitment practiceswhich identify the best available candidate for each position. All employees are actively encouraged to apply for roles, includingcross divisional opportunities where applicable.
In general, the businesses within the Group have positive histories of high employee retention and the majority of operations have along service recognition programme in place. The current average period of service across the Business Units of the Group standsat 9.5 years.
Training and developmentAnnual employee appraisal processes have been locally developed in the majority of the Group’s operations. Employees take partin a formal annual appraisal to discuss performance, achievements and potential areas for development and progression. Theprocess also ensures that a continuing communication between management and employees takes place.
Health and safety training is an integral part of all employee induction programmes. All operations continuously monitor and plantraining to meet both the business’ and employee’s development needs.
The risks associated with inadequate succession planning are recognised at the Group level. These risks are continuouslymonitored and, where possible, the Group aims to identify high potential employees and through a process of training anddevelopment, prepare them for potential senior management.
Corporate Responsibility Report continued
Americas Europe Asia Pacific Africa
2000
1500
1000
500
0
Emp
loye
es
LOCATION OF EMPLOYEES BY REGION

F e n n e r p l c 2 5
Business Behaviours The Group recognises that both its corporate conduct and relationship building are key elements to its business strategysucceeding. By having a high standard of ethical conduct, partnerships can be formed with third parties throughout the Group’ssupply chain which create value on both sides of the relationship.
Business conductThe Group’s culture is one of openness, integrity and accountability. These are enshrined within the Group’s Ethics Policy which isapplied to all business activities and relationships and sets out the behavioural standards expected from all employees – fairness,honesty and integrity.
The Group operates a confidential whistleblowing procedure which enables all employees to raise any concerns they have.
Competition and anti-trust procedures are co-ordinated at the Group level and training is provided for all relevant employees.
Third party partnershipsThe Group recognises that strong relationships with its suppliers and customers are crucial. Having strong supplier relationsensures a reliable, high quality and fairly priced source of goods and services which can then be passed onto customers.
The Group seeks to identify and develop appropriate and long term strategic partnerships with suppliers and customers to createmutual value, access to new markets and to mitigate resource and commercial risks. These strategic partnerships are especiallyrelevant to the number of highly technical niche markets where joint development agreements can expedite research whilstprotecting intellectual property rights.
All Business Units have or are working towards ISO 9001 or equivalent status and each undertakes rigorous customer satisfactionassessments including senior face to face meetings and customer surveys. Performance and the timing and handling of anycomplaints are routinely discussed at management meetings and are used as a key measurement in determining the success ofthe Business Unit.
Environmental Impact Concern for the Group’s impact on the environment is a fundamental part of the Group’s corporate business strategy as itendeavours to contribute towards a sustainable future.
The Group is committed to identifying and assessing the risks of pollution and other forms of environmental impairment arising outof its activities and actively seeks to reduce its impact on the environment to the lowest practical level by ensuring that alloperations and activities of the Group exemplify best contemporary practice in respect of the environment.
Waste minimisationThe minimisation of manufacturing waste and the maximisation of energy efficiency are both recognised as beneficial to the Groupfrom an environmental and commercial viewpoint.
Waste minimisation is driven and managed at the Business Unit level. All major manufacturing operations monitor their wasteemissions and all Business Units comply with local environment legislation. General waste management programmes and initiativesare encouraged and the recycling of materials takes place where practical, either internally or through external programmes withsuppliers or other third parties.
Greenhouse gasesThe Group recognises the increase in public awareness of the climate change debate and the need for companies to understandthe scale of their greenhouse gas emissions. It also recognises that there is no globally accepted methodology for calculatingemissions, with most countries having a portfolio of emission factors for various energy sources based upon either the averagecomposition of primary fuels or averaged emission factors for secondary energy sources such as electricity purchased from anational grid. Whilst these averages are inherently inaccurate they are the generally accepted methodology of estimating the enduser’s greenhouse gas emissions for year on year reporting. To this end the Group has elected to report global figures based uponemission factors published by the UK Government department responsible for climate change issues, DEFRA.

The Group uses a variety of energy sources. The main contributors to greenhouse gas emissions are imported electricity andnatural gas which combined account for over 85% of the Group’s emissions.
If these figures are analysed across the Group, the heavier engineering aspects of the conveyor belt manufacturing and servicingoperations account for nearly 80% of the Group’s greenhouse gas emissions.
Environmental management systemsTaking into account local requirements and needs, Business Units have established a number of different local environmentalmanagement systems. These are in line with the Group Environmental Policy and The Framework which outline a set of GroupEnvironmental Expectations. Currently 25% of the Group is either accredited or working towards accreditation under theinternationally recognised ISO14001 scheme.
Community Involvement The Group recognises that good relations and long term partnerships within the communities in which it works are fundamental toits success. Social and environmental impacts on the community are embedded within the Group’s decision making process. TheGroup’s support for the communities it operates in is driven at a local, rather than corporate level. The approach, adopted acrossthe globe, is to support and enhance employee efforts in their communities through the application of the Group’s resources.
In addition to the time given to community projects and for charitable purposes by the Group’s employees, charitable donationstotalling £61,000 were made across the Group during the year. This included a contribution of over Australian $23,000 being givenin February 2009 to the Bush Fire Appeal in the aftermath of the ‘Black Saturday’ bushfires in Victoria, Australia. Donations werereceived from Group employees based in the UK and USA as well as Australia.
Employees and Business Units give their time and help raise funds for a variety of charities and projects. Examples include:- Fenner Drives Manheim was honoured as ‘Company of the Year’ for Lancaster County, Pennsylvania by Junior Achievement.
Junior Achievement helps young people understand business by bringing volunteers from the business world into theclassroom to help students learn and understand business in their lives and the world around them. As well as helping in theclassroom, Fenner Drives’ employees support through marketing and fundraising events.
- Fenner India employees once again celebrated World Environment Day this year with a mix of activities including the planting ofsaplings around its site. The prime motivation behind the event continues to be to highlight the need to protect the environmentand combat climate change, as well as pave the way for a cleaner and healthier future.
- As part of its 65th anniversary celebrations Prodesco sponsored a local Community Day, with all employees asked to participatein a company-wide volunteer day during normal working hours in order to help their local communities. Prodesco received aletter of commendation signed by the members of the Perkasie Borough Council that included an appreciation of the company’ssupport of the community. The letter concluded "Your spirit of civic mindedness and community cooperation are unparalleled."
Mark AbrahamsChief Executive Officer
2 6 F e n n e r p l c
Electricity57%
Natural Gas30%
Fuel Oil6%
Other7%
Coal2%
LPG2%
Petrol1%
Diesel2%
SOURCES OF GROUP GREENHOUSE GAS EMISSIONS
Corporate Responsibility Report continued

F e n n e r p l c 2 7
Board Remuneration Report
The Board submits its report on directors’ remuneration. A resolution will be put to shareholders at the Company’s AGM inviting themto approve this Report. Details of the Remuneration Committee’s responsibilities are given on page 19.
Members of the Remuneration CommitteeThe members of the Remuneration Committee during the year were David Campbell (Chairman), Colin Cooke and David Buttfield.
During the year, the Remuneration Committee took advice from independent external sources, as noted on page 19.
Remuneration policy
Executive directorsThe Company’s policy on remuneration is to attract, retain and incentivise executives with the experience and skills necessary tooperate and develop the Company’s businesses and promote the long term growth and stability of the Group. It is also designedto align the interests of the executives with those of the shareholders by rewarding them for enhancing shareholder value.
Benefit packages awarded to executives are intended to be competitive and comprise a mix of performance related andnon-performance related remuneration designed to incentivise them, but not to detract from the goals of corporate governance.The Remuneration Committee takes account of pay and conditions elsewhere in the Group when arriving at the remunerationpackage for the executive directors.
It is the Committee’s current intention to continue to reward the executive directors with an annual performance related bonus plan,linked to earnings per share ("EPS") and a PSP, details of which are given on page 29. The PSP has a bespoke peer groupcomprising companies from the FTSE All Share Industrial Engineering Sector and comparative companies from the GeneralIndustrials and Electronic & Electrical Equipment Sectors (“PSP Peer Group”). The Committee considers that Total ShareholderReturn (“TSR”), which comprises of, inter alia, dividend yield and share price movement in comparison with the PSP Peer Group,is the best measure of long term performance as it aligns the interests of executives with shareholders and recognises marketconditions in the Group’s industrial sector. The final plan cycle under the old LTIP, which expired in November 2008, resultedin a nil award.
The targeted composition of each executive director’s remuneration is as follows:
Non-performance related Performance related
Mark Abrahams 60% 40%Richard Perry 60% 40%
Chairman and non-executive directorsThe Chairman and non-executive directors are usually appointed for fixed three year terms, with provision for additional fixed termappointments as deemed appropriate and in the best interests of the Company.
The remuneration of the non-executive directors is determined by the Board as a whole, having regard to the packages awardedby other UK listed companies of similar size and complexity. The fees paid to the Chairman and non-executive directors werebrought into line with the bespoke comparator group with effect from 1 September 2008 following the results of the HNBSC report,which had been commissioned in the prior year as detailed on page 28.
The non-executive directors do not participate in any of the Group’s bonus, share option or incentive schemes, nor do they accrueany pension entitlement.
Directors’ service contractsThe executive directors have rolling 12 month contracts. In addition, the Company has agreed to the payment of a prescribed sumequivalent to 12 months salary and contractual benefits if there is a change of control or termination of their contracts by theCompany other than for cause.
The service contracts do not contain any provision for compensation on early termination other than the notice period and theprovision noted above. The Committee will seek to mitigate the cost to the Company whilst dealing fairly with each individual case.

2 8 F e n n e r p l c
The details of the service contracts in relation to the executive directors and letters of appointment in relation to the Chairman andnon-executive directors who served as directors during the year are as follows:
Unexpired term at Notice31 August 2009 period
Executive directorsMark Abrahams - 1 yearRichard Perry - 1 yearNon-executive directorsColin Cooke* 16 months 1 yearDavid Buttfield** 16 months 1 yearDavid Campbell*** 26 months 1 year
* Colin Cooke’s services are provided by way of an agreement between the Company, Steels Management Limited and ColinCooke. His service agreement was extended in September 2008 until the AGM 2011.** David Buttfield agreed to serve a further term of two years from the AGM 2009 until the AGM 2011.*** David Campbell is serving for a second three year term from 1 November 2008.
External appointmentsThe Company recognises that its executive directors are likely to be invited to become non-executive directors of other companiesand that such appointments can broaden experience and knowledge which may benefit the Company. Therefore, executivedirectors may, subject to approval by the Board and providing there is no conflict of interest, be allowed to accept appointments asa non-executive director of another company and are normally allowed to retain the fees paid from such appointments. Currentlythe Chief Executive Officer, Mark Abrahams, is the non-executive Chairman of Inditherm plc and retained fees of £35,000 in relationto Inditherm plc’s year ended 31 December 2008. Mark Abrahams is also a non-executive director of The Leeds Teaching HospitalNHS Trust and retains fees of up to £6,000 per annum pro-rata for the year from the date of appointment. The Group FinanceDirector, Richard Perry, is a non-executive director of Scapa Group plc and retained fees of £37,583 in relation to Scapa Groupplc’s year ended 31 March 2009.
Remuneration components for executive directorsThe major components of the executive directors’ remuneration are as follows:
Basic annual salary and benefitsThe basic annual salary is subject to an annual review which takes into account the performance of the Group, the individual andsalary trends in comparable companies. In addition, a car allowance, healthcare insurance and other benefits are available in linewith normal corporate practice.
In 2008, HNBSC were commissioned to produce a report on comparative pay for chairmen, non-executive directors, executivedirectors and senior executives of companies similar to Fenner, benchmarked against two comparator groups; (1) a bespoke groupof 20 companies comprising the majority of the companies used in the PSP Peer Group and (2) a number of other companies withmedian market capitalisation and turnover similar to Fenner, comprising 26 companies from all industries excluding financialservices, property and real estate. All companies in these groups had a market cap and turnover within 50% - 200% of theCompany and at least 25% of their turnover outside the UK. In light of the report recommendations, the salaries of the executivedirectors were increased with effect from 1 September 2008 to raise them above the lower quartile.
The Board has recommended a freeze on pay for the Board and members of the Executive Committee for the year to 31 August2010. This is in recognition of the cost reduction and rationalisation programmes that have taken place during the year underreview.
The Remuneration Committee takes account of the pay levels of senior management of the Fenner Group when establishing theexecutive directors’ remuneration.
Annual performance related bonusPerformance related cash bonuses are reviewed annually. EPS targets aligned to shareholder expectations are set which must beachieved before the target bonus is payable. The target bonus for achievement of the performance EPS target is 45% of basicannual salary and the maximum potential payment for the annual bonus is 60% of basic annual salary, excluding benefits in kindand pension contributions.
Board Remuneration Report continued

F e n n e r p l c 2 9
Performance Share PlanThe PSP is designed to encourage its participants to deliver sustained long term above market returns to shareholders.
Rewards under the PSP are linked to the Company's performance against demanding targets over three year periods(“Performance Periods”). A conditional award of ordinary shares is based on a percentage of the participant's annual basic salaryup to a permitted maximum of 150% (but currently set at 70%) and the value of the Company's ordinary shares on grant.
The performance measurement for each of the Performance Periods is the Company's TSR which is compared with the TSR of thePSP Peer Group. The PSP Peer Group is described on page 27. The Remuneration Committee selected the PSP Peer Group as itbelieved it to be the most appropriate group against which the TSR of the Company should be measured because it is a group ofbusinesses similar in nature to the Company and which represents alternative investment options for our shareholders.
100% of the award may vest only if the Company's performance places it within the top 10% of the companies in the PSP PeerGroup. 25% of the award vests at the median. No awards vest if the Company's ranking is below the median. Between the medianand the top 10%, awards will vest on a straight-line basis (with interpolation between rankings). In addition, no award will vestunless the Committee is satisfied that the Company’s TSR performance reflects its underlying financial performance.
There have been no departures from the Company's policy on awarding benefits under the PSP since it was adopted at the AGMon 10 January 2007 other than to align the Performance Period with the financial year of the Group and to roll up dividends into theconditional award until the date of vesting.
The performance chart below illustrates the Company’s TSR over the past five years compared to the TSR performance of the FTSEAll Share Industrial Engineering Index and the FTSE All Share Small Cap Index. The Plan Cycle and Performance Period for the 1stissue of the PSP are aligned with the release of the Group’s Preliminary Results. The 2nd and subsequent PSP Plan Cycles remainaligned with the release of the Group's Preliminary Results but the Performance Periods are aligned to the financial year of theGroup. The Remuneration Committee believes that moving the Performance Period to correspond with the financial year of theGroup more closely aligns the PSP performance with shareholder expectations and shareholder value. The Plan Cycles remain tiedwith the release of the Preliminary Results to ensure Plans are not issued during a close period and that they are only issued oncethere is full disclosure of price sensitive information into the market as a whole.
The PSP is the sole long term incentive vehicle for participants.
The Committee believes that the PSP provides a real incentive for key executives and will result in appropriate rewards fordelivering sustained out-performance against comparator companies and revenue growth. The form of the PSP takes due accountof changes in market practice and standards of good governance.
FTSE All ShareIndustrial
Engineering Index
100131169224226208
FTSE All Share Small
Cap Index
100128146166126124
Fenner
100142211247244141
Date
31 August 200431 August 200531 August 200631 August 200731 August 200831 August 2009
75
125
175
225
275
Fenner FTSE All Share Industrial Engineering Index
FTSE All Share Small Cap Index
Total Shareholder Return
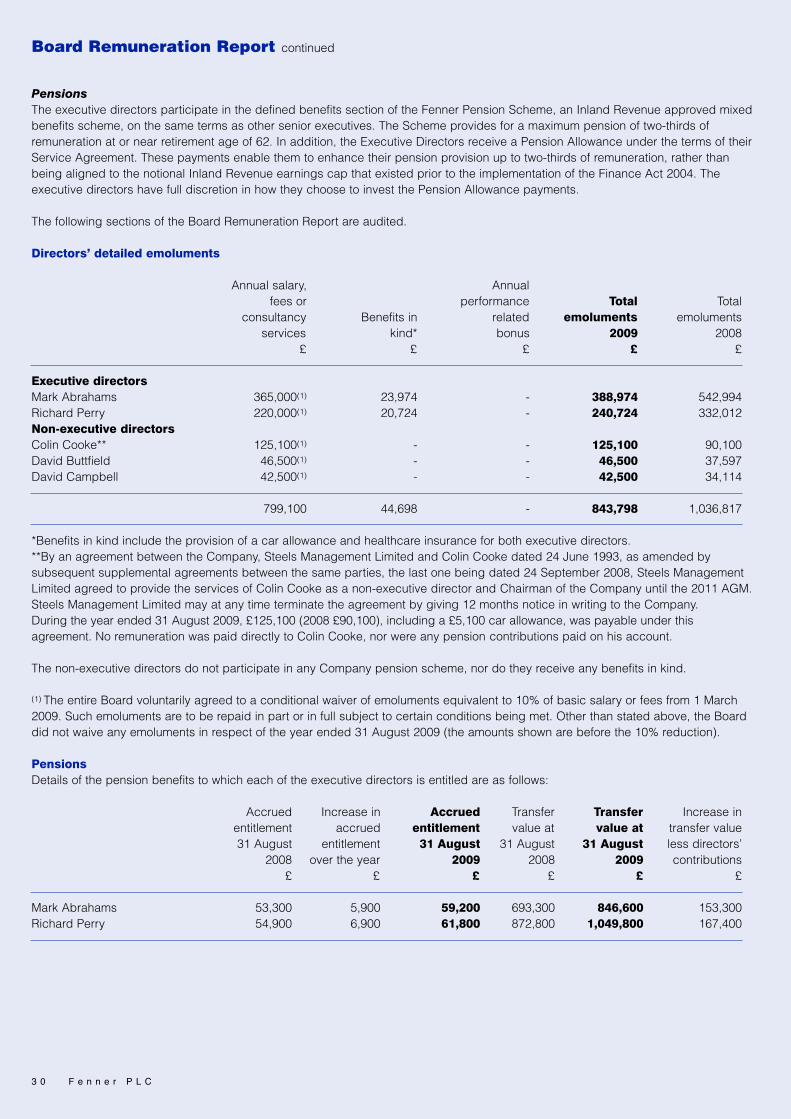
3 0 F e n n e r p l c
PensionsThe executive directors participate in the defined benefits section of the Fenner Pension Scheme, an Inland Revenue approved mixedbenefits scheme, on the same terms as other senior executives. The Scheme provides for a maximum pension of two-thirds ofremuneration at or near retirement age of 62. In addition, the Executive Directors receive a Pension Allowance under the terms of theirService Agreement. These payments enable them to enhance their pension provision up to two-thirds of remuneration, rather thanbeing aligned to the notional Inland Revenue earnings cap that existed prior to the implementation of the Finance Act 2004 . Theexecutive directors have full discretion in how they choose to invest the Pension Allowance payments.
The following sections of the Board Remuneration Report are audited.
Directors’ detailed emoluments
Annual salary, Annual fees or performance Total Total
consultancy Benefits in related emoluments emolumentsservices kind* bonus 2009 2008
£ £ £ £ £
Executive directorsMark Abrahams 365,000(1) 23,974 - 388,974 542,994Richard Perry 220,000(1) 20,724 - 240,724 332,012Non-executive directorsColin Cooke** 125,100(1) - - 125,100 90,100David Buttfield 46,500(1) - - 46,500 37,597David Campbell 42,500(1) - - 42,500 34,114
799,100 44,698 - 843,798 1,036,817
*Benefits in kind include the provision of a car allowance and healthcare insurance for both executive directors.**By an agreement between the Company, Steels Management Limited and Colin Cooke dated 24 June 1993, as amended bysubsequent supplemental agreements between the same parties, the last one being dated 24 September 2008, Steels ManagementLimited agreed to provide the services of Colin Cooke as a non-executive director and Chairman of the Company until the 2011 AGM.Steels Management Limited may at any time terminate the agreement by giving 12 months notice in writing to the Company.During the year ended 31 August 2009, £125,100 (2008 £90,100), including a £5,100 car allowance, was payable under thisagreement. No remuneration was paid directly to Colin Cooke, nor were any pension contributions paid on his account.
The non-executive directors do not participate in any Company pension scheme, nor do they receive any benefits in kind.
(1) The entire Board voluntarily agreed to a conditional waiver of emoluments equivalent to 10% of basic salary or fees from 1 March2009. Such emoluments are to be repaid in part or in full subject to certain conditions being met. Other than stated above, the Boarddid not waive any emoluments in respect of the year ended 31 August 2009 (the amounts shown are before the 10% reduction).
PensionsDetails of the pension benefits to which each of the executive directors is entitled are as follows:
Accrued Increase in Accrued Transfer Transfer Increase inentitlement accrued entitlement value at value at transfer value31 August entitlement 31 August 31 August 31 August less directors’
2008 over the year 2009 2008 2009 contributions£ £ £ £ £ £
Mark Abrahams 53,300 5,900 59,200 693,300 846,600 153,300Richard Perry 54,900 6,900 61,800 872,800 1,049,800 167,400
Board Remuneration Report continued
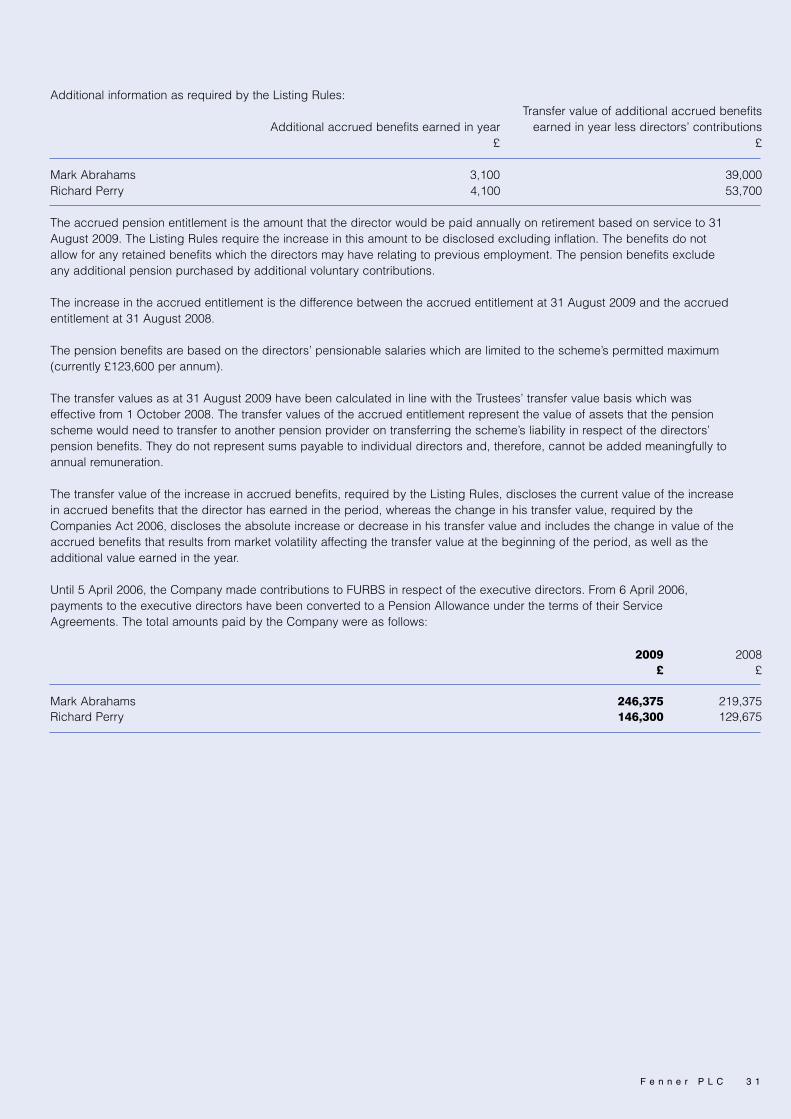
F e n n e r p l c 3 1
Additional information as required by the Listing Rules:Transfer value of additional accrued benefits
Additional accrued benefits earned in year earned in year less directors’ contributions£ £
Mark Abrahams 3,100 39,000Richard Perry 4,100 53,700
The accrued pension entitlement is the amount that the director would be paid annually on retirement based on service to 31August 2009. The Listing Rules require the increase in this amount to be disclosed excluding inflation. The benefits do notallow for any retained benefits which the directors may have relating to previous employment. The pension benefits excludeany additional pension purchased by additional voluntary contributions.
The increase in the accrued entitlement is the difference between the accrued entitlement at 31 August 2009 and the accruedentitlement at 31 August 2008.
The pension benefits are based on the directors’ pensionable salaries which are limited to the scheme’s permitted maximum(currently £123,600 per annum).
The transfer values as at 31 August 2009 have been calculated in line with the Trustees’ transfer value basis which waseffective from 1 October 2008. The transfer values of the accrued entitlement represent the value of assets that the pensionscheme would need to transfer to another pension provider on transferring the scheme’s liability in respect of the directors’pension benefits. They do not represent sums payable to individual directors and, therefore, cannot be added meaningfully toannual remuneration.
The transfer value of the increase in accrued benefits, required by the Listing Rules, discloses the current value of the increasein accrued benefits that the director has earned in the period, whereas the change in his transfer value, required by theCompanies Act 2006, discloses the absolute increase or decrease in his transfer value and includes the change in value of theaccrued benefits that results from market volatility affecting the transfer value at the beginning of the period, as well as theadditional value earned in the year.
Until 5 April 2006, the Company made contributions to FURBS in respect of the executive directors. From 6 April 2006,payments to the executive directors have been converted to a Pension Allowance under the terms of their ServiceAgreements. The total amounts paid by the Company were as follows:
2009 2008£ £
Mark Abrahams 246,375 219,375 Richard Perry 146,300 129,675

3 2 F e n n e r p l c
Board Remuneration Report continued
Interests in shares The interests of the directors in the 25p ordinary shares of the Company were as follows:
31 August 2009 1 September 2008 Number Number
Mark Abrahams 601,290 590,099Richard Perry 499,762 452,269Colin Cooke 222,308 210,408David Buttfield 18,618 -David Campbell 9,690 3,150
All directors’ interests are beneficially held. There have been no other changes in the interests set out above between 31 August 2009 and 11 November 2009.
Share schemesNone of the directors held any share options during the year.
Awards to executive directors under long term incentive schemes were as follows:
LTIP
Provisional Provisionalallocation Provisional allocation End of Plan Cycle
1 September allocation Shares Shares 31 August Value & Award2008 in the year awarded lapsed 2009 awarded Determination
Allocation Date Number Number Number Number Number £ Date
Mark Abrahams9 November 2005 133,236 - - 133,236 - - 13 November 2008
Richard Perry9 November 2005 82,364 - - 82,364 - - 13 November 2008
Total of awards in year - -
PSP
Conditional Conditional End of award Conditional award Performance
1 September award in Shares Shares 31 August Value Period & Award2008 the year awarded lapsed 2009 awarded Determination
Allocation Date Number Number Number Number Number £ Date
Mark Abrahams20 February 2007 97,720 - - - 97,720 - 19 February 201012 February 2008 93,238 - - - 93,238 - 11 February 2011*19 November 2008 - 312,347 - - 312,347 - 18 November 2011**
Richard Perry20 February 2007 59,284 - - - 59,284 - 19 February 201012 February 2008 55,943 - - - 55,943 - 11 February 2011*19 November 2008 - 188,264 - - 188,264 - 18 November 2011**
Total of awards in year - -
* Performance Period ends 31 August 2010 but the award will not vest before 11 February 2011.**Performance Period ends 31 August 2011 but the award will not vest before 18 November 2011.

F e n n e r p l c 3 3
The performance criteria attached to the conditional award of shares made on 19 November 2008 relate to the Company’s TSRwhich is compared with the TSR of the PSP Peer Group.
There have been no variations in the terms and conditions of scheme interests during the year.
The Plan Cycle that ended on 13 November 2008 was independently evaluated and resulted in a nil award. The market value (asdefined in the Rules of the Plan) of an ordinary share of the Company at the beginning of the Plan Cycle was 154.8p, at the end ofthe Plan Cycle was 85p and at 19 November 2008 for the 3rd PSP was 61.75p.
The performance chart on page 29, which shows the relative TSR of the Company against the FTSE All Share IndustrialEngineering Index and the FTSE All Share Small Cap Index, gives an indication of whether each PSP Performance Period willachieve the performance criteria, based upon the share price at 31 August 2009.
Given the nature of the performance calculation, it could be misleading to indicate a likely outcome for future share awards.
Movements in share price during the yearThe market price of the Company’s shares at the end of the financial year was 121.00p and the range of market prices during theyear was between 33.75p and 240.75p.
Signed on behalf of the Board of Directors
D A CampbellChairman of the Remuneration Committee11 November 2009

3 4 F e n n e r p l c
Directors’ Report
The directors submit their report and the audited Group financial statements for the financial year ended 31 August 2009.
Principal activitiesFenner PLC is a global manufacturer and distributor of conveyor belting and reinforced precision polymer products.
The Company is a public limited company which is listed on the London Stock Exchange and is incorporated and domiciled in theUnited Kingdom. The address of the registered office is Hesslewood Country Office Park, Hessle, East Yorkshire, HU13 0PW.
Business reviewThe Business Review, incorporating the Chief Executive Officer’s Review and the Group Finance Director’s Review, can be found onpages 4 to 15.
Results and dividends2009 2008£m £m
Group profit for the year 4.6 25.9
Dividends:Interim 2.2p per share (2008 2.2p) – payable 3.8 3.8Final 4.4p per share (2008 4.4p) – proposed 7.7 7.7
11.5 11.5
DonationsDuring the year, the Group contributed £10,000 (2008 £10,000) to United Kingdom charitable organisations. No donations are made topolitical parties.
Substantial shareholdingsAs of 12 November 2009, the following interests in shares have been notified to the Company:
Number of % of issuedInterested party shares share capital
HSBC Holdings Plc 15,403,686 8.81Threadneedle Asset Management Holdings Limited 10,561,000 6.04Standard Life Investments Limited 10,516,050 6.02Lloyds Banking Group Plc 8,186,125 4.68Invesco Plc 7,383,699 4.22JPMorgan Asset Management (UK) Limited 7,032,344 4.02Legal & General Investment Management Limited 6,789,659 3.88
Directors and their interestsThe directors of the Company who served during any part of the year are shown in the Board Remuneration Report on page 28.
Details of the directors’ beneficial interests in the ordinary shares of the Company, in share options over the ordinary share capital ofthe Company and in the LTIP and PSP are given in the Board Remuneration Report on pages 27 to 33.
Save as disclosed in the Board Remuneration Report:- no director has any interest (beneficial or non-beneficial) in any share or loan capital of the Company or any of its subsidiaries;- no change in the interests of directors has occurred between the end of the financial year and 11 November 2009; and- there were no contracts of significance subsisting during or at the end of the financial year in which a director of the
Company was materially interested.
Mark Abrahams will be retiring by rotation at the forthcoming AGM and being eligible, offers himself up for re-election. Hisperformance continues to be effective and he continues to demonstrate commitment to his roles.
Given the length of his tenure, Colin Cooke will also retire by rotation and offer himself up for re-election in accordance with bestpractice. His performance continues to be effective and his re-election is fully supported by the Board.

F e n n e r p l c 3 5
The Group holds appropriate Director’s and Officer’s liability insurance.
Supplier payment policyGiven the international nature of the Group’s operations, the Group does not operate a standard code in respect of payments tosuppliers. Individual operating businesses are responsible for agreeing the terms and conditions under which transactions with theirsuppliers are conducted, including the terms of payment. It is the Group’s policy that payments to suppliers are made in accordancewith these terms. The average creditor days for the Group during the year ended 31 August 2009 was 59 days (2008: 55 days). TheCompany does not have any trade creditors.
Employment policyThe Group operates worldwide and its employment policies are designed to meet local conditions and requirements but areestablished on the basis of the best practices in each country. Wherever the Group operates, it encourages the provision of equalemployment opportunities.
The Group’s policy is to secure good relations between management and all employees, to promote a better understanding of all theissues, both internal and external, that influence the Group’s business performance and to improve performance and productivity.Formal and informal meetings are used to consult employees and to keep them informed about the performance of the Group. Thepractices of consultation and involvement vary from country to country according to local customs, legal considerations and the sizeof the operation. The regular worldwide issue of a Group magazine assists the process of communication, as do briefing meetings,information bulletins and meetings with employee representatives.
The Group continues to recognise its social and statutory duty to employ disabled persons and does all that is practicable to meetthis responsibility. Full and fair consideration is given to the recruitment, training, career development and promotion of disabledpersons bearing in mind the aptitude and ability of the individual concerned.
If an employee becomes disabled while employed by the Group, wherever possible, he or she will continue to be employed in thesame job. If this action is not practicable or possible then every effort will be made to find suitable alternative employment. Inthese circumstances, retraining would be made available using Group resources as well as by contact with the local disabilitiesemployment adviser.
Further details of the Group’s employment policy are given in the Business Review on page 8 and the Corporate ResponsibilityReport on page 24.
Environmental policyThe Group recognises and accepts that concern for the environment is an integral and fundamental part of the Group’scorporate business strategy.
Details of the Group’s environmental policy are given in the Business Review on pages 9 and 10 and Corporate ResponsibilityReport on pages 25 and 26.
Financial risk managementDetails of the Group’s financial risk management policies are given in note 20 to the Group financial statements on pages 59 to 61.
Other statutory informationSet out below is a summary of certain provisions of the Company’s current Articles of Association (the “Articles”) and the CompaniesAct 2006 (“Companies Act”). If further information is required, the relevant provisions of the Articles and the Companies Act should beconsulted.
Share capitalThe Company’s authorised and issued share capital as at 31 August 2009, together with details of shares issued during the year, is setout in note 9 to the Company financial statements on page 82. Each ordinary share of the Company carries one vote. The Companyhas a single class of share capital which is divided into ordinary shares of 25p each.
Dividends and distributionsSubject to the provisions of the Companies Act, the Company may, by ordinary resolution, from time to time declare dividends notexceeding the amount recommended by the Board. The Board may pay interim dividends, including fixed rate dividends, wheneverthe financial position of the Company, in the opinion of the Board, justifies such payment. Dividends will be paid pro rata to theamounts paid up on the shares. In specie and scrip dividends can be authorised at a General Meeting at the Board’srecommendation.

3 6 F e n n e r p l c
Directors’ Report continued
Voting rightsSubject to any rights or restrictions attaching to any shares by or in accordance with the Articles, at a General Meeting, every memberwho is present in person or by proxy shall have one vote and on a poll, every member present in person or by proxy shall have onevote for each share. In the case of joint holders of a share, the vote of the senior holder who tenders a vote, whether in person or byproxy, shall be accepted to the exclusion of the votes of the other joint holders. For this purpose, seniority shall be determined by theorder in which the names of the holders stand in the register.
Restrictions on votingUnless the Board determine otherwise, no member shall be entitled to vote at a General Meeting, either in person or by proxy, inrespect of any share held unless all moneys are fully paid up on that share. In addition, no member shall be entitled to vote if he hasbeen served with a notice after failure to provide the Company with information concerning interests in those shares required to beprovided under the Companies Act.
Deadline for exercising voting rightsVoting rights may be exercised in person, by proxy, or by a Corporate Representative. The deadline for submission of proxy forms isnot less than 48 hours before the time appointed for holding the meeting or adjourned meeting.
Variation of rightsSubject to the provisions of legislation, the Articles specify that rights attaching to any class of shares may be varied or abrogated,either with the consent in writing of the holders of three-quarters in nominal value of the issued shares of the class being varied or withthe sanction of an extraordinary resolution passed at a separate General Meeting of the holders of the shares of that class.
Transfer of sharesAll transfers of certificated shares may be in any usual form or in any other form which the Board may approve. The instrument oftransfer shall be signed by or on behalf of the transferor and, unless the share is fully paid, by or on behalf of the transferee. Aninstrument of transfer need not be under seal. Transfers of shares which are in uncertificated form are effected by means of the CRESTsystem.
The Board may refuse to register the transfer of a share which is not fully paid, provided that the refusal does not prevent dealings inshares in the Company from taking place on an open and proper basis. In the case of uncertificated shares, the Board may exerciseits discretion to refuse to register a transfer of a share to the extent permitted by the regulations and the facilities and requirements ofthe relevant system.
The Board may also refuse to register the transfer of a certificated share unless the instrument of transfer is lodged, duly stamped (ifstampable) at the office or at another place appointed by the Board, accompanied by the certificate for the share to which it relatesand such other evidence as the Board may reasonably require to show the right of the transferor to make the transfer (and, if theinstrument of transfer is executed by some other person on his behalf, the authority of that person to do so); is in respect of only oneclass of shares; and is in favour of not more than four transferees.
If the Board refuses to register a transfer of a share, it shall send the transferee notice of its refusal together with reasons for the refusalwithin two months after the date on which the instrument of transfer was lodged with the Company.
The registration of transfers of shares or of transfers of any class of shares may be suspended at such times and for such periods (notexceeding 30 business days in any one year) as the Board may determine, except that the Board may not suspend the registration oftransfers of any participating security without the consent of CREST.
Appointment and replacement of directorsUnless varied by ordinary resolution, the number of directors (other than alternate directors) shall be not less than two nor more thanfifteen in number. Directors are not required to hold any shares in the Company by way of qualification although all the directorscurrently hold shares in the company on a voluntary basis.
At each AGM, all those directors who have been in office for three years or more since their last re-appointment shall retire from officeand be eligible for re-appointment. A director who has held office for a continuous period of nine years or more at the date of the AGMshall retire from office and be eligible for re-appointment. The Company abides by best corporate practice and requires that directorswith nine years or more service seek annual re-election.
The Board may appoint a director either to fill a casual vacancy or as an additional director provided that the appointment does notcause the number of directors to exceed the maximum prescribed by the Articles. A director so appointed shall hold office only untilthe next following AGM. If not re-appointed at such AGM, he shall vacate office at its conclusion.

F e n n e r p l c 3 7
Powers of directorsSubject to the provisions of the Companies Act and Articles and to any directions given by special resolution, the business of theCompany shall be managed by the Board which may exercise all the powers of the Company.
The Board may exercise all the powers of the Company to borrow money, to mortgage or charge all or any part of its undertaking,property, assets (present or future) and uncalled capital and to issue debentures and other securities whether outright or as collateralsecurity for any debt, liability or obligation of the Company or of any third party.
Subject to the provisions of the Companies Act and Articles, at a General Meeting, the Board may request the power to allot therelevant securities including for cash and to buy the Company's own ordinary shares in the market. Currently the Board request suchconsent at each AGM. The details of requested authorities in connection with the AGM to be held on 13 January 2010 are set out inthe Notice of the Annual General Meeting.
Significant agreements: change of controlAll of the Company’s current share plans contain provisions relating to a change of control. Outstanding awards and options wouldnormally vest and become exercisable on a change of control, subject to the satisfaction of any performance conditions at that time.
Amendment to articles of associationAny amendments to the Articles may be made in accordance with the provisions of the Companies Act by way of special resolution.The adoption of a new set of Articles is proposed at the AGM to be held on 13 January 2010 and, should the proposal be passed, willbe effective from that date. Further details are set out in the Notice of the Annual General Meeting.
Independent auditorsA resolution to re-appoint PricewaterhouseCoopers LLP as independent auditors to the Company will be proposed at the AGM.
As far as each director is aware, there is no relevant audit information of which the Company’s auditors are unaware. Each director hastaken all the steps that they ought to have taken as a director in order to make themselves aware of any relevant audit information andto establish that the Company’s auditors are aware of that information.
Annual General MeetingAs special business at the forthcoming AGM, resolutions will be proposed to renew the directors’ authority to allot relevant securities,to disapply the statutory pre-emption rights to a limited extent, to make market purchases of ordinary shares in the Companysubject to defined limits and adopt an updated set of Articles of Association. The proposed resolutions and further detailsregarding these proposals are set out in the Chairman’s explanatory letter accompanying the Notice of the Annual General Meeting.
Signed on behalf of the Board of Directors
C I CookeChairman11 November 2009

3 8 F e n n e r p l c
Independent Auditors' Report to the members of Fenner PLC
We have audited the Group financial statements of Fenner PLC for the year ended 31 August 2009 which comprise theConsolidated income statement, the Consolidated balance sheet, the Consolidated cash flow statement, the Consolidatedstatement of recognised income and expense and the related notes. The financial reporting framework that has been applied intheir preparation is applicable law and International Financial Reporting Standards (“IFRS”) as adopted by the European Union.
Respective responsibilities of directors and auditorsAs explained more fully in the Statement of director’s responsibilities set out on pages 20 and 21, the directors are responsible forthe preparation of the Group financial statements and for being satisfied that they give a true and fair view. Our responsibility is toaudit the Group financial statements in accordance with applicable law and International Standards on Auditing (UK and Ireland).Those standards require us to comply with the Auditing Practices Board’s Ethical Standards for Auditors.
This Report, including the opinions, has been prepared for and only for the Company’s members as a body in accordance withSections 495 and 496 of the Companies Act 2006 and for no other purpose. We do not, in giving these opinions, accept or assumeresponsibility for any other purpose or to any other person to whom this report is shown or into whose hands it may come savewhere expressly agreed by our prior consent in writing.
Scope of the audit of the financial statements An audit involves obtaining evidence about the amounts and disclosures in the financial statements sufficient to give reasonableassurance that the financial statements are free from material misstatement, whether caused by fraud or error. This includes anassessment of: whether the accounting policies are appropriate to the Group’s circumstances and have been consistently appliedand adequately disclosed; the reasonableness of significant accounting estimates made by the directors; and the overallpresentation of the financial statements.
Opinion on financial statements In our opinion the Group financial statements:
- give a true and fair view of the state of the Group’s affairs as at 31 August 2009 and of its profit and cash flows for the yearthen ended;
- have been properly prepared in accordance with IFRS as adopted by the European Union; and - have been prepared in accordance with the requirements of the Companies Act 2006 and Article 4 of the lAS Regulation.
Opinion on other matters prescribed by the Companies Act 2006 In our opinion:
- the information given in the Directors’ Report for the financial year for which the Group financial statements are prepared isconsistent with the Group financial statements; and
- the information given in the Corporate Governance statement with respect to Rules 7.2.5 and 7.2.6 of the Disclosure andTransparency Rules issued by the Financial Services Authority is consistent with the financial statements.
Matters on which we are required to report by exception We have nothing to report in respect of the following:
Under the Companies Act 2006 we are required to report to you if, in our opinion: - certain disclosures of directors’ remuneration specified by law are not made; or - we have not received all the information and explanations we require for our audit.
Under the Listing Rules we are required to review: - the directors’ statement, set out on page 21, in relation to going concern; and - the part of the Corporate Governance statement relating to the Company’s compliance with the nine provisions of the June
2008 Combined Code specified for our review.
Other matter We have reported separately on the parent company financial statements of Fenner PLC for the year ended 31 August 2009 and onthe information in the Board Remuneration Report that is described as having been audited.
Randal Casson for and on behalf of PricewaterhouseCoopers LLPChartered Accountants and Statutory Auditors, Hull
11 November 2009

F e n n e r p l c 3 9
Consolidated income statementfor the year ended 31 August 2009
3,4
6
3,5
8
8
8
9
11
11
11
RevenueCost of sales
Gross profitDistribution costs
Administrative expenses
Operating profit before amortisation of intangible assets acquired and exceptional itemsAmortisation of intangible assets acquired
Exceptional items
Operating profitFinance income
Finance costs
Notional interest on the unwinding of discount on provisions
Profit before taxationTaxation
Profit for the year
Attributable to:Equity holders of the parent
Minority interests
Earnings per shareUnderlying - before amortisation of intangible assets acquired, exceptional items and notional interest
Basic
Diluted
The result for the year derives from continuing operations.
*2008 comparative restated (see note 11).
2008£mNotes
437.8(307.2)
130.6(42.5)(44.3)
49.3(2.1)(3.4)
43.81.8(9.0)(0.3)
36.3(10.4)
25.9
25.70.2
25.9
17.7p*15.5p15.4p
499.4(379.8)
119.6(44.9)(57.6)
41.3(6.8)(17.4)
17.11.5
(11.7)(1.3)
5.6(1.0)
4.6
4.50.1
4.6
12.8p2.6p2.6p
2009£m

4 0 F e n n e r p l c
Notes
197.5164.40.326.3
388.5
63.079.03.935.0
180.9
569.4
(30.2)(81.5)(3.5)(4.1)(17.0)
(136.3)
(170.2)-
(42.1)(17.2)(8.1)
(237.6)
(373.9)
195.5
43.783.939.730.0(4.2)1.1
194.21.3
195.5
159.1116.8
0.517.9
294.3
74.884.71.6
43.6
204.7
499.0
(13.7)(99.8)(6.4)(2.6)(4.9)
(127.4)
(127.5)(0.5)
(19.1)(11.1)(7.5)
(165.7)
(293.1)
205.9
43.783.964.014.0(1.8)1.1
204.91.0
205.9
12
13
14
15
16
17
18
22
24
23
27
22
24
25
27
15
28, 29
29
29
29
29
29
29
Consolidated balance sheetat 31 August 2009
Non-current assetsProperty, plant and equipment
Intangible assets
Other investments
Deferred tax assets
Current assetsInventories
Trade and other receivables
Current tax assets
Cash and short-term deposits
Total assets
Current liabilitiesBorrowings
Trade and other payables
Current tax liabilities
Derivative financial liabilities
Provisions
Non-current liabilitiesBorrowings
Trade and other payables
Retirement benefit obligations
Provisions
Deferred tax liabilities
Total liabilities
Net assets
EquityShare capital
Share premium
Retained earnings
Exchange reserve
Hedging reserve
Other reserve
Shareholders' equityMinority interests
Total equity
The financial statements were approved by the Board of Directors on 11 November 2009 and signed on its behalf by:
C I Cooke R J Perry
Chairman Group Finance Director
2009£m
2008£m

F e n n e r p l c 4 1
Consolidated cash flow statementfor the year ended 31 August 2009
33
18
5.6
21.81.1(2.4)(0.6)(1.5)11.71.3(0.5)0.5
37.016.5
53.51.5
(12.2)(6.4)
36.4
(33.0)0.1(1.3)0.3
(37.6)0.1
(71.4)
(11.5)(0.1)-
(22.6)63.2
29.0
(6.0)43.6(2.7)
34.9
36.3
12.20.8(2.7)(0.2)(1.8)9.00.3(0.7)0.7
53.9(8.2)
45.71.8(8.1)
(11.2)
28.2
(63.4)0.5(0.3)0.1
(45.9)4.8
(104.2)
(9.9)(0.1)35.6(47.0)70.9
49.5
(26.5)66.04.1
43.6
Profit before taxation
Adjustments for:
Depreciation of property, plant and equipment and amortisation of intangible assets
Impairment loss on property, plant and equipment
Movement in retirement benefit obligations
Movement in provisions
Finance income
Finance costs
Notional interest on the unwinding of discount on provisions
Profit on disposal of businesses
Other non-cash movements
Operating cash flow before movement in working capital
Movement in working capital
Net cash from operations
Interest received
Interest paid
Taxation paid
Net cash from operating activities
Investing activities:Purchase of property, plant and equipment
Disposal of property, plant and equipment
Purchase of intangible assets
Disposal of investments
Acquisition of businesses
Disposal of businesses
Net cash used in investing activities
Financing activities:Equity dividends paid
Dividends paid to minority shareholders
Issue of ordinary share capital
Repayment of borrowings
New borrowings
Net cash from financing activities
Net decrease in cash and cash equivalentsCash and cash equivalents at start of year
Exchange movements
Cash and cash equivalents at end of year
2009£mNotes
2008£m

4 2 F e n n e r p l c
Consolidated statement of recognised income and expensefor the year ended 31 August 2009
4.6
16.2(1.2)(1.6)(24.3)7.0
(3.9)
0.7
0.40.3
0.7
25.9
19.0(1.4)(1.1)(7.4)1.8
10.9
36.8
36.50.3
36.8
Profit for the year
Items recognised directly in equity:
Currency translation differences
Hedge of net investments in foreign currencies
Interest rate and currency swaps
Actuarial losses on defined benefit pension schemes
Taxation on items taken directly to equity
Net (expense)/income recognised directly in equity
Total recognised income and expense for the year
Attributable to:Equity holders of the parent
Minority interests
2009£m
2008£m
9
Notes

F e n n e r p l c 4 3
Notes to the Group financial statements
1. Significant accounting policies
Basis of preparationThe Group financial statements have been prepared in accordance with International Financial Reporting Standards (“IFRS”) as adopted by the
European Union and with IFRIC interpretations and those parts of the Companies Act 2006 applicable to companies reporting under IFRS. The
Company has elected to prepare its Company financial statements in accordance with UK Generally Accepted Accounting Practice
(“UK GAAP”). The Group financial statements are prepared on the historical cost basis, except for derivative financial instruments,
share-based payments and assets of post-retirement benefit schemes, which are measured at fair value.
The following standards or interpretations to existing standards have been adopted for the first time during the year:
• Amendment to IAS 39 ‘ Financial Instruments: Recognition and Measurement’ and IFRS 7 ‘Financial Instruments: Disclosures – Reclassification
of Financial Assets’
• IFRIC 12 ‘Service Concession Arrangements’
• IFRIC 13 ‘Customer Loyalty Programmes’
• IFRIC 14 ‘IAS 19 – The Limit on a Defined Benefit Asset, Minimum Funding Requirements and their Interaction’
The following standards or interpretations to existing standards have been published but are not mandatory for the year ended 31 August 2009 and
consequently have not been adopted by the Group in the year:
• IAS 1 (Revised) ‘Presentation of Financial Statements’
• Amendment to IAS 1 ‘Presentation of Financial Statements’
• IAS 23 (Revised) ‘Borrowing Costs’
• IAS 27 (Revised) ‘Consolidated and Separate Financial Statements’
• Amendment to IAS 32 ‘Financial Instruments: Presentation’
• Amendment to IAS 39 ‘Financial Instruments: Recognition and Measurement’
• Amendment to IFRS 1 ‘First-time Adoption of International Financial Reporting Standards’
• Amendment to IFRS 2 ‘Share-based Payment’
• IFRS 3 (Revised) ‘Business Combinations’
• Amendment to IFRS 7 ‘Financial Instruments: Disclosures’
• IFRS 8 ‘Operating Segments’
• IFRIC 15 ‘Agreements for the Construction of Real Estate’
• IFRIC 16 ‘Hedges of a Net Investment in a Foreign Operation’
• IFRIC 17 ‘Distributions of Non-cash Assets to Owners’
• IFRIC 18 ‘Transfers of Assets from Customers’
None of the above standards or interpretations are expected to have a significant impact on the results or net assets of the Group.
The principal accounting policies adopted for the year ended 31 August 2009, which have been consistently applied, are set out below.
Basis of consolidationThe Group financial statements comprise the financial statements of Fenner PLC and subsidiaries controlled by the Group as at 31 August each
year.
A subsidiary is an entity over which the Group has the power to control the financial and operating policy decisions of the entity so as to obtain
benefits from its activities. The acquisition of subsidiaries is accounted for using the purchase method. The cost of the acquisition is measured at
the aggregate of the fair values of assets given, liabilities incurred or assumed and equity instruments issued by the Group at the date of
completion, plus any costs directly attributable to the acquisition. The subsidiary’s identifiable assets and liabilities are initially recognised at their
fair values at the date of acquisition. Subsidiaries acquired or disposed of during the year are consolidated from the effective date of acquisition or
up to the effective date of disposal, as appropriate. Where necessary, the accounting policies of acquired subsidiaries are adjusted to bring them
into line with those used by the Group.
Minority interests in subsidiaries are identified separately from the Group’s equity. Minority interests consist of the amount of those interests at the
date of acquisition and the minority’s share of changes in equity since the date of acquisition.
All intra-group transactions, balances, income and expenses are eliminated on consolidation.
Foreign currencies(a) Functional and presentation currency
The individual financial statements of each entity in the Group are presented in the currency of the primary economic environment in which it operates
(the functional currency). The Group financial statements are presented in pounds sterling, which is the presentation currency of the Group.

4 4 F e n n e r p l c
Notes to the Group financial statements continued
1. Significant accounting policies continued
(b) Transactions and balances
Transactions in currencies other than an entity’s functional currency are recorded at the rates of exchange prevailing on the dates of the
transactions. At each balance sheet date, monetary assets and liabilities are retranslated at the rates prevailing on the balance sheet date.
Non-monetary items measured at historical cost are not retranslated. Exchange differences arising on the settlement and retranslation of monetary
items are recognised in the income statement in the period.
(c) Net investment in foreign operations
For the consolidation of operations where the functional currency is different to the Group’s presentation currency, the assets and liabilities are
translated at exchange rates prevailing on the balance sheet date and income and expenses are translated at the average exchange rates for the
period. Exchange differences arising are recognised directly in equity in the exchange reserve. On disposal of such operations, the cumulative
exchange differences are included in the profit or loss on disposal.
The Group has adopted the transitional provisions of IFRS 1 'First-time Adoption of International Financial Reporting Standards' to reset to zero the
cumulative exchange differences in equity at 1 September 2004, the date of transition to IFRS.
Goodwill and fair value adjustments arising on the acquisition of foreign operations are treated as assets and liabilities of that operation and are
retranslated at the closing rate at each balance sheet date. The Group has adopted the transitional provisions of IFRS 1 to not apply this to goodwill
arising on acquisitions prior to 1 September 2004, the date of transition to IFRS.
Revenue recognitionRevenue is measured at the fair value of the consideration receivable and represents amounts receivable for goods and services provided in the
normal course of business, net of discounts, VAT and other sales related taxes. Revenue from the sale of goods is recognised when the significant
risks and rewards of ownership have passed to the buyer. Revenue from short-term service contracts is recognised in the period in which the
services are completed.
Interest income is recognised on an accruals basis using the effective interest method. Royalty income is recognised on an accruals basis in accordance
with the substance of the relevant agreement. Dividend income from investments is recognised when the right to receive payment is established.
LeasesLeases are classified as finance leases whenever the terms of the lease transfer substantially all the risks and rewards of ownership to the lessee.
All other leases are classified as operating leases.
Assets held under finance leases are included in property, plant and equipment at the lower of their fair value at the inception of the lease and the
present value of the minimum lease payments. The corresponding liability is included in the balance sheet as a finance lease obligation. Lease
payments are apportioned between finance charges and reduction of the lease obligation so as to achieve a constant rate of interest on the
remaining balance of the liability. Finance charges are recognised in the income statement.
Rentals payable under operating leases are recognised in the income statement on a straight-line basis over the term of the relevant lease.
Government grantsGovernment grants in respect of property, plant and equipment are treated as deferred income in the balance sheet and are recognised in the
income statement over the expected useful life of the relevant asset. Government grants in respect of revenue expenditure are recognised in the
income statement in the period in which the related expenditure is incurred.
Share-based paymentsThe Group operates equity-settled and cash-settled share schemes for certain employees.
The cost of equity-settled share-based payments is measured at fair value at the date of grant, excluding the effect of non market-based vesting
conditions. The cost is recognised in the income statement on a straight-line basis over the vesting period with the corresponding amount credited
to equity, based on an estimate of the number of shares that will eventually vest. The fair values are measured using the Binomial option-pricing
model and the Monte Carlo simulation approach.
The cost of cash-settled share-based payments is measured as per the equity-settled payments, except that it is recalculated at each subsequent
reporting date. In addition, the corresponding amount is credited to trade and other payables instead of equity.
The Group has adopted the transitional provisions of IFRS 1 to apply IFRS 2 ‘Share-based Payment’ only to equity-settled awards granted after
7 November 2002 that had not vested at 1 January 2005.

F e n n e r p l c 4 5
Post-retirement benefitsThe Group operates various pension schemes. The schemes are generally funded through trustee-administered funds, determined by periodic
actuarial calculations. The Group has both defined benefit and defined contribution schemes.
For defined benefit schemes, the liability recognised in the balance sheet is the present value of the defined benefit obligation at the balance sheet
date less the fair value of scheme assets, together with adjustments for unrecognised past service costs. The defined benefit obligation is calculated
annually by independent qualified actuaries using the projected unit method. The present value of the defined benefit obligation is determined by
discounting the estimated future cash outflows using interest rates of high quality corporate bonds that are denominated in the currency in which the
benefits will be paid and that have terms to maturity approximating to the terms of the related pension liability. Service costs are recognised in the
income statement to spread the cost over the expected lives of the employees. Net finance costs or income are recognised in the income statement
in the period in which they are incurred. Actuarial gains and losses arising from experience adjustments and changes in actuarial assumptions are
charged or credited to equity in the statement of recognised income and expense in the period in which they arise. Past service costs are
recognised immediately in the income statement, unless the changes to the pension scheme are conditional on the employees remaining in service
for a specified period of time (the vesting period). In this case, the past service costs are amortised on a straight-line basis over the vesting period.
For defined contribution schemes, payments are recognised in the income statement as they are incurred. The Group has no further payment
obligations once the contributions have been paid. Prepaid contributions are recognised as an asset to the extent that a cash refund or a reduction
in the future payments is available.
Some Group companies provide post-retirement healthcare benefits to their retirees. The expected costs of these benefits are accrued over the
period of employment using the same accounting methodology as used for defined benefit pension schemes. Actuarial gains and losses arising
from experience adjustments and changes in actuarial assumptions are charged or credited to equity in the statement of recognised income and
expense in the period in which they arise. These obligations are valued annually by independent qualified actuaries.
The Group has adopted the transitional provisions of IFRS 1 to recognise in full the cumulative actuarial gains and losses at 1 September 2004, the
date of transition to IFRS. The Group has also adopted the Amendment to IAS 19 ‘Employee Benefits’ permitting the recognition of actuarial gains
and losses in the statement of recognised income and expense.
Exceptional itemsExceptional items are items of income and expense that are material and relevant to an understanding of the Group’s financial performance and may
be operating or non-operating in nature. In accordance with IAS 1 ‘Presentation of Financial Statements’, such items are presented separately on the
face of the income statement and analysed in the notes to the financial statements.
TaxationTaxation expense represents the sum of the current tax payable and deferred tax.
Current tax is the tax expected to be payable on taxable profit for the period using tax rates that have been enacted or substantively enacted by the
balance sheet date, together with any adjustments in respect of previous years. Taxable profit differs from profit as reported in the income statement
because it excludes items of income or expense that are not taxable or deductible or are taxable or deductible in other years.
Deferred tax is recognised, using the liability method, for temporary differences between the carrying amounts of assets and liabilities in the financial
statements and the corresponding tax bases used in the computation of taxable profit, unless specifically exempt. Deferred tax assets are
recognised only to the extent that it is probable that future taxable profits will be available against which the temporary differences can be utilised.
Deferred tax is calculated using tax rates that are expected to apply in the period when the liability is settled or the asset realised. The resulting
charge or credit is recognised in the income statement except when it relates to items recognised directly in equity, in which case the charge or
credit is also recognised directly in equity.
DividendsDividends proposed by the Board are recognised in the financial statements when they have been approved by shareholders at the Annual General
Meeting. Interim dividends are recognised when they are paid.
Segmental reportingA segment is a distinguishable component of the Group that is engaged either in providing products or services (business segment) or in providing
products and services within a particular economic environment (geographical segment), which is subject to risks and rewards that are different
from those of other segments. The Group reports separate information on its material operations for each of the Group’s segments. The Group’s
primary segment is the business sector and its secondary segment is the geographical area.

4 6 F e n n e r p l c
Notes to the Group financial statements continued
1. Significant accounting policies continued
Property, plant and equipmentProperty, plant and equipment is stated at historical cost or deemed cost less accumulated depreciation and any accumulated impairment losses.
The Group has adopted the transitional provisions of IFRS 1 to record the previously revalued freehold land and buildings as deemed cost at
1 September 2004, the date of transition to IFRS.
Freehold land is not depreciated. Depreciation on other assets is recognised in the income statement to write down the value of the asset to its
residual value on a straight-line basis over the estimated useful life of the asset from the date it is brought into use. Estimated useful lives most
widely applied are as follows:
Freehold buildings 40 years
Leasehold buildings Unexpired term of lease
Plant, machinery and equipment 3-10 years
Assets held under finance leases are depreciated over their expected useful lives on the same basis as owned assets or, where shorter, the term of
the relevant lease.
The gain or loss arising on the disposal or retirement of an asset is determined as the difference between the sales proceeds and the carrying
amount of the asset and is recognised in the income statement.
GoodwillGoodwill arising on consolidation represents the excess of the cost of acquisition over the Group’s interest in the fair value of the identifiable assets
and liabilities of a subsidiary, associate or joint venture at the date of acquisition. Goodwill is initially recognised as an asset at cost and is
subsequently measured at cost less any accumulated impairment losses. The carrying amount of goodwill is reviewed for impairment annually, or
more frequently when events or changes in circumstances indicate that the carrying amount may be impaired. Any impairment is recognised in the
income statement and is not subsequently reversed. Any excess of the Group’s interest in the fair value of the identifiable assets and liabilities of the
acquired entity over cost is recognised immediately in the income statement. Goodwill arising on the acquisition of an associate is included within
the carrying amount of the investment.
On disposal of a subsidiary, associate or joint venture, the attributable amount of goodwill is included in the profit or loss on disposal.
Goodwill arising on acquisitions prior to 1 September 2004, the date of transition to IFRS, has been recorded at the previous UK GAAP carrying
amount at that date, subject to any impairment required at that date. Goodwill written off to reserves under UK GAAP prior to 1998 continues to be
included in reserves and is not included in any subsequent profit or loss on disposal.
Other intangible assetsIntangible assets acquired in a business combination are initially recognised at their fair value. Other intangible assets are initially recognised at
cost. Intangible assets are subsequently stated at fair value or cost less accumulated amortisation and any accumulated impairment losses.
Amortisation is recognised in the income statement on a straight-line basis over the estimated useful life of the asset. Estimated useful lives most
widely applied are as follows:
Computer software 3-5 years
Brands 20 years
Trademarks 5-20 years
Customer relationships 10-16 years
Impairment The carrying amounts of goodwill and other intangible assets with indefinite useful lives are reviewed for impairment annually, or more frequently
when events or changes in circumstances indicate that the carrying amount may be impaired. The carrying amount of property, plant and equipment
and intangible assets with finite useful lives are reviewed for impairment when events or changes in circumstances indicate that the carrying amount
may be impaired. If any such indication exists, the recoverable amount of the asset is estimated in order to determine the extent of any impairment
loss. Where the asset does not generate cash flows that are independent from other assets, the Group estimates the recoverable amount of the
cash-generating unit to which the asset belongs.
The recoverable amount is the higher of fair value less costs to sell and value in use. In assessing value in use, the estimated future cash flows are
discounted to their present value using an appropriate pre-tax discount rate. If the recoverable amount of an asset or cash-generating unit is
estimated to be less than its carrying amount, the carrying amount of the asset or cash-generating unit is reduced to its recoverable amount. Any
impairment loss is recognised in the income statement.

F e n n e r p l c 4 7
Where an impairment loss subsequently reverses, the carrying amount of the asset or cash-generating unit is increased to the revised estimate of its
recoverable amount, but so that the increased carrying amount does not exceed the carrying amount that would have been determined had no
impairment loss previously been recognised for the asset or cash-generating unit. Any reversal of an impairment loss is recognised in the income
statement. Impairment losses on goodwill are not subsequently reversed.
InventoriesInventories are stated at the lower of cost and net realisable value. Cost comprises direct materials and, where applicable, direct labour costs and
those overheads that have been incurred in bringing inventories to their present location and condition. Net realisable value represents the
estimated selling price less all estimated costs of completion and costs to be incurred in marketing, selling and distribution.
Financial assetsFinancial assets and financial liabilities are recognised in the balance sheet when the Group becomes a party to the contractual provisions of the
instrument.
(a) Trade receivables
Trade receivables are measured at amortised cost less provision for impairment.
(b) Cash and short-term deposits
Cash and short-term deposits comprise cash in hand, deposits available on demand and other short-term highly liquid investments that are readily
convertible to a known amount of cash and are subject to an insignificant risk of changes in value. For the purposes of the cash flow statement,
cash and cash equivalents also includes bank overdrafts as they are an integral part of the Group’s cash management.
Financial liabilities and equity instrumentsFinancial liabilities and equity instruments are classified according to the substance of the contractual arrangements entered into. An equity
instrument is any contract that evidences a residual interest in the assets of the Group after deducting all of its liabilities.
(a) Trade payables
Trade payables are measured at amortised cost.
(b) Borrowings
Bank loans and overdrafts and other loans are initially measured at fair value less direct arrangement fees and subsequently measured at amortised
cost.
(c) Equity instruments
Equity instruments issued by the Group are recorded at the proceeds received net of direct issue costs.
Derivative financial instruments and hedge accountingThe Group uses derivative financial instruments, including forward foreign currency contracts, options, interest rate and currency swaps and non-
derivative cash instruments, including foreign currency borrowings, to hedge its exposure to the financial risks of changes in foreign exchange rates
or interest rates. The Group does not use derivative financial instruments for speculative purposes.
Derivative financial instruments are initially measured at fair value on the contract date and are subsequently measured at fair value at each balance
sheet date.
Changes in the fair value of derivative financial instruments that are designated and effective as hedges of future cash flows are recognised directly
in equity. Amounts deferred in equity are recognised in the income statement in the same period in which the hedged item affects the income
statement.
Changes in the fair value of derivative financial instruments that do not qualify for hedge accounting or the ineffective portion of financial instruments
that are designated and effective as hedges are recognised in the income statement as they are incurred.
Hedge accounting is discontinued when the hedging instrument expires or is sold, terminated, exercised or no longer qualifies for hedge
accounting. Any cumulative gain or loss on the hedging instrument in equity at that time is retained in equity until the forecast transaction occurs. If a
hedged transaction is no longer expected to occur, the cumulative gain or loss in equity is transferred to the income statement in the period.
ProvisionsProvisions are recognised when the Group has a present obligation as a result of a past event and it is probable that the Group will be required to
settle that obligation. Provisions are measured at the directors’ best estimate of the expenditure required to settle the obligation at the balance sheet
date and are discounted to present value where the effect is material.
Notes to the Group financial statements continued
4 8 F e n n e r p l c
2. Critical accounting estimates and judgementsThe preparation of financial statements in accordance with IFRS requires management to make certain assumptions, estimates and judgements that
may affect the reported amounts of assets, liabilities, income and expenses. These are based on historical experience and any other factors,
including expectations of future events, that are considered appropriate and these are continually reviewed. Subsequent actual results may however
differ from these estimates and judgements. Areas where assumptions, estimates and judgements may give rise to risk of material adjustments to
the carrying values of assets and liabilities in the next financial year are as follows:
• Taxation (notes 9 and 15)
• Impairment of goodwill (note 13)
• Inventory provisions (note 16)
• Provisions for impairment of trade receivables (note 17)
• Retirement benefit obligations (note 25)
• Share-based payments (note 26)
• Provisions (note 27)
• Contingent liabilities (note 30)
• Acquisitions (note 33)
3. Segment information Segment information is presented in respect of the Group’s business and geographical segments. The primary format, business segments, is based
on the Group’s management reporting structure.
Segment results, assets and liabilities comprise items directly attributable to a segment. Unallocated costs, assets and liabilities are corporate items
that cannot be reasonably allocated to a segment.
Business segmentsThe Group is organised into the following main business segments:
Conveyor Belting Manufacture of rubber, PVC and steel cord conveyor belts. Applications include mining (underground and
surface), aggregates and various industrial uses such as package handling and process industries. This is
supported by a network of service branches around the world.
Advanced Engineered Products Manufacture of precision polymer products including:
- precision drives for computer peripherals, copiers and ATMs
- problem-solving power transmission and motion transfer components
- silicone and complex hoses for heavy duty trucks, buses and off-road vehicles
- seals and sealing solutions for the fluid power and oil and gas industries
- technical textiles for medical and industrial applications
- rollers for digital image processing and medical diagnostics
- fluropolymer components for fluid and gas handling

F e n n e r p l c 4 9
Segment information for the years ended 31 August 2009 and 31 August 2008 is as follows:
Segment resultTotal segment revenue
Inter-segment revenue
Revenue
Operating profit before amortisation of intangible
assets acquired and exceptional items
Amortisation of intangible assets acquired
Exceptional items
Operating profit
Net finance costs
Taxation
Profit for the year
Segment assets and liabilitiesTotal assets
Total liabilities
Net assets
Other segment informationCapital expenditure
Depreciation and amortisation
Capital expenditure relates to property, plant and equipment and intangible assets. Amortisation excludes amortisation of intangible assets acquired.
Geographical segmentsThe Group operates in four main geographical areas; Europe, Americas, Asia Pacific and Africa.
Segment information for the years ended 31 August 2009 and 31 August 2008 is as follows:
Europe
Americas
Asia Pacific
Africa
Unallocated
Revenue is based on the region in which the customer is located. Total assets and capital expenditure are based on the region in which the assets
are located.
501.7(2.3)
499.4
41.3(6.8)(17.4)
17.1
(11.5)(1.0)
4.6
569.4(373.9)
195.5
34.315.0
440.6(2.8)
437.8
49.3(2.1)(3.4)
43.8
(7.5)(10.4)
25.9
499.0(293.1)
205.9
63.710.1
--
-
(5.9)--
(5.9)
31.4(141.7)
(110.3)
0.20.1
--
-
(5.3)--
(5.3)
15.3(206.7)
(191.4)
0.40.1
139.9(2.3)
137.6
15.8(3.2)(5.5)
7.1
182.8(35.3)
147.5
4.14.6
148.4(2.8)
145.6
26.1(2.0)(0.4)
23.7
186.5(36.2)
150.3
9.63.4
361.8-
361.8
30.8(3.6)(11.9)
15.3
371.3(131.9)
239.4
29.810.3
292.2-
292.2
29.1(0.1)(3.0)
26.0
281.1(115.2)
165.9
53.96.6
2008£m
2009£m
2008£m
2009£m
2008£m
2009£m
2008£m
2009£m
TotalUnallocatedAdvanced
Engineered ProductsConveyor Belting
5.77.021.20.4-
34.3
4.739.917.81.3-
63.7
114.3308.5134.112.5
-
569.4
141.1245.5101.810.40.2
499.0
82.2262.1128.826.3
-
499.4
102.2201.7113.220.7
-
437.8
2008£m
2009£m
2008£m
2009£m
2008£m
2009£m
Capital ExpenditureTotal AssetsRevenue

5 0 F e n n e r p l c
Notes to the Group financial statements continued
4. Revenue Revenue is analysed as follows:
Sales of goods
Service contracts
RevenueFinance income
Other income
Total revenue
Other income is classified within administrative expenses in the consolidated income statement.
5. Operating profitOperating profit has been arrived at after charging/(crediting):
Depreciation of property, plant and equipment
Impairment loss on property, plant and equipment
Amortisation of intangible assets acquired
Amortisation of other intangible assets
Loss/(profit) on disposal of property, plant and equipment
Foreign exchange loss
Research and development costs
Government grants
Operating lease charges
Exceptional items*
Auditors’ remuneration for audit services
Auditors’ remuneration for non-audit services - overseas
Amortisation of intangible assets acquired is classified within administrative expenses in the consolidated income statement.
Non-audit services comprise due diligence of £nil (2008: £0.1m), taxation services of £0.1m (2008: £0.1m) and other services of £nil (2008: £0.1m).
In addition, fees for actuarial and audit services of £0.2m (2008: £0.1m) were borne by the Fenner Pension Scheme.
*Exceptional items exclude net costs in respect of exceptional depreciation, impairment loss and loss/(profit) on disposal of property, plant and
equipment totalling £1.1m (2008: £1.5m) that are already included within their respective disclosures.
443.356.1
499.41.50.5
501.4
412.225.6
437.81.81.0
440.6
2008£m
2009£m
14.61.16.80.40.2-
1.6(0.7)6.216.30.50.1
9.70.82.10.4(0.3)0.21.8(0.1)4.11.90.60.3
2008£m
2009£m

F e n n e r p l c 5 1
6. Exceptional itemsExceptional items comprise £8.8m (2008: £nil) of global restructuring costs, principally costs of redundancy, to align the Group's cost base
through the global economic downturn, £5.2m (2008: £3.7m) of restructuring and reorganisation costs associated with the major investment
projects in the conveyor belting businesses in North America and Australia, £3.0m (2008: £nil) in respect of a new product replacement, £0.9m
(2008: £0.4m) of acquisition integration and abortive costs and £0.5m (2008: £nil) of profit generated from the disposal of a non-core product line.
Prior year exceptional items also included a £0.7m profit on disposal of the lightweight PVC conveyor belting business. The cash cost of
exceptional items was £14.5m (2008: £2.1m).
7. Employees
Aggregate employment costs are as follows:
Wages and salaries
Social security costs
Pension costs - defined contribution schemes
Pension costs - defined benefit schemes
Share-based payments
The average monthly number of employees during the year is as follows:
Production
Selling and distribution
Administration
Information on directors’ remuneration is included in the audited part of the Board Remuneration Report on pages 30 to 33.
8. Net finance costs
Interest payable on bank overdrafts and loans
Interest payable on other loans
Bank interest receivable
Net interest payable
Unwinding of discount on provisions (note 27)
Net finance costs
7.04.7
11.7(1.5)
10.21.3
11.5
5.04.0
9.0(1.8)
7.20.3
7.5
2008£m
2009£m
2,888487499
3,874
2,959503462
3,924
2009 2008
125.612.94.71.9-
145.1
104.210.74.10.20.6
119.8
2008£m
2009£m

Notes to the Group financial statements continued
5 2 F e n n e r p l c
9. Taxation
Current taxationUK corporation tax:
- current year
- double taxation relief
- adjustments in respect of prior years
Overseas tax:
- current year
- adjustments in respect of prior years
Deferred taxationOrigination and reversal of temporary differences:
- UK
- Overseas
Total taxation
UK corporation tax is calculated at an average rate of 28.0% (2008: 29.2% ) of the estimated assessable profit for the year. Overseas tax is
calculated at the rates prevailing in the respective jurisdictions.
The charge for the year and effective tax rate can be reconciled to profit per the income statement as follows:
Profit before taxation
Taxation at the average UK corporation tax rate of 28.0% (2008: 29.2% )
Expenditure/(income) not allowable/taxable in determining taxable profit
Adjustments in respect of prior years
Effect of overseas tax rates
Other temporary differences not previously provided for
Taxation recognised directly in equity amounts to a deferred taxation credit of £7.0m (2008: £1.8m), comprising origination and reversal of
temporary differences.
2.8(2.7)(0.3)
(0.2)
1.5(0.2)
1.3
1.1
0.2(0.3)
(0.1)
1.0
4.3(3.8)
-
0.5
10.20.3
10.5
11.0
0.8(1.4)
(0.6)
10.4
2008£m
2009£m
2008%
2008£m
284(9)4(9)
18
5.6
1.60.2(0.5)0.2(0.5)
1.0
29(1)14(4)
29
36.3
10.6(0.3)0.31.3(1.5)
10.4
2009%
2009£m

F e n n e r p l c 5 3
10. Dividends
Dividends paid or approved in the yearInterim dividend for the year ended 31 August 2008 of 2.2p (2007: 2.075p) per share
Final dividend for the year ended 31 August 2008 of 4.4p (2007: 4.15p) per share
Dividends neither paid nor approved in the yearInterim dividend for the year ended 31 August 2009 of 2.2p (2008: 2.2p) per share
Final dividend for the year ended 31 August 2009 of 4.4p (2008: 4.4p) per share
The interim dividend for the year ended 31 August 2009 was paid on 7 September 2009. The proposed final dividend for the year ended
31 August 2009 is subject to approval by shareholders at the AGM. Consequently, neither have been recognised as liabilities at 31 August 2009.
If approved, the final dividend will be paid on 8 March 2010 to shareholders on the register on 5 February 2010.
11. Earnings per share
EarningsProfit for the year attributable to equity holders of the parent
Amortisation of intangible assets acquired and exceptional items
Notional interest
Taxation attributable to amortisation of intangible assets acquired, exceptional items and notional interest
Profit for the year before amortisation of intangible assets acquired, exceptional items and notional interest
Average number of sharesWeighted average number of shares in issue
Weighted average number of shares held by the Employee Share Ownership Plan Trust
Weighted average number of shares in issue – basic
Effect of share options and contingent long term incentive plans
Weighted average number of shares in issue – diluted
Earnings per shareUnderlying – before amortisation of intangible assets acquired, exceptional items and notional interest
Basic
Diluted
The 2008 comparatives have been restated to remove the notional interest on the unwinding of discount on provisions from underlying earnings per
share. This was changed in 2009 to provide a clearer understanding of the underlying performance of the Group.
3.87.7
11.5
3.87.7
11.5
3.36.6
9.9
3.87.7
11.5
2008£m
2009£m
4.524.21.3(7.7)
22.3
number
174,770,029(114,177)
174,655,852-
174,655,852
pence
25.75.50.3(2.2)
29.3
number
166,091,438(112,767)
165,978,671888,357
166,867,028
pence
2008(restated)
£m
2009
£m
12.82.62.6
17.715.515.4
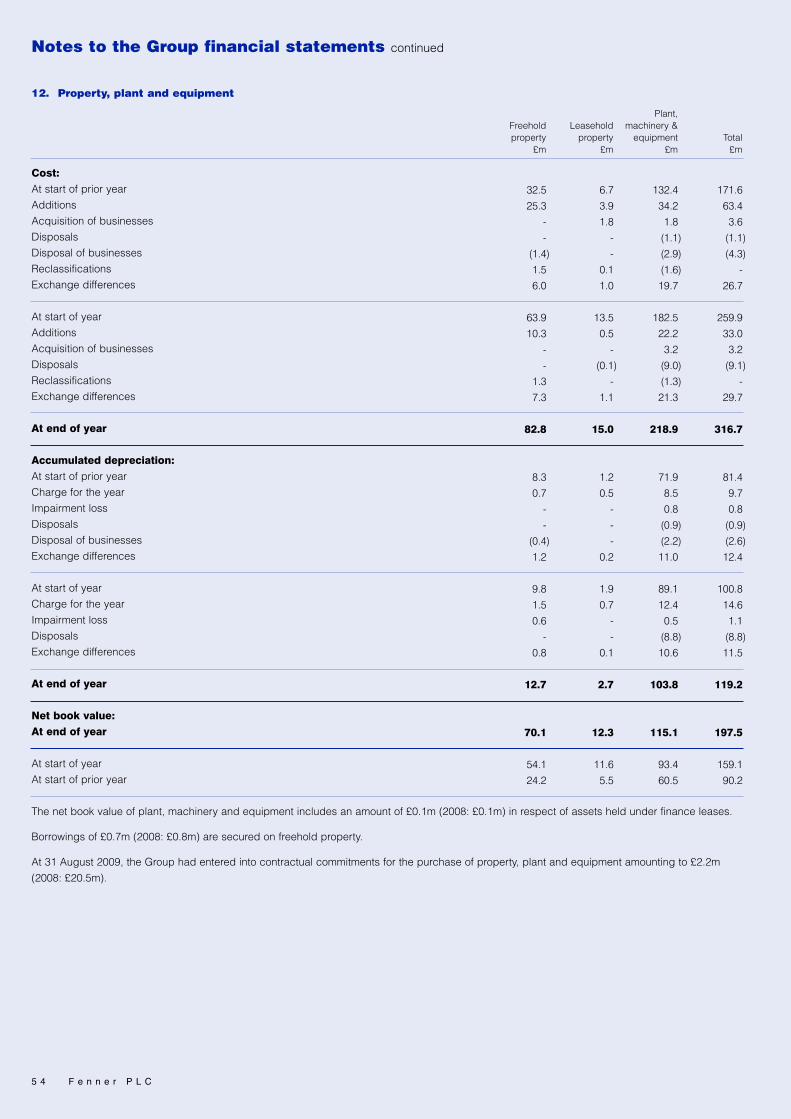
Notes to the Group financial statements continued
5 4 F e n n e r p l c
12. Property, plant and equipment
Cost:At start of prior year
Additions
Acquisition of businesses
Disposals
Disposal of businesses
Reclassifications
Exchange differences
At start of year
Additions
Acquisition of businesses
Disposals
Reclassifications
Exchange differences
At end of year
Accumulated depreciation:At start of prior year
Charge for the year
Impairment loss
Disposals
Disposal of businesses
Exchange differences
At start of year
Charge for the year
Impairment loss
Disposals
Exchange differences
At end of year
Net book value:At end of year
At start of year
At start of prior year
The net book value of plant, machinery and equipment includes an amount of £0.1m (2008: £0.1m) in respect of assets held under finance leases.
Borrowings of £0.7m (2008: £0.8m) are secured on freehold property.
At 31 August 2009, the Group had entered into contractual commitments for the purchase of property, plant and equipment amounting to £2.2m
(2008: £20.5m).
171.663.43.6(1.1)(4.3)
-26.7
259.933.03.2(9.1)
-29.7
316.7
81.49.70.8(0.9)(2.6)12.4
100.814.61.1(8.8)11.5
119.2
197.5
159.190.2
132.434.21.8(1.1)(2.9)(1.6)19.7
182.522.23.2(9.0)(1.3)21.3
218.9
71.98.50.8(0.9)(2.2)11.0
89.112.40.5(8.8)10.6
103.8
115.1
93.460.5
32.525.3
--
(1.4)1.56.0
63.910.3
--
1.37.3
82.8
8.30.7--
(0.4)1.2
9.81.50.6-
0.8
12.7
70.1
54.124.2
Total£m
Plant,machinery &
equipment£m
Leaseholdproperty
£m
Freeholdproperty
£m
6.73.91.8--
0.11.0
13.50.5-
(0.1)-
1.1
15.0
1.20.5---
0.2
1.90.7--
0.1
2.7
12.3
11.65.5

F e n n e r p l c 5 5
13. Intangible assets
Cost:At start of prior year
Additions
Acquisition of businesses
Exchange differences
At start of year
Additions
Acquisition of businesses
Disposals
Exchange differences
At end of year
Accumulated amortisation and impairment losses:At start of prior year
Amortisation charge for the year
Exchange differences
At start of year
Amortisation charge for the year
Disposals
Exchange differences
At end of year
Net book value:At end of year
At start of year
At start of prior year
All intangible assets have finite useful lives except for goodwill.
Impairment testing for goodwillGoodwill acquired through business combinations is allocated at acquisition to the Group’s cash-generating units that are expected to benefit from
that business combination. The carrying amount of goodwill is allocated to cash-generating units as follows:
Conveyor BeltingFenner Dunlop (Americas, Europe and Australia)
Conveyor Belting (India)
Fenner Dunlop Conveyor Services
Northern Belting Specialists (Australia)
Advanced Engineered ProductsFenner Advanced Sealing Technologies (Process)
Fenner Advanced Sealing Technologies (Fluid Power)
Dawson Hose (UK)
Fenner Drives (US)
Prodesco
Fenner Precision (Buffalo)
74.00.3
44.19.1
127.51.3
40.1(0.1)14.0
182.8
7.52.50.7
10.77.2(0.1)0.6
18.4
164.4
116.866.5
3.50.3-
0.4
4.21.3-
(0.1)0.5
5.9
2.70.40.3
3.40.4(0.1)0.4
4.1
1.8
0.80.8
1.3-
0.30.2
1.8-
0.7-
0.2
2.7
1.10.30.2
1.60.2-
0.1
1.9
0.8
0.20.2
Total£m
Computer software
£m
15.02.014.12.1
15.726.92.23.35.82.9
90.0
14.92.01.82.0
14.125.32.23.26.92.5
74.9
2008£m
2009£m
Other£m
Trademarks£m
1.2-
3.30.4
4.9-
5.0-
1.0
10.9
0.10.2-
0.30.8--
1.1
9.8
4.61.1
Brands£m
8.4--
0.8
9.2---
0.7
9.9
1.00.40.1
1.50.5-
0.1
2.1
7.8
7.77.4
Goodwill£m
58.9-
13.74.9
77.5-
9.1-
6.1
92.7
2.6--
2.6--
0.1
2.7
90.0
74.956.3
0.7-
26.82.4
29.9-
25.3-
5.5
60.7
-1.20.1
1.35.3-
(0.1)
6.5
54.2
28.60.7
Customerrelationships
£m
Intangible assets acquired

5 6 F e n n e r p l c
Notes to the Group financial statements continued
13. Intangible assets continued
The carrying amount of goodwill is reviewed for impairment annually, or more frequently when events or changes in circumstances indicate that the
carrying amounts may be impaired. The recoverable amounts of cash-generating units are based on value in use calculations using discounted
cash flow projections. The key assumptions used to determine the value in use relate to profits derived from sales volumes, selling prices and costs,
growth rates and discount rates.
Cash flow projections are based on financial forecasts for a period of three years which have been approved by Group management. The principal
components of these forecasts: sales volumes, selling prices and costs, are based on recent history and expected future changes in operating
conditions. Cash flows beyond a period of three years are extrapolated using estimated growth rates in the respective territories. These rates range
from 1.0% to 1.7% for all cash generating units except for Conveyor Belting (India) where a rate of 6.8% has been applied. Cash flows are
discounted using the Group’s pre-tax weighted average cost of capital of 8.5%.
The above assumptions apply to all of the Group’s cash generating units.
14. Other investments
Cost:At start of prior year
Disposals
At start of year
Disposals
Exchange differences
At end of year
Investments comprise long-term loan notes of an unlisted equity holding. There is no material difference between the cost and fair value of the
investments.
15. Deferred taxDeferred tax assets/(liabilities) are attributable to the following:
Property, plant and equipment
Intangible assets
Retirement benefit obligations
Taxation losses
Fixed asset revaluation
Other short-term temporary differences
0.6
(0.1)
0.5(0.3)0.1
0.3
£m
0.6(3.2)11.70.5(1.0)9.6
18.2
(0.5)(2.7)5.4-
(0.9)9.1
10.4
(3.5)(3.5)--
(1.0)(0.1)
(8.1)
(2.8)(2.9)(0.6)
-(0.9)(0.3)
(7.5)
4.10.311.70.5-
9.7
26.3
2.30.26.0--
9.4
17.9
2008£m
2009£m
2008£m
2009£m
2008£m
2009£m
NetLiabilitiesAssets

F e n n e r p l c 5 7
Movements in net deferred tax assets/(liabilities) are as follows:
At start of prior year
(Charged)/credited to income statement
(Charged)/credited to equity
Acquisition of businesses
Exchange differences
At start of year
(Charged)/credited to income statement
(Charged)/credited to equity
Reclassifications
Exchange differences
At end of year
Deferred tax assets are recognised only to the extent that it is probable that future taxable profits will be available against which the temporary
differences can be utilised. Deferred tax assets and liabilities are offset where there is a legally enforceable right of offset and there is an intention to
settle the balances net. Deferred tax assets have not been recognised in respect of certain tax losses amounting to £2.3m (2008: £2.7m) since it is
not envisaged that such profits will be available in the foreseeable future. In addition, deferred tax assets have not been recognised in respect of
UK capital losses of £0.4m (2008: £0.6m) since it is not envisaged that suitable capital gains will be available in the foreseeable future.
Deferred tax liabilities have not been recognised on the undistributed earnings of subsidiaries because the Group is in a position to control the
timing of reversal of the temporary differences and it is probable that such differences will not reverse in the foreseeable future. The aggregate of
temporary differences in respect of this is £0.2m (2008: £0.1m).
16. Inventories
Raw materials
Work in progress
Finished goods
Inventories are presented net of provision for inventory write downs, based on management’s estimate of the net realisable value of inventories. The
amount charged to the income statement in the year in respect of write downs of inventories is £5.5m (2008: £2.2m). The amount credited to the
income statement in the year in respect of reversals of write downs of inventories is £0.5m (2008: £0.4m). The cost of inventories recognised as an
expense in the year is £350.6m (2008: £300.7m).
17. Trade and other receivables
Trade receivables
Other receivables
Prepayments and accrued income
Trade receivables are presented net of provision for impairment of trade receivables of £2.9m (2008: £1.2m), estimated by management based on
past default experience and other factors as considered appropriate.
Borrowings of £0.7m (2008: £nil) are secured on trade receivables.
78.92.63.2
84.7
72.53.92.6
79.0
2008£m
2009£m
21.010.431.6
63.0
30.911.832.1
74.8
2008£m
2009£m
7.00.61.80.20.8
10.40.17.0-
0.7
18.2
6.02.10.2-
0.8
9.10.70.4(1.2)0.6
9.6
(0.9)----
(0.9)(0.1)
---
(1.0)
-----
-0.6--
(0.1)
0.5
4.1
(0.6)
1.8
-
0.1
5.4(0.6)6.8-
0.1
11.7
Total£m
Other temporary
differences£m
Fixedasset
revaluation£m
Taxationlosses
£m
Retirementbenefit
obligations£m
(2.0)
(0.7)
(0.2)
0.2
-
(2.7)(0.3)(0.2)
--
(3.2)
Intangibleassets
£m
(0.2)
(0.2)
-
-
(0.1)
(0.5)(0.2)
-1.20.1
0.6
Property,plant and
equipment£m

5 8 F e n n e r p l c
Notes to the Group financial statements continued
17. Trade and other receivables continued
Movements in the provision for impairment of trade receivables are as follows:
At start of year
New provisions charged to income statement during the year
Provisions not required credited to income statement during the year
Provisions utilised during the year
Exchange differences
At end of year
The ageing analysis of trade receivables not impaired, based on the due date, is as follows:
Not overdue
Less than one month
Between one and two months
Between two and three months
Between three and six months
Trade and other receivables are non-interest bearing. There is no material difference between the carrying amount and the fair value of trade and
other receivables.
18. Cash and short-term deposits
Cash at bank and in hand and short-term deposits
Cash at bank and short-term bank deposits earn interest at floating rates based on bank deposit rates. Short-term deposits have an original
maturity of three months or less. There is no material difference between the carrying amount and fair value of cash and short-term deposits.
For the purpose of the cash flow statement, cash and cash equivalents comprise:
Cash and short-term deposits
Bank overdrafts
19. Reconciliation of net cash flow to movement in net debt
Net decrease in cash and cash equivalents
Increase in borrowings resulting from cash flows
Movement in net debt resulting from cash flows
Exchange movements
Movement in net debt in the yearNet debt at start of year
Net debt at end of year
Net debt comprises cash and short-term deposits of £35.0m (2008: £43.6m), current borrowings of £30.2m (2008: £13.7m) and non-current
borrowings of £170.2m (2008: £127.5m).
43.6-
43.6
35.0(0.1)
34.9
2008£m
2009£m
43.635.0
2008£m
2009£m
(26.5)(23.9)
(50.4)(10.9)
(61.3)(36.3)
(97.6)
(6.0)(40.6)
(46.6)(21.2)
(67.8)(97.6)
(165.4)
2008£m
2009£m
1.10.5(0.2)(0.3)0.1
1.2
1.22.4(0.4)(0.4)0.1
2.9
2008£m
2009£m
50.216.89.31.90.7
78.9
38.920.59.32.81.0
72.5
2008£m
2009£m

F e n n e r p l c 5 9
20. Financial risk managementIn the normal course of business, the Group is exposed to certain financial risks, principally foreign exchange risk, interest rate risk, liquidity risk
and credit risk. These risks are managed by the central treasury function in conjunction with the operating units, in accordance with risk
management policies that are designed to minimise the potential adverse effects of these risks on financial performance. The policies are reviewed
and approved by the Board.
Foreign exchange riskThe Group has operations around the world and is therefore exposed to foreign exchange risk arising from net investments in foreign operations.
Where cost effective, the exposures arising from the translation of the net assets of the Group’s foreign operations are managed through the use of
borrowings in the relevant foreign currency.
Some Group operations also enter into commercial transactions in currencies other than their functional currencies. Exposures arising from the
translation of foreign currency transactions are continually monitored and material exposures are managed through the use of forward contracts or
options once cash flows can be identified with sufficient certainty. Exposures arising from the translation of intra-group lending are managed
through the use of borrowings in the relevant foreign currency.
The following table shows the impact (due to the retranslation of non-functional currency monetary assets and liabilities in the Group's operations)
of a 10% movement in the Group’s principal foreign currency exchange rates at the year end date.
31 August 2009US dollar
Euro
Australian dollar
31 August 2008US dollar
Euro
Australian dollar
The effect on profit before taxation is due to the retranslation of trade receivables, cash and short-term deposits, borrowings, trade payables and
derivative financial assets and liabilities denominated in non-functional currencies. The effect on shareholders’ equity is due to the effect on profit as
well as the hedge of net investments in foreign currencies.
Further details of the currency profile of borrowings are given in note 22.
Interest rate riskThe Group’s exposure to interest rate risk arises on floating rate borrowings and short-term deposits. This is reviewed regularly and is managed
through the use of an appropriate mix of fixed rate and floating rate instruments, including the use of interest rate swaps, in response to market
conditions.
The impact of interest rate risk on the Group's result is due to changes in interest rates on net floating rate cash and borrowings. At 31 August 2009,
if interest rates on the Group's net floating rate cash and borrowings had been 100 basis points higher, with all other variables held constant, the
effect on profit before taxation in the year would have been a charge of £0.7m (2008: £0.1m). A reduction of 100 basis points would have the equal
and opposite effect. There is no further impact on shareholders' equity.
Further details of the interest rate profile of borrowings are given in note 22.
-(0.9)(0.6)
0.2(0.9)(0.6)
-0.1-
0.2--
-(0.1)
-
(0.2)--
Effect onshareholders'
equity
Effect onprofit before
taxation
-0.70.5
(0.2)0.70.5
Effect onshareholders'
equity
Effect onprofit before
taxation
10% increase 10% decrease

6 0 F e n n e r p l c
Notes to the Group financial statements continued
20. Financial risk management continued
Liquidity riskThe Group manages its liquidity risk to ensure that sufficient resources are available for both short-term working capital and longer term strategic
requirements. This is achieved through an appropriate mix of long and short-term borrowings and, as far as possible, the major part of the Group’s
total borrowings are managed so that they are drawn down using committed debt facilities which would not mature for at least one year. The
Group’s principal loan facilities are raised and managed centrally but are supplemented by local overdraft and working capital facilities. Committed
debt facilities principally comprise bank loans and private placements.
The Group regularly monitors expected cash flows against availability of financing. Regular updating of business forecasts, including cash flows, is
a process embedded into the Group’s internal financial reporting routines. Forecasts are initially carried out at individual business unit level but are
consolidated and reviewed by Group management. The availability of financing, headroom over existing facilities and forward compliance with
financial covenants are monitored against expected cash flows. The process takes into account the shorter term liquidity needs of individual
business units or territories, as well as the availability of funding to fulfil longer term strategic objectives such as major capital expenditure or
business acquisitions.
The maturity profile of non-derivative financial liabilities is as follows:
31 August 2009Trade and other payables (excluding statutory liabilities)
Bank overdrafts
Bank loans
Other loans
Finance leases
31 August 2008Trade and other payables (excluding statutory liabilities)
Bank loans
Other loans
Finance leases
The above analysis includes both principal and interest amounts.
78.70.1
139.594.40.1
312.8
97.891.291.80.1
280.9
---
65.0-
65.0
--
61.6-
61.6
Total£m
More thanfive years
£m
--
111.221.5
-
132.7
-77.523.3
-
100.8
Betweenone and
five years£m
78.70.128.37.90.1
115.1
97.813.76.90.1
118.5
Less thanone year
£m

F e n n e r p l c 6 1
The maturity profile of derivative financial assets/(liabilities) is as follows:
31 August 2009Forward foreign currency contracts and options
-outflow
-inflow
Currency swaps
-outflow
-inflow
Interest rate swaps
-outflow
-inflow
31 August 2008Forward foreign currency contracts and options
-outflow
-inflow
Currency swaps
-outflow
-inflow
Interest rate swaps
-outflow
-inflow
The above analyses for non-derivative and derivative financial liabilities show the contractual undiscounted cash flows based on the earliest date
that the Group may be required to settle the liability.
Credit riskCredit risk principally arises on short-term deposits, derivative financial instruments and trade receivables.
The credit risk arising on short-term deposits and derivative financial instruments is managed through the use of counterparties with high credit
ratings assigned by international credit rating agencies.
The Group only trades with recognised, creditworthy third parties. It is the Group's policy that all customers who wish to take on credit terms are
subject to credit verification procedures. Receivable balances are monitored on an ongoing basis and the Group's exposure to bad debts is not
significant. The credit risk arising on trade receivables is spread across a large number of customers and across many countries. There are no
significant concentrations of credit risk.
The Group's maximum exposure to credit risk is equal to the carrying value of these instruments.
An analysis showing the ageing of trade receivables not impaired is given in note 17.
(19.0)18.5
(0.5)
(24.6)24.4
(0.2)
(3.2)0.2
(3.0)
(20.3)19.7
(0.6)
(23.5)22.8
(0.7)
(3.8)1.9
(1.9)
--
-
(20.2)19.6
(0.6)
--
-
--
-
(19.4)18.4
(1.0)
--
-
Total£m
More thanfive years
£m
(0.4)0.4
-
(3.5)3.8
0.3
(1.8)0.1
(1.7)
(1.6)1.6
-
(3.3)3.5
0.2
(2.6)1.3
(1.3)
Betweenone and
five years£m
(18.6)18.1
(0.5)
(0.9)1.0
0.1
(1.4)0.1
(1.3)
(18.7)18.1
(0.6)
(0.8)0.9
0.1
(1.2)0.6
(0.6)
Less thanone year
£m
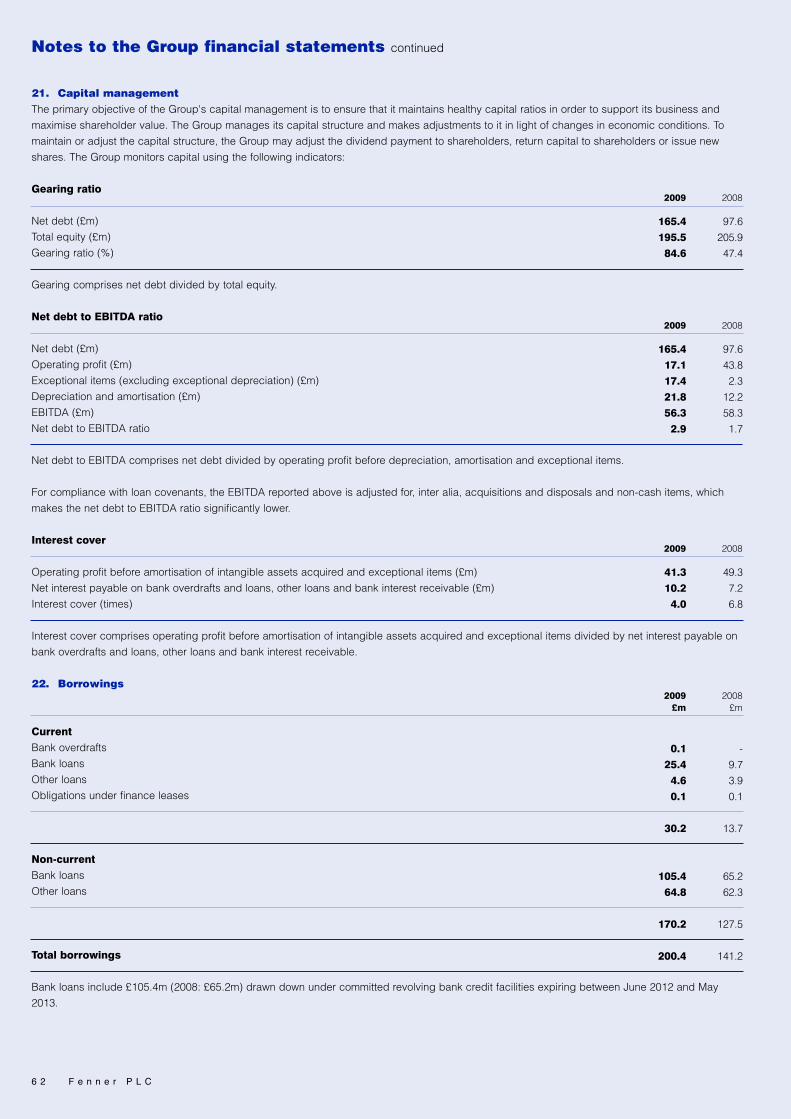
6 2 F e n n e r p l c
Notes to the Group financial statements continued
21. Capital managementThe primary objective of the Group's capital management is to ensure that it maintains healthy capital ratios in order to support its business and
maximise shareholder value. The Group manages its capital structure and makes adjustments to it in light of changes in economic conditions. To
maintain or adjust the capital structure, the Group may adjust the dividend payment to shareholders, return capital to shareholders or issue new
shares. The Group monitors capital using the following indicators:
Gearing ratio
Net debt (£m)
Total equity (£m)
Gearing ratio (%)
Gearing comprises net debt divided by total equity.
Net debt to EBITDA ratio
Net debt (£m)
Operating profit (£m)
Exceptional items (excluding exceptional depreciation) (£m)
Depreciation and amortisation (£m)
EBITDA (£m)
Net debt to EBITDA ratio
Net debt to EBITDA comprises net debt divided by operating profit before depreciation, amortisation and exceptional items.
For compliance with loan covenants, the EBITDA reported above is adjusted for, inter alia, acquisitions and disposals and non-cash items, which
makes the net debt to EBITDA ratio significantly lower.
Interest cover
Operating profit before amortisation of intangible assets acquired and exceptional items (£m)
Net interest payable on bank overdrafts and loans, other loans and bank interest receivable (£m)
Interest cover (times)
Interest cover comprises operating profit before amortisation of intangible assets acquired and exceptional items divided by net interest payable on
bank overdrafts and loans, other loans and bank interest receivable.
22. Borrowings
CurrentBank overdrafts
Bank loans
Other loans
Obligations under finance leases
Non-currentBank loans
Other loans
Total borrowings
Bank loans include £105.4m (2008: £65.2m) drawn down under committed revolving bank credit facilities expiring between June 2012 and May
2013.
97.6205.947.4
165.4195.584.6
20082009
97.643.82.3
12.258.31.7
165.417.117.421.856.32.9
20082009
49.37.26.8
41.310.24.0
20082009
-9.73.90.1
13.7
65.262.3
127.5
141.2
0.125.44.60.1
30.2
105.464.8
170.2
200.4
2008£m
2009£m

F e n n e r p l c 6 3
$20.4m (2008: $27.2m) of Senior Notes bear interest at 7.29% per annum, with an amount of $6.8m repayable annually on 1 June each year until 2012.
$90.0m (2008: $90.0m) of Senior Notes bear interest at 5.78% per annum and are repayable on 1 June 2017. $27.2m (£16.7m) of this amount has
been swapped into Euros. This results in an underlying Euro borrowing of €20.0m (£17.5m) at a fixed interest rate of 5.05%. The swap matures on
1 June 2017 when the private placement is repayable. Arrangement fees of £0.3m are being amortised over the life of the loan.
Bank balances are stated net where a legal right of offset exists.
The interest rate and currency profile of borrowings is as follows:
31 August 2009US dollar
Sterling
Euro
Australian dollar
Other currencies
31 August 2008US dollar
Euro
Australian dollar
Other currencies
The fixed rate borrowings principally relate to the US dollar private placements detailed above and $40.0m of bank borrowings, where the floating
rate has been swapped to fixed rate using an interest rate swap. This is detailed in note 23. The interest rates on floating rate borrowings are
principally linked to LIBOR or similar local currency rates .
The carrying amount and fair value of borrowings is as follows:
Current borrowings
Non-current borrowings
The fair value of fixed rate borrowings represents the value of replacing the existing fixed rate liabilities at the balance sheet date with borrowings
with similar terms to the remaining life of the loans. The fair value of all other floating rate borrowings approximates to their carrying amounts where
rates are reset to market rates at intervals of less than one year.
At 31 August 2009, the Group had available £12.4m (2008: £51.3m) of undrawn committed borrowing facilities which expire between June 2012
and May 2013.
Current borrowings of £0.9m (2008: £0.1m) and non-current borrowings of £0.5m (2008: £0.7m) are secured on specific freehold property or trade
receivables.
13.7125.2
138.9
13.7127.5
141.2
Fair value
£m
Carryingamount
£m
30.3171.9
202.2
30.2170.2
200.4
Fair value£m
Carryingamount
£m
2009 2008
79.642.319.750.08.8
200.4
81.419.229.511.1
141.2
75.4-
17.5--
92.9
71.216.1
--
87.3
Total£m
Fixedrate£m
4.242.32.250.08.8
107.5
10.23.1
29.511.1
53.9
Floatingrate£m

6 4 F e n n e r p l c
23. Derivative financial instruments
Forward foreign currency contracts and options
Currency swaps
Interest rate swaps
The fair value of derivative financial instruments is equal to the carrying value. The fair value of forward foreign currency contracts represents the gain or
loss resulting from translation of the contracts using forward rates at the balance sheet date compared to actual contract rates. The fair value of interest
rate swaps, currency swaps and forward foreign currency options represents the market value of a comparable instrument at the balance sheet date.
Forward foreign currency contracts and optionsThe gain on forward foreign currency contracts and options of £0.1m (2008: loss of £1.0m) has been recognised in the income statement.
Currency swapsThe currency swap is in respect of US dollars that have been swapped into Euros, as detailed in note 22. The post-tax loss of £0.5m (2008: £0.2m)
is recognised in the hedging reserve in shareholders' equity.
Interest rate swapsThe interest on US bank loans of $40.0m has been fixed by means of a US dollar denominated interest rate swap at an effective rate of 6.57%
(including variable bank margin) and designated as a hedge. The post-tax loss of £0.7m (2008: £0.6m) is recognised in the hedging reserve in
shareholders’ equity.
Hedge of net investments in foreign currenciesGroup financial instruments denominated in Euros of £8.8m (2008: £8.1m) and Australian dollars of £5.7m (2008: £5.2m) are designated as hedges
of the net investment in overseas subsidiaries. The loss on translation to sterling at the year end of £1.2m (2008: £1.4m) is recognised in the
hedging reserve in shareholders’ equity.
24. Trade and other payables
CurrentTrade payables
Other taxes and social security
Other payables
Accruals and deferred income
Non-currentAccruals and deferred income
Trade and other payables are non-interest bearing. There is no material difference between the carrying amount and fair value of trade and other payables.
25. Post-retirement benefitsThe Group operates a number of defined benefit post-retirement schemes for qualifying employees in operations around the world. The assets of
the schemes are held in separate trustee-administered funds. The cost of the schemes are assessed in accordance with the advice of independent
qualified actuaries using the projected unit method.
The principal scheme is the Fenner Pension Scheme which is based in the UK. The most recent triennial valuation of the Fenner Pension Scheme
was carried out as at 31 March 2008. The actuarial valuations for all schemes were updated as at 31 August 2009 by independent qualified
actuaries.
(0.8)(0.3)(1.5)
(2.6)
(0.7)(0.9)(2.5)
(4.1)
2008£m
2009£m
(0.8)(0.3)(1.5)
(2.6)
2008£m
2009£m
2009£m
2008£m
Assets Liabilities Net
(0.7)(0.9)(2.5)
(4.1)
---
-
---
-
61.42.59.0
26.9
99.8
0.5
43.92.811.723.1
81.5
-
2008£m
2009£m
Notes to the Group financial statements continued
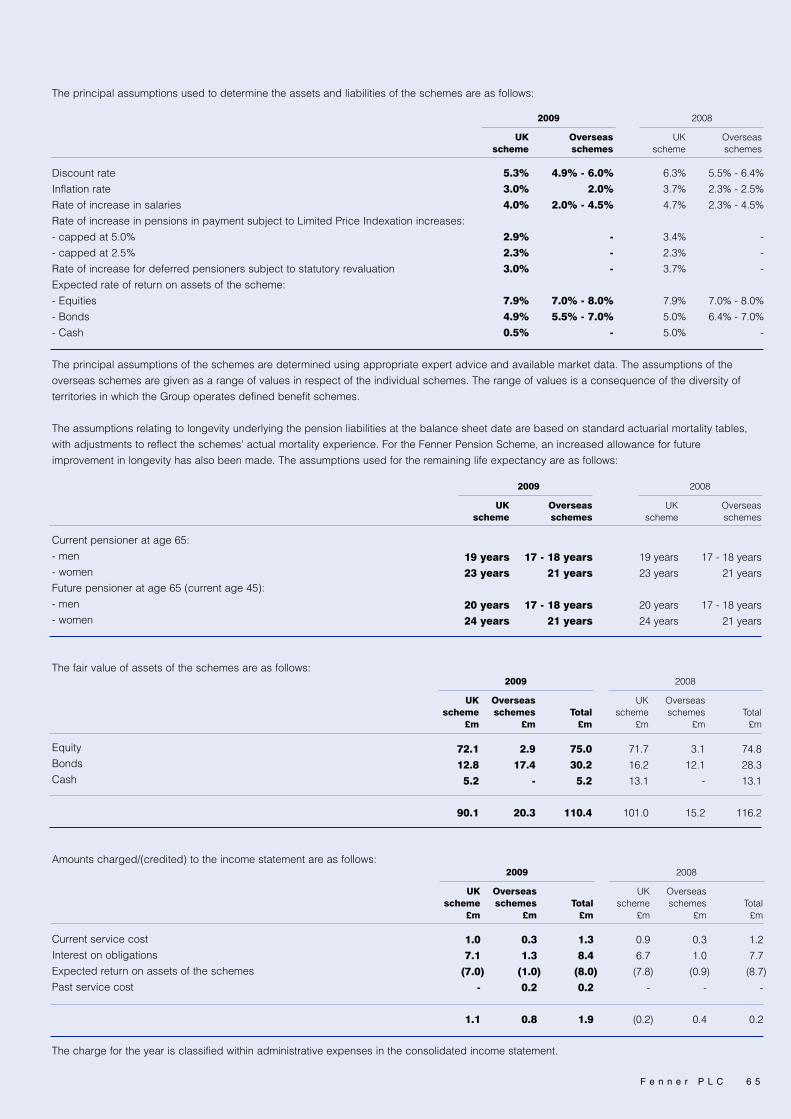
F e n n e r p l c 6 5
The principal assumptions used to determine the assets and liabilities of the schemes are as follows:
Discount rate
Inflation rate
Rate of increase in salaries
Rate of increase in pensions in payment subject to Limited Price Indexation increases:
- capped at 5.0%
- capped at 2.5%
Rate of increase for deferred pensioners subject to statutory revaluation
Expected rate of return on assets of the scheme:
- Equities
- Bonds
- Cash
The principal assumptions of the schemes are determined using appropriate expert advice and available market data. The assumptions of the
overseas schemes are given as a range of values in respect of the individual schemes. The range of values is a consequence of the diversity of
territories in which the Group operates defined benefit schemes.
The assumptions relating to longevity underlying the pension liabilities at the balance sheet date are based on standard actuarial mortality tables,
with adjustments to reflect the schemes' actual mortality experience. For the Fenner Pension Scheme, an increased allowance for future
improvement in longevity has also been made. The assumptions used for the remaining life expectancy are as follows:
Current pensioner at age 65:
- men
- women
Future pensioner at age 65 (current age 45):
- men
- women
The fair value of assets of the schemes are as follows:
Equity
Bonds
Cash
Amounts charged/(credited) to the income statement are as follows:
Current service cost
Interest on obligations
Expected return on assets of the schemes
Past service cost
The charge for the year is classified within administrative expenses in the consolidated income statement.
5.5% - 6.4%2.3% - 2.5%2.3% - 4.5%
---
7.0% - 8.0%6.4% - 7.0%
-
6.3%3.7%4.7%
3.4%2.3%3.7%
7.9%5.0%5.0%
5.3%3.0%4.0%
2.9%2.3%3.0%
7.9%4.9%0.5%
Overseasschemes
UKscheme
4.9% - 6.0%2.0%
2.0% - 4.5%
---
7.0% - 8.0%5.5% - 7.0%
-
Overseasschemes
UKscheme
2009 2008
74.828.313.1
116.2
3.112.1
-
15.2
75.030.25.2
110.4
Total£m
Overseasschemes
£m
71.716.213.1
101.0
UKscheme
£mTotal£m
72.112.85.2
90.1
2.917.4
-
20.3
Overseasschemes
£m
UKscheme
£m
2009 2008
17 - 18 years21 years
17 - 18 years21 years
19 years23 years
20 years24 years
19 years23 years
20 years24 years
Overseasschemes
UKscheme
17 - 18 years21 years
17 - 18 years21 years
Overseasschemes
UKscheme
2009 2008
1.27.7(8.7)
-
0.2
0.31.0(0.9)
-
0.4
Total£m
Overseasschemes
£m
0.96.7(7.8)
-
(0.2)
UKscheme
£m
2008
1.38.4(8.0)0.2
1.9
Total£m
1.07.1(7.0)-
1.1
0.31.3(1.0)0.2
0.8
Overseasschemes
£m
UKscheme
£m
2009
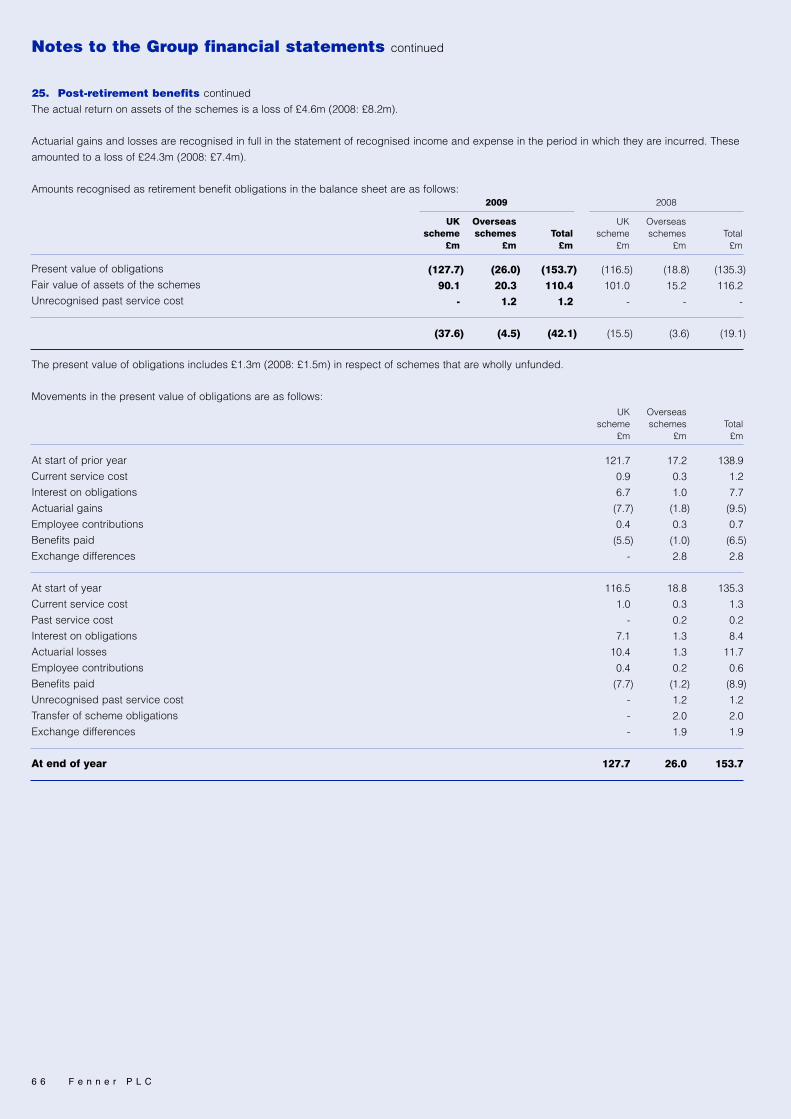
Notes to the Group financial statements continued
6 6 F e n n e r p l c
25. Post-retirement benefits continued
The actual return on assets of the schemes is a loss of £4.6m (2008: £8.2m).
Actuarial gains and losses are recognised in full in the statement of recognised income and expense in the period in which they are incurred. These
amounted to a loss of £24.3m (2008: £7.4m).
Amounts recognised as retirement benefit obligations in the balance sheet are as follows:
Present value of obligations
Fair value of assets of the schemes
Unrecognised past service cost
The present value of obligations includes £1.3m (2008: £1.5m) in respect of schemes that are wholly unfunded.
Movements in the present value of obligations are as follows:
At start of prior year
Current service cost
Interest on obligations
Actuarial gains
Employee contributions
Benefits paid
Exchange differences
At start of year
Current service cost
Past service cost
Interest on obligations
Actuarial losses
Employee contributions
Benefits paid
Unrecognised past service cost
Transfer of scheme obligations
Exchange differences
At end of year
(135.3)116.2
-
(19.1)
(18.8)15.2
-
(3.6)
(153.7)110.41.2
(42.1)
Total£m
Overseasschemes
£m
(116.5)101.0
-
(15.5)
UKscheme
£mTotal£m
(127.7)90.1
-
(37.6)
(26.0)20.31.2
(4.5)
Overseasschemes
£m
UKscheme
£m
2009 2008
138.91.27.7(9.5)0.7(6.5)2.8
135.31.30.28.4
11.70.6(8.9)1.22.01.9
153.7
17.20.31.0(1.8)0.3(1.0)2.8
18.80.30.21.31.30.2(1.2)1.22.01.9
26.0
Total£m
Overseasschemes
£m
121.70.96.7(7.7)0.4(5.5)
-
116.51.0-
7.110.40.4(7.7)
---
127.7
UKscheme
£m

F e n n e r p l c 6 7
Movements in the fair value of assets of the schemes are as follows:
At start of prior year
Expected return on assets of the schemes
Actuarial losses
Employer contributions
Employee contributions
Benefits paid
Exchange differences
At start of year
Expected return on assets of the schemes
Actuarial (losses)/gains
Employer contributions
Employee contributions
Benefits paid
Transfer of assets of the schemes
Exchange differences
At end of year
The transfer of scheme obligations and assets of the schemes relate to changes to pension arrangements in the Netherlands during the year. The
net amount was previously classified within accruals and deferred income.
Experience adjustments are as follows:
Present value of obligations
Fair value of assets of the schemes
Unrecognised past service cost
Deficit in the schemes
Experience (losses)/gains on liabilities of the schemes
Experience (losses)/gains on assets of the schemes
The Group expects to contribute approximately £5.0m to its defined benefit schemes in the year ending 31 August 2010.
26. Share-based paymentsThe Group operates three equity-settled share-based payment schemes and two cash-settled schemes. The recognition and measurement
principles of IFRS 2 have not been applied to equity instruments that were granted on or prior to 7 November 2002 that had not vested by
1 January 2005, in accordance with the transitional provisions of IFRS 1.
a) Fenner PLC 1996 Executive Share Option SchemeShare options were granted to certain employees within the Group. The exercise price of options granted is set at the market price of the shares on
the date of the grant. The vesting period is generally 3 years. If the options remain unexercised after a period of 10 years from the date of the grant
the options expire. Options can only be exercised upon satisfaction of performance criteria. This requires that the overall growth of the Group’s
earnings per share before amortisation of intangible assets acquired and exceptional items over a consecutive three year period exceeds the
growth in the UK Retail Price Index over the same period by at least 9%. The last grant of shares under the Executive Share Option Scheme was
made in November 2004.
124.88.7
(16.9)2.90.7(6.5)2.5
116.28.0
(12.6)4.30.6(8.9)1.21.6
110.4
16.20.9(4.7)1.00.3(1.0)2.5
15.21.01.21.10.2(1.2)1.21.6
20.3
Total£m
Overseasschemes
£m
108.67.8
(12.2)1.90.4(5.5)
-
101.07.0
(13.8)3.20.4(7.7)
--
90.1
UKscheme
£m
(146.3)105.7
-
(40.6)
(0.3)11.4
2005£m
(146.9)117.8
-
(29.1)
1.56.0
2006£m
(138.9)124.8
-
(14.1)
(0.7)1.1
2007£m
(135.3)116.2
-
(19.1)
3.6(16.9)
2008£m
(153.7)110.41.2
(42.1)
(1.1)(12.6)
2009£m

Notes to the Group financial statements continued
6 8 F e n n e r p l c
26. Share-based payments continued
Details of movements in outstanding share options are as follows:
At start of prior year
Forfeited during the year
Exercised during the year
At start of year
Forfeited during the year
At end of year
At 31 August 2009, 20,406 (2008: 51,015) options were exercisable.
The following share options were outstanding at 31 August 2009:
Dates exercisable
2007 to 2014
The weighted average contractual life of outstanding share options at 31 August 2009 is 5.2 years.
The above information includes share options granted before 7 November 2002.
The fair value of awards made under the Executive Share Option Scheme is measured using the Binomial option-pricing model. The following
assumptions were used for each set of outstanding options granted after 7 November 2002:
Share price at date of grant
Fair value of options granted
Exercise price
Expected volatility
Expected life
Risk free rate
Expected dividend yield
Expected volatility is determined by reference to the historical volatility of the Company’s share price for a six year period prior to the grant date.
b) Long Term Share Incentive Plan Provisional allocations of shares were made to certain employees within the Group. The provisional allocation was made to each employee at the
start of a three year plan cycle and was based on a percentage of the basic annual salary of each employee. The awards are subject to the
satisfaction of performance criteria. The proportion of the provisional allocation of shares that is awarded is based on the Group’s Total Shareholder
Return ("TSR") over the plan cycle compared to the TSR of the comparator group. The last provisional allocation of shares under the Long Term
Share Incentive Plan was made in November 2005.
131.8
123.5
146.3
99.483.3
123.5
229,162
(40,812)
(137,335)
51,015(30,609)
20,406
Weightedaverage
exercise pricepence
Optionsnumber
123.4920,406
Option pricepence
Optionsnumber
130.5p
28p
123.5p
27%
6 years
4.6%
4.5%
15 November2004
Grant date
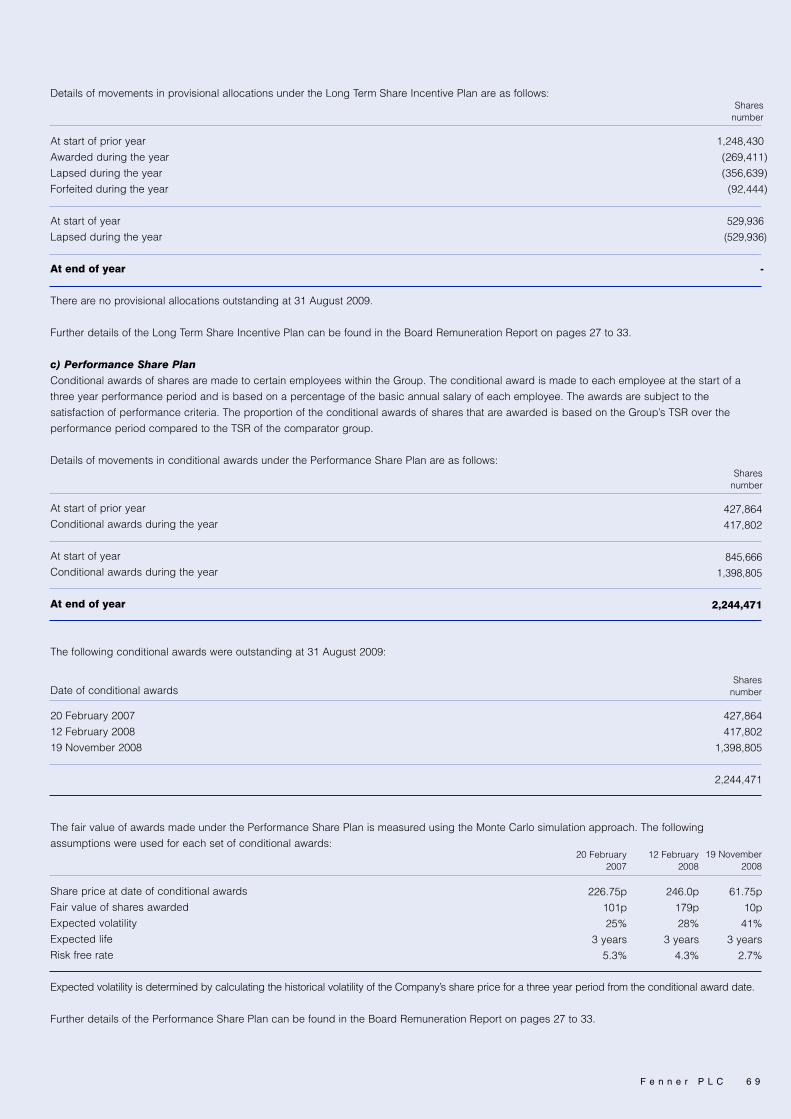
F e n n e r p l c 6 9
Details of movements in provisional allocations under the Long Term Share Incentive Plan are as follows:
At start of prior year
Awarded during the year
Lapsed during the year
Forfeited during the year
At start of year
Lapsed during the year
At end of year
There are no provisional allocations outstanding at 31 August 2009.
Further details of the Long Term Share Incentive Plan can be found in the Board Remuneration Report on pages 27 to 33.
c) Performance Share PlanConditional awards of shares are made to certain employees within the Group. The conditional award is made to each employee at the start of a
three year performance period and is based on a percentage of the basic annual salary of each employee. The awards are subject to the
satisfaction of performance criteria. The proportion of the conditional awards of shares that are awarded is based on the Group’s TSR over the
performance period compared to the TSR of the comparator group.
Details of movements in conditional awards under the Performance Share Plan are as follows:
At start of prior year
Conditional awards during the year
At start of year
Conditional awards during the year
At end of year
The following conditional awards were outstanding at 31 August 2009:
Date of conditional awards
20 February 2007
12 February 2008
19 November 2008
The fair value of awards made under the Performance Share Plan is measured using the Monte Carlo simulation approach. The following
assumptions were used for each set of conditional awards:
Share price at date of conditional awards
Fair value of shares awarded
Expected volatility
Expected life
Risk free rate
Expected volatility is determined by calculating the historical volatility of the Company’s share price for a three year period from the conditional award date.
Further details of the Performance Share Plan can be found in the Board Remuneration Report on pages 27 to 33.
1,248,430
(269,411)
(356,639)
(92,444)
529,936(529,936)
-
Sharesnumber
427,864
417,802
845,6661,398,805
2,244,471
Sharesnumber
427,864
417,802
1,398,805
2,244,471
Sharesnumber
61.75p
10p
41%
3 years
2.7%
246.0p
179p
28%
3 years
4.3%
19 November2008
12 February2008
226.75p
101p
25%
3 years
5.3%
20 February2007

Notes to the Group financial statements continued
7 0 F e n n e r p l c
26. Share-based payments continued
d) Long Term Shadow Incentive PlanProvisional allocations of notional shares were made to certain employees within the Group. The rules and performance criteria are the same as the
Long Term Share Incentive Plan above. Awards are settled in the form of cash. The last provisional allocation of notional shares under the Long
Term Shadow Incentive Plan was made in November 2005.
Details of movements in provisional allocations under the Long Term Shadow Incentive Plan are as follows:
At start of prior year
Forfeited during the year
At start of year
Forfeited during the year
Lapsed during the year
At end of year
The are no provisional allocations outstanding at 31 August 2009.
e) Shadow Performance Share PlanConditional awards of notional shares are made to certain employees within the Group. The rules and performance criteria are the same as the
Performance Share Plan above. Awards are settled in the form of cash.
Details of movements in conditional awards under the Shadow Performance Share Plan are as follows:
At start of prior year
Conditional awards during the year
Forfeited during the year
At start of year
Conditional awards during the year
At end of year
The following conditional awards were outstanding at 31 August 2009:
Date of conditional awards
20 February 2007
12 February 2008
19 November 2008
The fair value of awards made under the Shadow Performance Share Plan is measured using the Monte Carlo simulation approach. The following
assumptions were used for each set of conditional awards of notional shares:
Share price at valuation date
Fair value of shares awarded
Expected volatility
Expected life
Risk free rate
232,000
(8,000)
224,000(8,000)
(216,000)
-
Notionalshares
number
319,000
330,000
(24,000)
625,000378,000
1,003,000
Notionalshares
number
303,000
322,000
378,000
1,003,000
Notionalshares
number
121.0p
44p
65%
3 years
1.3%
121.0p
48p
81%
3 years
0.6%
19 November2008
12 February2008
121.0p
3p
95%
3 years
0.4%
20 February2007

F e n n e r p l c 7 1
Expected volatility is determined by calculating the historical volatility of the Company’s share price for periods equal to the remaining lives of the
awards.
Liabilities included within trade and other payables in the balance sheet amounted to £nil (2008: £0.2m) in respect of the Long Term Shadow
Incentive Plan and £0.1m (2008: £0.3m) in respect of the Shadow Performance Share Plan. There are no liabilities in the balance sheet in respect of
the Fenner PLC 1996 Executive Share Option Scheme, the Long Term Share Incentive Plan or the Performance Share Plan.
27. ProvisionsMovements in provisions are as follows:
At start of year
New provisions charged to income statement during the year
Provisions not required credited to income statement during the year
Acquisition of businesses
Provisions utilised during the year
Unwinding of discount
Exchange differences
At end of year
Provisions are analysed as follows:
Current
Non-current
Provisions represent the best estimate of obligations at the balance sheet date. The property and environmental provision principally relates to
onerous leases. Where the effect of the time value of money is material, pre-tax discount rates of 1.9% in respect of property and environment and
3.2% to 5.5% in respect of contingent and deferred consideration on acquisitions have been used. These reflect the risks associated with future
cash flows. All provisions are expected to be utilised within 10 years.
28. Share capital
At start of prior year
Shares authorised/issued in the year
At start of year and at end of year
The Company has one class of ordinary shares which carry no right to fixed income.
16.02.2(0.1)17.2(5.8)1.33.4
34.2
8.9--
17.2(3.1)1.13.1
27.2
Total£m
Contingent and deferredconsideration
on acquisitions£m
5.01.2(0.1)
-(0.5)0.2-
5.8
Property and environmental
£m
2.11.0--
(2.2)-
0.3
1.2
Restructuringcosts
£m
39.6
4.1
43.7
158,523,043
16,246,986
174,770,029
£mNumber
55.0
-
55.0
£m
220,000,000
-
220,000,000
Number
AuthorisedAllotted, called up
and fully paid
17.017.2
34.2
4.911.1
16.0
2008£m
2009£m

Notes to the Group financial statements continued
7 2 F e n n e r p l c
29. Equity
At start of prior year
Total recognised income and expense for the year
Equity dividends paid
Dividends paid to minority shareholders
Shares issued in the year
Share-based payments
At start of year
Total recognised income and expense for the year
Equity dividends paid
Dividends paid to minority shareholders
Share-based payments
Acquisition of businesses
At end of year
Included within retained earnings is a reserve for the Company’s own shares held by the Employee Share Ownership Plan Trust (“ESOP”) of £0.1m
(2008: £0.1m). The shares held by the ESOP may subsequently be awarded to employees under the Group’s share incentives schemes. At
31 August 2009, the ESOP held 114,177 (2008: 114,177) of the Company’s shares.
The exchange reserve comprises foreign exchange differences arising from the translation of the financial statements of foreign operations.
The hedging reserve comprises gains and losses on changes in the valuation of assets and liabilities designated as hedges.
The other reserve relates to merger relief on the issue of shares in connection with the acquisition of Wellington Holdings plc on 20 May 2005.
Distributable reserves relate to amounts in the retained earnings reserve to the extent that profits are realised.
30. Contingent liabilities In the normal course of business the Group has given guarantees and counter indemnities in respect of commercial transactions.
The Group is involved as defendant in a number of potential and actual litigation cases in connection with its business, primarily in North America.
The directors believe that the likelihood of a material liability arising from these cases is remote.
31. Operating lease commitmentsOutstanding commitments for future minimum lease payments under non-cancellable operating leases fall due as follows:
Within one year
In the second to fifth years inclusive
After five years
Operating lease charges recognised in the income statement are shown in note 5.
1.82.2-
4.0
2.12.4-
4.5
2008£m
2009£m
3.110.127.6
40.8
4.312.226.8
43.3
2008£m
2009£m
OtherLand and Buildings
142.7
36.8
(9.9)
(0.1)
36.1
0.3
205.90.7
(11.5)(0.1)0.40.1
195.5
0.8
0.3
-
(0.1)
-
-
1.00.3-
(0.1)-
0.1
1.3
Totalequity
£m
Minorityinterests
£m
1.1
-
-
-
-
-
1.1-----
1.1
Otherreserve
£m
0.4
(2.2)
-
-
-
-
(1.8)(2.4)
----
(4.2)
Hedgingreserve
£m
(4.9)
18.9
-
-
-
-
14.016.0
----
30.0
Exchangereserve
£m
54.0
19.8
(9.9)
-
(0.2)
0.3
64.0(13.2)(11.5)
-0.4-
39.7
Retainedearnings
£m
51.7
-
-
-
32.2
-
83.9-----
83.9
Sharepremium
£m
39.6
-
-
-
4.1
-
43.7-----
43.7
Sharecapital
£m
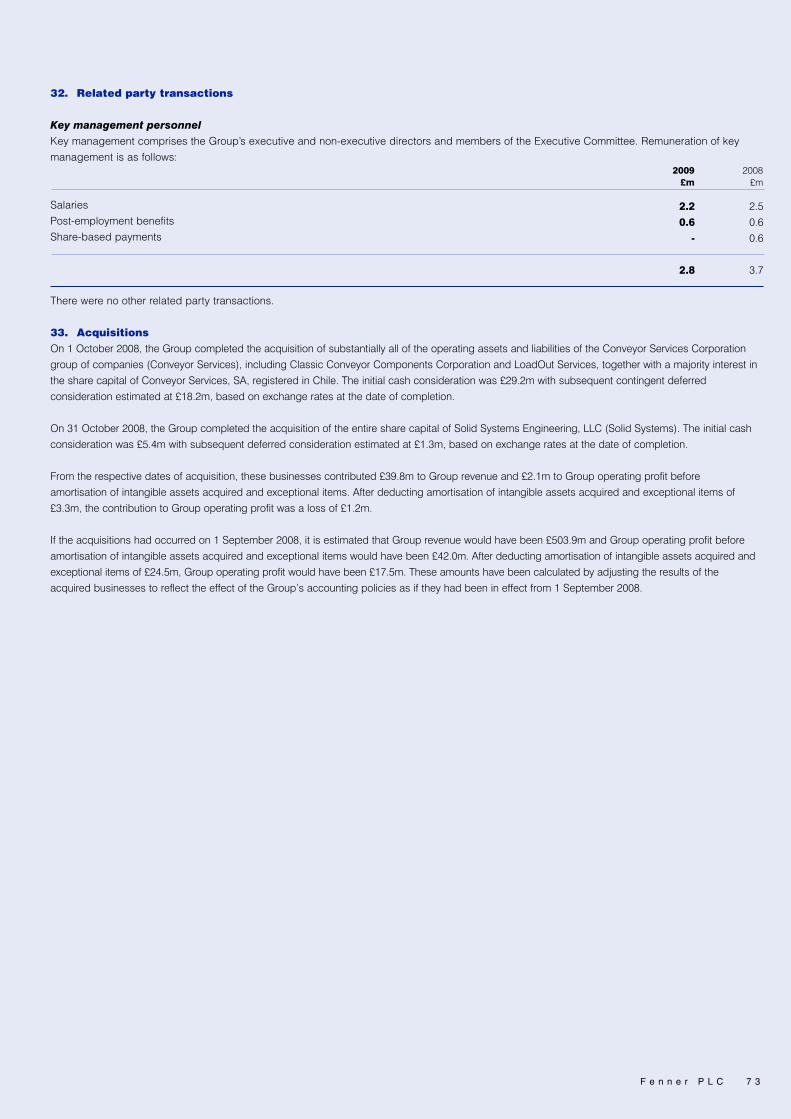
F e n n e r p l c 7 3
32. Related party transactions
Key management personnelKey management comprises the Group’s executive and non-executive directors and members of the Executive Committee. Remuneration of key
management is as follows:
Salaries
Post-employment benefits
Share-based payments
There were no other related party transactions.
33. AcquisitionsOn 1 October 2008, the Group completed the acquisition of substantially all of the operating assets and liabilities of the Conveyor Services Corporationgroup of companies (Conveyor Services), including Classic Conveyor Components Corporation and LoadOut Services, together with a majority interest inthe share capital of Conveyor Services, SA, registered in Chile. The initial cash consideration was £29.2m with subsequent contingent deferredconsideration estimated at £18.2m, based on exchange rates at the date of completion.
On 31 October 2008, the Group completed the acquisition of the entire share capital of Solid Systems Engineering, LLC (Solid Systems). The initial cashconsideration was £5.4m with subsequent deferred consideration estimated at £1.3m, based on exchange rates at the date of completion.
From the respective dates of acquisition, these businesses contributed £39.8m to Group revenue and £2.1m to Group operating profit beforeamortisation of intangible assets acquired and exceptional items. After deducting amortisation of intangible assets acquired and exceptional items of£3.3m, the contribution to Group operating profit was a loss of £1.2m.
If the acquisitions had occurred on 1 September 2008, it is estimated that Group revenue would have been £503.9m and Group operating profit beforeamortisation of intangible assets acquired and exceptional items would have been £42.0m. After deducting amortisation of intangible assets acquired andexceptional items of £24.5m, Group operating profit would have been £17.5m. These amounts have been calculated by adjusting the results of theacquired businesses to reflect the effect of the Group’s accounting policies as if they had been in effect from 1 September 2008.
2.20.6-
2.8
2.50.60.6
3.7
2008£m
2009£m

Notes to the Group financial statements continued
33. Acquisitions continued
Details of the provisional aggregate assets and liabilities acquired, based on exchange rates at the dates of completion, are given below.
2009
Intangible assets acquired
Property, plant and equipment
Inventories
Cash and short-term deposits
Trade and other receivables
Trade and other payables
Total net assets acquired
Goodwill on acquisition
Minority interest on acquisition
Total consideration
Contingent and deferred consideration held as provisions
Contingent and deferred consideration paid
Cash consideration paid
Cash and short-term deposits acquired
Net cash consideration paid per cash flow statement
Cash consideration paid includes acquisition expenses of £0.7m in respect of Conveyor Services.
Fair value adjustments comprise the valuation of intangible assets acquired of £31.0m and the provisional restatement of assets and liabilities in
accordance with the Group’s accounting policies of £0.2m. Fair value amounts are provisional as the review process is ongoing.
The adjustment to goodwill on prior year acquisitions is due to the re-assessment of the estimated amounts payable as contingent deferred
consideration.
Goodwill arising on acquisition principally represents the workforce and anticipated synergies gained through the acquisitions.
7 4 F e n n e r p l c
31.03.22.30.1
11.0(4.8)
42.89.1(0.1)
51.8(17.2)3.1
37.7(0.1)
37.6
------
-(2.3)
-
(2.3)2.32.2
2.2-
2.2
Provisional fair value
£m
TotalPrior year
acquisitionsSolid SystemsConveyor Services
Fairvalue
£m
3.60.50.10.10.6(0.3)
4.62.1-
6.7(1.3)
-
5.4(0.1)
5.3
3.6-----
3.6
Provisional fair value
£m
Fair valueadjustments
£m
-0.50.10.10.6(0.3)
1.0
27.42.72.2-
10.4(4.5)
38.29.3(0.1)
47.4(18.2)0.9
30.1-
30.1
Bookvalue
£m
Provisional fair value
£m
27.40.2----
27.6
-2.52.2-
10.4(4.5)
10.6
Fair valueadjustments
£m
Bookvalue
£m

F e n n e r p l c 7 5
2008
Intangible assets
Intangible assets acquired
Property, plant and equipment
Inventories
Cash and short-term deposits
Trade and other receivables
Trade and other payables
Current taxation
Deferred taxation
Total net assets acquired
Goodwill on acquisition
Total consideration
Contingent and deferred consideration held as provisions
Share capital issued
Cash and consideration paid
Cash and short-term deposits acquired
Net cash consideration paid per cash flow statement
Cash consideration paid includes acquisition expenses of £1.0m in respect of Prodesco and £0.7m in respect of other acquisitions in the year.
Fair value adjustments comprise the valuation of intangible assets acquired of £30.4m, the restatement of assets and liabilities in accordance with
the Group’s accounting policies of £(2.4)m and deferred taxation on these adjustments of £0.2m.
Goodwill arising on acquisition principally represents the workforce and anticipated synergies gained through the acquisitions.
Other acquisitions in the year have been presented in aggregate because the individual acquisitions are not material.
-30.43.63.80.25.0(2.1)(0.1)0.2
41.013.7
54.7(8.1)(0.5)
46.1(0.2)
45.9
Fair value
£m
TotalOther acquisitions in the yearProdesco
-9.60.72.30.13.3(1.1)(0.1)0.1
14.97.3
22.2(0.7)(0.5)
21.0(0.1)
20.9
-9.6(0.1)(0.4)
--
(0.1)-
0.1
9.1
Fair value
£m
Fair valueadjustments
£m
--
0.82.70.13.3(1.0)(0.1)
-
5.8
-20.82.91.50.11.7(1.0)
-0.1
26.16.4
32.5(7.4)
-
25.1(0.1)
25.0
Bookvalue
£m
Fair value
£m
(1.6)20.8(0.1)(0.1)
----
0.1
19.1
1.6-
3.01.60.11.7(1.0)
--
7.0
Fair valueadjustments
£m
Bookvalue
£m

Notes to the Group financial statements continued
34. Principal subsidiary undertakingsThe principal subsidiary undertakings at 31 August 2009 were as follows:
Company
J H Fenner & Co Limited
Fenner International Limited
James Dawson & Son Limited
Hallite Seals International Limited
Hallite (France) Limited
FAST Group Houston, Inc
Hallite Seals Americas, Inc
Fenner, Inc
Prodesco, Inc
Secant Medical, LLC
Fenner Precision, Inc
Fenner Dunlop Conveyor Systems and Services, Inc
Fenner Dunlop Conveyor Services, LLC
Fenner Dunlop (Atlanta), Inc
Fenner Dunlop (Port Clinton), Inc
Fenner Dunlop (Toledo), LLC
Fenner Dunlop (Bracebridge), Inc
Hallite Seals (Canada) Limited
Conveyor Services, SA
Enerka Apex Belting Pty Limited
Fenner (Australia) Pty Limited
rEscan International Pty Limited
Hallite Seals Australia Pty Limited
Northern Belting Specialists Pty Ltd
Fenner Conveyor Belting (South Africa) (Pty) Limited
Shanghai Fenner Conveyor Belting Co. Limited
Dawson Polymer Products (Shanghai) Co. Limited
Fenner Sealing Technologies (Shanghai) Co. Limited
Dunlop Conveyor Belting (Shanghai) Co. Limited
Fenner Dunlop BV
Fenner Conveyor Belting Private Limited
Dichtelemente Hallite GmbH
Hallite Italia Srl
*Held directly by Fenner PLC
The above undertakings are engaged in manufacturing, distribution and servicing with the exception of Fenner International Limited which is an investment
company.
All subsidiary undertakings are consolidated within the Group financial statements.
A full list of Group companies is filed with the annual return to the Registrar of Companies.
35. Post balance sheet eventsOn 10 September 2009, the Group acquired certain business assets and liabilities of Belt Service Srl, based in Italy, for an initial consideration of
£0.2m with deferred amounts of £0.5m.
*100
*100
*100
*100
100
100
100
100
100
100
100
100
100
100
100
100
100
100
66
100
100
100
100
100
75
85
100
100
100
100
100
100
100
United Kingdom
United Kingdom
United Kingdom
United Kingdom
United Kingdom
USA
USA
USA
USA
USA
USA
USA
USA
USA
USA
USA
Canada
Canada
Chile
Australia
Australia
Australia
Australia
Australia
South Africa
China
China
China
China
Netherlands
India
Germany
Italy
Proportion of issuedordinary shares held
Country ofincorporation
7 6 F e n n e r p l c

F e n n e r p l c 7 7
Independent Auditors' Report to the members of Fenner PLC
We have audited the parent company financial statements of Fenner PLC for the year ended 31 August 2009 which comprise the Company balance
sheet and the related notes. The financial reporting framework that has been applied in their preparation is applicable law and United Kingdom
Accounting Standards (United Kingdom Generally Accepted Accounting Practice).
Respective responsibilities of directors and auditorsAs explained more fully in the Statement of directors’ responsibilities set out on pages 20 and 21, the directors are responsible for the preparation of
the parent company financial statements and for being satisfied that they give a true and fair view. Our responsibility is to audit the parent company
financial statements in accordance with applicable law and International Standards on Auditing (UK and Ireland). Those standards require us to
comply with the Auditing Practices Board’s Ethical Standards for Auditors.
This Report, including the opinions, has been prepared for and only for the Company’s members as a body in accordance with Sections 495 to 497
of the Companies Act 2006 and for no other purpose. We do not, in giving these opinions, accept or assume responsibility for any other purpose or
to any other person to whom this report is shown or into whose hands it may come save where expressly agreed by our prior consent in writing.
Scope of the audit of the financial statements An audit involves obtaining evidence about the amounts and disclosures in the financial statements sufficient to give reasonable assurance that the
financial statements are free from material misstatement, whether caused by fraud or error. This includes an assessment of: whether the accounting
policies are appropriate to the parent company’s circumstances and have been consistently applied and adequately disclosed; the reasonableness
of significant accounting estimates made by the directors; and the overall presentation of the financial statements.
Opinion on financial statements In our opinion the parent company financial statements:
- give a true and fair view of the state of the Company’s affairs as at 31 August 2009;
- have been properly prepared in accordance with United Kingdom Generally Accepted Accounting Practice; and
- have been prepared in accordance with the requirements of the Companies Act 2006.
Opinion on other matters prescribed by the Companies Act 2006 In our opinion:
- the part of the Board Remuneration Report to be audited has been properly prepared in accordance with the Companies Act 2006; and
- the information given in the Directors’ Report for the financial year for which the parent company financial statements are prepared is
consistent with the parent company financial statements.
Matters on which we are required to report by exception We have nothing to report in respect of the following matters where the Companies Act 2006 requires us to report to you if, in our opinion:
- adequate accounting records have not been kept by the parent company, or returns adequate for our audit have not been received from
branches not visited by us; or
- the parent company financial statements and the part of the Board Remuneration Report to be audited are not in agreement with the
accounting records and returns; or
- certain disclosures of directors’ remuneration specified by law are not made; or
- we have not received all the information and explanations we require for our audit.
Other matter We have reported separately on the Group financial statements of Fenner PLC for the year ended 31 August 2009.
Randal Casson
for and on behalf of PricewaterhouseCoopers LLP
Chartered Accountants and Statutory Auditors, Hull
11 November 2009

7 8 F e n n e r p l c
Company balance sheetat 31 August 2009
Fixed assetsTangible fixed assets
Investments
Current assetsDebtors
Cash at bank and in hand
Creditors: amounts falling due within one year
Net current assets
Total assets less current liabilitiesProvisions for liabilities
Net assets
Capital and reservesCalled up share capital
Share premium
Revaluation reserve
Other reserve
Profit and loss account
Shareholders' funds
The financial statements were approved by the Board of Directors on 11 November 2009 and signed on its behalf by:
C I Cooke R J Perry
Chairman Group Finance Director
3.977.1
81.0
105.013.2
118.2(13.9)
104.3
185.3(0.3)
185.0
43.783.91.4
11.544.5
185.0
4
5
6
7
8
9
10
10
10
10
11
3.877.1
80.9
111.97.5
119.4(13.4)
106.0
186.9(0.3)
186.6
43.783.91.311.546.2
186.6
2008£m
2009£mNotes

F e n n e r p l c 7 9
Notes to the Company financial statements
1. Significant accounting policies
Basis of preparationThe Company financial statements have been prepared in accordance with applicable accounting standards in the United Kingdom and under the
historical cost convention, as modified by the revaluation of certain fixed assets.
In accordance with the exemptions allowed by Section 408 of the Companies Act 2006, the Company has not presented its own profit and loss
account.
In accordance with the exemptions allowed by FRS 1 ‘Cash Flow Statements’, the Company has not presented a cash flow statement.
The Company has taken advantage of the exemptions in FRS 8 ‘Related Party Transactions’ not to disclose related party transactions with other
members of the Fenner PLC Group.
The principal accounting policies adopted for the year ended 31 August 2009, which have been consistently applied, are set out below.
Foreign currenciesTransactions in foreign currencies are recorded at the rates of exchange prevailing on the dates of the transactions. At each balance sheet date,
monetary assets and liabilities are retranslated at the rates prevailing on the balance sheet date. Non-monetary items measured at historical cost
are not retranslated. Exchange differences arising on the settlement and retranslation of monetary items are recognised in the profit and loss
account in the period.
Share-based paymentsThe Company operates equity-settled share schemes for certain employees across the Fenner PLC Group. The cost of share-based payments is
measured at fair value at the date of grant, excluding the effect of non market-based vesting conditions. The cost is recognised in the profit and
loss account on a straight-line basis over the vesting period with the corresponding amount credited to equity, based on an estimate of the number
of shares that will eventually vest. The fair values are measured using the Binomial option-pricing model and the Monte Carlo simulation approach.
TaxationTaxation expense represents the sum of the current tax payable and deferred tax.
Current tax is the tax expected to be payable on taxable profit for the period using tax rates that have been enacted or substantively enacted by the
balance sheet date, together with any adjustments in respect of previous years. Taxable profit differs from profit as reported in the profit and loss
account because it excludes items of income or expense that are not taxable or deductible or are taxable or deductible in other years.
Deferred tax is recognised in respect of all timing differences that have originated but not reversed at the balance sheet date. It is determined using
the average tax rates that are expected to apply in the periods in which the timing differences are expected to reverse. Timing differences are
differences between taxable profits and results as stated in the financial statements that arise from the inclusion of gains and losses in tax
assessments in periods different from those in which they are recognised in the financial statements. Deferred tax assets are recognised only when
it can be regarded as more likely than not that there will be suitable taxable profits from which the future reversal of the underlying timing differences
can be deducted. Deferred tax is not recognised when fixed assets are revalued unless by the balance sheet date there is a binding agreement to
sell the revalued asset. Deferred tax is measured on a non-discounted basis.
DividendsDividends proposed by the Board are recognised in the financial statements when they have been approved by shareholders at the Annual General
Meeting. Interim dividends are recognised when they are paid.

8 0 F e n n e r p l c
1. Significant accounting policies continued
Tangible fixed assetsTangible fixed assets are stated at cost or valuation less accumulated depreciation and any accumulated impairment losses. In prior years, certain
freehold and leasehold properties have been revalued by independent qualified professional valuers on the basis of open market value for their
existing use. As permitted by FRS 15 ‘Tangible Fixed Assets’, these valuations have been frozen.
Freehold land is not depreciated. Depreciation on other assets is recognised in the profit and loss account on a straight-line basis over the
estimated useful life of the asset. Estimated useful lives most widely applied are as follows:
Freehold buildings 40 years
InvestmentsInvestments are stated at cost or valuation less accumulated impairment losses.
ProvisionsProvisions are recognised when the Company has a present obligation as a result of a past event and it is probable that the Company will be
required to settle that obligation. Provisions are measured at the directors’ best estimate of the expenditure required to settle the obligation at the
balance sheet date and are discounted to present value where the effect is material.
2. Auditors’ remunerationThere was no auditors' remuneration in the year (2008: £nil) as their costs have been borne by other Group undertakings.
3. EmployeesThe average number of employees during the year is 3 (2008: 3). This comprises the Chairman and non-executive directors. Details of employee
costs are included in the Board Remuneration Report on pages 27 to 33.
4. Tangible fixed assets
Cost or valuation:At start of year and at end of year
Accumulated depreciation:At start of year
Charge for the year
At end of year
Net book value:At end of year
At start of year
Cost or valuation comprises:Cost
Valuation:
- 1997
- 1998
- 1999
The historical cost of tangible fixed assets is £4.4m (2008: £4.4m) with accumulated depreciation of £1.9m (2008: £1.9m).
Freehold property includes land at a cost or valuation of £1.7m (2008: £1.7m) which is not subject to depreciation.
5.1
1.20.1
1.3
3.8
3.9
1.0
0.4
1.2
2.5
5.1
Freeholdproperty
£m
Notes to the Company financial statements continued

F e n n e r p l c 8 1
5. Investments
Cost:At start of year
Disposals
At end of year
Accumulated impairment losses:At start of year
Disposals
At end of year
Net book value:At start of year and at end of year
Disposals principally relate to the dissolution of previously impaired subsidiary undertakings.
The carrying value of investments is reviewed annually. Forecast cash flows are discounted using the Group’s pre-tax weighted average cost of
capital of 8.5%. Cash flows are projected for one year using appropriate annual growth rates.
Details of the principal subsidiary undertakings can be found in note 34 to the Group financial statements.
6. Debtors
Amounts due from Group undertakings
Other debtors
7. Creditors: amounts falling due within one year
Amounts due to Group undertakings
Current taxation
Group relief
Accruals and deferred income
8. Provisions for liabilities
At start of year and at end of year
Deferred tax liabilities are all in respect of accelerated tax depreciation.
192.7(25.2)
167.5
115.6(25.2)
90.4
77.1
Subsidiaryundertakings
£m
104.70.3
105.0
111.70.2
111.9
2008£m
2009£m
12.00.70.80.4
13.9
12.00.70.40.3
13.4
2008£m
2009£m
0.3
Deferred taxation
£m
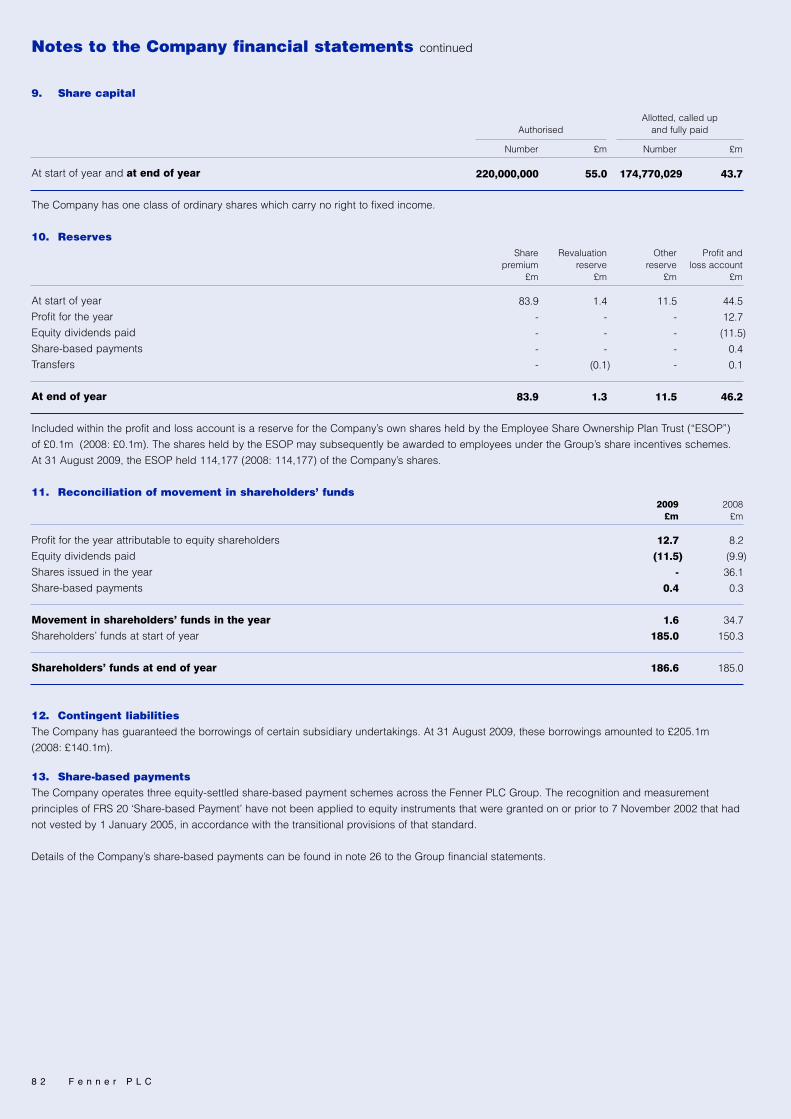
8 2 F e n n e r p l c
Notes to the Company financial statements continued
9. Share capital
At start of year and at end of year
The Company has one class of ordinary shares which carry no right to fixed income.
10. Reserves
At start of year
Profit for the year
Equity dividends paid
Share-based payments
Transfers
At end of year
Included within the profit and loss account is a reserve for the Company’s own shares held by the Employee Share Ownership Plan Trust (“ESOP”)
of £0.1m (2008: £0.1m). The shares held by the ESOP may subsequently be awarded to employees under the Group’s share incentives schemes.
At 31 August 2009, the ESOP held 114,177 (2008: 114,177) of the Company’s shares.
11. Reconciliation of movement in shareholders’ funds
Profit for the year attributable to equity shareholders
Equity dividends paid
Shares issued in the year
Share-based payments
Movement in shareholders’ funds in the yearShareholders’ funds at start of year
Shareholders’ funds at end of year
12. Contingent liabilitiesThe Company has guaranteed the borrowings of certain subsidiary undertakings. At 31 August 2009, these borrowings amounted to £205.1m
(2008: £140.1m).
13. Share-based payments The Company operates three equity-settled share-based payment schemes across the Fenner PLC Group. The recognition and measurement
principles of FRS 20 ‘Share-based Payment’ have not been applied to equity instruments that were granted on or prior to 7 November 2002 that had
not vested by 1 January 2005, in accordance with the transitional provisions of that standard.
Details of the Company’s share-based payments can be found in note 26 to the Group financial statements.
43.7
£m
174,770,029
Number
55.0
£m
220,000,000
Number
44.512.7(11.5)0.40.1
46.2
Profit andloss account
£m
11.5----
11.5
Other reserve
£m
1.4---
(0.1)
1.3
Revaluationreserve
£m
83.9----
83.9
Sharepremium
£m
AuthorisedAllotted, called up
and fully paid
8.2(9.9)36.10.3
34.7150.3
185.0
12.7(11.5)
-0.4
1.6185.0
186.6
2008£m
2009£m

F e n n e r p l c 8 3
Five year summary of the Group
Revenue
Operating profit before amortisation of intangible assets
acquired and exceptional items
Amortisation of intangible assets acquired
Exceptional items
Operating profit
Net finance costs
Share of result of associate
Profit before taxation
Taxation
Profit for the year
Earnings per share:
Underlying – before amortisation of intangible assets
acquired, exceptional items and notional interest*
Basic
Equity dividends
Dividends per ordinary share**
Capital expenditure
Total equity
Net debt
Gearing
Average number of employees (number)
*The comparatives have been restated to remove the notional interest on the unwinding of discount on provisions from underlying earnings per
share.
**Dividends per ordinary share are stated in respect of the period to which the dividends relate. Under IFRS this is not the same as the period in
which the dividends are recognised in the financial statements.
303.6
17.3
(1.0)
-
16.3
(3.8)
(0.1)
12.4
(4.0)
8.4
7.1p
6.6p
6.3
5.825p
8.1
107.5
(34.5)
32.1%
2,798
2005£m
379.0
34.1
(0.4)
-
33.7
(4.3)
(0.1)
29.3
(8.7)
20.6
13.1p
13.0p
8.2
6.0p
18.9
122.0
(33.1)
27.1%
3,473
2006£m
380.8
39.0(0.6)(0.2)
38.2(4.6)
-
33.6(9.7)
23.9
15.1p15.0p
9.56.225p
32.0
142.7
(36.3)
25.4%
3,663
2007£m
437.8
49.3(2.1)(3.4)
43.8(7.5)
-
36.3(10.4)
25.9
17.7p15.5p
9.96.6p
63.7
205.9
(97.6)
47.4%
3,924
499.4
41.3(6.8)(17.4)
17.1(11.5)
-
5.6(1.0)
4.6
12.8p2.6p
11.56.6p
34.3
195.5
(165.4)
84.6%
3,874
2008£m
2009£m

8 4 F e n n e r p l c
Fenner, Fenner Drives, Fenner Precision, Hallite, CDI, James Dawson, Apex Fenner, Usflex and Fireboss are Registered Trademarks of the Fenner Group.
Secant and Prodesco are Trademarks of the Fenner Group.
The McCloskey graph is reproduced with the permission of The McCloskey Group Limited.
Annual General Meeting
The 73rd Annual General Meeting of the Company will be held at Marlborough Room, Oxford & Cambridge Club, Pall Mall, London
SW1Y 5HD, on 13 January 2010 at 10.30 am when the following business will be proposed:
Ordinary Business
1 To receive the Directors’ Report and financial statements of the Group for the financial year ended 31 August 2009 together with the
Independent Auditors’ Report.
2 To approve the Board Remuneration Report contained in the Annual Report for 2009.
3 To declare a dividend.
4 To re-elect director.
5 To re-elect director.
6 To re-appoint the auditors.
7 To authorise the directors to determine the auditors’ remuneration.
Special Business
8 To authorise the directors to allot shares.
9 To empower the directors to allot shares for cash.
10 To empower the directors to allot additional shares in connection with a rights issue.
11 To authorise the Company to buy back its own shares.
12 To reduce the notice period required for general meetings.
13 To adopt new set of Articles of Association.
Note
This is a summary of the Notice of Meeting and shareholders should refer to the accompanying document which contains the full text of
the Notice of Meeting together with an explanatory letter from the Chairman of the Company.
Advisors
Registrars
Capita Registrars, Huddersfield
Principal Solicitors
Ashurst, London
Nabarro, London
Rollits, Hull
Shumaker, Loop & Kendrick, Toledo, USA
Independent Auditors
PricewaterhouseCoopers LLP, Hull
Brokers
RBS Hoare Govett, London
Principal Bankers
Barclays Bank PLC, Leeds
Lloyds Banking Group plc, Leeds
National Australia Bank Limited, Melbourne, Australia
Investment Bankers
N.M. Rothschild & Sons Limited, Leeds
Financial Calendar
Annual General Meeting – 13 January 2010
Half Year End – 28 February 2010
Half Year Results – April 2010
Year End – 31 August 2010
Preliminary Results – November 2010


Registered office:Hesslewood CountryOffice Park, Hessle,East Yorkshire, HU13 0PW,United KingdomTel: +44 (0)1482 626500Fax: +44 (0)1482 626512Registered Number:329377Website: www.fenner.com
USA
PORT CLINTONTel: (1) 419 635 2191Fax: (1) 419 635 2552www.fennerdunlopamericas.com
TOLEDOTel: (1) 419 534 5300Fax: (1) 419 531 6284www.fennerdunlopamericas.com
BLAIRSVILLETel: (1) 800 438 2918Tel: (1) 724 459 0727www.fennerdunlopamericas.com
LAVONIATel: (1) 706 956 4844 Tel: (1) 706 356 7650www.fennerdunlopamericas.com
MANHEIMTel: (1) 717 665 2421Fax: (1) 717 665 2649www.fennerdrives.com
Tel: (1) 800 327 2288Fax: (1) 717 664 8287www.fennerprecision.com
BUFFALOTel: (1) 716 833 6900Fax: (1) 716 833 9405www.fennerprecision.com
PERKASIETel: (1) 215 257 6566Fax: (1) 215 453 1584www.prodesco.com
Tel: (1) 215 257 8680Fax: (1) 215 257 8875www.secantmedical.com
DETROITTel: (1) 248 362 0170Fax: (1) 248 362 4246www.hallite.com
HOUSTON - CDITel: (1) 281 446 6662Fax: (1) 281 446 7034www.fast-houston.com
HOUSTON - EGCTel: (1) 281 774 6100Fax: (1) 281 774 6219 www.fast-houston.com
CANADA
BRACEBRIDGETel: (1) 705 645 4431Fax: (1) 705 645 3112www.scandura.net
TORONTOTel: (1) 416 675 2505Fax: (1) 416 675 4341www.hallite.com
BRAZIL
SAO PAULOTel: (55) 19 3523 1859Fax: (55) 19 3532 4805www.halliteseals.com.br
CHILE
ANTOFAGASTATel: (56) 55 236439Fax: (56) 55 297792www.fennerdunlopamericas.com
UNITED KINGDOM
HULLTel: (44) 1482 781234Fax: (44) 1482 785438www.fennerdunlopeurope.com
LINCOLNTel: (44) 1522 781800Fax: (44) 1522 510029www.james-dawson.com
Tel: (44) 1522 781800Fax: (44) 1522 510029www.fennerprecision.com
LEEDSTel: (44) 113 249 3486Fax: (44) 113 248 9656www.fennerdrives.com
HAMPTONTel: (44) 20 8941 2244Fax: (44) 20 8783 1669www.hallite.com
NETHERLANDS
DRACHTENTel: (31) 512 585 555Fax: (31) 512 585 511www.dunlopconveyorbelting.com
GERMANY
HAMBURGTel: (49) 40 73 47 480Fax: (49) 40 73 47 48 49www.hallite.com
FRANCE
PARISTel: (33) 1 3055 3903Fax: (33) 1 3054 6274www.dunlopconveyorbelting.com
Tel: (33) 1 4377 8550Fax: (33) 1 4377 9393www.hallite.com
SPAIN
BARCELONATel: (34) 9 3805 5446Fax: (34) 9 3805 4269www.dunlopconveyorbelting.com
POLAND
KATOWICETel: (48) 32 731 59 00Fax: (48) 32 731 59 01www.fennerdunlopeurope.com
ITALY
CALICIOTel: (39) 0586 428287 Fax: (39) 0586 429845www.dunlopservice.it
LIVORNOTel: (39) 0586 428287Fax: (39) 0586 429845www.hallite.com
RUSSIA
MOSCOWTel: (7) 495 223 6718Fax: (7) 495 223 6719www.dunlopconveyorbelting.com
AUSTRALIA
MELBOURNETel: (61) 3 9680 4500Fax: (61) 3 9689 9191www.fennerdunlop.com.au
SYDNEYTel: (61) 2 9620 7300Fax: (61) 2 9620 7400www.hallite.com
KWINANATel: (61) 8 9439 7300Fax: (61) 8 9439 7399www.fennerdunlop.com.au
CHINA
SHANGHAITel: (86) 21 599 369 89Fax: (86) 21 599 367 34www.fennerdunlop.com/shanghai
Tel: (86) 21 599 369 89Fax: (86) 21 599 367 34www.james-dawson.com
Tel: (86) 21 599 389 69Fax: (86) 21 599 367 34www.hallite.com
INDIA
MADURAITel: (91) 452 2464201Fax: (91) 452 2464204www.fennerdunlopindia.com
SOUTH AFRICA
JOHANNESBURGTel: (27) 11 974 1902Fax: (27) 11 974 1900www.fenner.co.za