Ground -Water Geology and Hydrology of Bunker Hill … -Water Geology and Hydrology of Bunker Hill...
37
Ground -Water Geology and Hydrology of Bunker Hill Air Force Base and Vicinity Peru, Indiana GEOLOGICAL SURVEY WATER-SUPPLY PAPER 1619-B Prepared on behalf of the Air Force, U. S. Department of Defense
Transcript of Ground -Water Geology and Hydrology of Bunker Hill … -Water Geology and Hydrology of Bunker Hill...
Ground -Water Geology and Hydrology of Bunker Hill Air Force Base and Vicinity Peru, Indiana
GEOLOGICAL SURVEY WATER-SUPPLY PAPER 1619-B
Prepared on behalf of the Air Force, U. S. Department of Defense
Ground -Water Geology and Hydrology of Bunker Hill Air Force Base and Vicinity Peru, IndianaBy F. A. WATKINS, JR., and J. S. ROSENSHEIN
CONTRIBUTIONS TO THE HYDROLOGY OF THE UNITED STATES
GEOLOGICAL SURVEY WATER-SUPPLY PAPER 1619-B
Prepared on behalf of the Air Force, U. S. Department of Defense
UNITED STATES GOVERNMENT PRINTING OFFICE, WASHINGTON : 1963
UNITED STATES DEPARTMENT OF THE INTERIOR
STEWART L. UDALL, Secretary
GEOLOGICAL SURVEY
Thomas B. Nolan, Director
For sale by the Superintendent of Documents, U.S. Government Printing Office Washington, D.G. 20402
CONTENTS
Page
Abstract _ _ ______________________________________________________ BlIntroduction._____________________________________________________ 2
Location and areal extent_____________________________________ 2Previous investigations.________________________________________ 2Well-numbering system________________________________________ 2Methods of investigation.______________________________________ 4Acknowledgments. _________-_________---_---_-_-_-_-_-_-----_- 5
Geography___ ___________________________________________________ 5Topography and drainage_____________-_________________-_-_-_- 5Precipitation_ _______________________________________________ 5
Geology and water-bearing characteristics of the rock units _____________ 5Silurian system______________________________________________ 6
Middle Silurian series______________________________________ 6Water-bearing characteristics. ______________________________ 9
Quaternary system____________________________________________ 9Pleistocene and Recent series.-------------------.---------- 9Water-bearing characteristics._________________-_----------- 10
Bedrock topography _______________________________________________ 10Hydraulic properties of the rock units______________________________ 11Ground-water hydrology_______-______-_-_-___-_-_________--------- 15
Recharge.____________________________________________________ 15Discharge ____________________________________________________ 16Fluctuations of water levels..__________-___________-_--------_-- 16
Quality of ground water____._______________________________________ 18Summary and conclusions____---_____---_----------_---_--_-------- 23Records of wells___________________________________________________ 24Selected bibliography______________________________________________ 31
ILLUSTRATIONS
[All plates are in pocket]
PLATE 1. Map of Bunker Hill Air Force Base and vicinity showing lo cation of wells and contours on the bedrock surface.
2. Geologic map and generalized sections of Bunker Hill Air Force Base and vicinity.
3. Maps showing generalized contours on the piezometric surface of Bunker Hill Air Force Base and vicinity.
m
IV CONTENTS
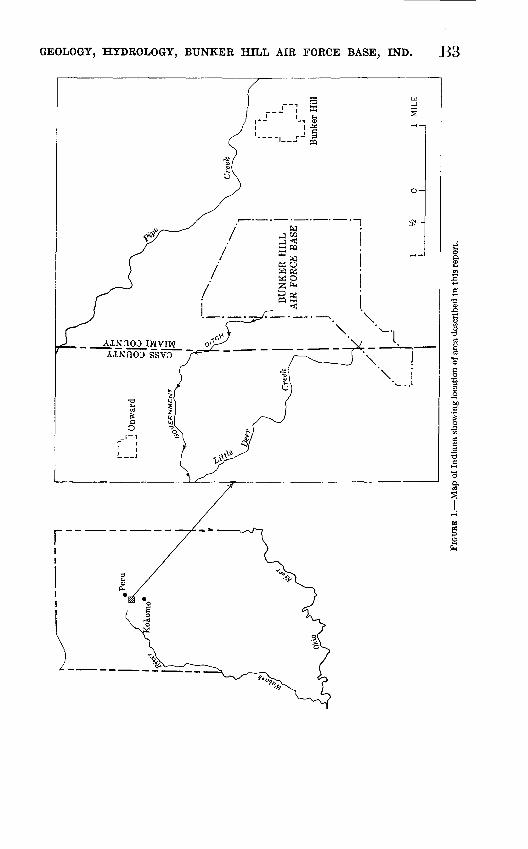
Page FIGUEE 1. Map of Indiana showing location of area described in this
report __ ___________________________________________ B32. Diagram showing well-numbering system._________________ 43. Annual precipitation at Kokomo, Ind., 1893-1958-_________ 64. Monthly temperature and precipitation at Kokomo, Ind.,
1893-1958.______________________________________ 75. Distance-drawdown curves for the limestone bedrock aquifer
underlying the new well field at Bunker Hill Air Force Base_________________________________ 12
6. Time-drawdown curves for the limestone bedrock aquifer underlying the new well field at Bunker Hill Air Force Base_________________________________ 13
7. Fluctuation of water levels in well 26/3-25Q1, monthly pre cipitation, and pumpage_____________________________ 17
8. Graphs showing fluctuation of water levels in three observa tion wells and bar diagram showing length of pumping periods and wells pumped during each period ____________ 19
9. Fluctuation of water levels in observation wells 25/3-lHl,25/3-1H4, 25/3-lH2__________________________________ 20
10. Fluctuation of water levels in observation wells 25/3-1A1,25/3-10A1, 26/3-35C1, 26/3-26D1, and 25/3-3Ql.___-_--_ 21
TABLES
TABLE 1. Generalized stratigraphic section in the vicinity of Bunker Hill Air Force Base ___ ___ _____ _ ___ _. _ ___ _
2. Coefficients of transmissibility and storage in new well field. _3. Estimated values for coefficients of transmissibility and
4. Specific capacity of the wells at Bunker Hill Air Force Base.5. Distances, in feet, between the wells shown on figure 8______6. Chemical analyses of water from supply wells______________7. Records of wells by township____________________________8. Logs of wells and test holes in the vicinity of Bunker Hill Air
Force Base_____________--_____--___-__. _____________
Page
B8 12
1415202224
28
CONTRIBUTIONS TO THE HYDROLOGY OF THE UNITED STATES
GROUND-WATER GEOLOGY AND HYDROLOGY OF BUNKER HILL AIR FORGE BASE AND VICINITY, PERU, INDIANA
By F. A. WATKINS, JR., and J. S. KOSENSHEIN
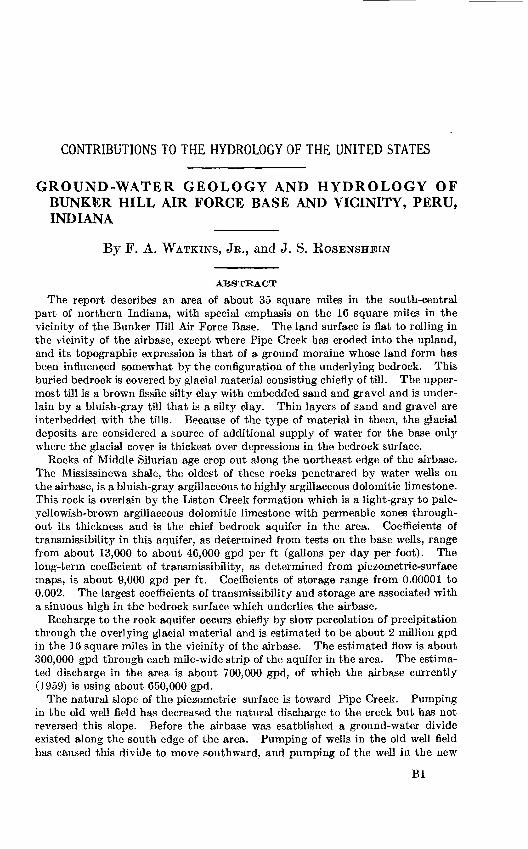
ABSTRACT
The report describes an area of about 35 square miles in the south-central part of northern Indiana, with special emphasis on the 16 square miles in the vicinity of the Bunker Hill Air Force Base. The land surface is flat to rolling in the vicinity of the airbase, except where Pipe Creek has eroded into the upland, and its topographic expression is that of a ground moraine whose land form has been influenced somewhat by the configuration of the underlying bedrock. This buried bedrock is covered by glacial material consisting chiefly of till. The upper most till is a brown fissile silty clay with embedded sand and gravel and is under lain by a bluish-gray till that is a silty clay. Thin layers of sand and gravel are interbedded with the tills. Because of the type of material in them, the glacial deposits are considered a source of additional supply of water for the base only where the glacial cover is thickest over depressions in the bedrock surface.
Rocks of Middle Silurian age crop out along the northeast edge of the airbase. The Mississinewa shale, the oldest of these rocks penetrared by water wells on the airbase, is a bluish-gray argillaceous to highly argillaceous dolomitic limestone. This rock is overlain by the Listen Creek formation which is a light-gray to pale- yellowish-brown argillaceous dolomitic limestone with permeable zones through out its thickness and is the chief bedrock aquifer in the area. Coefficients of transmissibility in this aquifer, as determined from tests on the base wells, range from about 13,000 to about 46,000 gpd per ft (gallons per day per foot). The long-term coefficient of transmissibility, as determined from piezometric-surface maps, is about 9,000 gpd per ft. Coefficients of storage range from 0.00001 to 0.002. The largest coefficients of transmissibility and storage are associated with a sinuous high in the bedrock surface which underlies the airbase.
Recharge to the rock aquifer occurs chiefly by slow percolation of precipitation through the overlying glacial material and is estimated to be about 2 million gpd in the 16 square miles in the vicinity of the airbase. The estimated flow is about 300,000 gpd through each mile-wide strip of the aquifer in the area. The estima ted discharge in the area is about 700,000 gpd, of which the airbase currently (1959) is using about 650,000 gpd.
The natural slope of the piezometric surface is toward Pipe Creek. Pumping in the old well field has decreased the natural discharge to the creek but has not reversed this slope. Before the airbase was esatblished a ground-water divide existed along the south edge of the area. Pumping of wells in the old well field has caused this divide to move southward, and pumping of the well in the new
Bl
B2 CONTRIBUTIONS TO THE HYDROLOGY OF THE UNITED STATES
well field in the southeast corner of the airbase will cause the divide to move even further southward.
Ground water in the vicinity of the airbase is hard and has a high iron content. With some treatment, however, the water is made suitable for domestic, farm, public-supply, and many industrial uses.
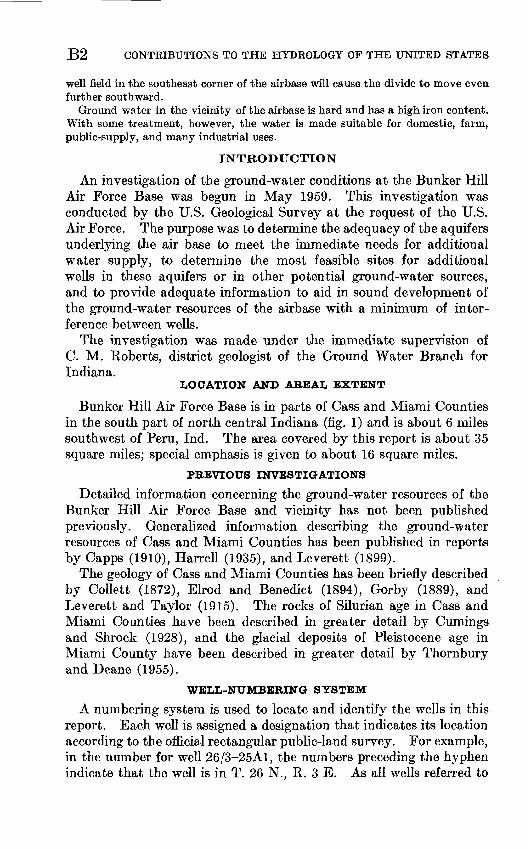
INTRODUCTION
An investigation of the ground-water conditions at the Bunker Hill Air Force Base was begun in .May 1959. This investigation was conducted by the U.S. Geological Survey at the request of the U.S. Air Force. The purpose was to determine the adequacy of the aquifers underlying the air base to meet the immediate needs for additional water supply, to determine the most feasible sites for additional wells in these aquifers or in other potential ground-water sources, and to provide adequate information to aid in sound development of the ground-water resources of the airbase with a minimum of inter ference between wells.
The investigation was made under the immediate supervision of C. M. Roberts, district geologist of the Ground Water Branch for Indiana.
LOCATION AND AREAL EXTENT
Bunker Hill Air Force Base is in parts of Cass and Miami Counties in the south part of north central Indiana (fig. 1) and is about 6 miles southwest of Peru, Ind. The area covered by this report is about 35 square miles; special emphasis is given to about 16 square miles.
PREVIOUS INVESTIGATIONS
Detailed information concerning the ground-water resources of the Bunker Hill Air Force Base and vicinity has not been published previously. Generalized information describing the ground-water resources of Cass and Miami Counties has been published in reports by Capps (1910), Harrell (1935), and Leverett (1899).
The geology of Cass and Miami Counties has been briefly described by Collett (1872), Elrod and Benedict (1894), Gorby (1889), and Leverett and Taylor (1915). The rocks of Silurian age in Cass and Miami Counties have been described in greater detail by Cumings and Shrock (1928), and the glacial deposits of Pleistocene age in Miami County have been described in greater detail by Thornbury and Deane (1955).
WELL-NUMBERING SYSTEM
A numbering system is used to locate and identify the wells in this report. Each well is assigned a designation that indicates its location according to the official rectangular public-land survey. For example, in the number for well 26/3-25A1, the numbers preceding the hyphen indicate that the well is in T. 26 N., R. 3 E. As all wells referred to
CASS COUNTY_ MIAMI COUNTY
'OKI 'asva aoao^ aiv iim'iOoaoaoiH 'iooioao
CONTRIBUTIONS TO THE HYDROLOGY OF THE UNITED STATES
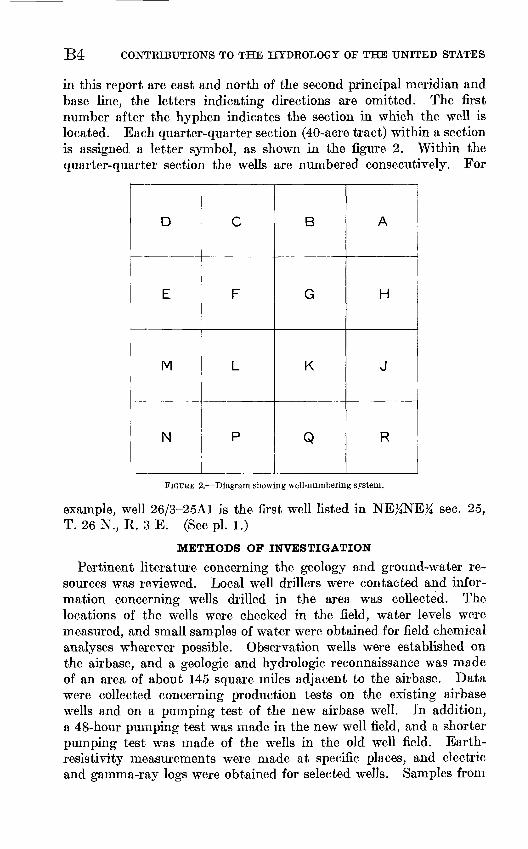
in this report are east and north of the second principal meridian and base line, the letters indicating directions are omitted. The first number after the hyphen indicates the section in which the well is located. Each quarter-quarter section (40-acre tract) within a section is assigned a letter symbol, as shown in the figure 2. Within the quarter-quarter section the wells are numbered consecutively. For
D
E
M
N
C
F
L
P
B
G
K
Q
A
H
J
R
FIGURE 2. Diagram showing well-numbering system.
example, well 26/3-25A1 is the first well listed in NE#NE# sec. 25, T. 26 N., R. 3 E. (See pi. 1.)
METHODS OF INVESTIGATION
Pertinent literature concerning the geology and ground-water re sources was reviewed. Local well drillers were contacted and infor mation concerning wells drilled in the area was collected. The locations of the wells were checked in the field, water levels were measured, and small samples of water were obtained for field chemical analyses wherever possible. Observation wells were established on the airbase, and a geologic and hydrologic reconnaissance was made of an area of about 145 square miles adjacent to the airbase. Data were collected concerning production tests on the existing airbase wells and on a pumping test of the new airbase well. In addition, a 48-hour pumping test was made in the new well field, and a shorter pumping test was made of the wells in the old well field. Earth- resistivity measurements were made at specific places, and electric and gamma-ray logs were obtained for selected wells. Samples from
GEOLOGY, HYDROLOGY, BUNKER HILL AIR FORCE BASE, IND. B5
deep-structure borings and all available cuttings from water wells drilled on the airbase were collected for examination. These various data are used in the interpretations in the report.
ACKNOWLEDGMENTS
The authors wish to thank all persons who contributed information and assisted in the preparation of the report. Well drillers provided records of wells, related information, and rock cuttings from water wells on the airbase. The civilian and military personnel of the Air Force and the Navy were very cooperative in providing access to and information about the water supply of the airbase and about related matters. Mr. A. J. Franklin and Mr. D. Sheplar of the Base Instal lation Engineers Office were particularly helpful in coordinating efforts on the airbase before and during the pumping tests and in providing access to pertinent data concerning the airbase watersupply.
GEOGRAPHY
TOPOGRAPHY AND DRAINAGE
The land surface in the vicinity of Bunker Hill Air Force Base is flat to slightly rolling and locally has a few small closed depressions (pi. 1). Its topography is that of a ground moraine influenced somewhat by configuration of the underlying bedrock surface. A topographic high extends along the south edge of the airbase, and slopes toward the north and the south.
The area is drained chiefly by Government Ditch and Little Deer Creek, which are tributaries of Pipe Creek. Along the northeast edge of the area, where Pipe Creek has eroded into the upland surface, the maximum relief is about 60 feet.
PRECIPITATION
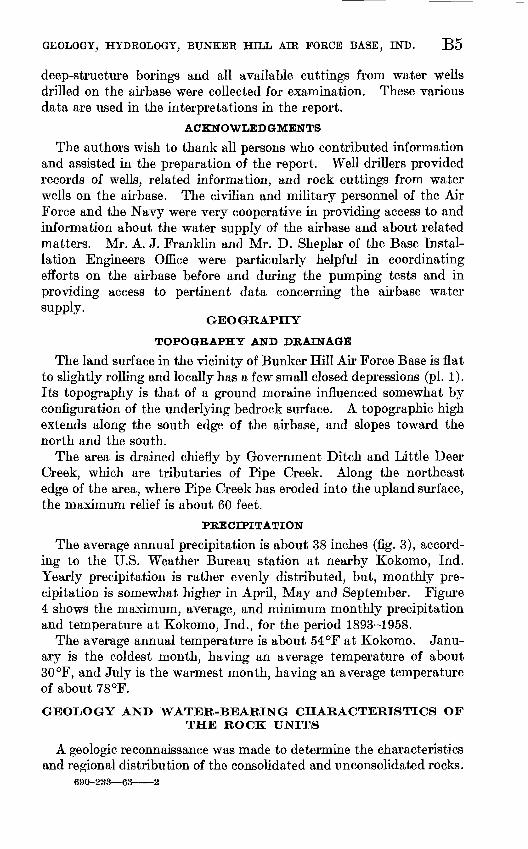
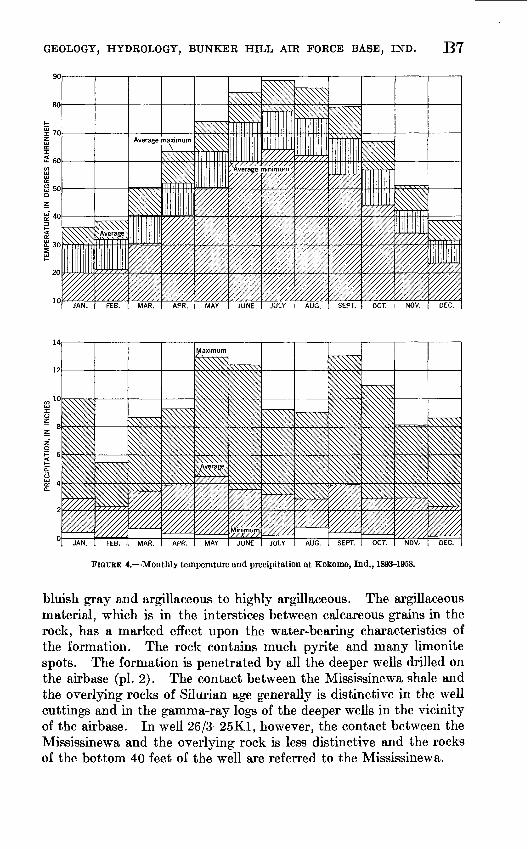
The average annual precipitation is about 38 inches (fig. 3), accord ing to the U.S. Weather Bureau station at nearby Kokomo, Ind. Yearly precipitation is rather evenly distributed, but, monthly pre cipitation is somewhat higher in April, May and September. Figure 4 shows the maximum, average, and minimum monthly precipitation and temperature at Kokomo, Ind., for the period 1893-1958.
The average annual temperature is about 54°F at Kokomo. Janu ary is the coldest month, having an average temperature of about 30 °F, and July is the warmest month, having an average temperature of about 78 °F.
GEOLOGY AND WATER-BEARING CHARACTERISTICS OF THE ROCK UNITS
A geologic reconnaissance was made to determine the characteristics and regional distribution of the consolidated and imconsolidated rocks.
690-233 63 2
B6 CONTRIBUTIONS TO THE HYDROLOGY OF THE UNITED STATES
V)LLJ
1 40;
Z //
? ? JOIiVild
o '"oUJ /K X Q. X
/
/ X X Xn v
7
%~? 7*
^ "
^
^
^
/ /
/ _ z
^i$̂i
"/"i
\\\\\ ,\\\\\ ,\\\\\
///'
^
^7
///
^
%
7
£Jx";
/x
^
£.
/
/
'/
'',
7
:"
7'
//
/
7 /
s / /
< / ' /
' /
' / S
/ / /
' / s
l> /
''f- / ' / f/ /
'/// x // /
' / / / / / /
^ ^ /
s / / / f
III'////^/^ Z
;////
Average 38.47\
^ ?^ X " XXX// <<> /x /// x^ /x ^
**'////,
^11
7 ^ // /
^J
^/^
^//"
g^
^F^
^/^
/// ///
//^
/" r// / / ̂ / //
/ _ / / ̂
/// / / / /-' / / / ' / / //
/ £/ / '
> / / / * / / / '
/ / / f / / / ̂ '
s / / / "* / / / ' // / / ' / / / / 'f /X / '
1\^7 *~
/7,-n
^;^
i|
'//
//'
^
^7
^
'//
^
1
7
y -~/-/7
/ / / / x
^//X'
^1
7
^ 0
^1
^1
^
II
^x^
^
r
/
/
^
^
/x
/ X
/x
^
/ /
g;^'x/
' -t-4-
FIGURE 3. Annual precipitation at Kokomo, Ind., 1893-1958.
Road cuts, ditches, and other outcrops were examined for information about the type of deposits, depositional characteristics, lithology, and other features that might affect the water-bearing properties and the recharge characteristics of the materials. The areal geologic map (pi. 2) was prepared chiefly from the data obtained during the recon naissance and was modified somewhat as a result of interpretations of aerial photographs, foundation-test borings, published soils maps (Tharp and Kunkel, 1927; Rogers and others, 1955), and published geological reports (Cumings and Shrock, 1928; Thornbury and Deane, 1955).
SILURIAN SYSTEM
MEDDLE SILURIAN SERIES
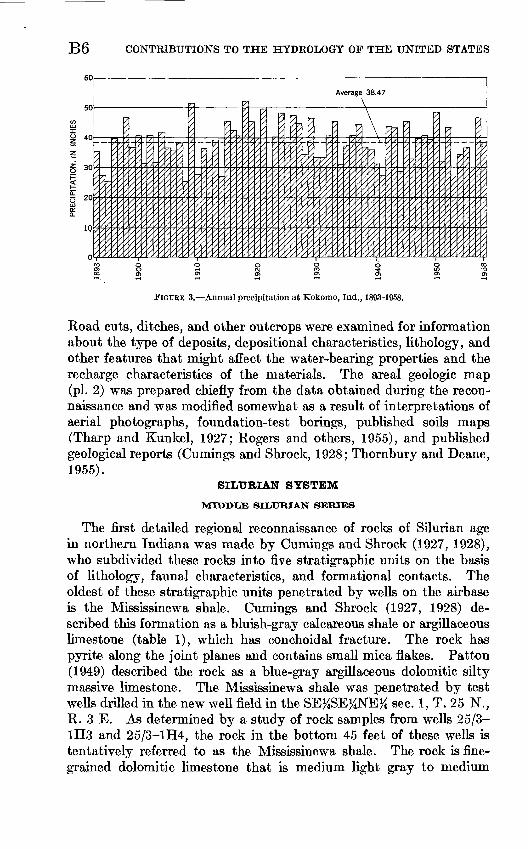
The first detailed regional reconnaissance of rocks of Silurian age in northern Indiana was made by Cumings and Shrock (1927, 1928), who subdivided these rocks into five stratigraphic units on the basis of lithology, faunal characteristics, and formational contacts. The oldest of these stratigraphic units penetrated by wells on the airbase is the Mississinewa shale. Cumings and Shrock (1927, 1928) de scribed this formation as a bluish-gray calcareous shale or argillaceous limestone (table 1), which has conchoidal fracture. The rock has pyrite along the joint planes and contains small mica flakes. Patton (1949) described the rock as a blue-gray argillaceous dolomitic silty massive limestone. The Mississinewa shale was penetrated by test wells drilled in the new weU field in the SEtfSEtfNEtf sec. 1, T. 25 N., R. 3 E. As determined by a study of rock samples from wells 25/3- 1H3 and 25/3-1H4, the rock in the bottom 45 feet of these wells is tentatively referred to as the Mississinewa shale. The rock is fine grained dolomitic limestone that is medium light gray to medium
GEOLOGY, HYDROLOGY, BUNKER HILL AIR FORCE BASE, IND. B7
JAN. FEB. MAR. APR. MAY JUNE JULY AUG. SEPT. OCT. NOV.-
FIGURE 4. Monthly temperature and precipitation at Kokomo, Ind., 1893-1958.
bluish gray and argillaceous to highly argillaceous. The argillaceous material, which is in the interstices between calcareous grains in the rock, has a marked effect upon the water-bearing characteristics of the formation. The rock contains much pyrite and many limonite spots. The formation is penetrated by all the deeper wells drilled on the airbase (pi. 2). The contact between the Mississinewa shale and the overlying rocks of Silurian age generally is distinctive in the well cuttings and in the gamma-ray logs of the deeper wells in the vicinity of the airbase. In well 26/3-25K1, however, the contact between the Mississinewa and the overlying rock is less distinctive and the rocks of the bottom 40 feet of the well are referred to the Mississinewa.
CONTRIBUTIONS TO THE HYDROLOGY OF THE UNITED STATES
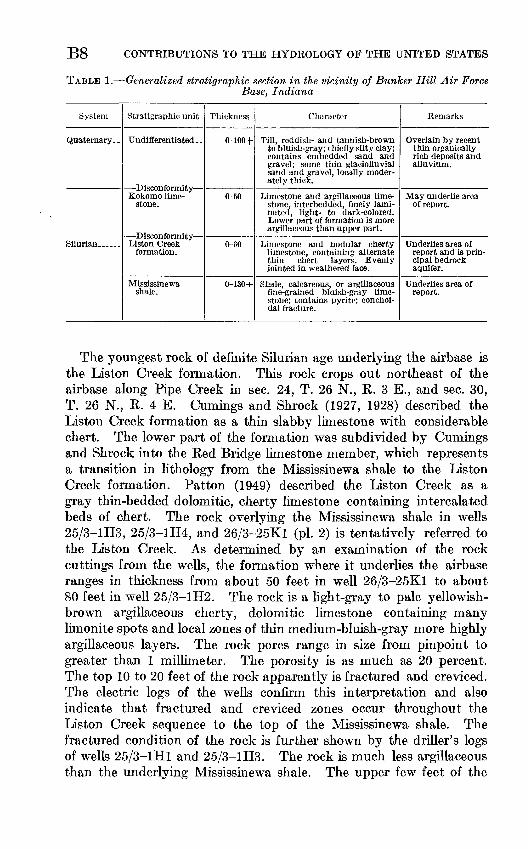
TABLE 1. Generalized stratigraphic section in the vicinity of Bunker Hill Air ForceBase, Indiana
System
Quaternary. .
Silurian. .....
Stratigraphic unit
Undiflerentiated ..
Kokomo lime stone.
Listen Creek formation.
Mississinewa shale.
Thickness
0-100+
0-50
0-60
0-130±
Character
Till, reddish- and tannish-brown to bluish-gray; chiefly silty clay; contains embedded sand and gravel; some thin glaciofluvial sand and gravel, locally moder ately thick.
Limestone and argillaceous lime stone, interbedded, finely lami nated, light- to dark-colored. Lower part of formation is more argillaceous than upper part.
Limestone and nodular cherty limestone, containing alternate thin chert layers. Evenly jointed in weathered face.
Shale, calcareous, or argillaceous fine-grained bluish-gray lime stone; contains pyrite; conchoi- dal fracture.
Remarks
Overlain by recent thin organically rich deposits and alluvium.
May underlie area of report.
Underlies area of report and is prin cipal bedrock aquifer.
Underlies area of report.
The youngest rock of definite Silurian age underlying the airbase is the Listen Creek formation. This rock crops out northeast of the airbase along Pipe Creek in sec. 24, T. 26 N., R. 3 E., and sec. 30, T. 26 N., R. 4 E. Cumings and Shrock (1927, 1928) described the Listen Creek formation as a thin slabby limestone with considerable chert. The lower part of the formation was subdivided by Cumings and Shrock into the Red Bridge limestone member, which represents a transition in lithology from the Mississinewa shale to the Listen Creek formation. Patten (1949) described the Listen Creek as a gray thin-bedded dolomitic, cherty limestone containing intercalated beds of chert. The rock overlying the Mississinewa shale in wells 25/3-1H3, 25/3-1H4, and 26/3-25K1 (pi. 2) is tentatively referred to the Listen Creek. As determined by an examination of the rock cuttings from the wells, the formation where it underlies the airbase ranges in thickness from about 50 feet in well 26/3-25K1 to about 80 feet in well 25/3-1H2. The rock is a light-gray to pale yellowish- brown argillaceous cherty, dolomitic limestone containing many limonite spots and local zones of thin medium-bluish-gray more highly argillaceous layers. The rock pores range in size from pinpoint to greater than 1 millimeter. The porosity is as much as 20 percent. The top 10 to 20 feet of the rock apparently is fractured and creviced. The electric logs of the wells confirm this interpretation and also indicate that fractured and creviced zones occur throughout the Liston Creek sequence to the top of the Mississinewa shale. The fractured condition of the rock is further shown by the driller's logs of wells 25/3-lHl and 25/3-1H3. The rock is much less argillaceous than the underlying Mississinewa shale. The upper few feet of the
GEOLOGY, HYDROLOGY, BUNKER HILL AIR FORCE BASE, IND. B9
Listen Creek in these wells may belong to the Kokomo limestone of Cumings and Shrock (1927, 1928); however, no marked difference exists between the samples from this part of the section and those from the lower part of the Listen Creek section.
WATER-BEARING CHARACTERISTICS
The water-bearing characteristics of the rocks of Silurian age are dependent upon the physical characteristics of the rocks: the size, distribution, and number of openings; the chemical composition; and upon the topographic position of the rocks with respect to the pre- glacial bedrock surface. The rocks of Silurian age of Indiana are generally a source of only small to moderate supplies of water.
Cumings and Shrock (1928) noted that subterranean drainage tends to form in the Listen Creek formation. The Listen Creek and the overlying limestones have marked enlargements of secondary open ings by weathering and solution along the joints and bedding planes. These secondary openings are best formed where the rocks occupy topographic highs on the buried bedrock surface. The Listen Creek formation has at least two definite joint systems. The sample studies indicate that the Listen Creek formation is more porous and much less argillaceous than the underlying Mississinewa shale. The electric logs of wells in the old and the new well fields show that most of the permeable zones penetrated lie within strata that have tenta tively been referred to as the Listen Creek formation. These factors indicate that the water for the airbase is being derived from the Listen Creek formation and that this formation is the chief bedrock aquifer underlying the airbase. Further development by the airbase of the rocks of Silurian age as a source of water should be restricted chiefly to the Listen Creek formation.
QUATERNARY SYSTEM
PLEISTOCENE AND RECENT SERIES
The youngest rocks in the vicinity of the Bunker Hill Air Force Base are unconsolidated glacial deposits of Pleistocene age and Recent alluvium (pi. 2). The glacial deposits consist chiefly of a till that is a calcareous silty clay containing sand, pebble gravel, and some cobble gravel. The lower part of the till is generally bluish gray and the upper part is tannish to reddish brown. The upper part, or brown till, ranges in thickness from about 3 feet to more than 20 feet. The till, which is exposed in the ditches and road cuts in the vicinity of the airbase, is fissile and consists of discontinuous platy or flaky layers of silty clay and embedded sand and gravel. This till forms the ground moraine that underlies the upland surface in the vicinity of the airbase.
BIO CONTRIBUTIONS TO THE HYDROLOGY OF THE UNITED STATES
The glacial deposits contain also some glaciofluvial material. A thin bed of sand and gravel separates the brown till and the gray till in many areas of the airbase. Locally, a thin bed of sand and gravel also lies between the till and the top of the bedrock (for example, at well 26/3-25D1). Some sand and gravel was deposited in a closed depression in the bedrock surface underlying sec. 25, T. 26 N., R. 3 E. (see weU 26/3-25K1, pi. 2).
Recent deposits consist chiefly of alluvium along the flood plain of Pipe Creek and its tributaries. Locally, thin beds of organically rich silt and clay were deposited in the small closed depressions in the upland surface. Because of the small areal extent of these deposits, they are not shown on plate 2.
WATER-BEARING CHARACTERISTICS
The water-bearing characteristics of the unconsolidated rocks are dependent upon the grain size; grain-to-grain relationship; size, num ber, and distribution of the interconnected pores; and thickness of the deposit. Much of the glacial material in the vicinity of the base consists of clayey till, and clayey till is not a source of appreciable quantities of water because of the small size of the interconnected pores.
Deposits of glaciofluvial sand and gravel are generally sources of large quantities of water if they are of substantial areal extent and thickness and do not contain much fine material. The size of the pores and the number of interconnections are generally sufficient to enable the deposits to yield large quantities of water. Because the sand and gravel deposits are relatively thin, there are few areas from which possible additions to the airbase water supply can be obtained from these sources. Attempts to develop water supplies from sand and gravel deposits should be restricted to the areas of the thickest glacial cover over the bedrock and to areas underlain by depressions in the bedrock surface, such as in sec. 25, T. 26 N., R. 3 E. or in the southeast corner of sec. 3, T. 25 N., R. 3 E. As is shown by well 26/3-25K1, the depression in sec. 25, T. 26 N., R. 3 E., is a favorable potential area for obtaining additional water from the unconsolidated glacial material.
BEDROCK TOPOGRAPHY
Plate 1 shows the configuration of the bedrock surface underlying the airbase and vicinity. The pattern of preglacial streams was controlled to a large extent by the jointing in the rocks of Silurian age upon which the streams flowed. The bedrock surface is char acterized by closed depressions (sinkholes) formed in the rock. One of these closed depressions underlies sec. 25, T. 26 N., R. 3 E. Well
GEOLOGY, HYDROLOGY, BUNKER HILL AIR FORCE BASE, IND. Bll
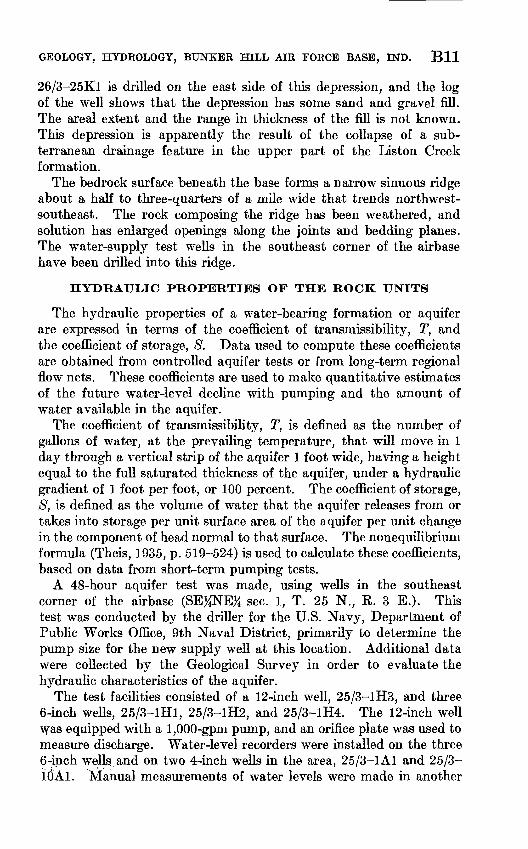
26/3-25K1 is drilled on the east side of this depression, and the log of the well shows that the depression has some sand and gravel fill. The areal extent and the range in thickness of the fill is not known. This depression is apparently the result of the collapse of a sub terranean drainage feature in the upper part of the Liston Creek formation.
The bedrock surface beneath the base forms a narrow sinuous ridge about a half to three-quarters of a mile wide that trends northwest- southeast. The rock composing the ridge has been weathered, and solution has enlarged openings along the joints and bedding planes. The water-supply test wells in the southeast corner of the airbase have been drilled into this ridge.
HYDRAULIC PROPERTIES OF THE ROCK UNITS
The hydraulic properties of a water-bearing formation or aquifer are expressed in terms of the coefficient of transmissibility, T, and the coefficient of storage, S. Data used to compute these coefficients are obtained from controlled aquifer tests or from long-term regional flow nets. These coefficients are used to make quantitative estimates of the future water-level decline with pumping and the amount of water available in the aquifer.
The coefficient of transmissibility, T, is defined as the number of gallons of water, at the prevailing temperature, that will move in 1 day through a vertical strip of the aquifer 1 foot wide, having a height equal to the full saturated thickness of the aquifer, under a hydraulic gradient of 1 foot per foot, or 100 percent. The coefficient of storage, S, is defined as the volume of water that the aquifer releases from or takes into storage per unit surface area of the aquifer per unit change in the component of head normal to that surface. The nonequilibrium formula (Theis, 1935, p. 519-524) is used to calculate these coefficients, based on data from short-term pumping tests.
A 48-hour aquifer test was made, using wells in the southeast corner of the airbase (SEtfNEJS sec. 1, T. 25 N., R. 3 E.). This test was conducted by the driller for the U.S. Navy, Department of Public Works Office, 9th Naval District, primarily to determine the pump size for the new supply well at this location. Additional data were collected by the Geological Survey in order to evaluate the hydraulic characteristics of the aquifer.
The test facilities consisted of a 12-inch well, 25/3-1H3, and three 6-inch wells, 25/3-lHl, 25/3-1H2, and 25/3-1H4. The 12-inch well was equipped with a 1,000-gpm pump, and an orifice plate was used to measure discharge. Water-level recorders were installed on the three 6-inch wells and on two 4-inch wells in the area, 25/3-1 Al and 25/3-
' Manual measurements of water levels were made in another
B12 CONTRIBUTIONS TO THE HYDROLOGY OF THE UNITED STATES
4-inch well, 25/4-6E1, and measurements were made in the pumped well with an electric tape. The results of this test are tabulated in table 2.
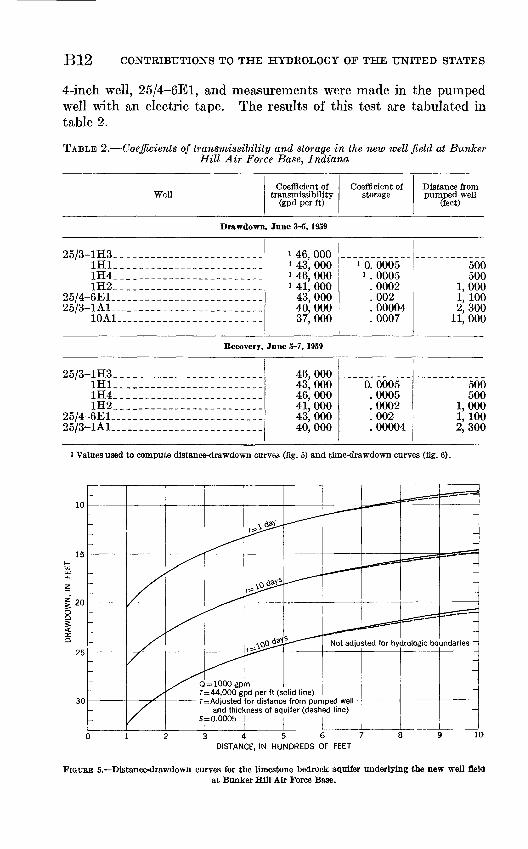
TABLE 2. Coefficients of transmissibility and storage in the new well field at Bunker Hill Air Force Base, Indiana
WellCoefficient of
transmissibility (gpd per ft)
Coefficient of storage
Distance from pumped well
(feet)
Drawdown, June 3-5, 1959
25/3-1H3. -__------------------___1H1______.__________________1H4__. ______________________1H2_________________________
25/4-6El-______-____-__-__-.____._25/3-lAl___________.__________.___
10A1______.__________________
i 46, 000 i 43, 000 1 46, 000 i 41, 000
43, 000 40, 000 37, 000
i 0. 0005 i . 0005
. 0002
.002
. 00004
. 0007
500 500
1,000 1, 100 2,300
11, 000
Recovery, June 5-7, 1959
25/3-lH3_ ________________________1H1___. _____________________1H4_ ________________________1H2
25/4-6El__________________________25/3-lAl________ _ ________ _ ____
46, 000 43, 000 46, 000 41, 000 43, 000 40, 000
0. 0005 .0005 .0002 .002 . 00004
500 500
1,000 1, 100 2,300
i Values used to compute distance-drawdown curves (fig. 5) and time-drawdown curves (fig. 6).
Not adjusted for hydrologic boundaries
Q=1000gpmr=44,000 gpd per ft (solid line)T= Adjusted for distance from pumped well
and thickness of aquifer (dashed line) S=0.0005
34567 DISTANCE, IN HUNDREDS OF FEET
FIGTJEE 5. Distance-drawdown curves for the limestone bedrock aquifer underlying the new well fieldat Bunker Hill Air Force Base.
GEOLOGY, HYDROLOGY, BUNKER HILL AIR FORCE BASE, ESTD. B13
10
15
20
25
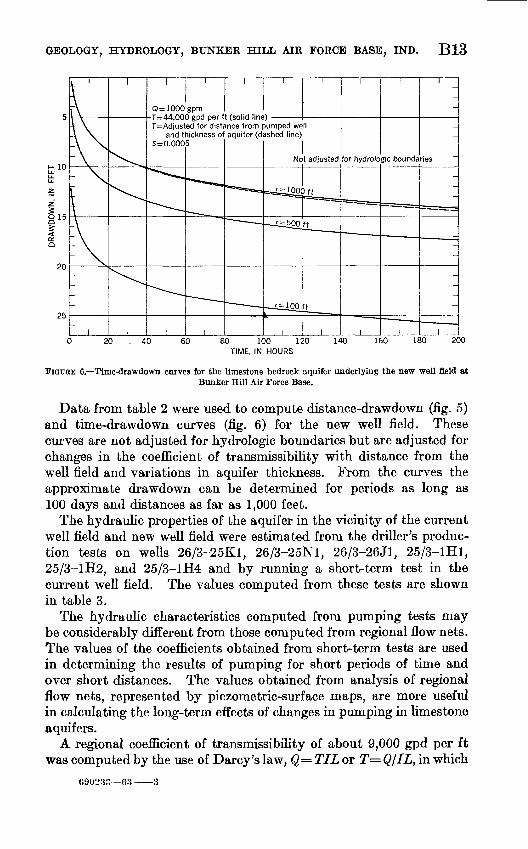
Q=1000 gpmT=44,000 gpd per ft (solid line)r=Adjusted for distance from pumped well
and thickness of aquifer (dashed line) S=0.0005
ir hydrologic bounda
20 - 40 60 80 100 120 140 160 180 200 TIME, IN HOURS
FIGUBE 6. Time-drawdown curves for the limestone bedrock aquifer underlying the new well field atBunker Hill Air Force Base.
Data from table 2 were used to compute distance-drawdown (fig. 5) and time-drawdown curves (fig. 6) for the new well field. These curves are not adjusted for hydrologic boundaries but are adjusted for changes in the coefficient of transmissibility with distance from the well field and variations in aquifer thickness. From the curves the approximate drawdown can be determined for periods as long as 100 days and distances as far as 1,000 feet.
The hydraulic properties of the aquifer in the vicinity of the current well field and new well field were estimated from the driller's produc tion tests on wells 26/3-25K1, 26/3-25N1, 26/3-26J1, 25/3-lHl, 25/3-1H2, and 25/3-1H4 and by running a short-term test in the current well field. The values computed from these tests are shown in table 3.
The hydraulic characteristics computed from pumping tests may be considerably different from those computed from regional flow nets. The values of the coefficients obtained from short-term tests are used in determining the results of pumping for short periods of time and over short distances. The values obtained from analysis of regional flow nets, represented by piezometric-surface maps, are more useful in calculating the long-term effects of changes in pumping in limestone aquifers.
A regional coefficient of transmissibility of about 9,000 gpd per ft was computed by the use of Darcy's law, Q= TIL or T= Q/IL, in which
C90233- 63 3
B14 CONTRIBUTIONS TO THE HYDROLOGY OF THE UNITED STATES
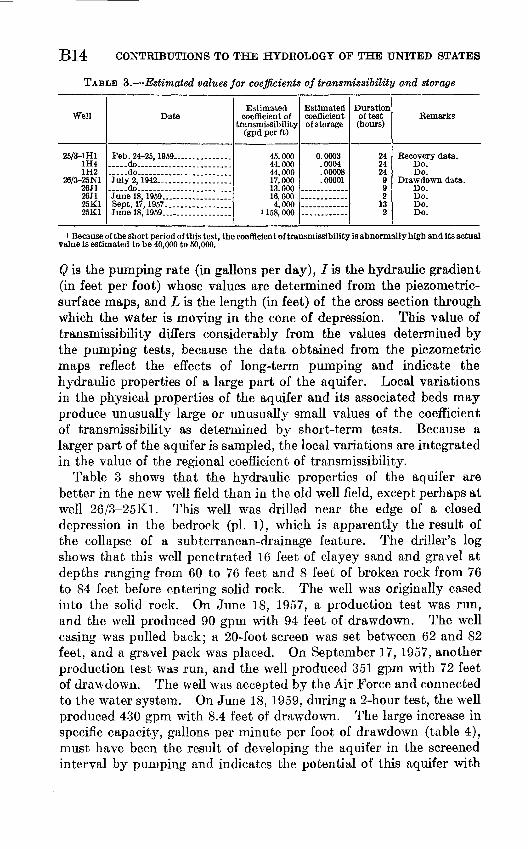
TABLE 3. Estimated values for coefficients of transmissibility and storage
Well
25/3-1H11H41H2
26/3-25N126J126J125K125K1
Date
Feb. 24-25, 1959... .................do.......................
July 2, 1942...................
June 18, 1959 ___ . ____ Sept. 17, 1957.................June 18, 1959 __________
Estimated coefficient of
transmissibility (gpd per ft)
45, 00044, 00044,00017, 00013, 00016, 0004,000
1 158, 000
Estimated coefficient of storage
0.0003.0004.00008.00001
Durationof test (hours)
242424
992
132
Remarks
Recovery data.Do.Do.
Drawdown data.Do.Do.Do.Do.
Because of the short period of this test, the coefficient of transmissibility is abnormally high and Its actual value is estimated to be 40,000 to 50,000.
Q is the pumping rate (in gallons per day), / is the hydraulic gradient (in feet per foot) whose values are determined from the piezometric- surf ace maps, and L is the length (in feet) of the cross section through which the water is moving in the cone of depression. This value of transmissibility differs considerably from the values determined by the pumping tests, because the data obtained from the piezometric maps reflect the effects of long-term pumping and indicate the hydraulic properties of a large part of the aquifer. Local variations in the physical properties of the aquifer and its associated beds may produce unusually large or unusually small values of the coefficient of transmissibility as determined by short-term tests. Because a larger part of the aquifer is sampled, the local variations are integrated in the value of the regional coefficient of transmissibility.
Table 3 shows that the hydraulic properties of the aquifer are better in the new well field than in the old well field, except perhaps at well 26/3-25K1. This well was drilled near the edge of a closed depression in the bedrock (pi. l), which is apparently the result of the collapse of a subterranean-drainage feature. The driller's log shows that this well penetrated 16 feet of clayey sand and gravel at depths ranging from 60 to 76 feet and 8 feet of broken rock from 76 to 84 feet before entering solid rock. The well was originally cased into the solid rock. On June 18, 1957, a production test was run, and the well produced 90 gpm with 94 feet of drawdown. The well casing was pulled back; a 20-foot screen was set between 62 and 82 feet, and a gravel pack was placed. On September 17, 1957, another production test was run, and the well produced 351 gpm with 72 feet of drawdown. The well was accepted by the Air Force and connected to the water system. On June 18, 1959, during a 2-hour test, the well produced 430 gpm with 8.4 feet of drawdown. The large increase in specific capacity, gallons per minute per foot of drawdown (table 4), must have been the result of developing the aquifer in the screened interval by pumping and indicates the potential of this aquifer with
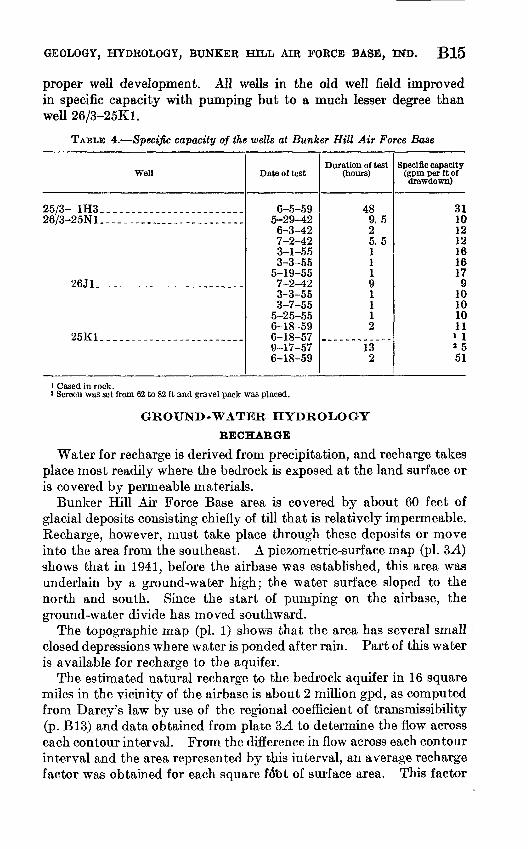
GEOLOGY, HYDROLOGY, BUNKER HILL AIR FORCE BASE, IND. B15
proper well development. All wells in the old well field improved in specific capacity with pumping but to a much lesser degree than weU 26/3-25K1.
TABLE 4. Specific capacity of the wells at Bunker Hill Air Force Base
Well
25/3- 1H3___ _____-_-_---____-___-26/3-25N1.--- --__-_.___--__-.----_
26J1_ _._....____..____._.....
25K1. _.._____._...__.....__.
Date of test
6-5-595-29-426-3-42 7-2-42 3-1-55 3-3-55
5-19-55 7-2-423-3-55 3-7-55
5-25-55 6-18-59 6-18-579-17-57 6-18-59
Duration of test (hours)
489.52 5. 5 1 1 1 91 1 12
13 2
Specific capacity (gpm per ft of drawdown)
311012 12 16 16 17 9
10 10 10 11
» 1» 5 51
i Cased in rock.» Screen was set from 62 to 82 ft and gravel pack was placed.
GROUND-WATER HYDROLOGY
RECHARGE
Water for recharge is derived from precipitation, and recharge takes place most readily where the bedrock is exposed at the land surface or is covered by permeable materials.
Bunker Hill Air Force Base area is covered by about 60 feet of glacial deposits consisting chiefly of till that is relatively impermeable. Recharge, however, must take place through these deposits or move into the area from the southeast. A piezometric-surface map (pi. 3A) shows that in 1941, before the airbase was established, this area was underlain by a ground-water high; the water surface sloped to the north and south. Since the start of pumping on the airbase, the ground-water divide has moved southward.
The topographic map (pi. 1) shows that the area has several small closed depressions where water is ponded after rain. Part of this water is available for recharge to the aquifer.
The estimated natural recharge to the bedrock aquifer in 16 square miles in the vicinity of the airbase is about 2 million gpd, as computed from Darcy's law by use of the regional coefficient of transmissibility (p. B13) and data obtained from plate 2>A to determine the flow across each contour interval. From the difference in flow across each contour interval and the area represented by this interval, an average recharge factor was obtained for each square f6bt of surface area. This factor
B16 CONTRIBUTIONS TO THE HYDROLOGY OF THE UNITED STATES
was applied to the area in the vicinity of the airbase to obtain the estimated rate of natural recharge.
The rocks of Silurian age are the chief source of water for the airbase. These rocks are exposed in Pipe Creek to the north and east (pi. 2). Under natural conditions the creek would not be a source of recharge to this aquifer, because the hydraulic gradient is toward the creek (pi. 3A). Under the conditions of pumping, however, some ground water is intercepted before it can be discharged into the creek (pi. 35).
Recharge to the bedrock aquifer by precipitation can take place in two ways: (1) by slow percolation through the glacial materials, and (2) by lateral movement through the bedrock from some areas at a distance from the airbase. Figure 7 shows that rises in ground-water level lag behind precipitation by at least a month.
DISCHARGE
The natural discharge from the bedrock aquifer is into Pipe Creek and is estimated from the piezometric maps to be about 300,000 gpd for each mile-wide strip of the aquifer in the vicinity of the base. Ground water in the unconsolidated material in the area discharges chiefly into two large ditches which are tributary to Pipe Creek and also dis charges directly into Pipe Creek.
The discharge from the bedrock aquifer by wells in the area is estimated to be about 700,000 gpd. Of this total, about 20,000 gpd is from rural farm wells, about 30,000 from other rural wells, and 650,000 from the airbase wells. During the irrigation season about 100,000 gpd is pumped from well 25/3-3C1 for about 15 days.
FLUCTUATIONS OF WATER LEVELS
The contour map of the piezometric surface for late spring in 1941 (pi. 3A) shows relatively undisturbed conditions in the aquifer and shows a ground-water divide trending northwest-southeast near the south edge of the airbase.
Plate 3B shows the piezometric surface on July 3,1942, during the production test of wells 26/3-25N1 and 26/3-26Jl. At this early date the ground-water divide was beginning to move southward due to the effect of pumping at the air base, as shown by the position of the 790-foot contour.
Plate 3C shows the piezometric surface on June 8, 1959, with the same wells pumping, the cone of depression created by pumping, and some residual effect of previous pumping in well 26/3-25K1. The cone of depression (pi. 3CO changes little, regardless of any combina tion of two wells in the field that may be pumping (pi. 3Z>). Plate 3E shows the piezometric surface at the end of the 48-hour aquifer test in the new well field, June 5, 1959, with well 25/3-1H3 pumping 1,000
GEOLOGY, HYDROLOGY, BUNKER HILL AIR FORCE BASE, IND. BIT
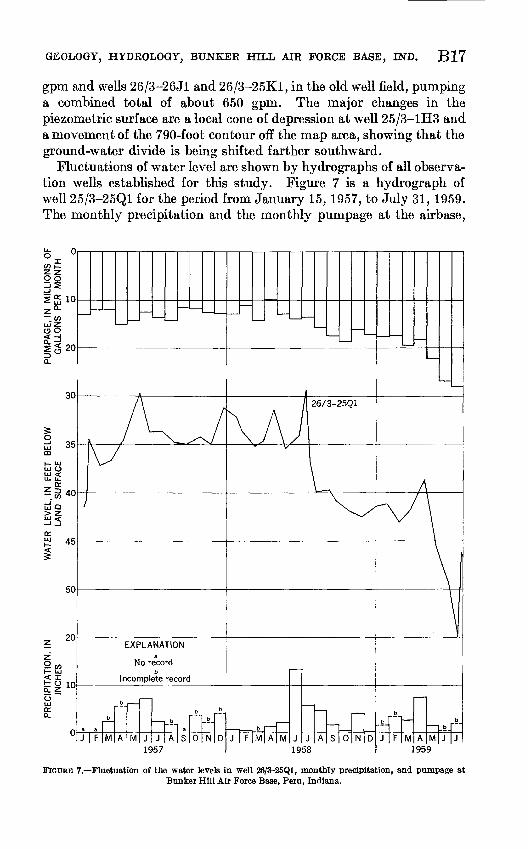
gpm and wells 26/3-26Jl and 26/3-25K1, in the old well field, pumping a combined total of about 650 gpm. The major changes in the piezometric surface are a local cone of depression at well 25/3-1H3 and a movement of the 790-foot contour off the map area, showing that the ground-water divide is being shifted farther southward.
Fluctuations of water level are shown by hydrographs of all observa tion wells established for this study. Figure 7 is a hydrograph of well 25/3-25Q1 for the period from January 15, 1957, to July 31, 1959. The monthly precipitation and the monthly pumpage at the airbase,
2s
10
uJZu o
30
1957 1959
FIGUKE 7. Fluctuation of the water levels in well 26/&-25Q1, monthly precipitation, and pumpage at Bunker Hill Air Force Base, Peru, Indiana.
B18 CONTRIBUTIONS TO THE HYDROLOGY OF THE UNITED STATES
shown by bar diagrams on this figure, directly affect the fluctuation of the water levels. For example, the extreme low of July 1959 is due to the greater-than-normal pumpage and the deficiency of precipita tion in May and June. The rise in water levels in July occurred after the airbase water department stopped all lawn watering, and the pumpage decreased from about 1 million gpd to about 650,000 gpd.
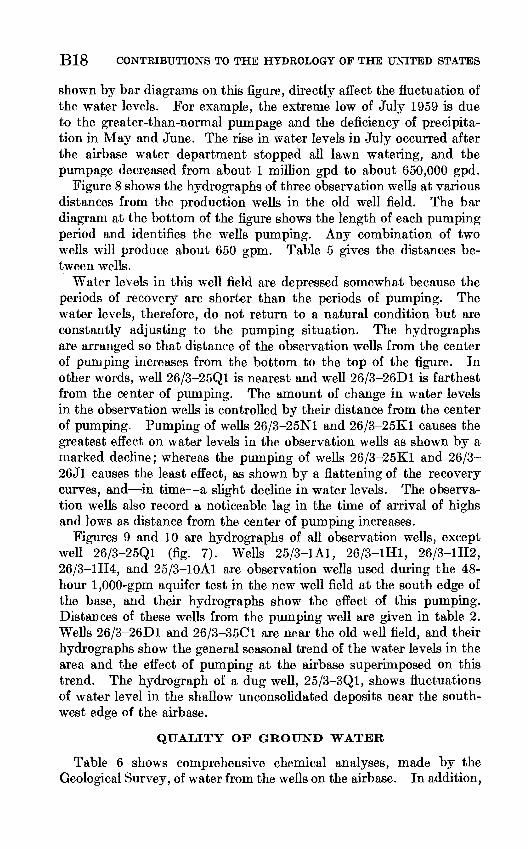
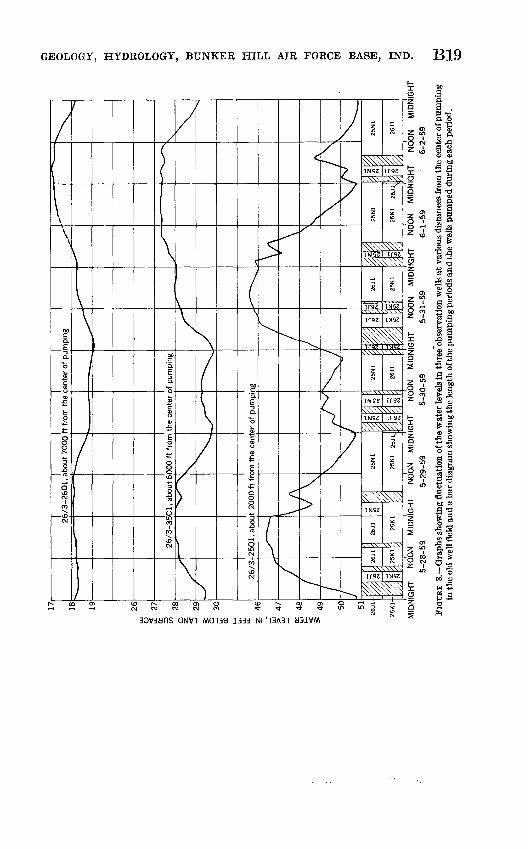
Figure 8 shows the hydrographs of three observation wells at various distances from the production wells in the old well field. The bar diagram at the bottom of the figure shows the length of each pumping period and identifies the wells pumping. Any combination of two wells will produce about 650 gpm. Table 5 gives the distances be tween wells.
Water levels in this well field are depressed somewhat because the periods of recovery are shorter than the periods of pumping. The water levels, therefore, do not return to a natural condition but are constantly adjusting to the pumping situation. The hydrographs are arranged so that distance of the observation wells from the center of pumping increases from the bottom to the top of the figure. In other words, well 26/3-25Q1 is nearest and well 26/3-26D1 is farthest from the center of pumping. The amount of change in water levels in the observation wells is controlled by their distance from the center of pumping. Pumping of wells 26/3-25N1 and 26/3-25K1 causes the greatest effect on water levels in the observation wells as shown by a marked decline; whereas the pumping of wells 26/3-25K1 and 26/3- 26J1 causes the least effect, as shown by a flattening of the recovery curves, and in time a slight decline in water levels. The observa tion wells also record a noticeable lag in the time of arrival of highs and lows as distance from the center of pumping increases.
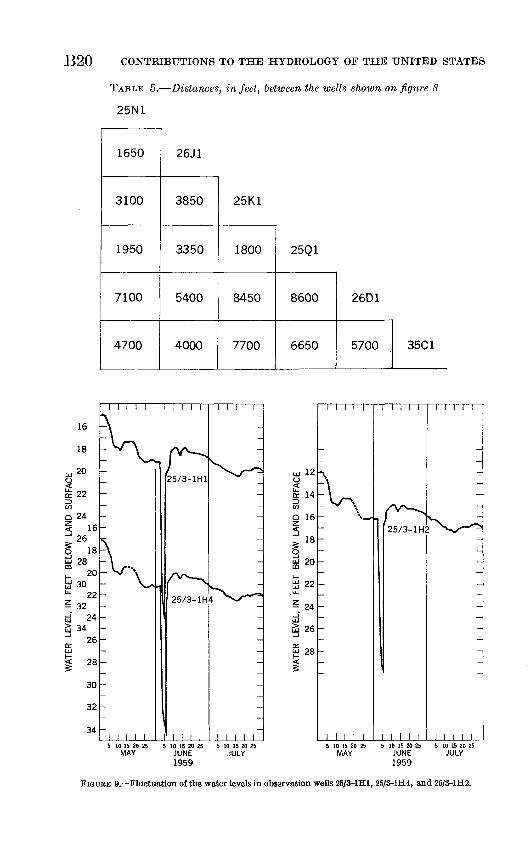
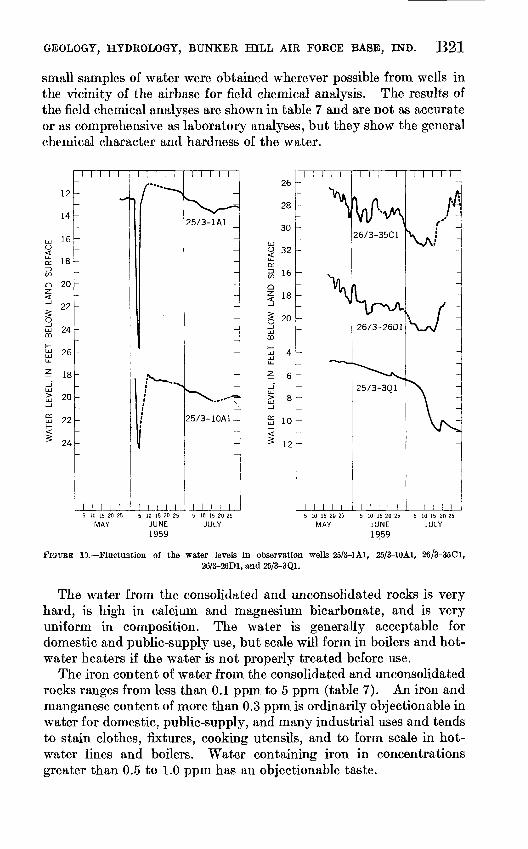
Figures 9 and 10 are hydrographs of all observation wells, except well 26/3-25Q1 (fig. 7). WeUs 25/3-1 Al, 26/3-1H1, 26/3-1H2, 26/3-1H4, and 25/3-10A1 are observation wells used during the 48- hour 1,000-gpm aquifer test in the new well field at the south edge of the base, and their hydrographs show the effect of this pumping. Distances of these wells from the pumping well are given in table 2. Wells 26/3-26D1 and 26/3-35C1 are near the old well field, and their hydrographs show the general seasonal trend of the water levels in the area and the effect of pumping at the airbase superimposed on this trend. The hydrograph of a dug well, 25/3-3Q1, shows fluctuations of water level in the shallow unconsolidated deposits near the south west edge of the airbase.
QUALITY OF GROUND WATER
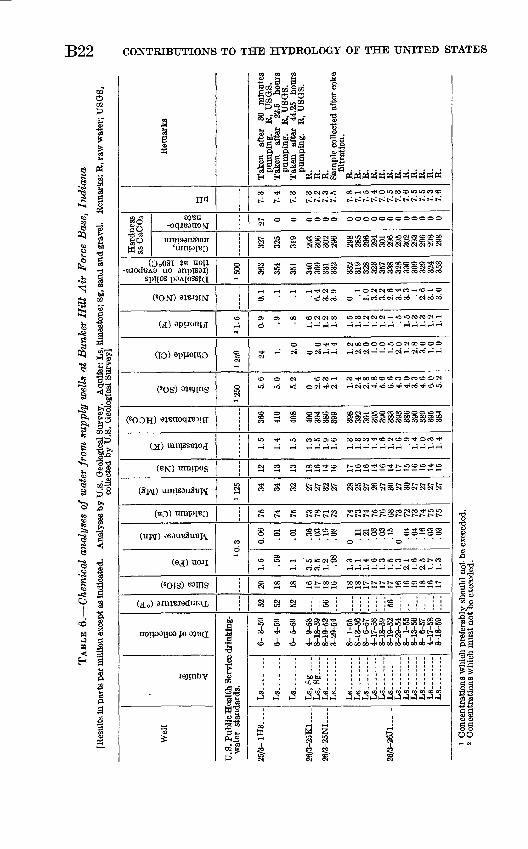
Table 6 shows comprehensive chemical analyses, made by the Geological Survey, of water from the wells on the airbase. In addition,
17 18 19 26U
J u<
27
QL 3
29
I
30
m t UJ
LL. H
46
>
47U
J
CL
AO
uj
t°I- 5
49 50 51
26J1
25K
1-
o
26/3
-26D
1,
abou
t 70
00 f
t fr
om t
he c
ente
r of
pu
26/3
-35C
1,
abou
t 600
0 ft f
rom
the
cent
er o
f pu
mpi
ng
26/3
-25Q
1,
abou
t 20
00 f
t fr
om t
he c
ente
r of
pum
ping
\\
MID
NIG
HT
NO
ON
M
IDN
IGH
T N
OO
N
MID
NIG
HT
NO
ON
M
IDN
IGH
T N
OO
N
MID
NIG
HT
NO
ON
M
IDN
IGH
T N
OO
N
MID
NIG
HT
5-2
8-5
9
5-2
9-5
9
5-3
0-5
9
5-3
1-5
9
6-1
-59
6-2
-59
FIG
URE
8. G
raph
s sh
owin
g fl
uctu
atio
n of
the
wat
er le
vels
in th
ree'
obse
rvat
ion
wel
ls a
t var
ious
dis
tanc
es fr
om th
e ce
nter
of p
umpi
ng
in th
e ol
d w
ell f
ield
and
a b
ar d
iagr
am s
how
ing
the
leng
th o
f the
pum
ping
per
iods
and
the
wel
ls p
umpe
d du
rin
g ea
ch p
erio
d.
B20 CONTRIBUTIONS TO THE HYDROLOGY OF THE UNITED STATES
TABLE 5. Distances, in feet, between the wells shown on figure 8
25N1
1650
3100
1950
7100
4700
26 Jl
3850
3350
5400
4000
25K1
1800
8450
7700
25Q1
8600
6650
26D1
5700 35C1
16
18
20
24
30
34
I I I I I I I I I I I I I I I
25/3-lHl
25/3-1H4
5 10 15 JO 25 5 10 15 20 25 5 10 15 20 25MAY JUNE
1959
uj 12 o
£ 14CO
Q 16
I"£ 20
tj 22
24
26
| 28
1
1 1 1 1 1
I\y\' «_^
-
-
-
-
_
-
1 1 1 1 15 10 15 20 25
MAY
1 1 1 1
/^^^^
25/3-1 H:
1 I 1 15 10 15 20 25
JUNE
1959
1 1 1 1 I
-
\̂**^/^^
-
-
-
-
-
1 1 1 1 15 10 15 20 25
JULY
FIGUEE 9. Fluctuation of the water levels in observation wells 25/3-lHl, 25/3-1H4, and 25/3-1H2.
GEOLOGY, HYDROLOGY, BUNKER HILL AIR FORCE BASE, IND. B21
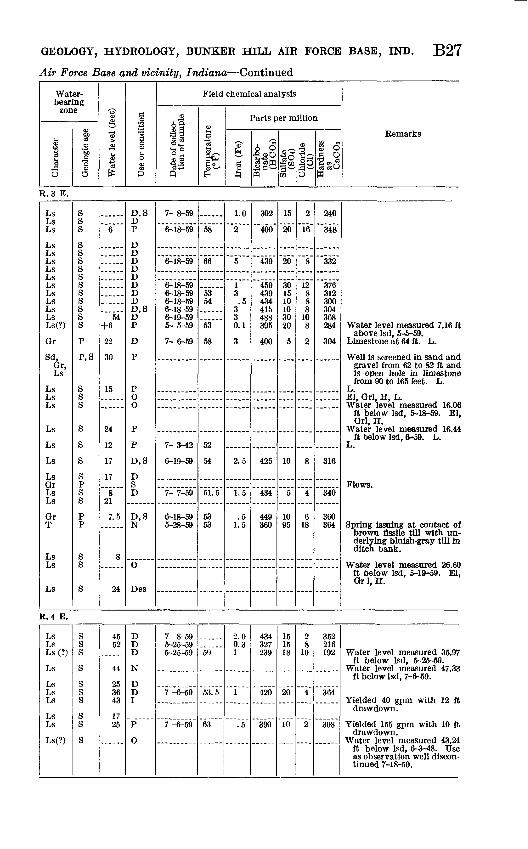
small samples of water were obtained wherever possible from wells in the vicinity of the airbase for field chemical analysis. The results of the field chemical analyses are shown in table 7 and are not as accurate or as comprehensive as laboratory analyses, but they show the general chemical character and hardness of the water.
12
14
16
18
20
22
24
26
18
20
22
24
1 1 1 1 1
~^
-
-
-
-
_
-
-
1 i 1 I )
II > 1
' ^
/ ^
1 1
/
I
1 1 1 1 1
\^25/3-1A1
-
-
-
-
-
-
-
^\ --~_i
25/3-10A1-
-
Mill5 10 15 20 25 6 10 15 ?0 25 5 10 15 20 25
MAY JUNE JULY1959
18
20
I I I I I
26/3-35C1
26/3-26D1
25/3-3Q1
f'
5 10 15 20 25 5 10 15 20 25 5 10 15 20 25
MAY JUNE JULY 1959
FIGURE 13. Fluctuation of the water levels in observation wells 25/3-1A1, 25/3-10A1,26/3-26D1, and 25/3-3Q1.
3-35C1,
The water from the consolidated and unconsolidated rocks is very hard, is high in calcium and magnesium bicarbonate, and is very uniform in composition. The water is generally acceptable for domestic and public-supply use, but scale will form in boilers and hot- water heaters if the water is not properly treated before use.
The iron content of water from the consolidated and unconsolidated rocks ranges from less than 0.1 ppm to 5 ppm (table 7). An iron and manganese content of more than 0.3 ppm is ordinarily objectionable in water for domestic, public-supply, and many industrial uses and tends to stain clothes, fixtures, cooking utensils, and to form scale in hot- water lines and boilers. Water containing iron in concentrations greater than 0.5 to 1.0 ppm has an objectionable taste.
TAB
LE 6
. C
hem
ical
ana
lyse
s of
wat
er f
rom
sup
ply
wel
ls a
t B
unke
r H
ill
Air
For
ce B
ase,
Ind
iana
[Res
ults
in p
arts
per
mill
ion
exce
pt a
s in
dica
ted.
A
naly
ses b
y U
.S. G
eolo
gica
l Sur
vey.
A
quife
r: Ls
, lim
esto
ne; S
g, s
and
and
grav
el.
Rem
arks
: R, r
aw w
ater
; USQ
S,co
llect
ed b
y U
.S.
Geo
logi
cal S
urve
y]
Wel
lt-i '3 o1
Date
of
collection
U.S
. Pub
lic H
ealth
Ser
vice
dri
nkin
g-
wat
er s
tand
ards
.
25/3
- 1H
3....
26
/3-2
5K
1
26/3
-25N
1
26
/3-2
6J1
-.
Ls-
---
Ls-
---
Ls,
Sg
....
. L
s, S
g -
.
Ls-
.-
Ls..
..
-L
s-._
Ls-
--
Ls--
-- -
Ls-
---
Ls
Ls..
-.
-L
s---
Ls-
---
Ls..
-.
6- 3
-59
6- 4
-59
6- 5
-59
4- 9
-58
8-18
-59
8-19
-52
3-29
-54
8- 1
-55
8-13
-56
8-6
-57
4-17
-58
8-18
-59
8-19
-52
3-29
-54
8- 1
-55
8-13
-56
8- 6
-57
4-17
-58
8-18
-59
Temperature
(°F) 52
52
52 ~5(T
~56~
0 S, C8 3 CO 20
18
18 16
17
18
16 18
18
17
17
17
17
16
16
19
18
16
17
Iron
(Fe)
Manganese
(Mn)
JO. 3
1.5 .59
1.1
3.5
3.5
1.2 .98
1.3
1.1
1.4
1.6
1.3
1.5
1.3
2.1
1.6
2.5
1.7
1.3
0.06
.01
.01
.36
.03
.19
.08
0 .11
.21
.03
.03
.15
0 .04
.04
.16
.03
.03
Calcium
(Ca)
75
74
75 73 78
71
73 74
73
74
75
76
68
73
72
73
74
75
75
Magnesium
(Mg)
i 12
5 34
34
32 27
27
32
27 28
25
27
26
27
30
27
30
27
27
27
27
'as 5. K CO 12
13
13 18
16
14
16 17
16
16
14
16
14
17
15
16
15
14
15
Potassium
(K) 1.5
1.4
1.5
1.3
1.5
1.9
1.6
1.3
1.3
1.3
1.4
1.6
1.2
1.6 .9
1.4
1.0
1.3
1.4
Bicarbonate
(HCO3) 366
410
408
400
394
386
399
398
392
391
395
390
383
393
386
390
389
395
384
Sulfate
(SO4)
1250 5.
6
5.0
5.2
0 2.6
4.3
2.1
1.3
2.4
2.8
4.8
5.6
6.6
4.3
4.0
3.3
4.6
6.0
5.2
Chloride
(Cl)
1250 24
1. 2.0
0 2.0
1.4
1.4
1.2
2.8
2.0
1.0
1.0
1.5
2.0
1.2
2.8
3.0
1.0
1.0
Fluoride
(F)
si.
5
0.9 .9
.8 1.6
1.2
1.2
1.8
1.5
1.3
1.2
1.2
1.2
1.1 .5
1.5
1.3
1.3
1.2
1.1
Nitrate
(NO3) 0.1 .1
.1 .1
6.4
3.2
3.9
0 .1
1.0
3.2
3.2
2.6
3.4
3.3 .1
2.6
3.1
3.0
Dissolved
solids (resid
ue on evapora tion
at
180°C
)
1500 36
3
354
351
340
369
331
332
332
319
328
323
357
338
328
330
309
329
324
358
Har
dnes
s as
CaC
Os
^ 327
325
319
293
306
302
296
298
285
296
294
301
296
295
302
293
296
298
298
n =s
o n
27 0 0 0 0 0 0 0 0 0 0 0 0 0 0 0 0 0 0
w a 7.3
7.4
7.3
7.3
7.2
7.3
7.5
7.8
7.1
7.5
7.4
7.0
7.5
7.3
7.6
7.5
7.5
7.3
7.6
Rem
arks
Tak
en
afte
r 30
m
inut
es
pum
ping
. R
, U
SGS.
T
aken
af
ter
22.5
ho
urs
pum
ping
. R
, USG
S.
Tak
en
afte
r 44
.26
hour
s pu
mpi
ng.
R,
USG
S.
R.
R.
R.
Sam
ple
colle
cted
afte
r co
ke
filtr
atio
n.
R.
R.
R.
R.
R.
R.
R.
R.
R.
R.
R.
R.
w to
to
1 C
once
ntra
tions
whi
ch p
refe
rabl
y sh
ould
not
be
exce
eded
.2
Con
cent
ratio
ns w
hich
mus
t not
be
exce
eded
.
GEOLOGY, HYDROLOGY, BUNKER HILL AIR FORCE BASE, IND. B23
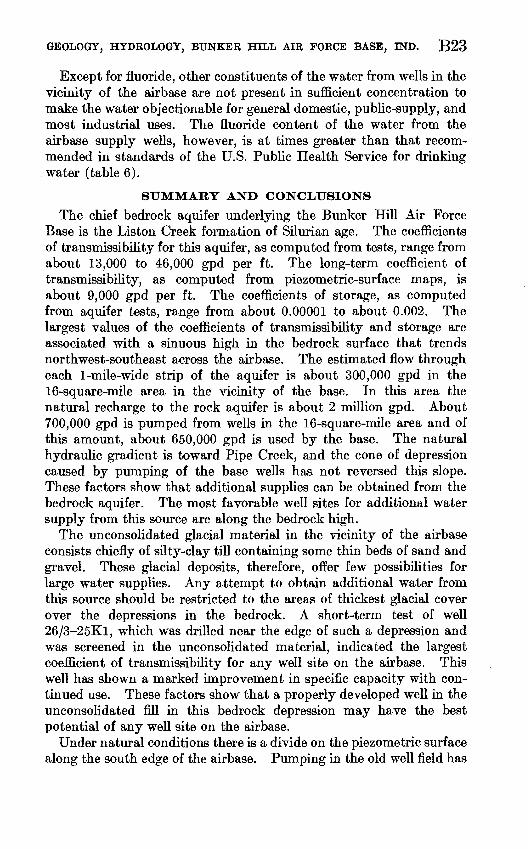
Except for fluoride, other constituents of the water from wells in the vicinity of the airbase are not present in sufficient concentration to make the water objectionable for general domestic, public-supply, and most industrial uses. The fluoride content of the water from the airbase supply wells, however, is at times greater than that recom mended in standards of the U.S. Public Health Service for drinking water (table 6).
SUMMARY AND CONCLUSIONS
The chief bedrock aquifer underlying the Bunker Hill Air Force Base is the Liston Creek formation of Silurian age. The coefficients of transmissibility for this aquifer, as computed from tests, range from about 13,000 to 46,000 gpd per ft. The long-term coefficient of transmissibility, as computed from piezometric-surface maps, is about 9,000 gpd per ft. The coefficients of storage, as computed from aquifer tests, range from about 0.00001 to about 0.002. The largest values of the coefficients of transmissibility and storage are associated with a sinuous high in the bedrock surface that trends northwest-southeast across the airbase. The estimated flow through each 1-mile-wide strip of the aquifer is about 300,000 gpd in the 16-square-mile area in the vicinity of the base. In this area the natural recharge to the rock aquifer is about 2 million gpd. About 700,000 gpd is pumped from wells in the 16-square-mile area and of this amount, about 650,000 gpd is used by the base. The natural hydraulic gradient is toward Pipe Creek, and the cone of depression caused by pumping of the base wells has not reversed this slope. These factors show that additional supplies can be obtained from the bedrock aquifer. The most favorable well sites for additional water supply from this source are along the bedrock high.
The unconsolidated glacial material in the vicinity of the airbase consists chiefly of silty-clay till containing some thin beds of sand and gravel. These glacial deposits, therefore, offer few possibilities for large water supplies. Any attempt to obtain additional water from this source should be restricted to the areas of thickest glacial cover over the depressions in the bedrock. A short-term test of well 26/3-25K1, which was drilled near the edge of such a depression and was screened in the unconsolidated material, indicated the largest coefficient of transmissibility for any well site on the airbase. This well has shown a marked improvement in specific capacity with con tinued use. These factors show that a properly developed well in the unconsolidated fill in this bedrock depression may have the best potential of any well site on the airbase.
Under natural conditions there is a divide on the piezometric surface along the south edge of the airbase. Pumping in the old well field has
B24 CONTRIBUTIONS TO THE HYDROLOGY OF THE UNITED STATES
moved this divide southward, and the pumping during the test of the new well field had moved it even further southward. Pumping in the old well field and the new well field affects wells beyond the base. Additional wells drilled for large water supplies will markedly affect the water levels in domestic and farm wells in the area. These con ditions warrant a continuation of the observation-well program in the area and the running of aquifer tests on new large supply wells.
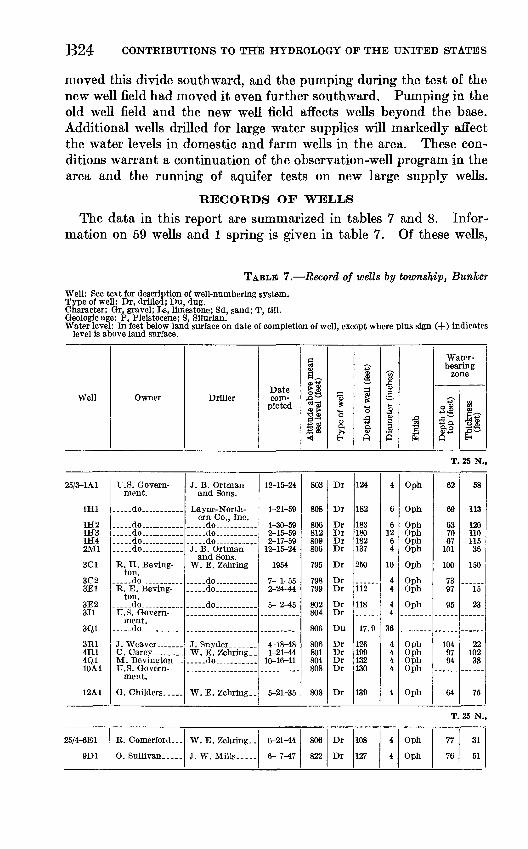
RECORDS OF WELLS
The data in this report are summarized in tables 7 and 8. Infor mation on 59 wells and 1 spring is given in table 7. Of these wells,
TABLE 7. Record of wells by township, BunkerWell: See text for description of well-numbering system. Type of well: Dr, drilled; Du, dug. Character: Gr, gravel; Ls, limestone; Sd, sand; T, till. Geologic age: P, Pleistocene; S. Silurian.Water level: In feet below land surface on date of completion of well, except where plus sign (+) indicates
level is above land surface.
Well Owner DrillerDate com
pleted
1gfD * *
ll
4> > gS
3 a
iu1S
-*^
1"3,g a0?
fi
'S'
fl
I
fe<s>
S«1
Waterbearing
zone
^^°"1
S»
^
%
llrT. 25 N.,
25/3-1A1
1H1
1H21H31H42M1
3C1
3023E1
3E23J1
3Q1
3E14H14Q110 A 1
12A1
U.S. Govern ment.
.....do....... _ .
do .__..._._ do_ .____ __. .do..........-..-.do.. ......
R. H. Beving- ton.
.....do..... ......R. E. Beving-
ton. - do ......
ment. .-...do ...... ..
J. Weaver _ ....C. Carey__ _ ...
U.S. Government.
G. Childers. _ .
J. B. Ortman and Sons.
ern Co., Inc. ..... do ...... ..do .....do .......
and Sons. W. E. Zehring
-..-do ..........-do .... ....
-. do ......
W. E. Zehring..
12-15-24
1-21-59
1-30-592-15-592-17-59
12-15-24
1954
7- 1-552-24-44
5- 2-45
4-18-481-21-44
10-16-41
5-21-35
803
808
806812809806
795
798799
802804
806
806801804808
808
Dr
Dr
DrDrDrDr
Dr
DrDr
DrDr
Du
DrDrDrDr
Dr
124
182
183180182137
250
112
118
17.9
126199132130
139
4
6
61264
10
44
44
36
4444
4
Oph
Oph
OphOphOphOph
Oph
OphOph
Oph
OphOphOphOph
Oph
62
69
637067
101
100
7397
95
1049794
64
58
113
12011011536
150
15
23
2210238
75
T. 25 N.,
25/4-6E1
9D1
R. Comerford ...
O. Sullivan.. ...
W. E. Zehring..
J. W. Mills.....
6-21-44
6- 7-47
806
822
Dr
Dr
108
127
4
4
Oph
Oph
77
76
31
51
GEOLOGY, HYDROLOGY, BUNKER HILL AIR FORCE BASE, IND. B25
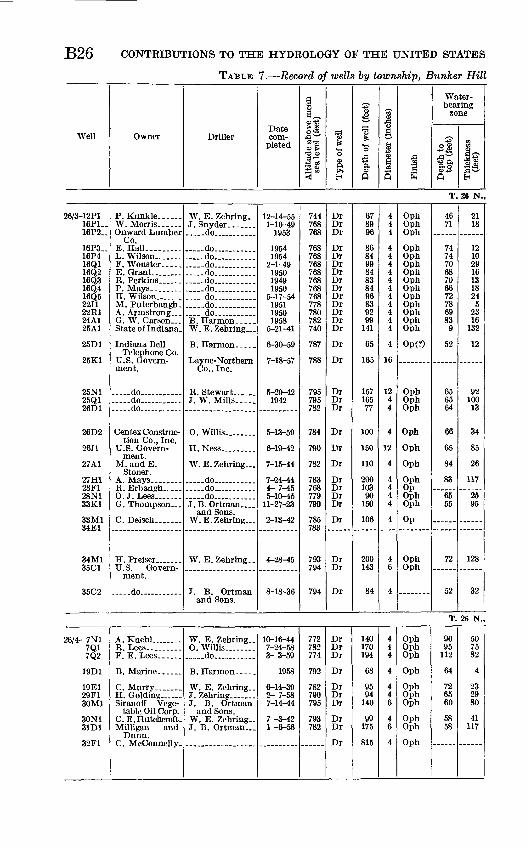
24 are domestic or stock wells, 8 are public-supply wells, 12 are observation wells, I is an irrigation well, 1 is an industrial well, and 13 are unused or their use is unknown. Table 7 gives the locations, owners, and drillers and, in addition, gives pertinent information about wells, water-bearing materials, water levels, results of field chemical analysis, and other available data.
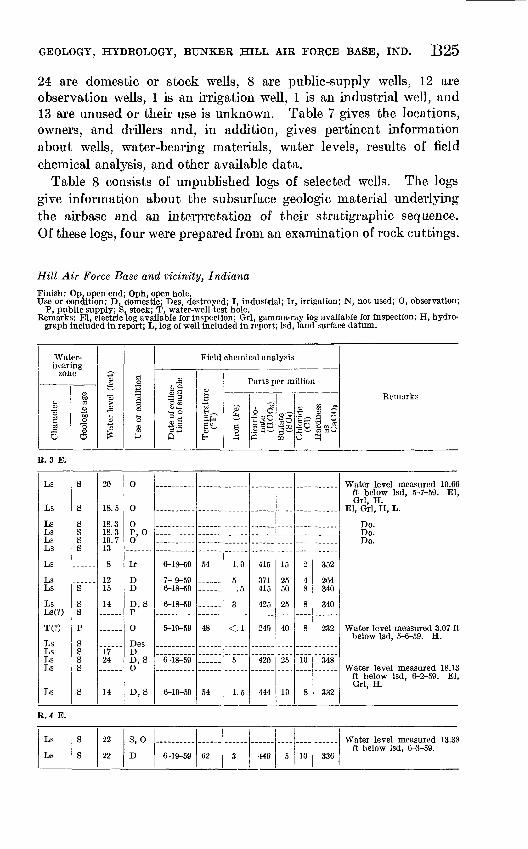
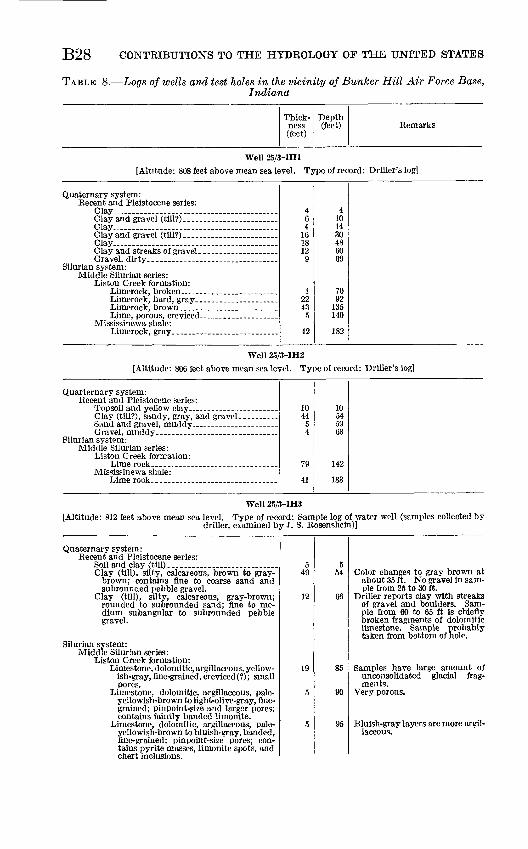
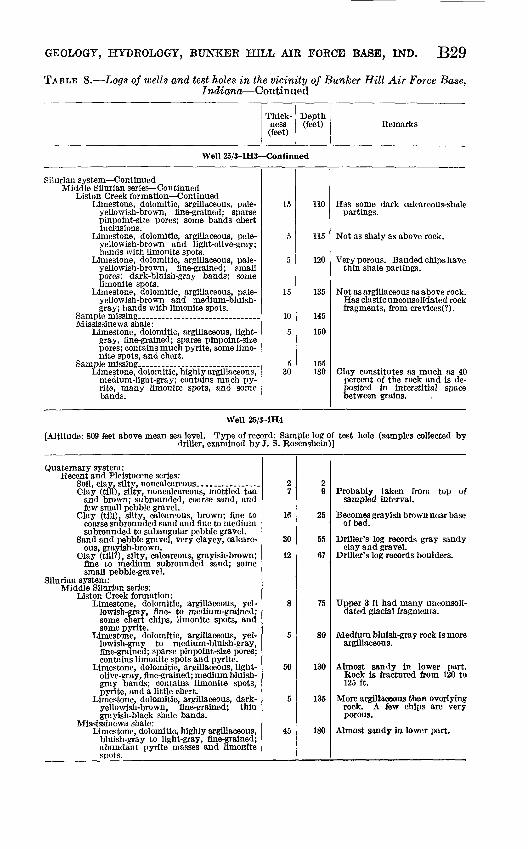
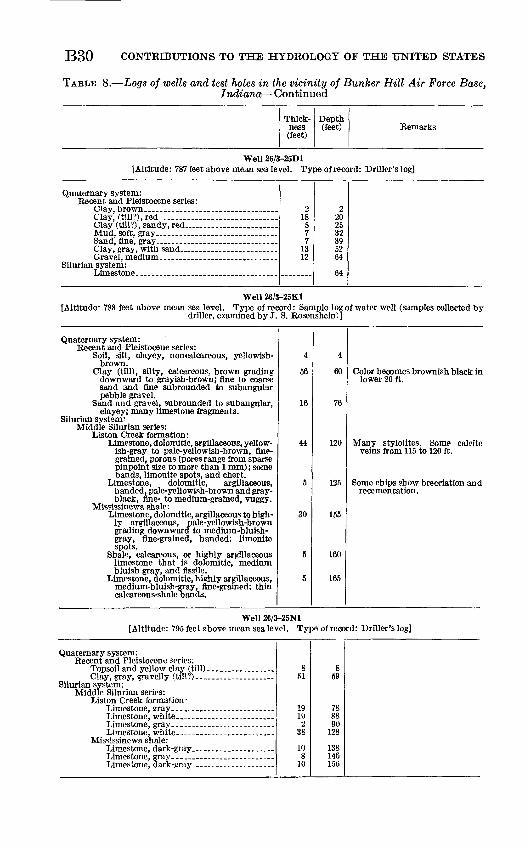
Table 8 consists of unpublished logs of selected wells. The logs give information about the subsurface geologic material underlying the airbase and an interpretation of their stratigraphic sequence. Of these logs, four were prepared from an examination of rock cuttings.
Hill Air Force Base and vicinity, Indiana
Finish: Op, open end; Oph, open hole.Use or condition: D, domestic; Des, destroyed; I, industrial; Ir, irrigation; N, not used; 0, observation;
P, public supply; S, stock; T, water-well test hole.Remarks: El, electric log available for inspection; Grl, gamma-ray log available for inspection; H, hydro-
graph included in report; L, log of well included in report; Isd, land surface datum.
Waterbearing
zone
1a0
toOS
_o 'So
"o
o
J21
*®
1
£
£ o
!ffl^
Field chemical analysis
5£sO w
°«S§
Q
«"̂S
^H
S°
S
Parts per million
S
1o O
03 'Sy«
«-5
"~M
CQIBo
I 8"2 to "3
W
Remarks
R. 3 E.
Ls
Ls
LsLsLsLs
Ls
Ls Ls
Ls Ls(?)
T(?)
LsLsLs Ls
Ls
S
S
SSSS
"s~~"
S S
PSSS S
S
20
18.5
18.318.319.713
8
12 15
14
1724
14
0
0
OP, 00
Ir
D D
D, S P
0
DesDD, S O
D, S
6-18-59
7- 9-59 6-18-59
6-18-59
5-19-59
6-18-59
6-19-59
54
48
54
1.0
5 .5
3
<.l
5
1.5
415
371 415
425
249
420
444
15
25 50
25
40
25
10
2
48
8
8
10
8
352
264 340
340
232
348
332
Water level measured 10.66ft below Isd, 5-7-59. El, Grl, H.
El, Grl, H, L.
Do.Do.Do.
Water level measured 3.07 ft below Isd, 5-6-59. H.
ft below Isd, 6-2-59. El, Grl, H.
R. 4 E.
Ls
Ls
S
S
22
22
8,0
D 6-19-59 62 3 449 5 10 336ft below Isd, 6-3-59.
B26 CONTRIBUTIONS TO THE HYDROLOGY OF THE UNITED STATES
TABLE 7. Record of wells by township, Bunker Hill
Well Owner DrillerDate com
pleted
§ag-Kt> S SS-*-3 o> >
73 0)
s*53 a)q"
1&"3
1frH
<O O
1"3
5 aS Q
SA
IS"g
1S
J3M as
Waterbearing
zone
515 a fto«*»
Q
SSi?|$_Q >«'
P
T. 26 N.,
26/3-12P116P1-16P2..
16P3_.16P416Q116Q216Q316Q416Q522J122R124A125A1
25D1
25K1
25N125Q126D1
26D2
26J1
27A1
27H128F128N133K1
33M134E1
34M135C1
SI?P9
P. Kunkle... W. Morris.. ....Onward Lumber
Co.E. Hall . L. Wilson .......F. Wouster.....E. Grant ........R. Perkins ......P. Mays-. ......H. Wilson _ ....M. Puterbaugh.A. Armstrong ...G. W. Carson _State of Indiana .
Indiana BellTelephone Co.
ment.
do. .... -do. _ .. do..........
Centex Construction Co., Inc.
U.S. Government.
M. and E. Stoner.
O.J.Lees.......G. Thompson ...
ment.
do......... ..
..... do..
... ..do. .......
.... . do
.... -do... ..... do - do . ... -do... ............. do... ... ...... .do .......B. Hannon...-.W. E. Zehring...
Co., Inc.
J. W. Mills.. ...
O. Wlllis-.-. ....
H. Ness.........
W. E. Zehring ...
. .do ....
.. do........... do J.B. Ortman ....
and Sons.
W. E. Zehring..
and Sons.
12-14-551-10-49
1953
19541954
2-1-49195019491950
5-17-54195119501958
5-21-41
6-30-59
7-18-57
5-29-421942
5-13-59
6-19-42
7-15-44
7-24-444- 7-455-10-45
11-27-23
2 io_4o
4-28-45
8-18-36
744768768
768768768768768768768778780782740
787
788
795795782
784
790
782
783768779790
785783
793794
794
DrDrDr
DrDrDrDrDrDrDrDrDrDrDr
Dr
Dr
DrDrDr
Dr
Dr
Dr
DrDrDrDr
Dr
DrDr
Dr
678996
86849984838496839299
141
65
165
15716577
100
150
110
20010390
150
106
200143
84
444
44444444444
4
16
1?,44
4
1?
4
4444
4
46
4
OphOphOph
OphOphOphOphOphOphOphOphOphOphOph
Op(?)
OphOphOph
Oph
Oph
Oph
OphOpOphOph
Op
OphOph
4671
74747068706672786983
9
52
656564
66
65
84
83
6555
72
52
2118
121029161318245
2316
132
12
92100
13
34
85
26
117
2595
128
32
T. 26 N.,
26/4- 7N17Q17Q2
19D1
19E129F130 Ml
30N1 31D1
32F1
A. Kuehl... B. Lees.. ___F. E. Lees......
B. Marine. .....
Siranoff Vege table Oil Corp.
C. E.Hutchcroft- Milligan and
Dunn.
W. E. Zehring O. Willis.. .......-do .
W. E. Zehring..J. Zehring .......J. B. Ortman
and Sons. W. E. Zehring.. J. B. Ortman ...
10-16-447-24-583-3-59
1958
6-14-392- 7-587-14-44
7 -3-42 1 -6-56
772782774
792
782790795
793782
DrDrDr
Dr
DrDrDr
Dr Dr
Dr
140170194
68
9594
140
99 175
815
444
4
446
4 6
4
OphOphOph
Oph
OphOphOph
Oph Oph
Oph
9095
112
64
726560
58 58
507582
4
232980
41117
GEOLOGY, HYDROLOGY, BUNKER HILL AIR FORCE BASE, IND. B27
Air Force Base and vicinity, Indiana Continued
Water bearing
zone
CharacterGeologic age
Water level (feet) _o 3§S 8 P
Field chemical analysis
Date of collec tion of sample Temperature
(or)
Parts per million
/"&.
1
Bicarbo nate
(HCOs)
HOQ
Chloride (Cl)Hardness
as
CaCOs
Eemarks
R. 3 E.
LsLsLs
LsLsLsLsLsLsLsLsLsLsLs(?)
Gr
Sd,Or,Ls
LsLsLs
Ls
Ls
Ls
LsGrLs Ls
GrT
LsLs
Ls
SSS
sssssssssss pP,S
sss
ssssps sp p
ss
s
6
54+6
22
30
15
24
12
17
17
8 21
7.5
8
24
D,SDP
DDDDDDDDD,SDP
D
P
POO
P
P
D,S
DSD
D,SN
O
Des
7-8-59
6-18-59
6-18-59
6-18-596-18-596-18-596-18-596-19-595- 5-59
7- 6-59
7-3-42
6-19-59
7- 7-59
6-18-59 5-28-59
58
66
5354
53
58
52
54
51.5
53 53
1.0
2
5
13.5
330.1
3
2.5
1.5
.5 1.5
302
400
439
459439434416488395
400
425
434
449 360
15
20
20
301510103020
5
10
5
1095
2
16
8
12888
108
2
8
4
6 18
240
348
332
376312300304368284
304
316
340
360 364
Water level measured 7.16 ft above Isd, 5-6-59.
Limestone at 64 ft. L.
gravel from 62 to 82 ft and is open hole in limestone from 90 to 165 feet. L.
L.El, Qrl, H, L.
ft below Isd, 5-18-59. El, Grl, H.
ft below Isd, &-59. L. L.
Flows.
Spring issuing at contact of brown fissile till with un derlying bluish-gray till in ditch bank.
Water level measured 26.60ft below Isd, 5-19-59. El, Or 1, H.
R. 4 E.
LsLs Ls(?)
Ls
LsLs Ls
LsLs
Ls(?)
S Ss sss sss s
45 52
44
2536 43
1725
D D D
N
DDI
P
O
7 -8-59 5-25-59 5-25-59
7 -6-59
7 -6-59
I1 )"""
515.5
6J
2.0 0.3 1
1
.5
434327 239
420
390
15 15 18
20
10
2 S
10
4
2
352 216 192
364
308
Water level measured 35.97 ft below Isd, 5-25-59.
Water level measured 47.33ft below Isd, 7-6-59.
Yielded 40 gpm with 12 ftdrawdown.
Yielded 155 gpm with 10 ft drawdown.
ft below Isd, 6-3-48. Use as observation well discon tinued 7-18-50.
B28 CONTRIBUTIONS TO THE HYDROLOGY OF THE UNITED STATES
TABLE 8. Logs of wells and test holes in the vicinity of Bunker Hill Air Force Base,Indiana
Thick ness (feet)
Depth (feet) Remarks
Well 25/3-1H1[Altitude: 808 feet above mean sea level. Type of record: Driller's log]
Quaternary system:Recent and Pleistocene series:
Clay....... ......... ..Clay and gravel (till?).....Clay....... . . Clay and gravel (till?). Clay.-.. . Clay and streaks of gravel-. Gravel, dirty.._______
Silurian system:Middle Silurian series:
Listen Creek formation: Limerock, broken......Limerock, bard, gray.. Limerock, brown......Lime, porous, creviced-
Mississinewa shale:Limerock, gray....-...
7092
135140
182
Well 25/3-1H2[Altitude: 806 feet above mean sea level. Type of record: Driller's log]
Quarternary system: Recent and Pleistocene series:
Silurian system: Middle Silurian series:
Liston Creek formation:
Mississinewa shale:
1044
54
79
41
10545963
142
183
Well 25/3-1H3{Altitude: 812 feet above mean sea level. Type of record: Sample log of water well (samples collected by
driller, examined by J. S. Rosenshein)]
Quaternary system:Recent and Ploistocene series:
Soil and clay (till) . ... ....Clay (till), silty, calcareous, brown to gray-
brown; contains fine to coarse sand andsubrounded pebble gravel.
Clay (till), silty, calcareous, gray-brown;rounded to subrounded sand; fine to medium subangular to subrounded pebblegravel.
Silurian system:Middle Silurian series:
Liston Creek formation:Limestone, dolomitic, argillaceous, yellow
ish-gray, fine-grained, creviced (?); smallpores.
Limestone, dolomitic, argillaceous, pale-yellowish-brown to light-olive-gray, finegrained; pinpoint-size and larger pores;contains faintly banded limonite.
Limestone, dolomitic, argillaceous, pale-yellowish-brown to bluish-sray, banded,fine-grained; pinpoint-size pores; contains pyrite masses, limonite spots, andchert inclusions.
549
12
19
5
5
554
66
85
90
95
Color changes to gray brown atabout 35 ft. No gravel in sample from 25 to 30 ft.
Driller reports clay with streaksof gravel and boulders. Sample from 60 to 65 ft is chieflybroken fragments of dolomiticlimestone. Sample probablytaken from bottom of hole.
Samples have large amount ofunconsolidated glacial fragments.
Very porous.
Bluish-gray layers are more argillaceous.
GEOLOGY, HYDROLOGY, BUNKER HILL AIR FORCE BASE, IND. B29
TABLE 8. Logs of wells and test holes in the vicinity of Bunker Hill Air Force Base,Indiana Continued
Thick ness (feet)
Depth(feet) Remarks
Well 25/3-1H3 Continued
Silurian system ContinuedMiddle Silurian series Continued
Liston Creek formation ContinuedLimestone, dolomitic, argillaceous, pale-
yellowish-brown, fine-grained; sparse pinpoint-size pores; some bands chert inclusions.
Limestone, dolomitic, argillaceous, pale- yellowish-brown and light-olive-gray; bands with limonite spots.
Limestone, dolomitic, argillaceous, pale- yellowisn-brown, fine-grained; small pores; dark-bluish-gray bands; some limonite spots.
Limestone, dolomitic, argillaceous, pale- yellowish-brown and medium-bluish- gray; bands with limonite spots.
Sample missing_________________. Mississinewa shale:
Limestone, dolomitic, argillaceous, light- gray, fine-grained; sparse pinpoint-size pores; contains much pyrite, some limo nite spots, and chert.
Sample missing_________.______.. Limestone, dolomitic, highly argillaceous,
medium-light-gray; contains much py rite, many limonite spots, and some bands.
110
115
120
135
145
150
155180
Has some dark calcareous-shale partings.
Not as shaly as above rock.
Very porous. Banded chips have thin shale partings.
Not as argillaceous as above rock. Has clastic unconsolidated rock fragments, from crevices(7).
Clay constitutes as much as 40 percent of the rock and is de posited in interstitial between grains.
Well 25/3-1H4
[Altitude: 809 feet above mean sea level. Type of record: Sample log of test hole (samples collected by driller, examined by J. 8. Rosenshein)]
Quaternary system:Recent and Pleistocene series:
Soil, clay, silty, noncalcareous--. _ ... __ ..Clay (till), silty, noncalcareous, mottled tan
and brown; subrounded, coarse sand, andfew small pebble gravel.
Clay (till), silty, calcareous, brown; fine to coarse snbrounded sand and fine to mediumsubrounded to subangular pebble gravel.
Sand and pebble gravel, very clayey, calcareous, grayish-brown.
Clay (till?), silty, calcareous, grayish-brown;fine to medium subrounded sand; somesmall pebble-gravel.
Silurian system:Middle Silurian series:
Liston Creek formation:Limestone, dolomitic, argillaceous, yel
lowish-gray, fine- to medium-grained;some chert chips, limonite spots, andsome pyrite.
Limestone, dolomitic, argillaceous, yellowish-gray to medium-bluish-gray,fine-grained; sparse pinpoint-size pores;contains limonite spots and pyrite.
Limestone, dolomitic, argillaceous, light- olive-gray, fine-grained; medium bluish-gray bands; contains limonite spots,pyrite, and a little chert.
Limestone, dolomitic, argillaceous, dark- yellowish-brown, fine-grained; thin grayish-black shale bands.
Mississinewa shale:Limestone, dolomitic, highly argillaceous,
bluish-gray to light-gray, fine-grained;abundant pyrite masses and limonitespots.
27
16
30
12
8
5
50
5
45
29
25
55
67
75
80
130
135
180
Probably taken from top ofsampled interval.
Becomes grayish brown near base of bed.
Driller's log records gray sandyclay and gravel.
Driller's log records boulders.
Upper 3 ft had many unconsolidated glacial fragments.
Medium bluish-gray rock is moreargillaceous.
Almost sandy in lower part. Bock is fractured from 120 to125 ft.
More argillaceous than overlying rock. A few chips are very porous.
Almost sandy in lower part.
B30 CONTRIBUTIONS TO THE HYDROLOGY OF THE UNITED STATES
TABLE 8. Logs of wells and test holes in the vicinity of Bunker Hill Air Force Base,Indiana Continued
Thick ness (feet)
Depth(feet) Remarks
Well 26/3-25D1[Altitude: 787 feet above mean sea level. Type of record: Driller's log]
Quaternary system: Recent and Pleistocene series:
Clay, ftm?), red- .- ___ _,_______ ___ ...Clay (till?), sandy, red. _ . _________
Silurian system:
218577
1312
2202532395264
64
Well 26/3-25K1[Altitude: 788 feet above mean sea level. Type of record: Sample log of water well (samples collected by
driller, examined by J. S. Rosenshein)]
Quaternary system:Recent and Pleistocene series:
Soil, silt, clayey, non calcareous, yellowish-brown.
Clay (till), silty, calcareous, brown gradingdownward to grayish-brown; fine to coarsesand and fine subrounded to subangularpebble gravel.
Sand and gravel, subrounded to subangular, clayey; many limestone fragments.
Silurian system:Middle Silurian series:
Listen Creek formation:Limestone, dolomitic, argillaceous, yellow
ish-gray to pale-yellowish-brown, finegrained, porous (pores range £rom sparsepinpoint size to more than 1 mm); somebands, limonite spots, and chert.
Limestone, dolomitic, argillaceous,banded, pale-yellowish -biown and gray-black, fine- to medium-grained, vuggy.
Mississinewa shale:Limestone, dolomitic, argillaceous to high
ly argillaceous, pale-yellowish-browngrading downward to medium-bluish-gray, fine-grained, banded; limonitespots.
Shalo, calcareous, or highly arfdllaeeouslimestone that is dolomitic, mediumbluish gray, and fissile.
Limestone, dolomitic, highly argillaceous,medium-bluish-gray, fine-grained; thincalcareous-shale bands.
4
56
16
44
5
30
5
5
4
60
76
120
125
155
160
165
Color becomes brownish black inlower 20 ft.
Many stylolites. Some calcite veins from 115 to 120 ft.
Some chips show breeciation andre cementation.
Well 26/3-25N1 [Altitude: 795 feet above mean sea level. Type of record: Driller's log]
Quaternary system: Recent and Pleistocene series:
Silurian system: Middle Silurian series:
Listen Creek formation
Mississinewa shale:
851
191U2
38
108
10
859
788890
128
138146156
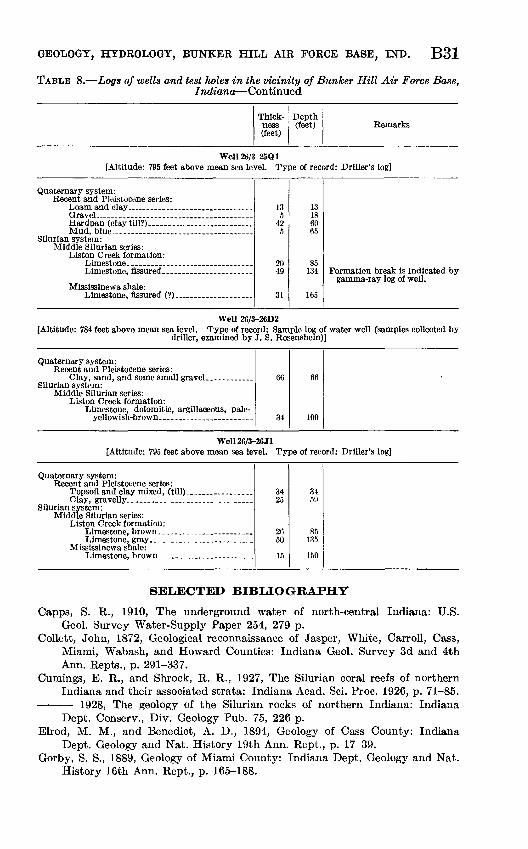
GEOLOGY, HYDROLOGY, BUNKER HILL AIR FORCE BASE, IND. B31
TABLE 8. Logs of wells and test holes in the vicinity of Bunker Hill Air Force Base,Indiana Continued
Thickness(feet)
Depth(feet) Remarks
Well 26/3-25Q1[Altitude: 795 feet above mean sea level. Type of record: Driller's log]
Quaternary system: Recent and Pleistocene series:
Hardpan (clay till?).. ________ ___ ...........
Silurian system: Middle Silurian series:
Liston Creek formation:
Mississinewa shale: Limestone, fissured (?)__ ________ .
135
425
2049
31
13186065
85134
165
gamma-ray log of well.
Well 26/3-26D2[Altitude: 784 feet above mean sea level. Type of record: Sample log of water well (samples collected by
driller, examined by J. S. Rosenshein)]
Quaternary system: Recent and Pleistocene series:
Silurian system: Middle Silurian series:
Liston Creek formation: Limestone, dolomitic, argillaceous, pale-
66
34
66
100
Well 26/3-26 Jl[Altitude: 795 feet above mean sea level. Type of record: Driller's log]
Quaternary system: Recent and Pleistocene series:
Silurian system: Middle Silurian series:
Liston Creek formation:
Mississinewa shale:
3425
2650
15
3459
85135
150
SELECTED BIBLIOGRAPHY
Capps, S. R., 1910, The underground water of north-central Indiana: U.S.Geol. Survey Water-Supply Paper 254, 279 p.
Collett, John, 1872, Geological reconnaissance of Jasper, White, Carroll, Cass,Miami, Wabash, and Howard Counties: Indiana Geol. Survey 3d and 4thAnn. Repts., p. 291-337.
Cumings, E. R., and Shrock, R. R., 1927, The Silurian coral reefs of northernIndiana and their associated strata: Indiana Acad. Sci. Proc. 1926, p. 71-85.
1928, The geology of the Silurian rocks of northern Indiana: IndianaDept. Conserv., Div. Geology Pub. 75, 226 p.
Elrod, M. M., and Benedict, A. D., 1894, Geology of Cass County: IndianaDept. Geology and Nat. History 19th Ann. Rept., p. 17-39.
Gorby, S. S., 1889, Geology of Miami County: Indiana Dept. Geology and Nat.History 16th Ann. Rept., p. 165-188.
B32 CONTRIBUTIONS TO THE HYDROLOGY OF THE UNITED STATES
Harrell, Marshall, 1935, Ground water in Indiana: Indiana Dept. Conserv., Div.Geology Pub. 133, 504 p.
Leverett, Frank, 1899, Wells of northern Indiana: U.S. Geol. Survey Water- Supply and Irrig. Paper 21, 82 p.
Leverett, Frank, and Taylor, F. B., 1915, The Pleistocene of Indiana and Michi gan and the history of the Great Lakes: U.S. Geol. Survey Mon. 53, 529 p.
Patton, J. B., 1949, Crushed stone in Indiana: Indiana Dept. Conserv., Div.Geology Progress Rept. 3, 47 p.
Rogers, O. C., Smith, L. R., Leighty, W. J., Kunkel, D. R., and Wiancko, A. T.,1955, Soil survey of Cass County, Indiana: U.S. Dept. Agriculture, SoilConserv. Service, Soil Survey Series 1939, no. 24, 129 p.
Tharp, W. E., and Kunkel, D. R., 1927, Soil survey of Miami County, Indiana:U.S. Dept. Agriculture, Bur. Chem. and Soils, Soil Survey Series 1927, no.24, pt. 1, 58 p.
Theis, C. V., 1935, The relation between the lowering of the piezometric surfaceand the rate and duration of discharge of a well using ground-water storage:Am. Geophys. Union Trans., pt. 2, p. 519-524.
Thornbury, W. D., and Deane, H. L., 1955, The geology of Miami County,Indiana: Indiana Dept. Conserv., Geol. Survey Bull. 8, 49 p.
Walton, W. C., 1953, The hydraulic properties of a dolomite aquifer underlyingthe village of Ada, Ohio: Ohio Dept. Nat. Resources, Div. Water, Tech.Rept. 1, 31 p.
Wenzel, L. K., 1942, Methods for determining permeability of water-bearingmaterials: U.S. Geol. Survey Water-Supply Paper 887, 192 p.
O