GREN A - Alacra
10
GREEN RANKINGS REPORT 2009-2010 SAMPLE
Transcript of GREN A - Alacra
GREEN RANKINGS
REPORT 2009-2010
SAMPLE

n e wsw e e k . c o m / g r e e n N ii ii g r e e n r a n k i n g s r e p o rt 2 0 0 9 N E WSW E E K . C O M / G R E E N N II
Green Rankings Report 2009-2010:
© NEWSWEEK, Inc.
LOGOYOU R
H E R E
n e wsw e e k . c o m / g r e e n N 1
this inaugural report stems from a cover story in the sept. 28 issue of the magazine, “The Greenest Big Companies in America.” Both the magazine article and this report are based on our exclusive ranking of the 500 largest corporations in the United States. These rankings are the result of a yearlong collaboration with KLD Research & Analytics, Trucost, CorporateRegister.com and ASAP Media. The newsweek Green Rankings Report is available for purchase in environmentally friendly digital format and in printed form. Printed versions of this report are on FSC-certified process chlorine-free Mohawk Via Smooth PC Cool White ®, which is made with 100% post-consumer recycled fiber. Mohawk Fine Papers purchases enough Green-e certified renewable energy certificates (RECs) to match 100% of the electric-ity used in its operations. This paper is also certified by Green Seal. Company contact: Frank De Maria, [email protected]
newsweek’s Green Rankings Report 2009-2010
KLD Research & Analytics, Inc., an independent investment-research and index firm, served as lead consultant and generated the rankings in conjunction with newsweek’s other data providers. It was also responsible for the Green Policies Score. Founded in 1988, KLD analyzes environmental, social and governance data on companies worldwide. Company contact: Alex Lamb [email protected]
Trucost, a leading international environmental-data firm, specializes in quantitative performance measurement and management. The Environmental Impact Score in the rankings is based on its global database, which covers more than 700 standardized environmental-performance metrics. Company contact: James Salo [email protected]
CorporateRegister.com conducted the Reputation Survey for the Green Rank-ings. Based in London, it is the world’s largest online directory of company- issued social responsibility, sustainability and environment reports. Company contact: Paul ScottManaging Director [email protected]
ASAP Media, a New York City–based media-development firm, served as newsweek’s editorial partner, initiat-ing and coordinating the project. ASAP Media specializes in creating magazine, book and Web content.Company contact: Peter [email protected] Annalyn Swan [email protected]
co
ver
ima
ge
an
d a
ll o
ther
lea
ves
ph
oto
gr
ap
hed
by
jam
es w
ojc
ik
n e wsw e e k . c o m / g r e e n N 2
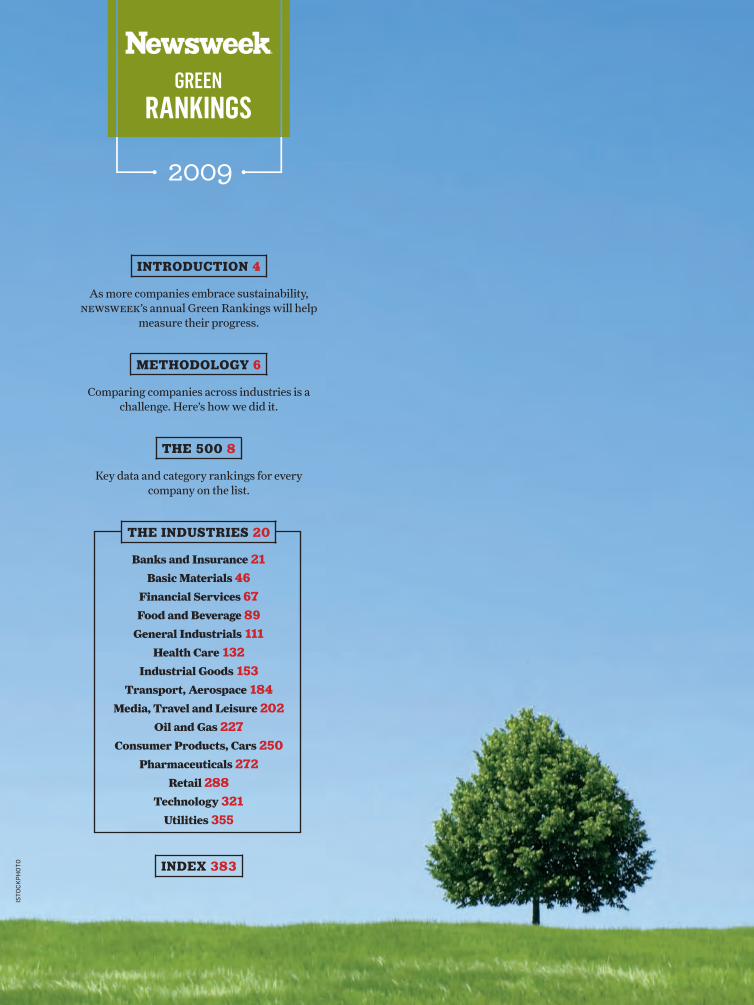
iNtroductioN 4
As more companies embrace sustainability, newsweek’s annual Green Rankings will help
measure their progress.
methodology 6
Comparing companies across industries is a challenge. Here’s how we did it.
the 500 8
Key data and category rankings for every company on the list.
the iNdustries 20
Banks and Insurance 21
Basic Materials 46
Financial Services 67
Food and Beverage 89
General Industrials 111
Health Care 132
Industrial Goods 153
Transport, Aerospace 184
Media, Travel and Leisure 202
Oil and Gas 227
Consumer Products, Cars 250
Pharmaceuticals 272
Retail 288
Technology 321
Utilities 355
iNdex 383
isto
ck
ph
oto

n e wsw e e k . c o m / g r e e n N 4
when david roberts was growing up near the oilfields of West Texas in the early 1960s, it never got dark. Back then, oilfields were lit 24/7 by the gas flares used to burn off natural gas, a byproduct of oil drilling. The flares released massive amounts of CO2, and, over time, oil companies halted that harmful practice in the U.S. But gas flares remain the norm in the developing world—and today Roberts, an executive vice president at Marathon Oil, oversees a team that’s trying to end the practice. In 2007 Marathon opened a $1.5 billion liquid-natural-gas plant in Equatorial Guinea to capture the natural gas that once went up in smoke. The plant is one factor that helped Marathon, No. 100 in newsweek’s Green Rankings, cut its CO2 emissions by 40 percent between 2004 and 2008—and the plant earns a profit. It’s typical of the environmental initiatives Marathon seeks, Roberts says: “Things that make sense for the environment but also have some eco-nomic benefit.”
It’s a small example of a global phe-nomenon: how the economic case for going green is becoming more compelling. Economists view environmental dam-age as a classic “externality”—a cost that affects society but isn’t imposed on pro-ducers or consumers. But after decades of debate, there’s now clear scientific con-sensus that carbon emissions threaten our climate, and there’s growing political will to curb them, particularly with the global powers meeting in Copenhagen in December. The Obama administration is pushing for a cap-and-trade system that would turn companies’ emissions into a bottom-line cost. “What have been con-sidered ‘externalities’ are gradually easing into the realm of expenses,” says David Vidal, director of the Center for Corporate Citizenship & Sustainability at the Confer-ence Board and an advisor to newsweek’s Green Rankings. Today smart companies are working ahead to better understand—and cut—those costs.
The inaugural newsweek Green Rank-ings recognizes those efforts. For more than a year, the magazine has worked with leading environmental researchers KLD Research & Analytics, Trucost, and Cor-porateRegister.com on a difficult task: to rank the largest U.S. companies based on their environmental policies, performance and reputation regardless of industry, using the best available data. There’s an old saying among business-school types: “If you don’t measure it, you can’t manage it,” and our aim is for newsweek’s annual Green Rankings to become a valuable tool in helping companies, their customers, and investors measure, compare and man-age their progress toward more sustain-able practices.
Ranking companies based on sustain-ability is a huge challenge. That’s largely because comparing environmental per-form ance across industries is a bit like analyzing whether Tiger Woods or LeBron James is the world’s greatest ath-
by daniel mcginn
why going greenpays dividends
iNtroductioN
isto
ck
ph
oto
n e wsw e e k . c o m / g r e e n N 9
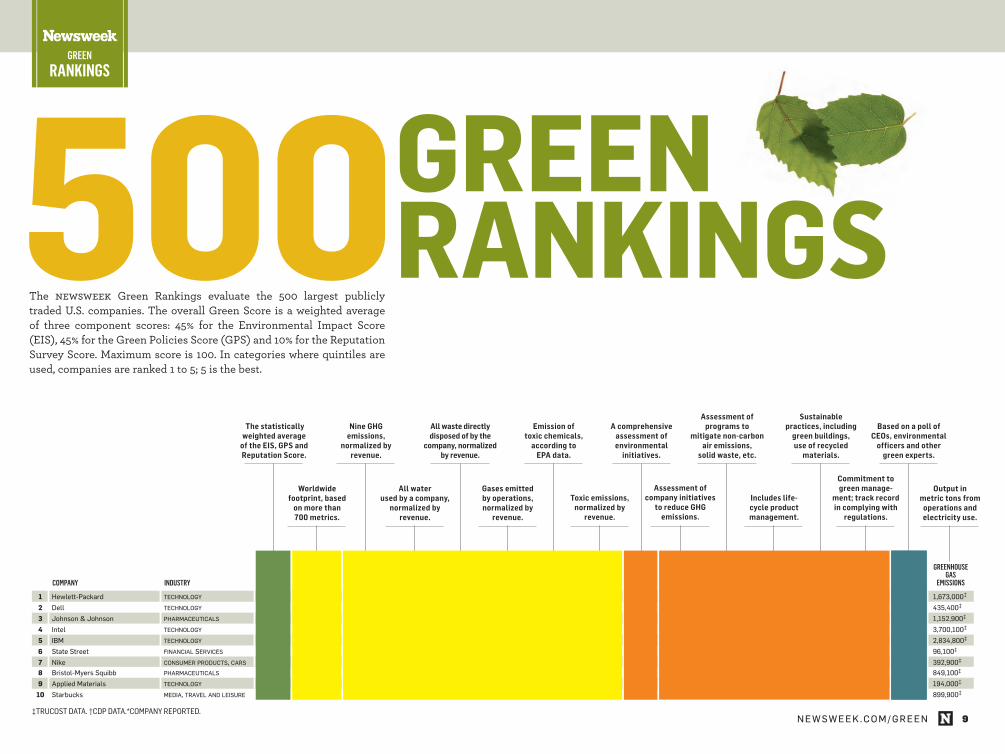
The newsweek Green Rankings evaluate the 500 largest publicly traded U.S. companies. The overall Green Score is a weighted average of three component scores: 45% for the Environmental Impact Score (EIS), 45% for the Green Policies Score (GPS) and 10% for the Reputation Survey Score. Maximum score is 100. In categories where quintiles are used, companies are ranked 1 to 5; 5 is the best.
Worldwide footprint, based
on more than 700 metrics.
All water used by a company,
normalized by revenue.
Gases emitted by operations, normalized by
revenue.
Toxic emissions, normalized by
revenue.
Assessment of
company initiatives to reduce GHG
emissions.
Includes life- cycle product management.
Commitment to green manage-
ment; track record in complying with
regulations.
Output in metric tons from
operations and electricity use.
The statistically weighted average
of the EIS, GPS and Reputation Score.
Nine GHG emissions,
normalized by revenue.
All waste directly disposed of by the
company, normalized by revenue.
Emission of toxic chemicals,
according to EPA data.
A comprehensive assessment of environmental
initiatives.
Assessment of programs to
mitigate non-carbon air emissions,
solid waste, etc.
Sustainable practices, including
green buildings, use of recycled
materials.
Based on a poll of CEOs, environmental
officers and other green experts.
green rankings500
‡TrucosT DaTa. †cDP DaTa.*comPany rePorTeD.
1 Hewlett-packard technology 100.00 64.80 • • • • • • • • • • • • • • • • • • • • • • • • • • • • 97.90 • • • • • • • • • • • • • • • • • • • • • • • • • 88.44 1,673,000‡
2 Dell technology 98.87 67.70 • • • • • • • • • • • • • • • • • • • nd nd 100.00 • • • • • • • • • • • • • • • • • • • • • • • • 70.80 435,400‡
3 Johnson&Johnson pharmaceuticals 98.56 56.70 • • • • • • • • • • • • • • • • • • • 98.17 • • • • • • • • • • na • • • • • • • • • • 75.88 1,152,900‡
4 intel technology 95.12 46.70 • • • • • • • • • • • • • • • • • • • • 87.87 • • • • • • • • • • • • • • • • • • • • • • • • 81.86 3,700,100‡
5 iBm technology 94.08 76.90 • • • • • • • • • • • • • • • • • • • • • • • • 84.20 • • • • • • • • • • • • • • • • • • • • • • • 77.56 2,834,800‡
6 statestreet financial services 93.62 95.00 • • • • • • • • • • • • • • • • • • • • nd nd 84.39 • • • • • na • • • • • • • • • • • • • 70.69 96,100‡
7 nike consumer products, cars 93.28 77.10 • • • • • • • • • • • • • • • • nd nd 78.31 • • • • • • • • • • • • • • • • • • • • • • 89.90 392,900‡
8 Bristol-myerssquibb pharmaceuticals 92.62 27.80 • • • • • • • • • • • • • • • • 88.52 • • • • • • • • • • na • • • • • • • • • 64.73 849,100‡
9 appliedmaterials technology 91.79 50.90 • • • • • • • • • • • • • • • • • • • • • • • • • • • • 89.51 • • • • • • • • • • • • • • • • • • • • • • 44.51 194,000‡
10 starbucks media, travel and leisure 91.63 30.50 • • • • • • • • nd nd 82.01 • • • • • • • • • • • • • • • • • • • • • • • 75.42 899,900‡
cOmpany industry
reputatiOn survey scOre
greenhOuse gas emissiOns/
revenuewater use/
revenue
sOlid waste dispOsed/
revenue
acid rain emissiOns/
revenuetOxic
emissiOns
tOxic emissiOns/
revenue
climate change
pOlicies and perfOrmance
pOllutiOn pOlicies and
perfOrmanceprOduct
impactenvirOnmental
stewardship
management Of envirOnmental
issues
greenhOuse gas
emissiOnsgreen scOre
envirOnmental impactscOre
green pOlicies
scOre
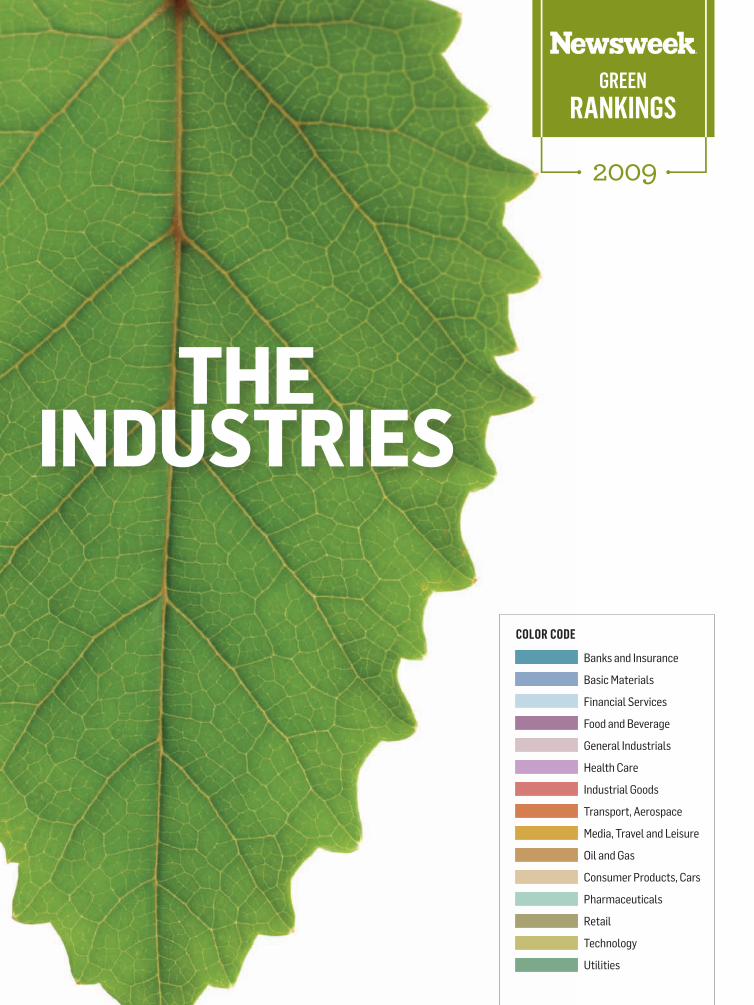
Banks and Insurance
Basic Materials
Financial Services
Food and Beverage
General Industrials
Health Care
Industrial Goods
Transport, Aerospace
Media, Travel and Leisure
Oil and Gas
Consumer Products, Cars
Pharmaceuticals
Retail
Technology
Utilities
color code
The IndusTrIes
n e wsw e e k . c o m / g r e e n N 21
banks and Insurance
banks and insurers can address cli-mate change in two basic ways: improving the sustainability practices of their own operations and using their capital to help clients finance green projects of their own.
Wells Fargo (#13) and Citigroup (#24) are among the most ambitious financial institutions in this area. Wells Fargo offers loan and financial products for renewable-energy financing and green building. As of 2009 Wells Fargo reported financing at least 27 wind projects, 150 solar pho-tovoltaic projects and one utility-scale solar thermal project. It reported lending approximately $5 billion for sustainable building, the purchase of renewable-energy credits, energy efficiency and renewable-energy projects. In 2007, Citi-group committed $50 billion to climate change–related initiatives over 10 years.
Insurance companies have also sought to respond to climate change, although many programs are still new. Marsh & McLennan (#297) established a Climate Risk Initiative Steering Committee to guide managers of its various operat-ing units in identifying and addressing climate-related risks and opportunities. PNC Financial Services Group (#104) is a recognized leader among banks for its green-buildings efforts. Bank of America
(#135) expected to complete construction of a Platinum LEED-certified signature office building in New York in 2009.
Despite the outwardly clean and low-impact nature of banking, environmental campaigners such as Rainforest Action Network have sought to uncover banks’ record of financing large-scale, disrup-tive construction projects and indus-trial practices. From lending for China’s Three Gorges Dam to the financing of coal-plant construction and timber oper-ations, high-profile banks such as Bank of America, Citigroup and JPMorgan Chase (#41) have been pressured by envi-ronmentalists to disclose the portion of their lending portfolios that finance envi-ronmentally harmful or controversial projects and business activities. Environ-mentalists have also urged the banks and other financial institutions to scale back such lending. Most companies have not acted on these demands.
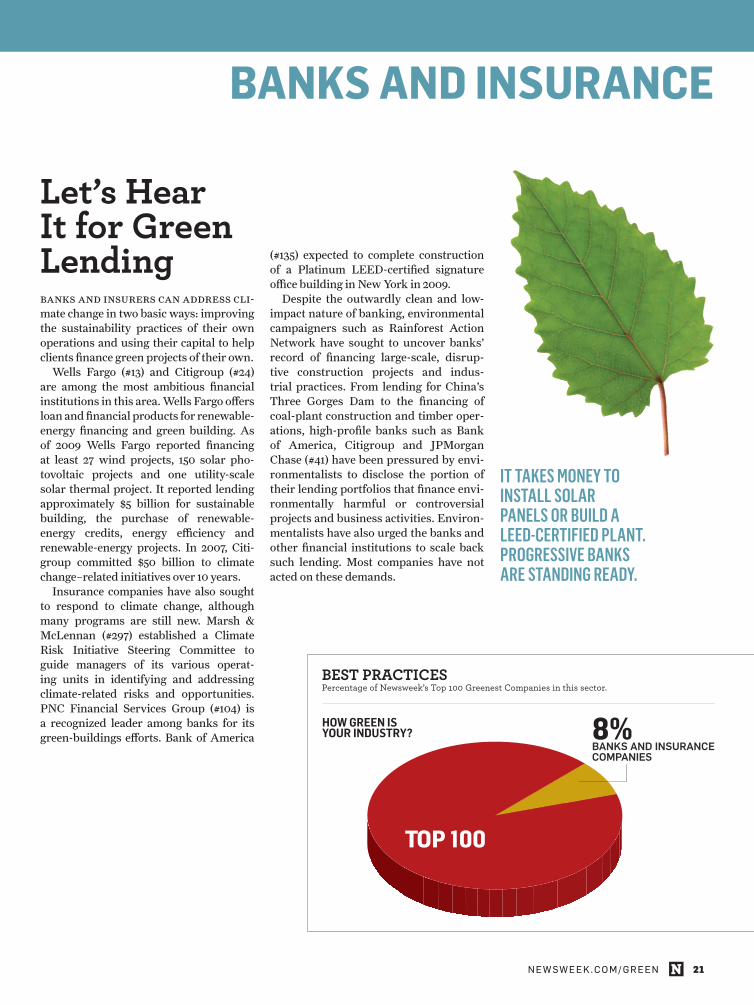
Let’s Hear It for Green Lending
It takes money to Install solar panels or buIld a leed-certIfIed plant. progressIve banks are standIng ready.
8%banks and insurance companies
TOP 100
how green is your industry?
Best PractIcesPercentage of Newsweek’s Top 100 Greenest Companies in this sector.

n e wsw e e k . c o m / g r e e n N 22
1 wellsFargo 88.53 93.30 80.12 38.96 629,100‡
2 citigroup 85.58 89.80 67.47 54.49 1,434,700‡
3 Travelers 83.74 97.40 65.90 42.57 62,800‡
4 JPmorganchase 82.82 91.60 59.88 54.58 1,264,000‡
5 Unumgroup 81.30 94.80 60.34 38.98 39,500‡
6 northernTrust 81.20 90.00 64.43 24.80 95,500‡
7 Allstate 79.72 93.90 52.45 50.95 212,500‡
8 U.s.Bancorp 78.62 88.50 54.28 35.32 475,200‡
9 Ace 76.89 95.60 47.85 40.48 37,600‡
10 PncFinancialservicesgroup 76.79 99.30 47.20 41.65 16,200‡
11 comerica 76.61 91.40 49.99 31.21 69,208*
12 BankofAmerica 75.04 92.50 39.51 51.72 1,483,431†
13 Loews 74.87 49.20 48.74 27.26 nD14 AmericanInternationalgroup 74.64 94.10 44.95 29.86 nD15 Progressive 74.52 97.70 41.18 41.21 237,688†
16 PrudentialFinancial 73.48 93.70 39.58 37.20 95,456†
17 AFLAc 71.18 98.30 38.59 19.52 32,656†
18 XLcapital 70.96 96.20 39.01 16.10 nD19 BB&Tcorp. 70.81 94.70 33.88 31.83 92,444†
20 sunTrustBanks 70.64 95.40 34.80 27.26 nD21 Aoncorp. 70.08 89.50 29.51 40.25 nD22 PrincipalFinancialgroup 69.73 92.90 33.82 22.42 nD23 marsh&mcLennan 69.17 85.40 27.64 38.65 nD24 Lincolnnational 69.17 95.20 33.24 19.07 nD25 HartfordFinancialservices 68.85 94.50 30.42 25.57 122,333†
26 Assurant 68.81 96.00 30.14 26.08 nD27 keycorp 68.63 99.10 28.01 31.46 nD28 metLife 68.28 96.80 29.74 22.62 nD29 regionsFinancial 68.12 99.90 27.01 30.15 nD30 m&TBank 68.10 99.70 28.86 23.89 nD31 cincinnatiFinancial 67.33 97.40 26.87 23.57 nD32 chubb 67.20 98.50 25.40 27.28 nD33 FirstAmerican 66.67 93.50 24.14 26.86 nD34 w.r.Berkley 65.98 95.80 24.14 20.45 nD35 FifthThirdBancorp 65.60 94.30 21.69 25.20 nD36 HudsoncityBancorp 65.33 100.00 20.89 25.20 nD
companyenvIronmental Impact score
green polIcIes score
reputatIon survey score
greenhouse gas emIssIons
green score
‡TRUCOST DATA. †CDP DATA.*COMPAny RePORTeD.
banks and Insurance

n e wsw e e k . c o m / g r e e n N 23
Has provided $5 billion in financing for green businesses since 2005, of which $1.65 billion has been for solar and wind projects and $3 billion for “green” buildings. However, not included by Ceres, a coalition of environmentalists and investors, on its 2008 list of top banks engaged in climate-change activities.
Wells Fargo
banks and Insurance
13overaLL rank
industry rank(out of 36 companies)
1
Green score 88.53
Performance ................ 132 ............................ 8
Commitment ................. 140 ............................11
Communications ...........171 ............................13
Track record ...................101 ............................10
Ambassadors ................ 183 ...........................10
Overall rank
Out Of 500
Industry rank
Out Of 36
scOre
performance 92.86
perception 38.96
Climate-change policies and performance ............................•••••Pollution policies and performance ........................................... nA
Product impact ...............................•••••environmental stewardship ........•••••Management of environmental issues ...................•••••
GHG emissions/revenue ...................................15
Water use/revenue ............................................88
Solid waste disposed/revenue .......................32
Acid-rain emissions/revenue ........................... 0
Toxic emissions ...................................... 601,000
Toxic emissions/revenue ..................................12
scOre
scOre
industry average 40.32
Wells Fargo 80.12Wells Fargo 93.30
industry average 93.50
scOre
Wells Fargo 38.96
industry average 32.35
scOre
ProFILerevenue: $51,652 million†
market capitalization: $84,436 million‡
number of employees: 158,900‡
stock: nyse: WFCcompany contact: Emily JanowskyMgr., Investor Relations [email protected]
SOURCeS: FACTSeT, GOOGLe FInAnCe†Fy2008 ‡AS OF MAy 29, 2009
seLected comPetItorsHow a company’s overall green score compares with that of some of its nearest competitors among the Newsweek 500 companies.
wells Fargo .............................. 88.53
Citigroup .............................................85.58
JPMorgan Chase ............................... 82.82
northern Trust ...................................81.20
U.S. Bancorp ...................................... 78.62
imaGe vs. realityHow its environmental image, based on the reputation survey by CorporateRegister.com, compares with its actual performance—its combined Environmental Impact and Green Policies scores.
reputation surveyHow its environmental record is viewed by CEOs and environmental experts based on a survey by CorporateRegister.com. Shown relative to all 500 companies in the rankings and its individual sector.
Green policiesHow it compares with the industry average; all environmental policies, programs, initiatives and controversies, based on data collected by KLD Research & Analytics, scored 1 to 5; 5 is the best.
environmental impactHow the company compares with the industry average; environmental impacts from global operations, based on data compiled by Trucost. See page 6 for explanation of numbers.
U.S. ............................ 50% ...........................50%
non-U.S. ................... 77% ............................23%
POsItIve negatIve
Global vieWHow a company’s image differs between U.S.-based respondents (CEOs, environmental officers and academics) in the CorporateRegister.com survey versus those responding from abroad.