CGE Training Materials National Greenhouse Gas Inventories Key Category Analysis

AEAT/R/ENV/0314 Issue 1
Greenhouse Gas Inventories,for England, Scotland, Walesand Northern Ireland
AG Salway, TP Murrells, A Cook
November 2000

AEAT/R/ENV/0314 Issue 1
Greenhouse Gas Inventories,for England, Scotland, Walesand Northern Ireland
AG Salway, T Murrells, A Cook
November 2000

AEAT/R/ENV/0314 Issue 1
AEA Technology iiNational Environmental Technology Centre
Title Greenhouse Gas Inventories, for England, Scotland, Wales andNorthern Ireland
Customer Department of the Environment, Transport and the Regions
Customer reference EPG 1/1/62
Confidentiality,copyright andreproduction
Copyright AEA Technology plc 1999All rights reserved.Enquiries about copyright and reproduction should be addressed tothe Commercial Manager, AEA Technology plc.
File reference N:/naei-admin/naei98/regghg/report
Report number AEAT/R/ENV/0314
Report status Issue 1
ISBN number 0-7058-1795-4
National Environmental Technology CentreCulhamAbingdonOxfordshireOX14 3EDTelephone 01235 463168Facsimile 01235 463005
AEA Technology is the trading name of AEA Technology plcAEA Technology is certificated to BS EN ISO9001:(1994)
Name Signature Date
Author AG Salway, TPMurrells, A Cook
Reviewed by JWL Goodwin
Approved by GD Hayman

AEAT/R/ENV/0314 Issue 1
AEA Technology iiiNational Environmental Technology Centre
Appendices
CONTENTS
Appendix 1 Methodology of the Estimates

AEAT/R/ENV/0314 Issue 1
AEA Technology ivNational Environmental Technology Centre
Appendix 1Methodology of the Estimates
CONTENTS
1.1 INTRODUCTION1.1.1 Reporting Forma1.1.2 General Approac
1.2 ENERGY INDUSTRIES1.2.1 Electricity Productio1.2.2 Petroleum Refinin1.2.3 Manufacture of Solid Fuel1.2.4 Other Energy Industrie
1.3 MANUFACTURING INDUSTRIES AND CONSTRUCTION1.3.1 Iron and Stee1.3.2 Other Industr
1.4 TRANSPOR1.4.1 Aviation and Navigatio1.4.2 Road Transportatio1.4.3 Railway
1.5 OTHER SECTORS1.5.1 Commercial/Institutiona1.5.2 Residentia1.5.3 Agriculture/Forestry/Fisheries 2
1.6 MILITARY1.7 FUGITIVE EMISSIONS FROM FUELS
1.7.1 Coal Minin1.7.2 Solid Fuels Transformatio1.7.3 Oil and Natural Ga
1.8 INDUSTRIAL PROCESSES1.8.1 Minerals Industrie1.8.2 Chemical Productio1.8.3 Metal Productio1.8.4 Use of Halocarbons and SF
1.9 AGRICULTUR1.10 LAND USE CHANGE AND FORESTRY1.11 WAST
1.11.1 Solid Waste Disposal on Lan1.11.2 Waste Water Handlin

AEAT/R/ENV/0314 Issue 1
AEA Technology vNational Environmental Technology Centre
1.11.3 Waste Incineratio1.12 UNCERTAINTIES 3REFERENCES 4

AEAT/R/ENV/0314 Issue 1
==P
AEA TechnologyNational Environmental Technology Centre
1.1 INTRODUCTION
The UK Greenhouse Gas Inventory compiles estimates of greenhouse gas emissionsfor submission to UN Framework Convention on Climate Change. The mostrecent version, reports emissions from 1990 to 1998 (Salway, 2000). This reportpresents separate inventories of greenhouse gas emissions for England, Scotland,Wales and Northern Ireland for the years 1990, 1995 and 1998 that are consistentwith the 1998 UK Inventory. The six direct greenhouse gases are considered:
• carbon dioxide (CO2)• methane (CH4)• nitrous oxide (N2O)• hydrofluorocarbons (HFCs)• perfluorocarbons (PFCs)• sulphur hexafluoride (SF6).
1.1.1 Reporting Format
Emissions are reported according to the Sectoral Tables in the IPCC CommonReporting Format with some modifications. It was not considered possible toallocate emissions from certain sources to any one region of the UK. These were:
• Domestic Aviation• Domestic Navigation• Emissions from the offshore oil and gas industry• Military Aviation• Naval
Hence these emissions were calculated but were reported as unallocated. The UKInventory also reports emissions from marine and aviation bunkers separately forinformation as required by the Intergovernmental Panel on Climate Change(IPCC). Again these were not allocated to any region but are not included in theunallocated total.
1.1.2 General Approach
The UK Inventory is based on UK statistics for activities producing greenhouse gasemissions. These include fuel consumption, industrial production, agriculture andland use change and forestry. In principle, it would be necessary to obtain acomplete set of equivalent statistics for each region to compile each inventory. Inpractice, such a set of statistics was not available for all sources and for all regionsand it was necessary to disaggregate the UK emission into the four regions by anestimation procedure. For most sources in the UK Inventory, the emission of apollutant from a source is calculated from the general equation
E Ae=

AEAT/R/ENV/0314 Issue 1
==Q
AEA TechnologyNational Environmental Technology Centre
whereE = Emission of pollutant (tonnes)A = Activity (unit activity)e = Emission Factor (tonnes pollutant/unit activity)
The activity could be fuel combustion (tonnes), or production of product (tonnes)or numbers of animals. A modified equation was used for the regional inventories:
�=
= 5
1jj
ii
d
AedE
where
Ei = Emission from either 1.England; 2.Scotland; 3.Wales;4. Northern Ireland or 5.Unallocated. (tonnes)
di = A driver representing the contribution of the region to UK emissions
i = 1, 2....5
The driver, di can be any one of:
1. The value of the activity data for that region. Examples are actual consumptionof specific fuels in the region or industrial production of a product.
2. The fraction of the UK activity in that region.3. The value of a surrogate activity data in that region. Where the required
activity was unavailable on a regional basis, a surrogate value was used.Examples are employment statistics or production of a particular product usedinstead of fuel consumption data.
4. In cases where the emissions are derived from a complex model, the driverwould be the actual emission for the region calculated from the model.
The equation ensures that the sum of the emissions from the regions andunallocated emissions equals the UK fuel emission. Where the driver is fuelconsumption, then the sum of the drivers should add up to the UK consumption.However, in practice this may not be the case if data is taken from different sourcesor may be based on the financial rather than the calendar year. The estimationprocedure removes these discrepancies.
Thus the compilation of the regional inventories reduces to the estimation of a setof drivers, each appropriate to a source.
Subsequent sections discuss the estimation of the drivers for each source category.Most of the detailed discussion is concentrated on the more complex categories,

AEAT/R/ENV/0314 Issue 1
==R
AEA TechnologyNational Environmental Technology Centre
whilst simpler sources are summarised in Tables A1.1-A1.8. The IPCC classificationis used throughout (IPCC, 1997)

AEAT/R/ENV/0314 Issue 1
S
AEA TechnologyNational Environmental Technology Centre
Table A1.1 Energy Industries1
IPCC Category NAEI Sources Activity: Fuel Consumption 1990 1995/1998Electricity Production Power Stations Coal, oil, , natural gas Consumption data from
Power GeneratorsConsumption data fromPower Generators
Unrefined natural gas NO All plant in SSewage gas Sewage methane recovered Sewage methane recoveredLandfill gas As landfill methane As landfill methaneOrimulsion, MSW, poultrylitter and tyres
All plant in E All plant in E
Petroleum Refining Refineries All fuels UKPIA CO2 emissionestimates for 1997
PI CO2 emission estimates for1998
Manufacture of Solid Coke Production Colliery Methane Assumed E Assumed EFuels Coke Oven gas, natural gas Coal feed to coke ovens,
ISSB, WS, DTICoal feed to coke ovens,ISSB, WS, DTI, PI
Coke Coke breeze consumptionISSB
Coke breeze consumptionISSB
Blast Furnace gas Coke Consumed in blastFurnaces, ISSB, WS
Coke Consumed in blastFurnaces, ISSB, WS
SSF Production All fuels Coal feed to SSF plant, DTI,WS
Coal feed to SSF plant, DTI,WS
Other Energy Collieries All other fuels Deep mined coal prod., CA Deep mined coal prod., CAIndustries Coke oven gas Assumed E NO
Gas Production Colliery methane Deep mined coal prod., CA Deep mined coal prod., CAOther fuels Arrivals of natural gas, DTI Arrivals of natural gas, DTI
Offshore Own Gas Use Unrefined natural gas Extrapolate from 95 on oiland gas arrivals, DTI
UKOOA CO2 estimates forterminals
Nuclear Fuel Prod. natural gas All plant in E Data not available1 See Table A1.9 for abbreviations

AEAT/R/ENV/0314 Issue 1
T
AEA TechnologyNational Environmental Technology Centre
1.2 ENERGY INDUSTRIES
The drivers used for the energy industries are summarised in Table A1.1. Thisshows the base sources used in the National Atmospheric Emissions Inventory(NAEI) database, which correspond to the IPCC sources. The activity data used inthe UK Inventory are shown together with the drivers used in the regionalinventory for 1990 and 1995/1998. In some cases the derivation of the driversdiffers between years depending on the availability of data.
1.2.1 Electricity Production
Emissions are based on fuel consumption data provided by the major powergenerators in Great Britain and the Northern Ireland Office. (Scottish Power(1999), Scottish and Southern Energy (2000), Bell (1999), National Power ( 1999),PowerGen (1999), Eastern Generation (1999)).
Emissions from solid waste combustion are less certain but all the plant are knownto be in England and so the emissions will correspond to the UK emissions. Thedistribution of landfill gas and sewage gas generation was assumed to correspond tothe distribution of landfill sites and sewage treatment plant (see Waste).
1.2.2 Petroleum Refining
UKPIA were able to provide a site by site breakdown of UK refining emissions for1997 (UKPIA, 1998). They advised us that refinery throughput would not havevaried since 1990. The CO2 emissions data were used as a surrogate for all fuelconsumption. A correction was applied to take account of the Gulf Oil Refinery,which closed in 1996, based on refinery distillation capacity reported by DTI (1996,1991). Emissions for 1998 were based on CO2 emissions reported in the PollutionInventory (Environment Agency, 1999a). Scottish emissions were based on CO2
emissions from Grangemouth Refinery (BP, 2000).
1.2.3 Manufacture of Solid Fuels
This category comprises the production of coke and solid smokeless fuel (SSF).Regional data on coke ovens in the iron and steel industry are reported in detail byISSB (1999, 1996, 1991). Recent issues of UK Iron and Steel Statistics are lessdetailed than earlier ones, though the additional detail is available on request. Twocoke ovens in England and Wales are not attached to an integrated iron and steelfacility. The consumption of coal by these plant was estimated from WO (1998)and UK data (DTI, 1991,1999). The Welsh statistics are only available to 1993, sothis data was used as an estimate of the Welsh non-iron and steel coal consumptionin 1995. For 1998, the non-iron and steel coal consumption data was apportionedbetween England and Wales using CO2 emissions for the particular sites reported inthe Pollution Inventory (Environment Agency, 1999a). Thus the generic driver forcoke oven fuel consumption was the consumption of coking coal which is in effect

AEAT/R/ENV/0314 Issue 1
U
AEA TechnologyNational Environmental Technology Centre
the regional capacity of coke ovens. This driver was also used for natural gasconsumption and coke oven gas consumption. Some coke ovens use blast furnacegas as fuel and the availability will depend on blast furnace gas capacity (seeIndustrial Processes). Tiny amounts of colliery methane are used and this wasjudged to occur in England where coking occurs near deep mining. Small amountsof coke breeze are used and this was disaggregated using data on other cokeconsumption in ISSB (1999, 1996, 1991).
The estimation of emissions from SSF production is rather uncertain, since there area number of processes operating and the available fuel data are not detailed.Moreover, many of these are the new briquetting processes rather than cokingprocesses and produce negligible emissions. SSF plant were operating in Englandand Wales over the period hence it was possible to estimate regional consumptionusing UK data: (DTI; 1991,1999) and Welsh data (WO, 1998). Again it wasnecessary to estimate the Welsh data for 1995. By 1998 all SSF coking plant stilloperating were in England. Thus the driver used was coal consumed by SSF plant.This was applied to all fuel consumption.
1.2.4 Other Energy Industries
This category consists of a number of small emissions from collieries, the gasindustry, the nuclear fuel industry and a large emission from offshore natural gas use.In the regional inventory only the emissions from oil and gas terminals werereported based on data provided by UKOOA (1999). Data is only available for1995 and 1998 and so emissions for 1990 were extrapolated based on the arrivals ofcrude oil and natural gas in Scotland and England, (DTI, 1991,1996).
A similar approach was adopted for gas production, which is mainly fuelconsumption, by gas separation plant. The driver was based on the arrivals ofnatural gas in England and Scotland (DTI, 1991, 1996, 1999).
Other sources are minor and are covered in Table A1.1
1.3 MANUFACTURING INDUSTRIES ANDCONSTRUCTION
The drivers used for manufacturing and construction are summarised in Table A1.2.
1.3.1 Iron and Steel
ISSB (1991, 1996, 1999) reports detailed regional consumption of fuel by the steelindustry. Recent issues of UK Iron and Steel Statistics are less detailed than earlierones, though the additional detail is available on request. The consumption of cokeby sinter plant can be estimated as the non-blast furnace coke consumption as this isthe main other use of coke. The consumption of coke oven gas was distributed asthe coal feed to coke ovens and the consumption of blast furnace gas as the coke

AEAT/R/ENV/0314 Issue 1
V
AEA TechnologyNational Environmental Technology Centre
feed to blast furnaces. The production of these gases should be proportional to thefuel used as feedstock. ISSB reports the general consumption of coal, fuel oil, gasoil, LPG and natural gas by the primary iron and steel industry. This is a narrowerdefinition than that used by DTI which includes foundries and finishing plant, sothat the DTI data used in the UK GHGI is higher than the ISSB data.Nevertheless, the regional ISSB data was used as a surrogate, since it is likely thatthe distribution of the wider steel industry will be similar to the primary industry.Moreover, the emissions from these secondary plant are considerably lower than theprimary plant, which are accurately estimated.
1.3.2 Other Industry
DTI (1999, 1996, 1991) reports regional consumption of liquid fuels but only astotals for: England and Wales combined; Scotland and Northern Ireland. WO(1998) reports liquid fuel consumption up to 1993. The total consumption forWales was extrapolated from 1993.
Burning oil is mainly consumed in the residential sector, but there is a significantuse by industry. Hence industrial consumption of burning oil was distributedaccording to remaining consumption after domestic consumption had beendeducted. This is a change in methodology, since the previous methodology gaveanomalously high estimates for Northern Ireland when applied to 1998 data.
Fuel oil has a significant use in industry. Here, consumption was distributed as theoil remaining after all other uses were deducted from the total. Drivers werecalculated for England, Scotland, Wales and Northern Ireland. This driver was usedfor other industry and commercial sectors.
The driver for gas oil was calculated differently. Here, consumption was distributedaccording to the Science Policy Research Unit (SPRU) database. This is a databaseof around 6000 small boilers (<50 MW) based on insurance records collected in theperiod 1992-94. The database records a grid reference, economic sector, nominalfuel consumption and fuel type. Drivers were calculated for England, Scotland,Wales and Northern Ireland.
Some gas oil and petrol is used for off-road machinery mainly in the constructionindustry. The UK estimates themselves are uncertain, and regional drivers werebased on male employment in the construction industry (ONS, 1996, 2000).
Liquid Petroleum Gas (LPG) has a number of uses, which are more preciselycharacterised in other sources such as domestic use. Hence the industrial use ofLPG was based on a mass balance based on total regional consumption (calculatedin a similar manner as fuel oil) less consumption by all other sources.
DTI (1999) estimate that 40% of lubricants sold are eventually used as a fuel.Hence, the driver was based on regional lubricant sales (DTI, 1991, 1996, 1999)

AEAT/R/ENV/0314 Issue 1
NM
AEA TechnologyNational Environmental Technology Centre
with England and Wales being disaggregated based on regional manufacturingemployment statistics (ONS, 2000).
Transco (2000) supplied data on sales of natural gas to consumers categorised byconsumer size and region. This, however excluded consumption by large industrialsand power generators which were not regionally allocated. The approach adoptedwas to match the regional Transco totals with the NAEI totals and to apply theappropriate drivers for domestic and commercial. The consumption for otherindustry and autogenerators was then estimated by deducting all the other knownsources from the totals. The same driver was used for autogenerators as for otherindustry.
Regional coal data is fairly sparse: sectoral data is available for Northern Ireland,NIO, (1999) up to the present and Wales (WO, 1998) to 1993. Published data forScotland and England are entirely absent. Industrial coal consumption for 1995 and1998 was estimated from sales data, gathered from major coal producers. A massbalance was performed on production, imports, stock-changes and imports. Coalwas allocated to sources where consumption was known or estimated using otherdrivers (power generation, iron & steel, cement kilns) and imports allocated to themost likely consumers (power generation, coking, domestic anthracite). Englishand Welsh sales data were fairly complete but Scottish data were incomplete and itwas necessary to extrapolate Scottish industrial coal consumption using the SPRUdata for other industry. Stock changes are significant and were disaggregated onregional production (Coal Authority, 2000). The estimates obtained are likely tobe fairly approximate. Estimates for 1990 are based on WO (1998) and NIO(1996). Corrections were applied for the consumption by other industrial sectors(iron and steel, cement etc). The remaining consumption was allocated to Englandand Scotland on the basis of the 1995 England/Scotland split. The data collectedfor 1998 was not sufficiently complete to allow a balance to be made. Hence the1995 driver was used for 1998 with a correction for Northern Ireland
Drivers for fuel consumption in cement kilns were based on regional capacity datafor 1995 and 1998 supplied by British Cement Association (1999). These wereapplied to all fuels though a correction was applied to Northern Ireland to accountfor the absence of natural gas. Lime production occurs only in England and wasassumed to be coal fired.
Autogeneration refers to electricity generation by industry for its own use. In thecase of coal the consumers were identified as Alcan and Brunner Mond, both ofwhich are in England. Gas autogeneration was not a large source and wasdistributed according to the other industry: natural gas driver discussed above.

AEAT/R/ENV/0314 Issue 1
NN
AEA TechnologyNational Environmental Technology Centre
Table A1.2 Manufacturing Industry and Construction1
IPCC Category NAEI Sources Activity: Fuel Consumption 1990 1995/98Iron and Steel Sinter Plant Coke-breeze Other coke consumption, ISSB Other coke consumption, ISSB
Iron & Steel Blast furnace gas Coke Consumed in blast furnaces,ISSB, WO
Coke Consumed in blast furnaces,ISSB, WO
Coke oven gas Coal feed to coke ovens, ISSB, WS Coal feed to coke ovens, ISSB, WSCoke Coke consumed in blast Furnaces,
ISSB, WO1Coke consumed in blast Furnaces, ISSB,WO
Fuel oil, gas oil, LPG, naturalgas, coal
Consumption of specified fuel, ISSB Consumption of specified fuel, ISSB
Other Industry Other Industry Burning oil, fuel oil Regional oil consumption, DTI, WO Regional oil consumption, DTI, WORemainder after other uses Remainder after other uses
Gas oil SPRU database: Other Industry; oil SPRU database: Other Industry; oilOPG All Scotland, DTI All Scotland, DTILPG Mass balance, DTI Mass balance, DTILubricants Regional sales, DTI Regional sales, DTINatural gas Natural gas consumed, Transco Natural gas consumed, TranscoColliery Methane Deep mined coal prod., CA Deep mined coal prod., CACoal, coke Coal consumption, WO, NIO Coal sales estimates, NIOCoke oven gas Coal feed to coke ovens, ISSB, WO Coal feed to coke ovens, ISSB, WSSSF NAEI spatial inventory NAEI spatial inventoryWood SPRU database: non-traded fuel SPRU database: non-traded fuel
Cement & Lime Coal, oil, gas, petrocoke,tyres, waste oil
Regional Cement & Lime capacity Regional Cement & Lime capacity
Ammonia (combustion) Natural Gas All plant in England All plant in EnglandAutogenerators Coal All plant in England All plant in England
Natural gas As Other Industry As Other IndustryOther-Industry: Off-road Gas oil, petrol Male employment in construction,
ONSMale employment in construction,ONS

AEAT/R/ENV/0314 Issue 1
NO
AEA TechnologyNational Environmental Technology Centre
1 See Table A1.9 for abbreviations

AEAT/R/ENV/0314 Issue 1
NP
AEA TechnologyNational Environmental Technology Centre
1.4 TRANSPORT
The drivers used for transport are summarised in Table A1.4.
1.4.1 Aviation and Navigation
All domestic aviation and navigation emissions are reported as unallocated. TheUK fuel statistics for coastal shipping contain oil consumption by the offshoreindustry which includes on-shore terminals. However, in the regional inventories,terminal emissions are reported under 1B2 Oil and Gas Fugitives. Terminalemissions data were supplied by UKOOA (1999), for 1998 and 1995, and estimatesfor 1990 were extrapolated from 1995 based on landings of natural gas and crude oilin England and Scotland. Emissions from aircraft support equipment weredistributed according to aircraft movement data at the major UK airports (DETR,1999).
1.4.2 Road Transportation
Carbon dioxide, methane and nitrous oxide are emitted from the exhaust of all roadvehicles with internal combustion engines running on petrol and diesel fuels. CO2 isthe principal product of combustion and emissions are directly related to the fuelefficiency of the vehicle. Methane is a hydrocarbon emitted as a result of theincomplete combustion of the fuel. Nitrous oxide is a by-product of thecombustion process and emitted from partial oxidation of nitrogen present in theair.
All these pollutants are emitted in different amounts from vehicles of similar sizerunning on petrol and diesel fuel. For example, diesel cars tend to be more fuelefficient than petrol cars of a similar size, so their carbon emissions are lower. Noneof these pollutants are subject to regulatory type-approval emission limit values, incontrast to those which have an impact on air quality. However, their emissions areaffected by technologies introduced to reduce emissions of the regulatory pollutants.Methane emissions are lower from petrol vehicles fitted with a three-way catalyst,although the reduction in emissions of this pollutant by the catalyst is not as efficientas it is for other hydrocarbons. Measurements also suggest that a three-way catalyst,which is efficient at reducing NOx emissions, actually increases emissions of N2O,formed as a by-product of the catalyst NOx reduction process.
Total emissions from road transport in a country or region are normally calculatedfrom the following information:
• Emission factors for different types of vehicles. In the case of carbon emissions,fuel consumption factors can be used because the mass of carbon emitted isproportional to the mass of fuel consumed. Emission factors (g/km) and fuelconsumption factors depend on the vehicle type and fuel type (petrol or diesel)and are influenced by the drive cycle or average speeds on the different types of

AEAT/R/ENV/0314 Issue 1
NQ
AEA TechnologyNational Environmental Technology Centre
roads.
• Traffic activity, including distance and average speed travelled by each type ofvehicle on each type of road.
• Fleet composition in terms of the age of the fleet and the petrol/diesel mix.The age of the fleet determines the proportion of vehicles manufactured inconformity with the different exhaust emission regulations which have been ineffect and successively tightened up over the past 25 years. One of the definingfactors for the 1995/98 inventories is the proportion of petrol cars fitted with athree-way catalyst since this became mandatory for all new cars first registered inthe UK from around August 1992, in accordance with EC Directive91/441/EEC. The proportion of cars and vans running on diesel fuel is also animportant factor. The sensitivity to the age of the fleet will be much less for the1990 inventory because there were very few cars then fitted with catalysts andthe difference in emissions from cars made to the earlier emission standards wasmuch smaller.
• National or regional fuel consumption statistics. This provides a particularlygood indicator of carbon dioxide emissions.
The emission factors and methodology followed for the regional inventory ofemissions from road transport were those used for the UK National AtmosphericEmissions Inventory (NAEI). These are largely taken from the EuropeanCOPERT II (1997) program and database, recommended for CORINAIR andform the basis of the IPCC Guidelines.
Emission factors
The emission and fuel consumption factors used for the regional inventories arereported in Salway (2000). These are broken down by the vehicle type andemission standard with which the vehicle was compliant when manufactured andfirst registered. The approximate dates of introduction of the emission standards inthe UK are shown. The data are based on various European programmes ofmeasurements of exhaust emissions from in-service vehicles made over defineddrive cycles, usually on rolling roads or engine test beds. In the case of fuelconsumption factors, speed-emission functions were used to calculate emissionfactors at average speeds on urban, rural single carriageway, rural dual carriagewayand motorway roads in the regions. The speed-dependency of emission factors ofmethane and nitrous oxide are not known, so the same values were used for all theroad types.
Age and composition of the fleet
Information on the age and composition of the vehicle fleet in the regions in 1990,1995 and 1998 was taken from vehicle licensing statistics. For England, Scotlandand Wales, the data were taken from the Vehicle Licensing Statistics Report

AEAT/R/ENV/0314 Issue 1
NR
AEA TechnologyNational Environmental Technology Centre
published for Great Britain each year by DETR (1999b); this is based on the DVLAfiles of vehicles licensed in Great Britain at the end of each year.
Additional information was obtained directly from DETR which showed the post-town where the vehicles were registered and the year of first registration of vehiclescurrently licensed in 1998 (DETR, 1999a). By grouping together the post-towndata into the regions, it was possible to estimate the average age of the fleet based onregistrations in England, Scotland and Wales. This tended to show that the age ofthe fleet was very similar in England and Wales, but somewhat newer in Scotland.However, because vehicles are not necessarily used on the roads in the regionswhere they are registered (this would be particularly true for company cars andcommercial vehicles), the licensing data by post-town was not used for the regionalinventories and it was assumed that the age of the fleet and petrol/diesel mix forGreat Britain as a whole applied equally to England, Scotland and Wales.
For Northern Ireland, the situation was slightly different. Vehicle licensing statisticsfor private and light goods vehicles (PLG) were available from the Central Statisticsand Research Bureau of the Department of Environment for Northern Irelandwhich showed a newer fleet than in Great Britain (Department of the Environment,Northern Ireland, 1999a). It is felt that most of the vehicles on the road inNorthern Ireland will be those licensed in Northern Ireland and vice versa, meaningthat a newer fleet should reflect a higher proportion of cars fitted with three-waycatalysts on the road in 1995 and 1998 than in England, Scotland and Wales. Thistrend may be further reflected by the fact that fuel delivery statistics for 1995 suggesta slightly higher proportion of petrol was sold as unleaded in Northern Ireland(65.2%, [Department of the Environment, Northern Ireland, (1999b)]) comparedwith in Great Britain (63.0%, [DTI (1999)]). This would be expected if a higherproportion of cars were fitted with catalysts which require them to be run onunleaded petrol.
Neither the vehicle licensing statistics nor traffic flow data for Northern Irelandwere able to separate private cars from light goods vehicles or vans (LGVs)(Department of the Environment for Northern Ireland, 1997). However, theproportion of diesel vehicles in the PLG class in Northern Ireland was 23.3% in1995 (Department of the Environment, Northern Ireland, 1999b) compared with13.6% in Great Britain (DETR, 1999). This was interpreted as indicating that ahigher proportion of PLG vehicles in Northern Ireland were LGVs than in GreatBritain. In the absence of any additional information, it was assumed that theproportions of diesels in the private car fleet and in the LGV fleet were the same inNorthern Ireland as in Great Britain (8.9% and 57.1%, respectively, for 1995(DETR, 1999)). This leads to the conclusion that 29.9% of the PLG fleet and, it isassumed, the PLG vehicle kilometres in Northern Ireland were as LGVs.
Traffic data
The preferred indicators for road transport activity in emission inventories are trafficdata in terms of vehicle kilometres travelled per year disaggregated by vehicle and

AEAT/R/ENV/0314 Issue 1
NS
AEA TechnologyNational Environmental Technology Centre
road type. For the UK national inventory (the NAEI), vehicle kilometre data forthe road network in Great Britain are provided by DETR for each vehicle type onroads classified as trunk, principal and minor roads in built-up areas (urban) andnon-built-up areas (rural) and motorways (DETR, 1999a). These estimates arebased on traffic counts from the rotating census and core census surveys (DETR,1999).
Whilst vehicle kilometre data for 1990, 1995 and 1998 were available from DETRseparated into the road networks in England, Scotland and Wales, combining thisinformation with the fleet data and vehicle fuel consumption factors leads to ananomalously high growth in petrol and diesel consumption in Scotland between1990 and 1995 when compared with the trends calculated for England and Wales.It is also a trend which is not borne out by actual fuel delivery statistics for Scotland.For example, calculations based on traffic flow suggest a 12% growth in petrolconsumption in Scotland between 1990 and 1995 (52% growth in dieselconsumption) compared with an 11% decrease in petrol consumption in England andWales (23% growth in diesel consumption) over the same period. Actual fueldelivery statistics from DTI (1999) suggest a similar trend over this period forEngland, Scotland and Wales: a 9% decrease in petrol consumption and a 24-27%increase in diesel consumption.
Closer inspection of this inconsistency between fuel delivery and vehicle kilometredata for the regions suggested that the problem lay in the vehicle kilometre figuresfor minor roads in the regions. These make a significant contribution to the totaltraffic flow on the road networks. It is believed by DETR that anomalous trends inthe minor road traffic data for Scotland is probably due to a sampling artefact of thetraffic census and this leads to high levels of uncertainty in the minor road data forthe smaller regions.
Fuel consumption in the regions
Because of the high level of uncertainty in the minor traffic flow data for theregions, it was felt that inland fuel deliveries of petrol and diesel in the regions werebetter indicators of traffic activity.
Fuel delivery data for 1990, 1995 and 1998 are available for England & Wales,Scotland and Northern Ireland from DTI (1993, 1998, 1999). Separate fueldelivery data for Wales was available from the Welsh Office for 1990, but not for1995 (WO, 1998). Therefore, the split in petrol and diesel consumed betweenEngland and Wales in 1990 was assumed to apply to the DUKES England & Walestotal for 1995 and 1998. This was felt a reasonable assumption to make on the basisthat the model predictions of the relative proportions of fuel consumed in Englandand Wales based on traffic data in 1990 were very similar to the actual figures basedon fuel deliveries in these regions and the model predictions were that theEngland/Wales split for 1995 would be very similar to 1990.

AEAT/R/ENV/0314 Issue 1
NT
AEA TechnologyNational Environmental Technology Centre
The fuel data showed reductions in diesel consumption (-11%) and a largerreduction in petrol consumption (-36%) from 1990 to 1998 in Northern Irelandcompared to increases in diesel consumption (+44%) and reductions in petrol use(-9.5 %) in England, Scotland and Wales.
Method for calculating emissions of CO2, CH4 and N2O from roadtransport in the regions
The sum of the petrol and diesel fuel deliveries in England, Scotland, Wales andNorthern Ireland each year were normalised against the total amounts of these fuelsconsumed by road transport in the UK, as estimated by the NAEI, to derive theamounts consumed by road transport in each of the regions. This then takesaccount of the very small amount of these fuels consumed by off-road vehicles andmachinery.
The normalised fuel consumption data for England, Scotland, Wales and NorthernIreland leads directly to the CO2 emissions for road transport in the regions.Although there will be movement of traffic across borders between regions, so thatsome emissions at source will be in a region adjacent to that where the fuel wasactually purchased, this procedure adopted is consistent with IPCC guidelines onreporting Greenhouse emissions which states that emissions are to be attributed tothe country in which the fuel is loaded into the vehicle.
To calculate CH4 and N2O emissions from road transport using fuel consumption inthe regions as an activity factor for traffic, it was necessary to:
a) Partition the fuel consumed in each region by each main vehicle type (petrolcar, diesel car, petrol LGV, diesel LGV, rigid and articulated HGV, buses andmotorcycles), and
b) Derive fleet-averaged, fuel based emission factors for each main vehicle typeand pollutant
The amount of petrol and diesel fuel consumed in each of the regions waspartitioned between each of the main vehicle types according to the fuel efficiencyfactors of all the vehicle sub-categories shown in Table A1.3 (in g fuel/km) and therelative distances they travelled each year on each road type in the region.
Fuel-based emission factors in units of g pollutant/kg fuel consumed werecalculated from the vehicle kilometre-based emission factors (Salway, 2000) andfuel consumption factors of Table A1.3 and an average value derived for each mainvehicle type, weighted according the proportion of mileage travelled by eachemission standard on each type of road.
Emissions from each main vehicle type in the region were then calculated bymultiplying the fuel-based emission factors with the amount of fuel consumed bythe vehicle type in the region.

AEAT/R/ENV/0314 Issue 1
NU
AEA TechnologyNational Environmental Technology Centre
Following this procedure ensured that the emissions for each region were consistentwith the amount of fuel consumed there and also took account of the regionaldifferences in the fleet composition and traffic mix in terms of the age of the fleet(i.e. the newer fleet in Northern Ireland compared with Great Britain) and therelative distances travelled on each road type.
1.4.3 RailwaysEmissions from railway locomotives were disaggregated based on diesel oilconsumption data for 1997 supplied by Railtrack (1999) and NIR (2000). Data forearlier years was not available. The data is reported on the basis of railwaycompanies whose area of operation could in most cases be allocated to one of thefour regions. Some companies operations were spread across regions and it wasnecessary to allocate fuel consumption based on their advice.

AEAT/R/ENV/0314 Issue 1
NV
AEA TechnologyNational Environmental Technology Centre
Table A1.3 Fuel Consumption Factors for Road Transport (in g fuel/km)

AEAT/R/ENV/0314 Issue 1
OM
AEA TechnologyNational Environmental Technology Centre
Emission Urban Rural Rural Motorwaystandard single dual
c/way c/way
Petrol cars Pre- ECE 79.5 61.7 62.2 77.1ECE 15.00 68.3 50.8 49.4 62.8ECE 15.01 68.3 50.8 49.4 62.8ECE 15.02 63.0 49.7 50.0 64.9ECE 15.03 63.0 49.7 50.0 64.9ECE 15.04 55.9 44.4 47.0 58.2Stage I (91/441/EEC) 62.9 48.9 47.4 74.9Stage II 62.9 48.9 47.4 74.9
Diesel cars Pre-Stage I 61.6 45.7 41.4 64.0Stage I 46.7 35.0 29.2 37.2Stage II 46.7 35.0 29.2 37.2
Petrol LGV Pre-Stage 1 83.9 64.4 60.7 93.9Stage I 83.9 64.4 60.7 93.9Stage II 83.9 64.4 60.7 93.9
Diesel LGV Pre-Stage 1 74.1 65.7 80.2 149Stage I 94.1 78.6 76.2 104Stage II 94.1 78.6 76.2 104
HGV rigid Old 251 171 157 164Pre-Stage I 251 171 157 164Stage I 251 171 157 164Stage II 251 171 157 164
HGV artic Old 502 371 345 297Pre-Stage I 502 371 345 297Stage I 502 371 345 297Stage II 502 371 345 297
Buses Old 376 262 240 198Pre-Stage I 376 262 240 198Stage I 376 262 240 198Stage II 376 262 240 198
Motorcycles < 50 cc 18 18 18 18> 50 cc, 2st 30 30 30 30> 50 cc, 4st 38 38 38 38

AEAT/R/ENV/0314 Issue 1
ON
AEA TechnologyNational Environmental Technology Centre
Table A1.4 Transport1
IPCC Category NAEI Sources Activity: Fuel Consumption 1990 1995/1998Civil Aviation NA Aviation Gasoline, Jet Gasoline Unallocated UnallocatedRoad Transportation Road Transport Petrol, diesel oil Road fuel sales, DTI, vehicle km, DETR Road fuel sales, DTI, vehicle km, DETRRailways Railways Gas oil, Regional gas oil consumption,
1997,Railtrack, NIRRegional gas oil consumption,1997,Railtrack, NIR
Navigation Coastal gas oil, fuel oil Unallocated except for terminals Unallocated except for terminalsOther Aircraft Support gas oil Regional aircraft movements Regional aircraft movements1 See Table A1.9 for abbreviations

AEAT/R/ENV/0314 Issue 1
OO
AEA TechnologyNational Environmental Technology Centre
Table A1.5 Other Sectors1
IPCC Category NAEI Sources Activity: Fuel Consumption 1990 1995/1998Commercial/Institutional Miscellaneous, Public service, Coal SPRU database: Miscellaneous; coal SPRU database: Miscellaneous; coal
Other non-industrial SSF NAEI spatial inventory NAEI spatial inventoryNatural gas Commercial Sales, DTI Natural gas consumed, TranscoLandfill gas Landfill methane Emissions Landfill Methane EmissionsSewage gas Sewage methane recovered Sewage methane recoveredfuel oil SPRU database: miscellaneous;
natural gasSPRU database: miscellaneous;natural gas
gas oil Regional Oil Consumption, DTI,WO. Remainder after other uses.
Regional Oil Consumption, DTI,WO. Remainder after other uses.
Burning oil As other industry As other industryRailways(Stationary) fuel oil, burning oil, coal Regional gas oil consumption,
1997,Railtrack, NIRRegional gas oil consumption,1997,Railtrack, NIR
Natural gas England EnglandResidential Domestic Coal, anthracite Coal consumption, NIO, WO Based on 1995 coal sales data, NIO
SSF, coke See text See textNatural gas Domestic gas, DTI Customers < 73200 kWh, DTIBurning oil Regional burning oil, DTI, WO.
LRC data for NI.Regional burning oil, DTI, WO.LRC data for NI.
Gas oil, LPG Regional population, ONS, LRCdata for NI
Regional population, ONS, LRCdata for NI
Fuel oil, wood Regional population, ONS Regional population, ONSHouse & Garden DERV, petrol Regional dwellings, ONS Regional dwellings, ONS
Agriculture/Forestry/Fishing
Agriculture coal, coke, fuel oil, gas oil,natural gas
Agricultural employment, MAFF Agricultural employment, MAFF
burning oil Regional burning oil, DTI, WO Regional burning oil, DTI, WOstraw Wheat production, MAFF Wheat production, MAFF
Agriculture Power Units Gas oil, petrol Agricultural employment, MAFF Agricultural employment, MAFFFishing gas oil, fuel oil Unallocated Unallocated

AEAT/R/ENV/0314 Issue 1
OP
AEA TechnologyNational Environmental Technology Centre
1 See Table A1.9 for abbreviations

AEAT/R/ENV/0314 Issue 1
OQ
AEA TechnologyNational Environmental Technology Centre
1.5 OTHER SECTORS
1.5.1 Commercial/Institutional
The NAEI categories, public administration, miscellaneous and other non-industrialwere combined because regional statistics are not available to this level of sectoraldisaggregation. Only WO (1998) reports miscellaneous coal consumption, whereasNIO (1999) reports only an industrial category. Estimates for 1990,1995 and 1998were based on the SPRU database for miscellaneous coal consumption.
DTI (1992) reports regional gas sales to the commercial sector for 1990. For 1995and 1998 Transco data was used for regional gas consumption in the 73-732 MWhrange. This is the closest data available for commercial/institutional consumers inthese years but is rather smaller than the UK data reported by DTI (1999).
For fuel oil, the SPRU drivers for oil were used.
Stationary combustion by the railway sector is classified as commercial.Consumption of burning oil, fuel oil, and coke is tiny and was allocated accordingto the diesel oil driver used for locomotives. Natural gas consumption forelectricity generation refers to the London Underground.
1.5.2 Residential
Domestic coal consumption is reported in NIO (1999) up to the present and inWO (1998) to 1993. These data also include anthracite and for NI other solidsmokeless fuels. Domestic coal consumption for 1995 was estimated from sales data,gathered from major coal producers. A mass balance was performed on production,imports, stock-changes and imports. Coal was allocated to sources whereconsumption was known or estimated using other drivers (power generation, iron& steel, cement kilns) and imports allocated to the most likely consumers (steamcoal to power generation; coking coal to coke production; anthracite to domesticanthracite). It was assumed that the degree of penetration of imported anthracitewas the same for England, Scotland and Wales. All coal in Northern Ireland isimported, mostly from abroad. English and Welsh sales data was fairly complete butScottish data was incomplete and only accounted for around 71% of Scottishproduction. Hence it was necessary to estimate Scottish consumption as thedifference between the UK and the other regions. Stock changes are significant andwere disaggregated on regional production (Coal Authority, 2000). The estimatesobtained are likely to be fairly approximate. For 1990, data for Wales, NorthernIreland and UK are available; hence consumption in England and Scotland wasestimated by interpolation based on the 1995 split between England and Scotland.The 1998 coal sales data was too incomplete to apply the mass balance methodsatisfactorily. The procedure adopted was to assume all imported domesticanthracite was used in Northern Ireland and to apply the 1995 driver to England,Scotland and Wales.

AEAT/R/ENV/0314 Issue 1
OR
AEA TechnologyNational Environmental Technology Centre
The regional data available is not sufficiently detailed to report consumption ofmanufactured solid smokeless fuels (SSF). Hence a driver was estimated based theNAEI disaggregated inventory database. This uses the distribution of smoke controlareas and assumes a distribution for areas where there is no gas consumption (i.e.population density < cut off value) and allocates the UK SSF consumption to theseareas. The Northern Ireland data includes SSF imports under coal and anthraciteand so a correction was applied to avoid double counting. The same driver wasused for commercial and other industry.
Domestic natural gas data is available for 1990 (DTI, 1991), and a very similarcategory; customers consuming less than 73200 kWh is reported in later editions.
DTI (1999, 1991) reports regional consumption of liquid fuels but only as totals for:England and Wales combined; Scotland and Northern Ireland. WO (1998) reportssimilar data on liquid fuel consumption up to 1993. A large proportion of burningoil (76%) is consumed in the domestic sector and in the previous inventory theregional totals were used as the domestic driver. However, this resulted in a veryhigh estimate for domestic consumption in Northern Ireland in 1998. This couldnot be reconciled to the house conditions survey. The procedure adopted was toestimate Northern Ireland's domestic consumption from the house conditionssurvey and then to allocate consumption England, Wales and Scotland according tothe totals. The Welsh consumption was extrapolated from 1993.
The consumption of fuel oil by the domestic sector is tiny and was distributedaccording to population ONS (2000). For gas oil, it was necessary to account forthe pattern of consumption in Northern Ireland. Here data from the HouseConditions Survey used in the Greater Belfast Local Inventory (LRC, 1999)suggested that most domestic oil consumption is burning oil. Hence as asimplifying assumption domestic gas-oil consumption was taken as zero. Domesticgas oil consumption for England, Scotland and Wales was allocated on population.
The domestic consumption of liquid petroleum gas in Northern Ireland isproportionately higher than in Great Britain because of the lack of mains gas. Theconsumption for Northern Ireland was estimated using data on the consumptionper household from the House Conditions Survey used in the Greater Belfast LocalInventory (LRC, 1999). Consumption for England, Scotland Wales was allocatedon the basis of population.
1.5.3 Agriculture/Forestry/Fisheries
Regional fuel consumption by agriculture is not available. Emissions were allocatedon the basis of employment, MAFF (2000). Fishing emissions are unallocated.

AEAT/R/ENV/0314 Issue 1
OS
AEA TechnologyNational Environmental Technology Centre
1.6 MILITARY
Emissions from military aircraft and naval vessels were unallocated. Army emissionsare included in the road transportation and public service categories and cannot beidentified.
1.7 FUGITIVE EMISSIONS FROM FUELS
1.7.1 Coal Mining
Methane emissions arise from coal mining activities. Emissions are estimated basedon the amounts of deep mined and open cast coal produced. Hence regionalestimates were obtained on regional coal production derived from a number ofsources: Coal Authority (2000), BGS (1991,1996), WO (1998), SO (1999), DTI(1996). A small emission occurs from coal storage and transport, which is based ondeep mined coal production. Data suggests that only small amounts of coal aretransported outside of the region of production and no attempt was made to allowfor this. The UK estimate of coal bed methane emissions neglects emissions fromabandoned mines, as these are believed to be negligible.
1.7.2 Solid Fuels Transformation
For coke ovens, three fugitive emissions are estimated:
1. A ‘residual’ emission of CO2 which reflects the difference between the carboninput to the coke oven and the carbon content of the coke and coke-oven gasproduced.
2. Emissions from the flaring of coke-oven gas.3. Emissions of methane from the process.
These were disaggregated based on the regional consumption of coking coaldiscussed in 1.1.3.3.
For solid smokeless fuel (SSF) plant, the only fugitive emissions estimated, were the‘residual’ CO2 emission and the process methane. The driver used was the regionalconsumption of coal by SSF plant (see 1.1.1.3). It is known that some petroleumcoke is used in SSF production but the amount is uncertain. The same driver wasapplied to the petroleum coke consumption.
1.7.3 Oil and Natural Gas
All emissions from the offshore industry have been classified as unallocated.However some emissions occur from on-shore oil and gas terminals in England andScotland and from the on-shore oil and gas fields.

AEAT/R/ENV/0314 Issue 1
OT
AEA TechnologyNational Environmental Technology Centre
The estimates of terminal flaring emissions are based on UKOOA (1999) data for1995 and 1998. Data is unavailable for 1990, so these were extrapolated based onflaring volumes for Scottish Terminals and natural gas arrivals to gas terminals inEngland (DTI, 1991, 1996). Also included were estimates based on flaring volumesfrom on-shore fields in England (DTI, 1991, 1996). Wytch Farm which lies a fewmiles off the south coast of England was classified as on-shore for this purpose.
UKOOA was able to supply fugitive emissions of CO2 and methane from terminalsfor 1995 and 1998. Estimates for 1990 were extrapolated using data on arrivals ofoil and gas in England and Scotland (DTI, 1991, 1996). Emissions of methane alsooccur at oil terminals when loading tankers. These were allocated to Scotland.Fuel use in terminals is discussed in 1.1.3.4 and 1.1.5.1.
The UK Inventory estimates emissions of methane from leakage from the naturalgas transmission system. The estimates are based on Transco estimates of specificleakage rates from the mains and services and data on the stock of mains andservices. The baseline estimate is for 1991; subsequent years are based on theupgrading of the system. Recently Transco have developed a new model whichproduces regional leakage estimates from the low-pressure transmission system for1998. The emission for 1998 from the new model is about 10kt CH4 higher thanthe old which was used for the ‘official’ 1998 estimate in Salway (2000). The newestimate is used in the current work with the result that the sum of the methaneemissions from England, Scotland and Wales is slightly higher than the ‘official’ UKestimate. The 1998 regional split was applied to the estimates of the ‘old’ model toobtain estimates for 1990 and 1995. Whilst leakage from low-pressure mains andservices accounts for most of the emission, there is also a contribution from high-pressure mains, storage and other losses. These additional emissions were allocatedusing the same regional split as the low-pressure leakage.

AEAT/R/ENV/0314 Issue 1
OU
AEA TechnologyNational Environmental Technology Centre
Table A1.6 Fugitive Emissions from Fuels1
IPCC Category NAEI Sources Activity: Fuel Consumption 1990 1995/1998Coal Mining Deep mined coal
Coal storage & transportDeep mine coal production Regional deep mine production,
CARegional deep mine production,CA
Open cast coal Open cast mine coal production. Regional open cast mineproduction, CA
Regional open cast mineproduction, CA
Solid fuel transformation Coke production Coke production Coal feed to coke ovens, ISSB,WS, DTI
Coal feed to coke ovens, ISSB,WS, DTI, PI
Flaring Coke oven gas Coal feed to coke ovens, ISSB,WS, DTI
Coal feed to coke ovens, ISSB,WS, DTI, PI
SSF production CoalPetrocoke
Coal feed to SSF plant, DTI, WS Coal feed to SSF plant, DTI, WS
Oil Offshore Oil & Gas NA Fugitive emissions from Terminals(extrapolated)
Fugitive emissions from Terminals,UKOOA
Onshore Loading Oil loaded All Scotland All ScotlandVenting and Flaring Offshore Flaring Volume gas flared Flaring at terminals and onshore
fields, UKOOA, DTIFlaring at terminals and onshorefields, UKOOA, DTI
Natural Gas Gas Leakage Natural gas leakage Transco estimate for LP mains Transco estimate for LP mains1 See Table A1.9 for abbreviations

AEAT/R/ENV/0314 Issue 1
OV
AEA TechnologyNational Environmental Technology Centre
1.8 INDUSTRIAL PROCESSES
These sources report process and fugitive emissions from industrial processes asopposed to the emissions from fuel combustion used to provide energy to theseprocesses. Table A1.2 covers combustion emissions. The drivers used for theseprocesses are summarised in Table A1.7
1.8.1 Minerals Industries
Large emissions of CO2 arise from the degradation of limestone used in cement andlimekilns. Cement emissions are estimated from the production of cement clinker,hence regional emissions were estimated based on percentage capacity data for theregions supplied by British Cement Association (2000). Discussions with regulatoryauthorities (Environment Agency, Scottish Environmental Protection Agency, andin Northern Ireland, the Department of the Environment) suggested that, limecalcination only occurs in England.
Limestone and dolomite are also used in iron and steel production. Discussionswith British Steel suggested it would be impossible to identify all the different usesof limestone and dolomite in iron and steel making. The major use is in blastfurnaces, and so emissions were disaggregated on regional iron production (ISSB,1991, 1996, 1999).
Limestone, dolomite and soda ash are also used in glass production. Emissions weredisaggregated using plant capacity data for 1995/96 supplied by British Glass (1999).
1.8.2 Chemical Production
The UK Inventory reports emissions of carbon dioxide from ammonia production;nitrous oxide from adipic acid production and nitrous oxide from nitric acidproduction. The ammonia and adipic acid plants are in England. Nitric acid isproduced in England and Northern Ireland and estimates were based on the plantcapacities and estimated emission factors.
1.8.3 Metal Production
In the iron and steel industry, emissions of CO2 arise from electric arc furnacesthrough the consumption of the graphite anodes. Regional data on steelproduction from electric arc furnaces was used as the driver (ISSB, 1991, 1996,1999). The flaring of waste blast furnace gas was distributed according to thedistribution of blast furnaces. The driver used was coal consumption by blastfurnaces. (ISSB, 1991, 1996, 1999).
The electrolytic process used to produce aluminium results in a CO2 emission as thepetroleum coke anode is consumed. Emissions were based on plant capacity datafor 1990,1995 and 1999 provided by Alcan (1998, 2000). The Kinlocheven plant
AEAT/R/ENV/0314 Issue 1
PM
AEA TechnologyNational Environmental Technology Centre
uses the older Soderberg process which results in a higher specific emission factor.Aluminium production also results in emissions of PFCs. Regional estimates wereobtained by Enviros March (2000) from discussions with Alcan.
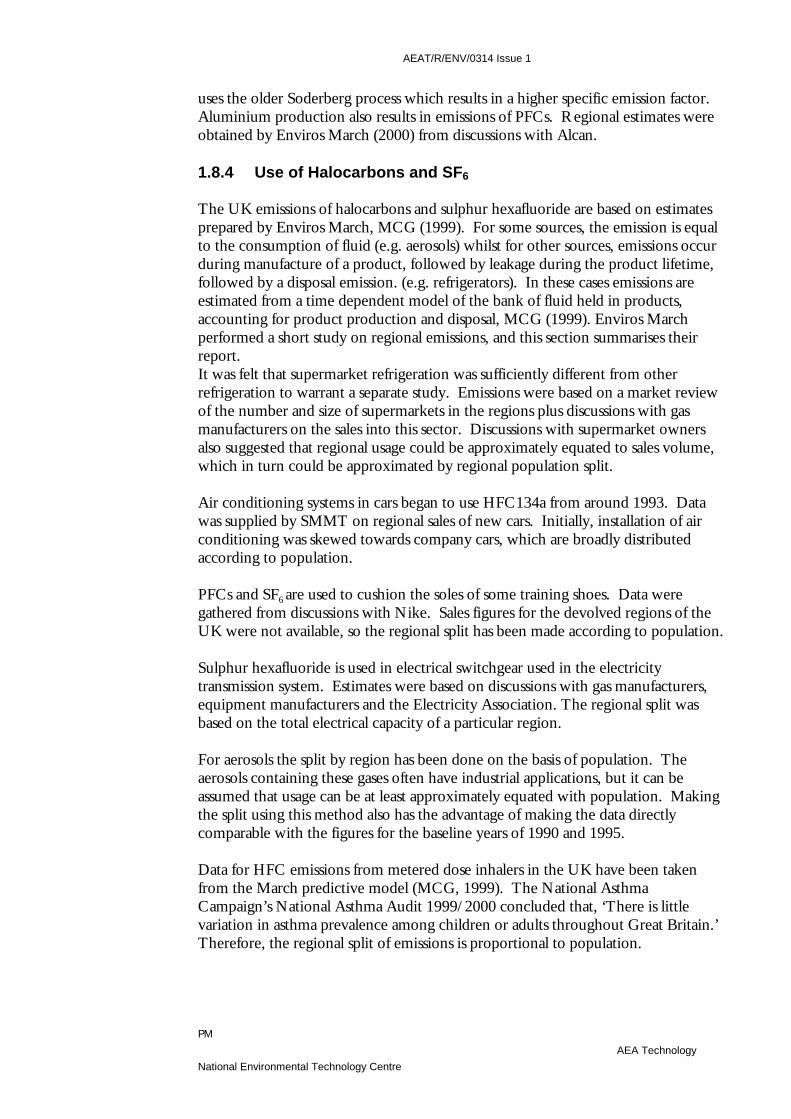
1.8.4 Use of Halocarbons and SF6
The UK emissions of halocarbons and sulphur hexafluoride are based on estimatesprepared by Enviros March, MCG (1999). For some sources, the emission is equalto the consumption of fluid (e.g. aerosols) whilst for other sources, emissions occurduring manufacture of a product, followed by leakage during the product lifetime,followed by a disposal emission. (e.g. refrigerators). In these cases emissions areestimated from a time dependent model of the bank of fluid held in products,accounting for product production and disposal, MCG (1999). Enviros Marchperformed a short study on regional emissions, and this section summarises theirreport.It was felt that supermarket refrigeration was sufficiently different from otherrefrigeration to warrant a separate study. Emissions were based on a market reviewof the number and size of supermarkets in the regions plus discussions with gasmanufacturers on the sales into this sector. Discussions with supermarket ownersalso suggested that regional usage could be approximately equated to sales volume,which in turn could be approximated by regional population split.
Air conditioning systems in cars began to use HFC134a from around 1993. Datawas supplied by SMMT on regional sales of new cars. Initially, installation of airconditioning was skewed towards company cars, which are broadly distributedaccording to population.
PFCs and SF6 are used to cushion the soles of some training shoes. Data weregathered from discussions with Nike. Sales figures for the devolved regions of theUK were not available, so the regional split has been made according to population.
Sulphur hexafluoride is used in electrical switchgear used in the electricitytransmission system. Estimates were based on discussions with gas manufacturers,equipment manufacturers and the Electricity Association. The regional split wasbased on the total electrical capacity of a particular region.
For aerosols the split by region has been done on the basis of population. Theaerosols containing these gases often have industrial applications, but it can beassumed that usage can be at least approximately equated with population. Makingthe split using this method also has the advantage of making the data directlycomparable with the figures for the baseline years of 1990 and 1995.
Data for HFC emissions from metered dose inhalers in the UK have been takenfrom the March predictive model (MCG, 1999). The National AsthmaCampaign’s National Asthma Audit 1999/2000 concluded that, ‘There is littlevariation in asthma prevalence among children or adults throughout Great Britain.’Therefore, the regional split of emissions is proportional to population.

AEAT/R/ENV/0314 Issue 1
PN
AEA TechnologyNational Environmental Technology Centre
Other sources such as fire extinguishers are very small and are likely to bedistributed with the general population.
Discussions with end-users in the magnesium industry confirmed the assumptionsmade in the emissions model; i.e. that there has been growth in production of about20-25% between 1995 and 1998, that no reclamation of SF6 was yet taking place,and that although SO2/SF6 mixtures were being looked at as an alternative for SF6,reduced legal limits of SO2 were holding back progress in this area.
Regional data for emissions of PFCs and SF6 from semiconductor wafermanufacture for the years 1995 and 1998 were kindly provided by Future Horizons,a semiconductor industry consultancy. The predicted total UK emissions closelymatch the actual emissions calculated in the current study (MCG, 1999). However,it should be noted that in light of information provided, the regional split has beenaltered for emissions in 1995. The previous figures underestimated emissions fromEngland and overestimated those from Wales. Although UK semiconductormanufacture increased by approximately 50% between 1995 and 1998, emissionsfrom this sector have actually declined by about 50%. This is due to a vastimprovement in the emissions rate of the gases, as the semiconductor manufacturershave become aware of the environmental impact of the fluids used. Initiatives havebeen undertaken to prevent evaporation to the atmosphere and for disposal in anenvironmentally responsible manner.

AEAT/R/ENV/0314 Issue 1
PO
AEA TechnologyNational Environmental Technology Centre
Table A1.7 Industrial Processes1
IPCC Category NAEI Sources Activity Data 1990 1995/98Cement Production Cement (decarbonizing) Clinker production Regional cement capacity, BCA1 Regional cement capacity, BCA1
Lime Production Lime (decarbonizing) Limestone consumption Plant in England Plant in EnglandLimestone and Dolomite Use Glass production Limestone and dolomite
consumptionRegional glass production 96/97,BGlass
Regional glass production 96/97,BGlass
Blast Furnaces Limestone and dolomiteconsumption
Iron production, ISSB Iron production, ISSB
Soda Ash Production and Use Glass production Soda Ash Consumption Regional glass production 96/97,BGlass
Regional glass production 96/97,BGlass
Ammonia Production Ammonia feedstock Natural gas feedstock Plant in England Plant in EnglandNitric Acid Production Nitric Acid Production Plant capacity Regional plant capacity Regional plant capacityAdipic Acid Production Adipic Acid Production Adipic acid made Plant in England Plant in EnglandIron and Steel Electric Arc Furnace EAF steel production Regional EAF production, ISSB Regional EAF production, ISSB
Flaring Blast furnace gas Coke Consumed in blastfurnaces, ISSB, WO1
Coke Consumed in blastfurnaces, ISSB, WO1
Aluminium Production Aluminium production Primary aluminium produced Regional aluminium plantcapacity, ALCAN
Regional aluminium plantcapacity, ALCAN
SF6 Used in Aluminium andMagnesium Foundries
SF6 Cover gas NA Regional consumption, EM1 Regional consumption, EM1
1 See Table A1.9 for abbreviations

AEAT/R/ENV/0314 Issue 1
PP
AEA TechnologyNational Environmental Technology Centre
Table A1.8 Halocarbons and Sulphur Hexafluoride1
IPCC Category NAEI Sources Activity Data 1990 1995/98Halocarbon & SF6 By-Product Emissions
Halocarbon Production NA All plant in England All plant in England
Refrigeration and AirConditioning
Refrigeration NA Regional population, ONS Regional population, ONS
Supermarket Refrigeration NA Regional population, EM Regional population, EM1
Mobile Air conditioning NA Regional population, EM Regional population, EMFoam Blowing Foams NA Regional population, ONS Regional population, ONSFire Extinguishers Fire fighting NA Regional population, ONS Regional population, ONSAerosols Metered Dose Inhalers NA Regional population, ONS Regional population, ONS
Aerosols (halocarbons) NA Regional population, ONS Regional population, ONSOther Electronics NA Regional electronics plant Consumptn, EM Regional electronics plant Consumptn, EM
Training shoes NA Regional population, EM Regional population, EMElectrical Insulation NA Regional electrical capacity, EM Regional electrical capacity, EM
1 See Table A1.9 for abbreviations

AEAT-6196 Issue 1
PQ
AEA TechnologyNational Environmental Technology Centre
Table A1.9 Summary of Abbreviations used in Tables A1.1to A1.8
BCA British Cement AssociationBGlass British GlassCA Coal AuthorityDTI Department of Trade and IndustryE EnglandEAF Electric Arc FurnaceEM Enviros March previously MCGIPCC Intergovernmental Panel on Climate ChangeISSB Iron and Steel Statistics BureauLPG Liquefied petroleum gasLRC London Research CentreMAFF Ministry of Agriculture, Fisheries and FoodMCG March Consulting Group now EMMSW Municipal Solid WasteNA Not AvailableNAEI National Atmospheric Emissions InventoryNIO Northern Ireland OfficeNIR Northern Ireland RailwaysNO Not occurringONS Office for National StatisticsOPG Other petroleum gasPI Pollution InventoryS ScotlandSSF Solid smokeless fuelSPRU Science Policy Research UnitUKOOA UK Offshore Operators AssociationUKPIA United Kingdom Petroleum Industry AssociationWO Welsh OfficeWS Welsh Statistics
1.9 AGRICULTURE
The UK inventory was disaggregated to England, Scotland, Wales andNorthern Ireland. No methodological alterations were made in terms ofemissions calculations, with defaults and emission factors carried over fromthe national inventory.
Regional crop areas were obtained from the MAFF June Agricultural Censusfor 1990, 1995 and 1998. (MAFF, 1991,1996,1999). Most of the datapreviously submitted for 1990 and 1995 is unchanged, but in 1995 the followingfigures have been updated using the latest production statistics in Agriculture in the

AEAT-6196 Issue 1
PR
AEA TechnologyNational Environmental Technology Centre
UK and Basic Horticultural Statistics for the UK (from which all crop productionnumbers are obtained):• Total cereal• Oilseed rape• Linseed• Sugar beet• Phaseolus beansFertiliser applications were derived using regional crop areas and averageapplication rates published in the British Survey of Fertiliser Practice for 1990,1995 and 1998, (BSFP, 1991, 1996, 1999). Application rates in Wales wereassumed to be equivalent to those in England, and rates in Northern Irelandwere assumed to be the same as Scottish applications. Where application rateswere not available for particular crop types, the crop area was amalgamatedwith a similar crop with a known fertiliser application rate. Where annualapplications were not available, fertiliser application for a different year wasused.
There remains a difference between the 1998 national fertiliser N figure and theUK total derived through disaggregation. The method used for disaggregating thefertiliser N application data in 1990/95 is not applicable to 1998 since there is apaucity of data for some categories. Instead, another method was used. Thisderives the fertiliser N application from MAFF census crop areas and British Surveyof Fertiliser Practice application rates, and results in a total that is only 0.04%different to the value previously submitted in the national inventory for 1998, asopposed to a 1.4% difference using the 1990/95 method and the available data.
Livestock numbers were obtained from the MAFF June Agricultural Census for1990, 1995, 1998 with the exception of deer, which were derived from thedistribution reported in Economic Report on Scottish Agriculture, (SO, 1996)The following categories have been updated in the disaggregated inventory for1998:• Dairy in milk• Dairy not in milk• Beef (including heifers in first calf)• Other cattle > 2• Other cattle < 2• Beef and all others < 2• Other cattle 1-2
As in the national inventory, the area of cultivated histosols (soils of high organiccontent) was assumed to be equivalent to the area of Eutric Histosols. This wasdisaggregated according to a percentage split estimated by the Soil Survey and LandResearch Centre (personal communication).

AEAT-6196 Issue 1
PS
AEA TechnologyNational Environmental Technology Centre
In general, the UK totals in the disaggregated inventory match well with thosesubmitted in the national inventory. Any small differences are due to the derivationof disaggregated data that was not readily available. These small differences havebeen removed by in effect normalising the regional inventories so the sum ofEngland, Scotland, Wales and Northern Ireland equals the UK Emission. Thedetails of the normalisation procedure are explained in Section 1.1.2.
1.10 LAND USE CHANGE AND FORESTRY
The estimates for Land Use Change and Forestry are from work done at the Centrefor Ecology and Hydrology (Edinburgh)✝ (Cannell et al. 1999, Milne and Brown1999).Emissions and Removals are estimated based on a model based on England,Scotland, Wales and Northern Ireland. The methodology is discussed by Milne inSalway (2000).
1.11 WASTE
1.11.1 Solid Waste Disposal on Land
In the UK Inventory, emissions are estimated based on a model of methaneproduction in landfill sites. (Brown et al, 1999). The model classifies landfill sitesinto four different types depending on their age and the extent of methane recoverysystem installed. The generation of methane is assumed to follow a first ordermodel with different decay rates for different types of waste. The model requiresdata on waste disposals and waste composition from 1945 onwards. The onlyavailable data is based on studies from 1995 onwards and previous year's data areextrapolated based on production indices.
The regional estimates were calculated using the Brown et al (1999) model. Thisinvolved estimating the input data for Wales, Scotland and Northern Ireland. Thedata estimated were:• Annual arisings of MSW. Data for Scotland, Wales, Northern Ireland and
England for 1995 are given in Brown et al (1999) and DETR (1997) and areconsistent. Previous years’ data were extrapolated using the model’s estimates forUK arisings. The 3 components (household, civic amenity, co-collection) wereallocated according to their proportions in 1995 or allocated as zero when theywere known not to occur.
✝ The land use change and forestry estimates were provided by the Institute of Terrestrial Ecology(Contract EPG/1/1/39). Technical enquiries on land use change and forestry should be addressed toDr R Milne, Centre for Ecology and Hydrology (Edinburgh), Bush Estate, Penicuik, EH26 OQB,UK (tel +44 (0) 131 445 8575. fax +44 (0) 131 445 3943, E-mail, [email protected]

AEAT-6196 Issue 1
PT
AEA TechnologyNational Environmental Technology Centre
• The model uses data on the percentage composition of MSW and the proportionof each component landfilled. The UK data were taken as defaults for theregions but were scaled so that total MSW disposals matched the known 1995data. For Scotland and Northern Ireland, this meant higher percentage disposalsthan for England and Wales. The model assumes higher disposals in the past andthese data were scaled using a single factor to produce a time series. ForNorthern Ireland, the average percentage of waste disposed of in 1995 was foundto be 95%. Scaling this using the UK historic time series gave disposals in excessof 100%. Hence a fixed disposal rate of 95% was used for all years.
• Industrial and Commercial Waste. This includes some sewage sludge. Data forScotland, Northern Ireland and England/Wales were taken from DETR (1997)and entered directly back to 1991. The 1991 entry was used for all previousyears. Welsh sewage disposals to landfill in 1996/97 were zero (EnvironmentAgency, 1999) and this value was used for all years. The remaining wastecategories were interpolated based on population and a time series produced byscaling on the UK time series.
• All other data on Degradable Organic Carbon contents distribution of landfilltypes etc was taken from the UK Model.
Emissions for England were estimated as the difference between the UK and theremaining regions. Landfill gas is recovered and used as a fuel for electricitygeneration. The methodology assumes that the degree of recovery was the same inall regions, so the methane emission driver could be used to distribute landfill gasconsumption.
1.11.2 Waste Water Handling
The UK emission of methane from sewage treatment is based on a model reportedby Hobson et al (1996). This breaks down the UK arisings of sewage into theamounts treated by up to 14 different disposal routes. Empirical emission factors areapplied to each route to estimate methane emissions. Methane recovery is assumedfor the anaerobic digestion route. The model requires estimates of the annualarisings of sewage and the proportion treated by the disposal routes. These data aretaken from the UK Sewage Sludge Survey for 1990/91 (DOE, 1993). A morerecent survey for 1995/96 has just been released (Environment Agency, 1999),however the Inventory estimates are based on the earlier work and so the regionaldisaggregation was also. The survey reports disposals of sewage for Scotland,Northern Ireland and England/Wales and gives data on disposal routes. Howeverthe data is incomplete and it was necessary to make assumptions to account for alldisposals. Where assumptions had to be made, the UK defaults were adopted. Datafor Wales were taken from the later survey since the earlier work did not specificallyidentify Wales. The Welsh estimates were based on data reported by Welsh Waterwhose area of activity does not exactly match the Welsh National Territory butshould give a reasonable estimate. Using the regional data, estimates were made for1990 and 1995 for Scotland, Northern Ireland and Wales. It was assumed that thepercentage mix of disposal routes did not change between 1990 and 1998 but thatsewage disposals increased in line with the UK.

AEAT-6196 Issue 1
PU
AEA TechnologyNational Environmental Technology Centre
The model also predicts the amount of sewage gas recovered for use or disposal.This data was used as the driver for sewage gas combustion.
1.11.3 Waste Incineration
The UK Inventory reports emissions from the incineration of sewage sludge andmunicipal solid waste. Regional estimates are based on DETR (1997) whichreports data for the amount sewage incinerated for Scotland, Northern Ireland andEngland/Wales. Wales is known to be zero (RCEP, 93). Emissions from MSWIncinerators are based on capacity data for individual incinerators taken from RCEP(1993). It is assumed there were no significant changes between 1990 and 1995.Comparison with lists prepared for 1996 (Smyllie, 1996) suggest this is reasonable.Some of these incinerators generate electricity and are reported as power stations.The consumption of these incinerators is reported in DTI (1996, 1991) and isknown to be located in England. By 1998 all UK Incinerators generated electricityand are reported as power stations.
1.12 UNCERTAINTIES
1.12.1 Introduction
The uncertainties in the UK Inventory were estimated using a Monte Carlosimulation. Eggleston et al (1999) and Salway (2000) describe this in detail. Ingeneral this involves estimating the uncertainties in the activity data and theemission factors for all the emission source categories and then using a Monte Carlosimulation package to calculate the uncertainty in the emission totals. In order toapply a similar approach to the regional inventories, it would necessary to estimateuncertainties for the regional activity data (i.e. fuel consumption, production data).The same emission factors are used in the regional inventories as in the UKInventory, so their uncertainties are known. In the UK Inventory uncertainties inthe activity data were estimated on the basis of the statistical differences betweenfuel supply and demand data reported in the energy statistics. However, such data isnot available for the regional data used. Moreover, for some sources, no directactivity data is available at all, and it was necessary to distribute the UK data usingsurrogate data (e.g. employment statistics). In such cases, it is impossible to saywhether the surrogate statistics are an accurate indicator of fuel consumption.
Given the difficulties inherent in estimating the uncertainties in the regionalestimates it is evident that such estimates are likely to be tentative and should betreated as indicative rather than a precise estimate of uncertainties.
1.12.2 Regional Uncertainty Estimation
The uncertainties in the regional inventories were estimated by a Monte Carlosimulation. In order, to simplify the calculations the source categories were farbroader than those used in the UK Inventory simulation. In the regional

AEAT-6196 Issue 1
PV
AEA TechnologyNational Environmental Technology Centre
simulation, the combustion categories were effectively the total consumption of aparticular fuel. This contrasts with the UK simulation where there was a furtherdisaggregation into sectoral categories (e.g. power stations, refineries). Therationale for this was that it was far easier to form a view of the uncertainty in thetotal consumption of a fuel in a region than to attempt to estimate uncertainties indiverse sectors where in some cases surrogates were being used.
For each of the broad source categories an estimate of the activity uncertainty wasmade for Scotland, Wales, Northern Ireland and Unallocated. The approachadopted was to estimate a factor to scale the UK. For example, sales data is availablefor burning oil consumption in Scotland and Northern Ireland. Hence, it seemsreasonable to assume that its uncertainty is similar to that of the UK burning oildata. Sales data is only available for England and Wales combined so that estimatesfor England and Wales were made by splitting the available data using population asa surrogate. Thus it was assumed that the uncertainty for Wales was twice that forScotland and Northern Ireland which were the same as the UK.
It is important to note that the uncertainties in the inventories for the UK, England,Scotland, Wales, Northern Ireland, Unallocated are not independent. This isbecause:
Emissions from UK = Emissions from England, Scotland, Wales, Northern Irelandand Unallocated
Thus, in the simulation, the uncertainties for UK, Scotland, Wales, NorthernIreland and Unallocated were estimated and the total uncertainties for UK,Scotland, Wales, Northern Ireland, Unallocated and England were calculated. It wasnecessary to check that the calculated uncertainty for England appeared reasonableand could be reconciled to the uncertainties for the other regions.
In many of the non-combustion sources (e.g. LUCF, agriculture, coal mines) theoverall uncertainty is dominated by the emission factor and the uncertainty in theactivity data is not a determining factor. Moreover, it was unlikely there would beany variation in uncertainties between regions. The practice in these cases was toassume a low uncertainty for the activity data, say 1% for each region and to use theUK uncertainty for the emission factor.
In the case of halocarbon and SF6 emissions it was not considered feasible to attemptto assume varying uncertainties across the regions. Hence it was assumed that theuncertainty of each regional emission was the same as that of the UK. This isequivalent to assuming that the emissions are correlated or that the uncertainty inthe regional activity data is very small. This is clearly not the case, but given thatthese emissions make a small contribution to the total GWP, this seemed areasonable working approximation.

AEAT-6196 Issue 1
QM
AEA TechnologyNational Environmental Technology Centre
REFERENCES
Alcan (1998, 2000), Personal Communication from J Clarkson
Bell, DM, (1999), Power Station Fuel Consumption, Personal Communication,Northern Ireland Office.
BP (2000) Personal Communication from GM Hamilton.
British Cement Association, (2000), Personal Communication from L Parrott.
British Glass, (1999), Personal Communication from A Hartley.
Brown, KA, Smith, A, Burnley, SJ, Campbell, DJV, King, K, Milton, MJT, (1999)Methane Emissions from UK Landfills, AEA Technology, AEAT-20624, Culham
BSFP (1991, 1996, 1999), British Survey of Fertiliser Practice for 1990, 1995and 1999
BGS (1991, 1996), United Kingdom Minerals Yearbook 1998, British GeologicalSurvey, Natural Environment Research Council.
Cannell, MGR, Milne, R, Hargreaves, KJ, Brown, TAW, Cruickshank, MM,Bradley, RI, Spencer, T, Hope, D, Billett, MF, Adger, WN & Subak, S (1999)National inventories of terrestrial carbon sources and sinks: the UK experience.Climatic Change 42, 505-530
Coal Authority, (2000), Regional Coal Production , Personal Communicationfrom C Colclough.
COPERT II , (1997),Computer Programme to Calculate Emissions from RoadTransport - Methodology and Emission Factors, P Ahlvik et al, European TopicCentre on Air Emissions, European Environment Agency.
Department of the Environment for Northern Ireland, (1997), Vehicle Kilometresof Travel Survey of Northern Ireland Annual Report, Department of theEnvironment for Northern Ireland Roads Service.
Department of the Environment, Northern Ireland.(1999a), Northern IrelandTransport Statistics 1997/98
Department of the Environment, Northern Ireland, (1999b), Central Statistics andResearch Branch, communication.
DETR (1999), Transport Statistics Great Britain: 1999 edition
DETR (1999a), Transport Statistics communication

AEAT-6196 Issue 1
QN
AEA TechnologyNational Environmental Technology Centre
DETR (1999b), Vehicle Licensing Statistics:1998, Transport Statistics Report.
DETR (1997), Digest of Environmental Statistics, The Stationary Office
DTI, (1991, 1992, 1996, 1997, 1999), Digest of UK Energy Statistics, 1991, 1992,1996, 1997 and 1999 editions.
DOE, (1993), UK Sewage Sludge Survey, CES Limited, HMSO
Eastern Generation (1999). Personal Communication from N Burdett.
Eggleston, HS, Salway, AG, Charles, D, Jones, BMR, Milne, R, (1998), Treatmentof Uncertainties for National Estimates of Greenhouse Gas Emissions, NationalEnvironmental Technology Centre, AEA Technology, Report AEAT - 2688.
Environment Agency (1999), UK Sewage Sludge Survey, Regional Presentation,WRc, R&D Project Record P2/065/1
Environment Agency, (1999a) The Pollution Inventory 1998
Enviros March, (2000), Report on the Emissions of HFCs, PFCs and SF6 inEngland, Scotland, Wales and N Ireland in the years 1990, 1995 and 1998. EnvirosMarch. Telegraphic House, Waterfront Quay, Salford Quays, Manchester
Hobson, J, Palfrey, R, Sivil, D, Palfrey, E, Day, M, (1996) Control Measures toLimit Methane Emissions from Sewage and Sludge Treatment and Disposal, WRc ,Report No DOE 4118
IPCC, (1997), IPCC Revised 1996 Guidelines for National Greenhouse GasInventories, Volume 1, Greenhouse Gas Inventory Reporting Instructions, IPCCWGI Technical Support Unit, Hadley Centre, Meteorological Office, Bracknell,UK.
ISSB, (1991, 1996, 1999) Iron and Steel Industry, Annual Statistics for the UK,1990, 1995, 1998. ISSB Limited
LRC(1999), Personal Communication from L Saddler, London Research Centre
MAFF(1991, 1996,1999) June Agricultural Census for 1990, 1995 and 1998.Ministry of Agriculture, Fisheries and Food
MAFF (2000). Agricultural Census Statistics for UK, Annual ReferenceTables, Labour Force. MAFF website.
MCG, (1999), UK Emissions of HFCs, PFCs and SF6 Potential Emission ReductionOptions. A study for the Department of the Environment carried out by March

AEAT-6196 Issue 1
QO
AEA TechnologyNational Environmental Technology Centre
Consulting Group. Telegraphic House, Waterfront Quay, Salford Quays,Manchester
Milne, R, and Brown, TA (1999) Methods and data for Land Use Change andForestry Sector in the 1997 IPCC Greenhouse Gas Inventory. In.: CarbonSequestration in Vegetation and Soils (Ed. by R. Milne), DETR Contract EPG1/1/39. Interim Report April 1999.
National Power, (1999), Personal Communication from T Massey
NIO, (1999), Northern Ireland Abstract of Statistics, Northern Ireland Office
NIR, (2000), Personal Communication from I Campbell, Northern IrelandRailways.
ONS, (1996, 2000), Regional Trends, Office for National Statistics
PowerGen, (1999), Power Station Fuel Consumption, Personal Communicationfrom H Evans.
Railtrack, (1999), Personal Communication from D White
RCEP (1993), Royal Commission on Environmental Pollution, 17 th Report,Incineration of Waste, HMSO, London
Salway, AG, (2000). UK Greenhouse Gas Inventory, 1990 to 1998. Annual Reportfor submission under the Framework Convention on Climate Change, NationalEnvironmental Technology Centre, AEA Technology Centre,AEAT/R/ENV/0302
SO, (1999), Scottish Energy Statistics. Paper supplied by G Winter, Scottish Office
SO, (1996), Economic Report on Scottish Agriculture, Scottish Office, 1996.
Scottish Power plc, (1999). Power Station Fuel Consumption, PersonalCommunications from J. Cain
Scottish and Southern Energy plc. (2000). Power Station Fuel Consumption,Personal Communication from A. McRae.
Smyllie, RJ, (1996), Abatement Methods and Costs for Heavy Metal Emissions toAir, Entec Report No 96047.
Transco (2000) Historic Gas Demands by Load Category, PersonalCommunication.

AEAT-6196 Issue 1
QP
AEA TechnologyNational Environmental Technology Centre
UKOOA, (1999), Personal communication from P Russell, UK OffshoreOperators Association Limited (Environment Committee)
UKPIA, (1998), Personal Communication from I McPherson, United KingdomPetroleum Industry Association Ltd
WO, (1998), Digest of Welsh Historical Statistics 1974-1996, The Welsh Office