Green houes
9
EARLY STAGE BUILDING ENVIRONMENTAL ANALYSIS CASE STUDY OF A LARGE RESIDENTIAL COMMUNITY IN INDIA Priyamwada Singh 1 , Soumitree Devadutt 2 , Pallavi Mantha 3 1 common Ground Practice LLP, New Delhi 2 The Energy and Resources Institute, New Delhi 3 Arup, New York ABSTRACT Building orientation, massing and façade design has a large influence on the indoor environment, occupant well-being and the energy footprint of the building. And simulations performed in concept design phase yield effective design solutions as they influence early design decisions. This paper presents a case study of a large government residential community located in New Delhi, India. At the onset of the project, a multitude of simulations were undertaken to assess and integrate passive design solutions. The climate and the micro-climate of the site were taken into consideration. A limited construction budget meant that efficient design strategies had to be employed to accommodate a large number of dwelling units without compromising on the indoor quality of the units. The methodology involves a new environmental analysis tool “Ladybug” to find out the optimum shading for the fenestration considering solar irradiation and Dry bulb Temperature, and daylight analysis for spaces in terms of efficient visual environment. Another software named DIVA is used for daylight analysis. This paper contains the analysis methodology with the new tools and discusses the possibilities and capabilities for some of the features: the “sun path tool”, “Psychrometric Chart”, “Wind Rose” and other tools. Through DIVA, various daylight metrics were evaluated and compared for the interior spaces for the selection of optimum fenestration design in terms of better visual quality. The results shed insight for new analysis methods for environmental design and highlight its role in early stage architectural design. INTRODUCTION Climate analysis, particularly shading and thermal control has long been used to devise passive design solutions in architectural design. Specially, in case of medium level government housing projects in India, where mechanical cooling and heating are generally not options. Passive strategies help save energy and benefit a wide range of buildings. To start out, some case studies are listed and discussed for selecting the appropriate passive strategies for similar climate types in India. (see Figure 1) Various methodologies and design tools such as Mahoney Tables (Koenigsberger, et al, 1973), Eco Charts (Krishan, et al, 2001) and computer based analysis such as Autodesk Ecotect have been used to inform the early stage design of buildings. In recent years, integrated and open source climate design tools such as Ladybug and Diva, plug-ins for Grasshopper and Rhino have been developed. These tools help realize integrated building performance solutions at an early stage. The project being studied is a 277 unit housing complex for BSES, Rajdhani Power Ltd.- a public private partnership (see Figure 2). The project is located on a 6.7 acre site in Janakpuri, East Delhi. The project consists of 4 towers with about 67 % of the site dedicated to green spaces, rainwater harvesting and solar power generation. Of the 277 units, there are 91 one bedroom units, 129 2 bedroom units and 57 three bedroom units. Figure 2 : 3 D view of housing and unit case studied Ladybug, a free and open source, developed by Mostapha Sadeghipour Roudsari, is a customizable environmental plug-in for Grasshopper for Rhino that by virtue of working in the 3D modelling interface of Rhino/Grasshopper, simplifies the process of analysis by automating and expediting calculations. Due to its integration with grasshopper’s parametric tools; there is instantaneous feedback on design modifications, making the analysis highly interactive. Diva, developed by Solemma, combines Daysim, Radiance and EnergyPlus into a daylight simulation plug-in for Rhino. Proceedings of BS2015: 14th Conference of International Building Performance Simulation Association, Hyderabad, India, Dec. 7-9, 2015. - 488 -
Transcript of Green houes

8/18/2019 Green houes
http://slidepdf.com/reader/full/green-houes 1/8

8/18/2019 Green houes
http://slidepdf.com/reader/full/green-houes 2/8
PROJECT
ArchitectLOCATION
CLIMATE
METHODOLOGY
DESIGN STRATEGIES
SHADING VENTILATION DAYLIGHTING
BIDHANI
HOUSE;
Arvind ri!h"n
Faridabad,
UP
28.4211 N,
77.3078 E
Combination of
Mahoney Tabe! "other #imate$i!%ai&ation #hart!
'$er(han)in)
and o%$re#ombination
*o%be hei)ht
i$in) !+a#e!aro%nd the#o%rtyard
*ayi)ht o+enin)!
mo!ty in N(Edire#tion
Per)oa indo-!,
'+enin)! forCro!! entiation
Per)oa, '$er( han)!
to #ontro radiation
COMFORT ACHIEVED- Maximized heat loss in summer and heat gain during winter
TAPASYA
BLOC #Ph"!e $%
SRI AUROBINDO
ASHRAM;S"n&"' Pr"("!h
Ne- *ehi,
*ehi
28./13 N,77.200 E
Combination of
Mahoney Tabe! "other #imate
$i!%ai&ation #hart!
*ee+ re#e!!ed
-indo-! too$er#ome
orientationimitation! +erform
ea)ona
Co%rtyard! indo-! and
$entiator!#ombination,inter#onne#ted-ith #o%rtyard!,
aid in #ro!!$entiation, both inroom! a! -e a!
bet-een the
#o%rtyard!
*en!e $e)etation to
modify ambient#ondition!
U++er fied )a&in)to en#o%ra)e dayi)httabe e$e -indo-!
COMFORT ACHIEVED- Medium-leel e!uili"rium in terms o# thermal and isual $om#ort
INTEGRATED
RURAL ENERGY
PROGRAMMETRAINING
CENTRE;
M"n)*h"n D"'"+
*ehi,
*ehi
28./13 N,
77.200 E
Combination of
Mahoney Tabe! "other #imate$i!%ai&ation #hart!
Chaa!
5o$erhan)!6 ofa++ro+riatede+th on !o%th
!ide +rote#tfrom !%mmer
!%n, yet ao--inter
radiation to +enetrate in
Co%rtyard! %!ed a!
mi#ro#imatemodifier
N
erti#a andori&ontao%$re!
ori&onta and$erti#a o%$re!
+re$ent! the heat
from the 9(E:N(!%n and he+! for#ro!! $entiation
2.1m -ide#orridor! !hade7;< of -a
area
COMFORT ACHIEVED- %-& C lower room tem'eratures a$hieed in summer and winter room tem'eratures
raised "( a"out ) C than in $onentional "uilding
HILL COUNTY
SE, O--ICE
COMPLE.;
SOM/ NY
yderabad,
P
17.3700 N,78.4800 E
E#ote#t and
=adian#e!im%ation!
erti#a
o%$re: >aiatta#hed at
an)e! +arti#%ar toea#h fa?adeorientation
Co%rtyard! and
!im !ab !+an!,#ombined -ith
o+erabe -indo-!ao-ed for #ro!!$entiation@ if and-hen reA%ired.
n a$era)e -indo-
-a ratio of 30< -a!a#hie$ed. Perforated
o%$re: ai! #%t thedire#t !oar )ain@ yetao-in) diff%!eddayi)ht
B%idin)
!te++edma!!in) to
ao- for !ef!hadin) on9o%th and
e!t fa#ade!
9ab -idth !+an! -ere
re!tri#ted be-teen 8(12 m for effi#ient
dayi)htin)
COMFORT ACHIEVED- **+, annual aerage shading
Proceedings of BS2015:
14th Conference of International Building Performance Simulation Association, Hyderabad, India, Dec. 7-9, 2015.
8/18/2019 Green houes
http://slidepdf.com/reader/full/green-houes 3/8
METHODOLOGY AND DISCUSSIONS
The methodology for the environmental analysis of
the proposed housing has three steps: climate,shading and daylight analysis. For the climate
analysis, various environmental parameters like Dry
Bulb Temperature (DBT), Relative Humidity (RH),
Solar Radiation, Wind (velocity and direction) are
visualised for entire year and critical monthsrepresenting the extreme conditions are evaluated in
terms of swings, ranges, time period and frequencies.
Psychrometric charts were studied for the evaluationof existing comfort periods, suitable clothing value,
wind speed and other parameters were tested for
enhancing the comfort band through passive means
in the “Ladybug Psychrometric chart” component.Ladybug’s environmental tools were compared to
existing methodologies like Koenigsberger’s“Mahoney Table Analysis” (Koenigsberger, et al,
1973) and Arvind Krishan’s “Eco Chart” (Krishan, et
al, 2001).
In shading analysis, sun path study is conducted with
respect to various other environmental factors likeDBT and solar radiation to find out the optimum
depth of shade projection for the fenestration.
Ladybug’s shading design tools like“Ladybug_ShadingDesigner” and Ladybug_Comfort
Shade Benefit Evaluator” have been used to find out
the solar cut off angles.
Daylight analysis was performed in “DIVA forRhino” plug-in. Daylight metrics, both static and
climate based, such as Daylight Factor (DF),
Illuminance levels, Spatial Daylight Autonomy(sDA) and Annual Solar Exposure (ASE) were
calculated to ensure better visual comfort with
respect to various shading depths.
Climate Analysis
As per National Building Code, India, 2005 (NBC),
the climate of New Delhi falls under the
“Composite” type. The definition of this climate asgiven by NBC is- “A climatic zone that does not
have any season for more than six months” (NBC,
2005). The characteristics for this climate are rightlydescribed by Mili Majumdar (Majumdar, 2001) as:
“Very large climatic swings over the year, i.e. very
hot and dry period of almost two and a half months
and a colder period of a shorter duration. The hot
and dry period is followed by a hot and humid,
monsoon period of about two months with
intervening periods of milder climate.”
Table 1
Climate classification for India (adapted from
Table 2, Classification of Climate, Part 8,NBC, 2005)
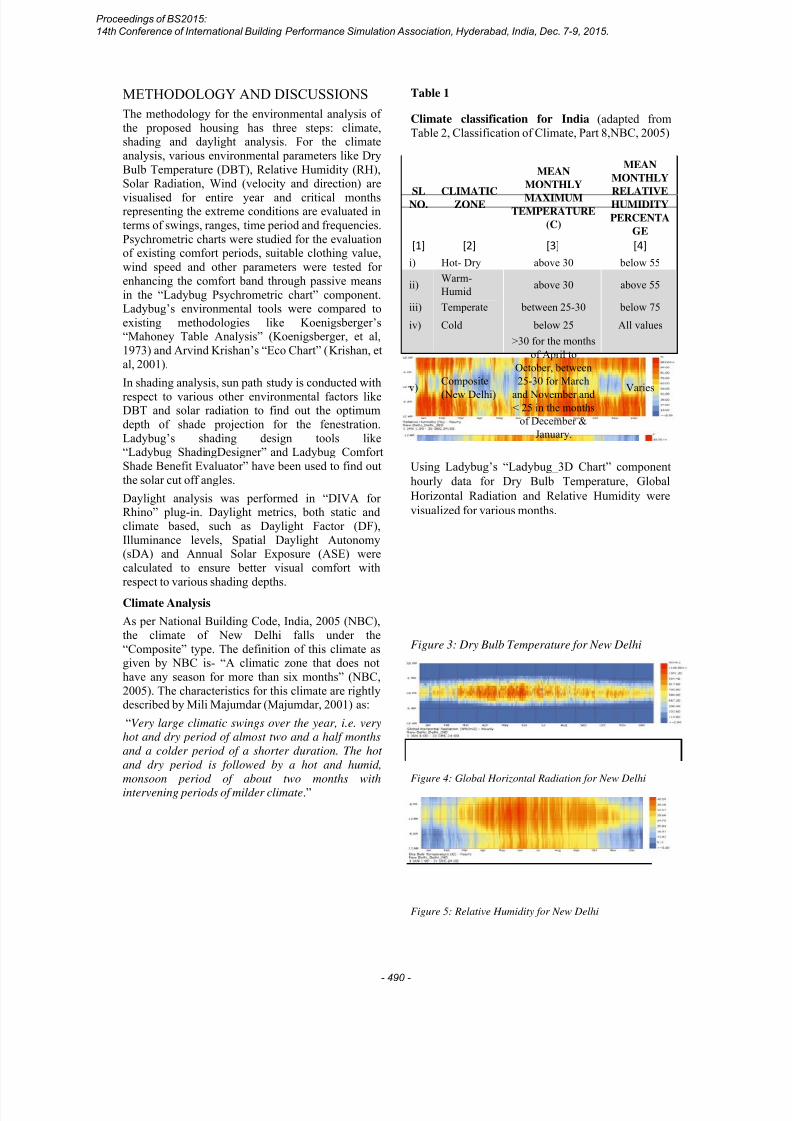
Using Ladybug’s “Ladybug_3D Chart” component
hourly data for Dry Bulb Temperature, Global
Horizontal Radiation and Relative Humidity were
visualized for various months.
Figure 3: Dry Bulb Temperature for New Delhi
Figure 4: Global Horizontal Radiation for New Delhi
Figure 5: Relative Humidity for New Delhi
SLNO. CLIMATICZONE
MEAN
MONTHLY
MAXIMUMTEMPERATURE
(C)
MEAN
MONTHLY
RELATIVEHUMIDITY
PERCENTA
GE
[1] [2] [3] [4]
i) Hot- Dry above 30 below 55
ii)Warm-
Humidabove 30 above 55
iii) Temperate between 25-30 below 75
iv) Cold below 25 All values
v)
Composite
(New Delhi)
>30 for the months
of April to
October, between
25-30 for March
and November and< 25 in the months
of December &
January.
Varies
Proceedings of BS2015:
14th Conference of International Building Performance Simulation Association, Hyderabad, India, Dec. 7-9, 2015.
- 490 -
8/18/2019 Green houes
http://slidepdf.com/reader/full/green-houes 4/8
As observed from Figure 3-5, the DBT and solarradiation are very high for the month of April to
September compared to rest of the year. The peak
DBT for these months is 45 0C and the minimum is50C. DBT swings for these months are from 38.50C
(Monthly mean Max. in June) to 22.80C (Monthly
mean Min. in April). The RH varies throughout the
year, it is maximum (>70%) in the month of April toJune, October and November. On an average it
remains below 50% for the rest of the year. The
global Horizontal Radiation is maximum in themonth of May and June (avg is > 800 Wh/m2).
Psychrometric Analysis
Psychrometric analysis was carried to calculate the
comfort potential for this climate type. The
“Ladybug_Psychrometric Chart” component
evaluates a set of DBT and RH in terms of indoorcomfort. An EnergyPlus format weather file (.epw)
was fed as an input. The comfort band was evaluated
for Predicted Mean Vote (PMV) model developed by P.O. Fanger (Fanger, 1970). The range of comfort
is generally accepted as PMV between -1 and +1, and“Ladybug_Psychrometric Chart” follows these
values for prediction of comfort band. Ladybug hasan option to modify weather parameters and
applicable passive strategies to increase the comfort
band. The default values for parameters like Mean
Radiant Temperature (MRT), wind speed, metabolic
rate and clothing value for “Ladybug_PsychrometricChart” component are 230C, 0.05 m/s (typical for
indoors) , 1 met (for a seated person) and 1 clo value
(assuming a person wearing three piece suit).
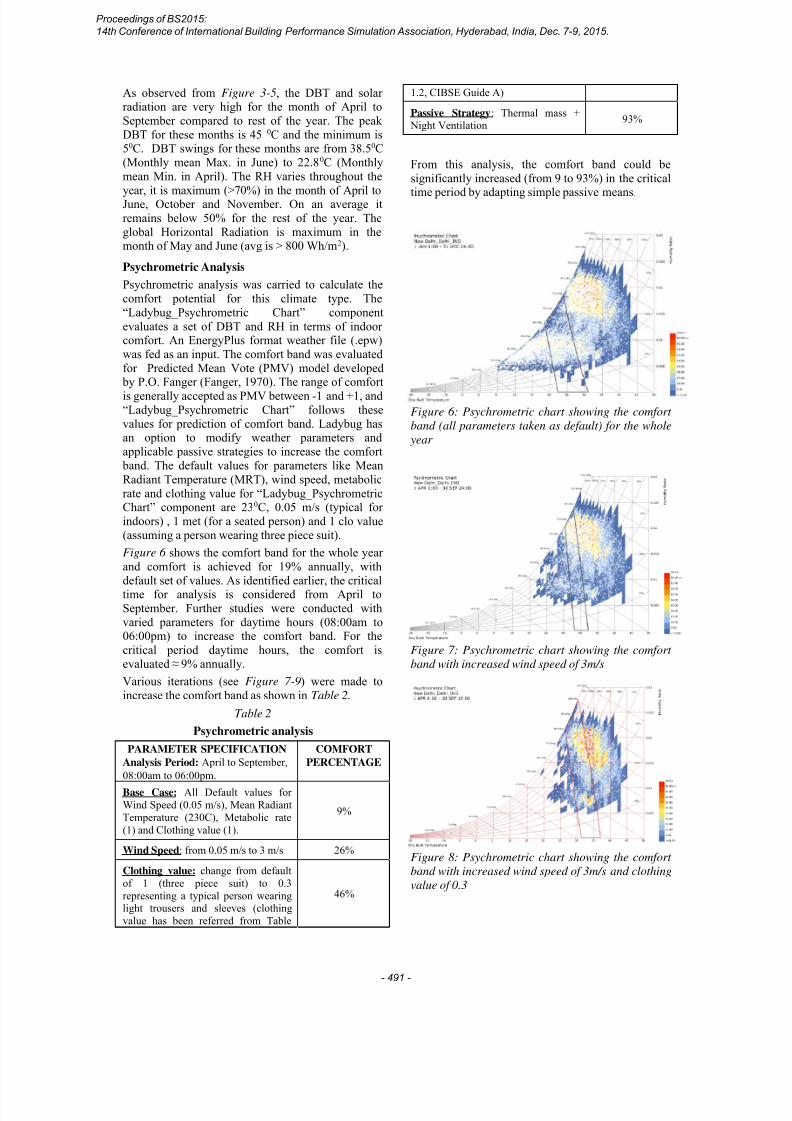
Figure 6 shows the comfort band for the whole year
and comfort is achieved for 19% annually, with
default set of values. As identified earlier, the criticaltime for analysis is considered from April to
September. Further studies were conducted with
varied parameters for daytime hours (08:00am to06:00pm) to increase the comfort band. For the
critical period daytime hours, the comfort is
evaluated ≈ 9% annually.
Various iterations (see Figure 7-9) were made to
increase the comfort band as shown in Table 2.
Table 2
Psychrometric analysis
PARAMETER SPECIFICATION
Analysis Period: April to September,
08:00am to 06:00pm.
COMFORT
PERCENTAGE
Base Case: All Default values for
Wind Speed (0.05 m/s), Mean Radiant
Temperature (230C), Metabolic rate
(1) and Clothing value (1).
9%
Wind Speed: from 0.05 m/s to 3 m/s 26%
Clothing value: change from default
of 1 (three piece suit) to 0.3
representing a typical person wearinglight trousers and sleeves (clothing
value has been referred from Table
46%
1.2, CIBSE Guide A)
Passive Strategy: Thermal mass + Night Ventilation
93%
From this analysis, the comfort band could be
significantly increased (from 9 to 93%) in the critical
time period by adapting simple passive means.
Figure 6: Psychrometric chart showing the comfort
band (all parameters taken as default) for the whole
year
Figure 7: Psychrometric chart showing the comfort
band with increased wind speed of 3m/s
Figure 8: Psychrometric chart showing the comfort
band with increased wind speed of 3m/s and clothing
value of 0.3
Proceedings of BS2015:
14th Conference of International Building Performance Simulation Association, Hyderabad, India, Dec. 7-9, 2015.
- 491 -
8/18/2019 Green houes
http://slidepdf.com/reader/full/green-houes 5/8
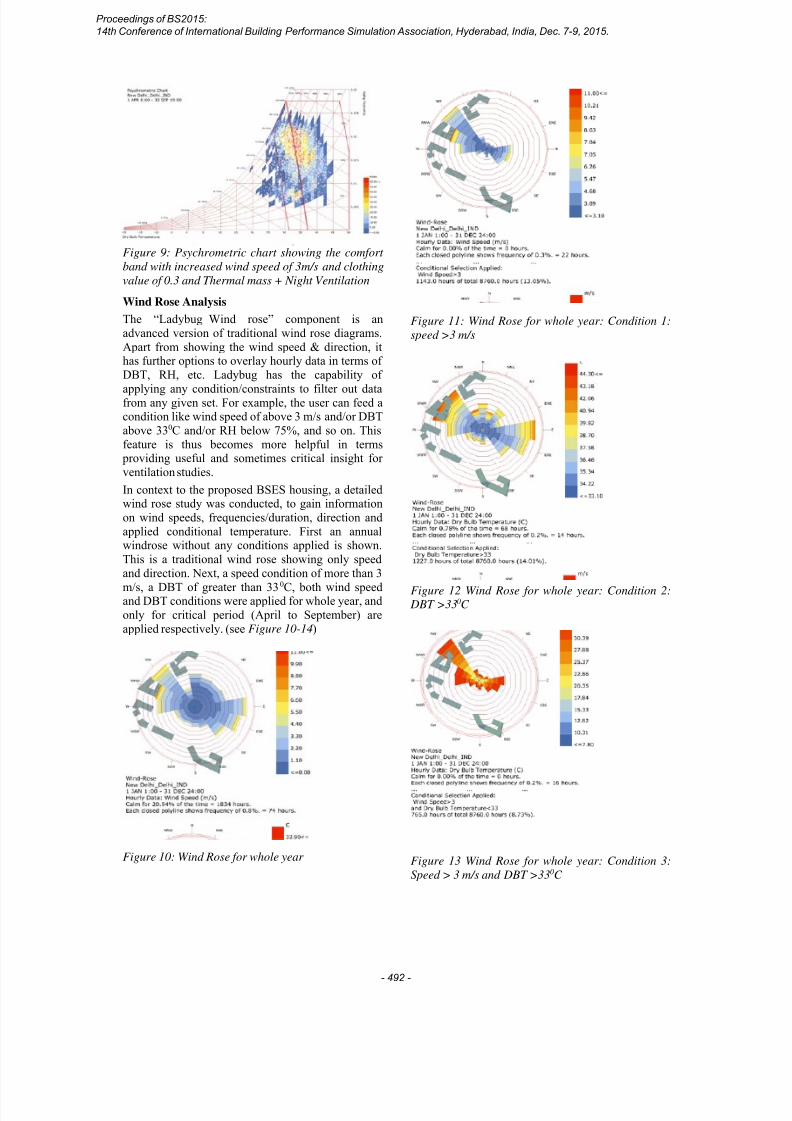
Figure 9: Psychrometric chart showing the comfort
band with increased wind speed of 3m/s and clothing
value of 0.3 and Thermal mass + Night Ventilation
Wind Rose Analysis
The “Ladybug_Wind rose” component is an
advanced version of traditional wind rose diagrams.
Apart from showing the wind speed & direction, ithas further options to overlay hourly data in terms of
DBT, RH, etc. Ladybug has the capability of
applying any condition/constraints to filter out datafrom any given set. For example, the user can feed acondition like wind speed of above 3 m/s and/or DBT
above 330C and/or RH below 75%, and so on. This
feature is thus becomes more helpful in terms providing useful and sometimes critical insight for
ventilation studies.
In context to the proposed BSES housing, a detailedwind rose study was conducted, to gain information
on wind speeds, frequencies/duration, direction and
applied conditional temperature. First an annualwindrose without any conditions applied is shown.
This is a traditional wind rose showing only speed
and direction. Next, a speed condition of more than 3
m/s, a DBT of greater than 330
C, both wind speedand DBT conditions were applied for whole year, and
only for critical period (April to September) are
applied respectively. (see Figure 10-14)
Figure 10: Wind Rose for whole year
Figure 11: Wind Rose for whole year: Condition 1:
speed >3 m/s
Figure 12 Wind Rose for whole year: Condition 2: DBT >330C
Figure 13 Wind Rose for whole year: Condition 3:
Speed > 3 m/s and DBT >330C
Proceedings of BS2015:
14th Conference of International Building Performance Simulation Association, Hyderabad, India, Dec. 7-9, 2015.
- 492 -

8/18/2019 Green houes
http://slidepdf.com/reader/full/green-houes 6/8
Figure 14 Wind Rose for critical period: Condition
4: Speed > 3 m/s and DBT <330C
From Figure 10 and 11 it is observed that, the windis available from NW, E and SE orientations. Wind
speed > 3 m/s is predominantly from the NW
orientation. Figure 10 and 11 shows the temperatureoverlay upon the speed of > 3m/s. It can be seen that
the wind from NW is accompanied with highertemperatures (> 330C). However, for the critical
period, the wind at lower temperatures (< 330C) is
also from the NW oreintation, but the frequency isquite low, i.e., only around 162 hours. From this
analysis it can be concluded that wind driven natural
ventilation can be effectively used for night time
cooling and structural cooling.
Shading Analysis
After finishing the site analysis, we performed a
detailed unit level analysis.
Three different Ladybug components were used forshading analysis of the proposed residential towers:shading period selection using “Ladybug_Sunpath”
component, form finding using
“Ladybug_ShadingDesigner” and shade benefitthrough “Ladybug_Comfort Shade Benefit
Evaluator”. Generally shading period selections
require solar cut off dates based on critical hours.
This can be based on simple methods like solarradiation and/or cooling degree-days and/or more
advanced concepts like carrying out thermal
simulations. However, through “Ladybug_Sunpath”
component it is possible to select shading period
based on multiple criteria like, cut off dates for
temperature or radiation thresholds. Ladybug offersmany options to carry out sun path study in terms of
data visualization and offers direct link betweenshading period selection and form finding process for
shades. In addition, it has a component that evaluates
benefits of any given shade in terms of comforttemperature.
Through “Ladybug_Sunpath” component it is
possible to overlay hourly data for temperature and
solar radiation at each sun position. In our study, we
applied a constraint of DBT and solar radiation toselect appropriate shading period. From the climatic
hourly data set, it was identified that a solar radiation
of more than 600 Wh/m2 is to be fixed as upper limitfor which shading is required. In addition a DBT of
more than 330C is to be avoided. This threshold has
been adopted from NBC, 2005, which says
temperature above this limit is uncomfortable for Non- Air conditioned buildings in India.
Using “Ladybug_ShadingDesigner” it is possible to
directly extract the solar cut off angles from thesunpath component and is applied for sizing of
shades for all type of fenestration. Unlike existing
sunpath tools, in which HSA (Horizontal ShadowAngle) and VSA (Vertical Shadow Angle) needs to
be calculated and then shading is designed using
these angles separately, Ladybug exchanges “Sun
vectors” to automatically design overhangs and/orvertical fins. Ladybug also has options for selecting
from various combination of shading in terms of
height restrictions, or number of shades. The analysis
was performed for three sets of conditions, whichare, 1) Global Horizontal Radiation > 600 Wh/m2, 2)DBT > 33 C and 3) a combination of condition 1 and
2, where GHR is > 600 Wh/m2 and DBT > 33 C.
These conditions are visulaized in Figure 15.
This analysis was used to calculate the size of the
overhang. This resulted in a 3.25 m depth overhang.
Since the required depth is very large, deep balconiesand horizontal louvres were designed to cut off the
high sun angles; relegating the need for additional
shading devices. ( see Figure 16)
Daylight Analysis
“DIVA for Rhino” has been used for daylight
analysis. Three metrics were evaluated: DaylightFactor, sDA and ASE. Daylight Factor gives insight
into level of daylight for interior spaces and is a
frequently used metrics in daylight analysis.According to IES LM-83, ASE is defined as the
percentage of square footage that has direct sunlight
for more than 250 hours a year. And sDA is the percentage of area that is about 30 fc for 50% of the
time. ( IES LM-83-12, 2012)
Two cases, one without any shading and the otherwith proposed shading (as evaluated from
Ladybug_Shading Designer) were evaluated for a
typical room as highlighted in figure 15. From figure15 it can be observed that, in both the cases Daylight
Factor is more than 5%, which exceeds therecommended levels in residential spaces, asindicated by SP 41, 1987. Also sDA is 100% in both
the cases, however ASE in both the cases is well
above (54% & 24%) the IES recommended value
(13%). (see Figure 16)
Proceedings of BS2015:
14th Conference of International Building Performance Simulation Association, Hyderabad, India, Dec. 7-9, 2015.
- 493 -

8/18/2019 Green houes
http://slidepdf.com/reader/full/green-houes 7/8
Figure 15 : Shading Analysis and Final form of
shade
VSA
Conventional Method
Shading Period: Solar cut off dates –
VSA – Overhang Size
Proposed Method
Shading Period: Sun Vectors – Overhang Size
Apply conditions:
DBT >330C
Global Horizontal Radiation > 600 Wh/m2 Shade Benefit Analysis
Final
formof
shade
Condition 1: Global Horizontal
Radiation > 600 Wh/m2
Condition 2: Dry Bulb Temperature > 330C
Condition 3: GHR > 600 Wh/m2 and DBT > 330C
Proceedings of BS2015:
14th Conference of International Building Performance Simulation Association, Hyderabad, India, Dec. 7-9, 2015.
- 494 -

8/18/2019 Green houes
http://slidepdf.com/reader/full/green-houes 8/8
Figure 16 : Daylight Analysis- Unit Case studied
CONCLUSIONS
From our study we found that the software was
intuitive and easy to use. The highly visualinteractive results help architects in converting
technical information into design solutions. Since the
tools used in this paper plug-in to a 3D environment,
namely Rhino, that architects already use, the need
for additional analysis models is reduced. And so,
design solution making can be undertaken in real-time.
On this project, these tools were used to find outoptimal shading solutions, while maintainingacceptable daylight levels.
REFERENCES
CIBSE GuideA Environmental Design 2001. The
Chartered Institution of Building Services
Engineer, London.
SP 41- Handbook on Functional Requirements of
Building (other than Industrial Building) 1987.
Koenigsberger, O.H., Ingersoll, T.G., Mayhew, A.,
Szokolay, S.V. 1973. Manual of Tropical
Housing and Building, Climate Design,
University Press (India) Private Limited,Hyderabad India.
Krishan, A., Baker, N., Yannas, S., Szokolay, S.V.
2001. Climate Responsive Architecture, A
Design Handbook for Energy Efficient
Buildings, Tata McGraw- Hill Publishing
Company Limited, New Delhi India.
Majumdar, M., Energy Efficient Buildings in India
2001. Tata Energy Research Institute and
Ministry of Non-conventional Energy Sources, New
Delhi India.
Roudsari, M.S., Pak, M., 2013. Ladybug: a
Parametric Environmental Plugin for
Grasshopper to Help Designers Create an
Environmentally-conscious design, BS 2013,
13th Conference of International Building
Performance Simulation Association, Chambery,
France, August 26-28, 2013.
Fanger, P.O., 1972. Thermal Comfort: Analysis and
Applications in Environmental Engineering,
McGraw-Hill Book Company, New York USA.
IES LM-83-12, 2012. Approved Method: IES Spatial
Daylight Autonomy (sDA) and Annual Sunlight
Exposure (ASE), STANDARD by Illuminating
Engineering Society, USA.
Roudsari, M.S., Ladybug Workshop @PennDesign
April 2014. Youtube Video Tutorials,
https://www.youtube.com/playlist?list=PLkjfD
mSc5OrzBgdPWQB7rbqFycWpbxtaN
Roudsari, M.S., New Set of Ladybug and Honeybee
Video Tutorials, 2014.
http://www.grasshopper3d.com/group/ladybug/f
orum/topics/new-set-of-ladybug-and-honeybee-
video-tutorials
Lagois, K., Diva for Rhino, Environmental Analysis
for Buildings, Video Tutorials, 2015.
http://diva4rhino.com/user-guide/getting-
started/video-tutorials
DF:Without
shading
sDA:Without
shading
sDA:With
shading
DF:With
shading
Proceedings of BS2015:
14th Conference of International Building Performance Simulation Association, Hyderabad, India, Dec. 7-9, 2015.
- 495 -