Graphing Technology Lab TI-Nspire™ Solving Exponential ...
2
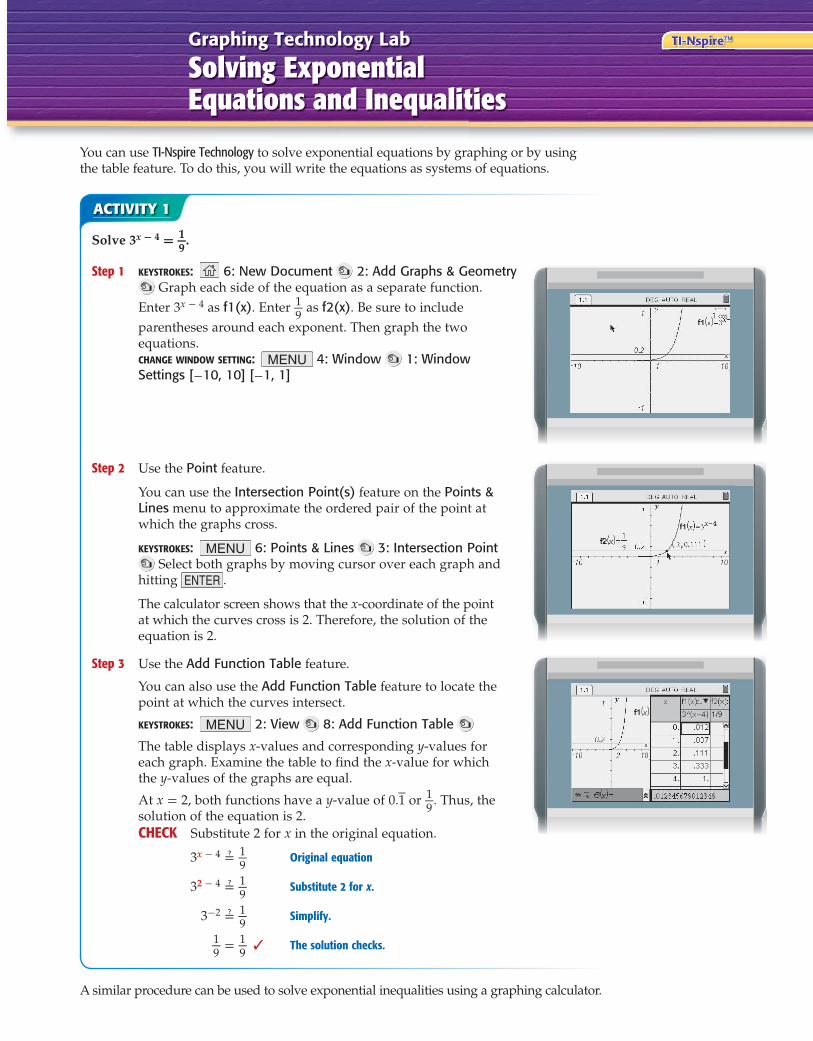
Graphing Technology Lab Solving Exponential Equations and Inequalities You can use TI-Nspire Technology to solve exponential equations by graphing or by using the table feature. To do this, you will write the equations as systems of equations. ACTIVITY 1 Solve 3 x - 4 = 1 _ 9 . Step 1 KEYSTROKES: 6: New Document 2: Add Graphs & Geometry Graph each side of the equation as a separate function. Enter 3 x - 4 as f1(x). Enter 1 _ 9 as f2(x). Be sure to include parentheses around each exponent. Then graph the two equations. CHANGE WINDOW SETTING: MENU 4: Window 1: Window Settings [-10, 10] [-1, 1] Step 2 Use the Point feature. You can use the Intersection Point(s) feature on the Points & Lines menu to approximate the ordered pair of the point at which the graphs cross. KEYSTROKES: MENU 6: Points & Lines 3: Intersection Point Select both graphs by moving cursor over each graph and hitting ENTER . The calculator screen shows that the x-coordinate of the point at which the curves cross is 2. Therefore, the solution of the equation is 2. Step 3 Use the Add Function Table feature. You can also use the Add Function Table feature to locate the point at which the curves intersect. KEYSTROKES: MENU 2: View 8: Add Function Table The table displays x-values and corresponding y-values for each graph. Examine the table to find the x-value for which the y-values of the graphs are equal. At x = 2, both functions have a y-value of 0. − 1 or 1 _ 9 . Thus, the solution of the equation is 2. CHECK Substitute 2 for x in the original equation. 3 x - 4 1 _ 9 Original equation 3 2 - 4 1 _ 9 Substitute 2 for x. 3 -2 1 _ 9 Simplify. 1 _ 9 = 1 _ 9 ✓ The solution checks. A similar procedure can be used to solve exponential inequalities using a graphing calculator. TI-Nspire™
Transcript of Graphing Technology Lab TI-Nspire™ Solving Exponential ...
Graphing Technology Lab
Solving Exponential Equations and Inequalities
You can use TI-Nspire Technology to solve exponential equations by graphing or by using the table feature. To do this, you will write the equations as systems of equations.
ACTIVITY 1
ACTIVITY 1
Solve 3x - 4 = 1 _ 9 .
Step 1 KEYSTROKES: 6: New Document 2: Add Graphs & Geometry Graph each side of the equation as a separate function.
Enter 3x - 4 as f1(x). Enter 1 _ 9 as f2(x). Be sure to include
parentheses around each exponent. Then graph the two equations.
CHANGE WINDOW SETTING: MENU 4: Window 1: Window Settings [-10, 10] [-1, 1]
Step 2 Use the Point feature.
You can use the Intersection Point(s) feature on the Points & Lines menu to approximate the ordered pair of the point at which the graphs cross.
KEYSTROKES: MENU 6: Points & Lines 3: Intersection Point Select both graphs by moving cursor over each graph and
hitting ENTER .
The calculator screen shows that the x-coordinate of the point at which the curves cross is 2. Therefore, the solution of the equation is 2.
Step 3 Use the Add Function Table feature.
You can also use the Add Function Table feature to locate the point at which the curves intersect.
KEYSTROKES: MENU 2: View 8: Add Function Table
The table displays x-values and corresponding y-values for each graph. Examine the table to find the x-value for which the y-values of the graphs are equal.
At x = 2, both functions have a y-value of 0. − 1 or 1 _ 9 . Thus, the
solution of the equation is 2.CHECK Substitute 2 for x in the original equation.
3x - 4 � 1 _ 9 Original equation
32 - 4 � 1 _ 9 Substitute 2 for x.
3-2 � 1 _ 9 Simplify.
1 _ 9 = 1 _
9 ✓ The solution checks.
EXAMPLE 1
A similar procedure can be used to solve exponential inequalities using a graphing calculator.
TI-Nspire™
Nspire_483_484_C08_L02A_888482.i483 483 2/17/09 12:39:07 PM

ACTIVITY 1
ACTIVITY 2
Solve 2x - 2 ≥ 0.5x - 3.
Step 1 Enter the related inequalities.
Rewrite the problem as a system of inequalities.
The first inequality is 2x - 2 ≥ y or y ≤ 2x - 2. Since thisinequality includes the less than or equal to symbol, shade below the curve.
On a new Graphs & Geometry page, use the back arrow to delete the = from “f1(x)=”. Enter < = to set up the inequality. Notice that f1(x) changes to y.
The second inequality is y ≥ 0.5x - 3. Shade above the curve since this inequality contains greater than or equal to.
KEYSTROKES: CLEAR <
2 ( X 2 ) ENTER CLEAR
> . 5 ( X 3 ) ENTER
Step 2 Find the solution set.
The x-values of the points in the region where the shadings overlap is the solution set of the original inequality. Using the intersection point feature, you can conclude that the solution set is {x | x ≥ 2.5}.
EXAMPLE 1
Exercises Solve each equation or inequality.
1. 9x - 1 = 1 _ 81
2. 4x + 3 = 25x 3. 5x - 1 = 2x
4. 3.5x + 2 = 1.75x + 3 5. -3x + 4 = -0.52x + 3 6. 62 - x - 4 < -0.25x - 2.5
7. 16x - 1 > 22x + 2 8. 3x - 4 ≤ 5 x _ 2 9. 5x + 3 ≤ 2x + 4
10. WRITING IN MATH Explain why this technique of graphing a system of equations or inequalities works to solve exponential equations and inequalities.
Nspire_483_484_C08_L02A_888482.i484 484 2/17/09 12:39:15 PM