Graphing gr 6
15
Graphing In Science
-
Upload
sspencer53 -
Category
Education
-
view
301 -
download
0
Transcript of Graphing gr 6

GraphingIn Science
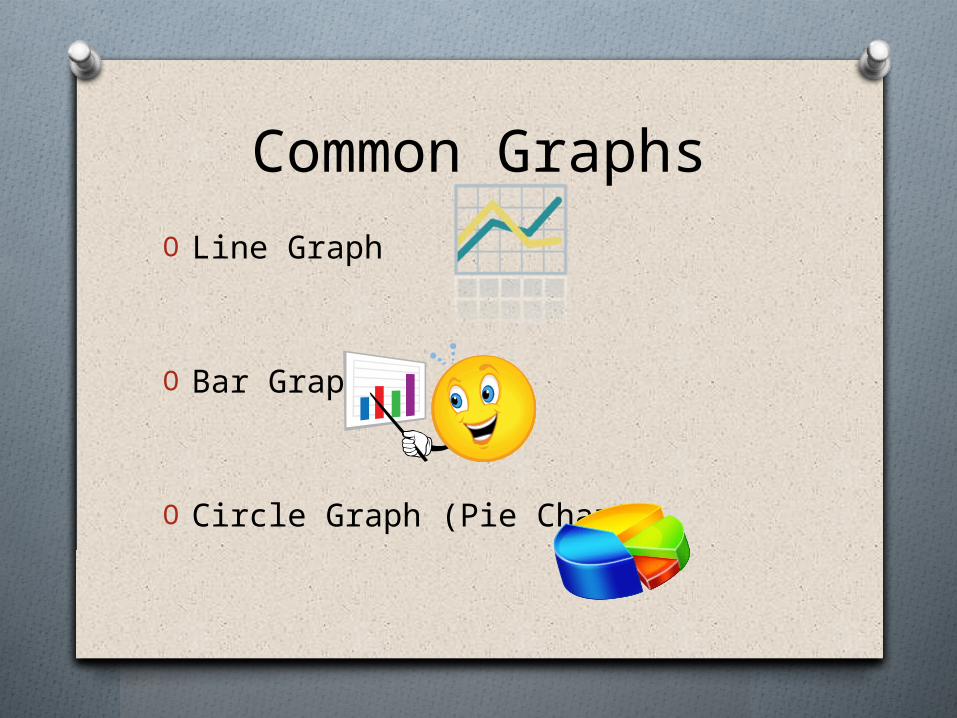
Common GraphsO Line Graph
O Bar Graph
O Circle Graph (Pie Chart)

Line & Bar
Graph Rules1. Must have a title that
describes the data represented (“Line Graph” is not acceptable!)
2. Horizontal (x-axis) must be labeled with the independent (manipulated) variable – include units!

3. Vertical (y-axis) must be labeled with the dependent (responding) variable – include units!
4. Number increments on each axis must be consistent intervals.
5. Need to use graph paper or be computer-generated!
Line & Bar
Graph Rules (cont.)

Line GraphsODisplay data that show how one variable changes in response to another variable.
OAllow you to identify trends and make predictions.

Line Graph Example
Analyzing Line GraphsThe line graph shows the results of an experiment that tested the amount of sugar that could dissolve in water as temperature was increased. As the temperature decreases the amount of sugar that can dissolve in water also decreases.

Line Graph Example
Trends and PredictionsThese graphs are fit from data. We can use these graphs to make predictions or identify trends.

Line Graph PracticeU.S. Cell Phone SubscribersUse the data in the table to make your own line graph on a piece of graph paper.

Bar GraphsODisplay data that has separate, but related categories
ODoes not have numerical data for the independent variable.

Bar Graph Example

Bar Graph PracticePlanets and their distance from the sunUse the data in the table to make your own bar graph on a piece of graph paper.
Diameters of the Planets in Earth Units
Planet Diameter in Earth Units
Mercury 0.40
Venus 0.95
Earth 1.00
Mars 0.50
Jupiter 11.20
Saturn 9.50
Uranus 4.00
Neptune 3.90
Pluto 0.20

Circle Graphs (Pie Charts)
ODisplay data that represents percentages of a whole

Circle Graph Example
Science Grades for 1st Quarter
ABCD
8.6%
10.0
%
22.9%
58.6%
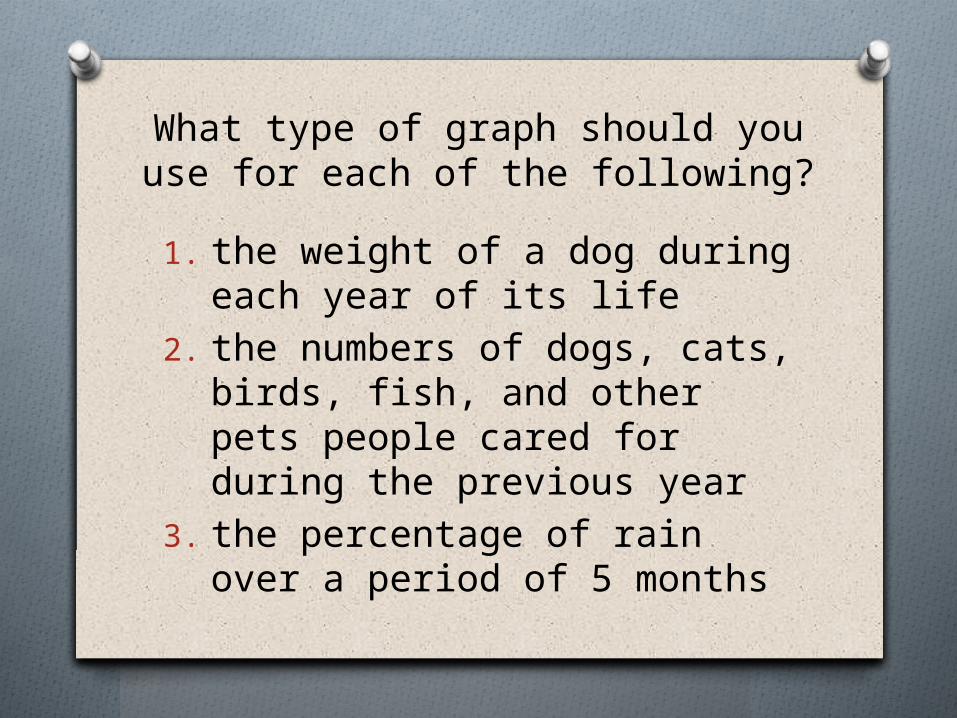
What type of graph should you use for each of the following?
1. the weight of a dog during each year of its life
2. the numbers of dogs, cats, birds, fish, and other pets people cared for during the previous year
3. the percentage of rain over a period of 5 months

What type of graph should you use for each of the following?
1. the weight of a dog during each year of its life
Line2. the numbers of dogs, cats,
birds, fish, and other pets people cared for during the previous year Bar
3. the percentage of rain over a period of 5 monthsCircle