Grapher 12 Quick Start Guide - Golden Softwaredownloads.goldensoftware.com/guides/GrapherQSG.pdf ·...
56
Grapher,· Quick Start Guide
Transcript of Grapher 12 Quick Start Guide - Golden Softwaredownloads.goldensoftware.com/guides/GrapherQSG.pdf ·...
Grapher,·
Quick Start Guide

GrapherTM Registration Information
Your Grapher product key is located in the email download instructions and in your account at MyAccount.GoldenSoftware.com.
Register your Grapher product key online at www.GoldenSoftware.com. This information will not be redistributed.
Registration entitles you to free technical support, download access in your account, and updates from Golden Software.
For future reference, write your product key on the line below.
_________________________________
GrapherTM Quick Start GuideThe Ultimate Technical Graphing Package
Golden Software, LLC809 14th Street, Golden, Colorado 80401-1866, U.S.A.
Phone: 303-279-1021 Fax: 303-279-0909www.GoldenSoftware.com
COPYRIGHT NOTICE
Copyright Golden Software, LLC 2018
The GrapherTM program is furnished under a license agreement. The Grapher software, user’s guide, and quick start guide may be used or copied only in accordance with the terms of the agreement. It is against the law to copy the software, user’s guide, or quick start guide on any medium except as specifically allowed in the license agreement. Contents are subject to change without notice.
Grapher is a registered trademark of Golden Software, LLC. All other trademarks are the property of their respective owners.
January 2018
i
Table of Contents Introduction to Grapher .......................................................................................................... 1
System Requirements .......................................................................................................... 2
Installing Grapher ............................................................................................................... 2
Uninstalling Grapher ............................................................................................................ 2
Windows 7 ......................................................................................................................... 2
Windows 8 ......................................................................................................................... 2
Windows 10 ....................................................................................................................... 3
Grapher Trial Functionality ................................................................................................... 3
Scripter ............................................................................................................................. 3
Three-Minute Tour .............................................................................................................. 3
Using Grapher .................................................................................................................... 3
Using Scripter .................................................................................................................... 4
Grapher User Interface ........................................................................................................... 4
Plot Window ....................................................................................................................... 6
Object Manager .................................................................................................................. 6
Property Manager ............................................................................................................... 7
Worksheet Manager ............................................................................................................ 8
Script Manager ................................................................................................................... 8
Worksheet Window .............................................................................................................. 8
Status Bar .......................................................................................................................... 9
Changing the Window Layout ............................................................................................... 9
Manager Visibility ............................................................................................................... 9
Auto-Hiding Managers ........................................................................................................10
Docking Managers .............................................................................................................10
Tabbed Managers ..............................................................................................................10
Restoring the Managers to Their Default Locations .................................................................10
Customizing the Quick Access Toolbar ..................................................................................10
Customizing the Ribbon ......................................................................................................11
Customizing the Keyboard Shortcuts ....................................................................................11
File Types ............................................................................................................................11
Grapher .GRF Files .............................................................................................................11
Grapher .GPJ Project Files ...................................................................................................11
Grapher .GRT Template Files ...............................................................................................12
Data Files ..........................................................................................................................12
ASCII Data .......................................................................................................................12
Excel Files ........................................................................................................................12
Database Files ...................................................................................................................13
Grid Files ..........................................................................................................................13

Table of Contents
ii
Plot Types ............................................................................................................................13
Basic Plots.........................................................................................................................13
Bar Plots ...........................................................................................................................13
Polar Plots .........................................................................................................................14
Ternary Plots .....................................................................................................................14
Specialty Plots ...................................................................................................................14
Statistical Plots ..................................................................................................................15
Contour Surface Maps .........................................................................................................15
Creating Graphs ....................................................................................................................15
Creating Graphs with the Graph Wizard ................................................................................15
Creating Graphs in the Plot Window ......................................................................................16
Creating Graphs from the Worksheet Window ........................................................................16
Creating Graphs Using Templates .........................................................................................17
Automation ..........................................................................................................................17
Script Recorder ..................................................................................................................17
Tutorial ................................................................................................................................18
Tutorial Overview ...............................................................................................................18
Advanced Tutorial Lessons ..................................................................................................18
A Note About the Documentation .........................................................................................18
Starting Grapher ................................................................................................................19
Lesson 1 - Viewing and Creating Data ...................................................................................19
Creating a New Data File ....................................................................................................19
Opening an Existing Data File..............................................................................................19
Editing Data ......................................................................................................................20
Calculating Statistics on the Data ........................................................................................21
Saving the Data File ..........................................................................................................23
Lesson 2 - Creating a Graph ................................................................................................23
Lesson 3 - Modifying Plot Properties .....................................................................................24
Selecting the Line/Scatter Plot ............................................................................................24
Changing the Line/Scatter Plot Properties .............................................................................24
Changing Line Plot to a Scatter Plot .....................................................................................24
Displaying Plot Labels ........................................................................................................25
Moving Labels ...................................................................................................................26
Lesson 4 - Editing Axes .......................................................................................................26
Selecting the Axis ..............................................................................................................26
Adding an Axis Title ...........................................................................................................27
Changing the Tick Mark Spacing ..........................................................................................27
Changing the Tick Labels ....................................................................................................29
Editing Grid Lines ..............................................................................................................30
Adding a Secondary Linked Axis ..........................................................................................30

Grapher Quick Start Guide
3
Lesson 5 - Adding Additional Plots to the Graph .....................................................................32
Adding a New Plot to a Graph .............................................................................................32
Changing the Plot Type ......................................................................................................32
Adding Semi-Transparent Fill ..............................................................................................32
Lesson 6 - Editing Graph Properties ......................................................................................34
Editing a Graph Title ..........................................................................................................34
Setting Background Fill and Line Properties...........................................................................34
Lesson 7 - Adding and Editing a Legend ................................................................................35
Adding a Legend ...............................................................................................................35
Moving the Legend ............................................................................................................35
Editing the Legend Title ......................................................................................................35
Editing the Plot Names .......................................................................................................36
Changing the Number of Symbols ........................................................................................36
Changing the Symbol Size ..................................................................................................36
Changing the Line Length ...................................................................................................37
Adding a Drop Shadow .......................................................................................................37
Creating Multiple Columns in the Legend ..............................................................................37
Lesson 8 - Working with the Script Recorder .........................................................................37
Opening the Script Manager ................................................................................................38
Start Recording .................................................................................................................38
Creating a Line Plot ...........................................................................................................39
Changing the X Axis Date/Time Limits ..................................................................................39
Changing the X Axis Date/Time Tick Mark Spacing .................................................................40
Changing the X Axis Date/Time Tick Label Format .................................................................41
Adding Linked Text to the Graph Title ..................................................................................41
Exporting the Graph ..........................................................................................................42
Stopping and Saving the Script ...........................................................................................43
Printing the Online Help .........................................................................................................43
Getting Help .........................................................................................................................44
Technical Support .................................................................................................................44
Index ..................................................................................................................................45

1
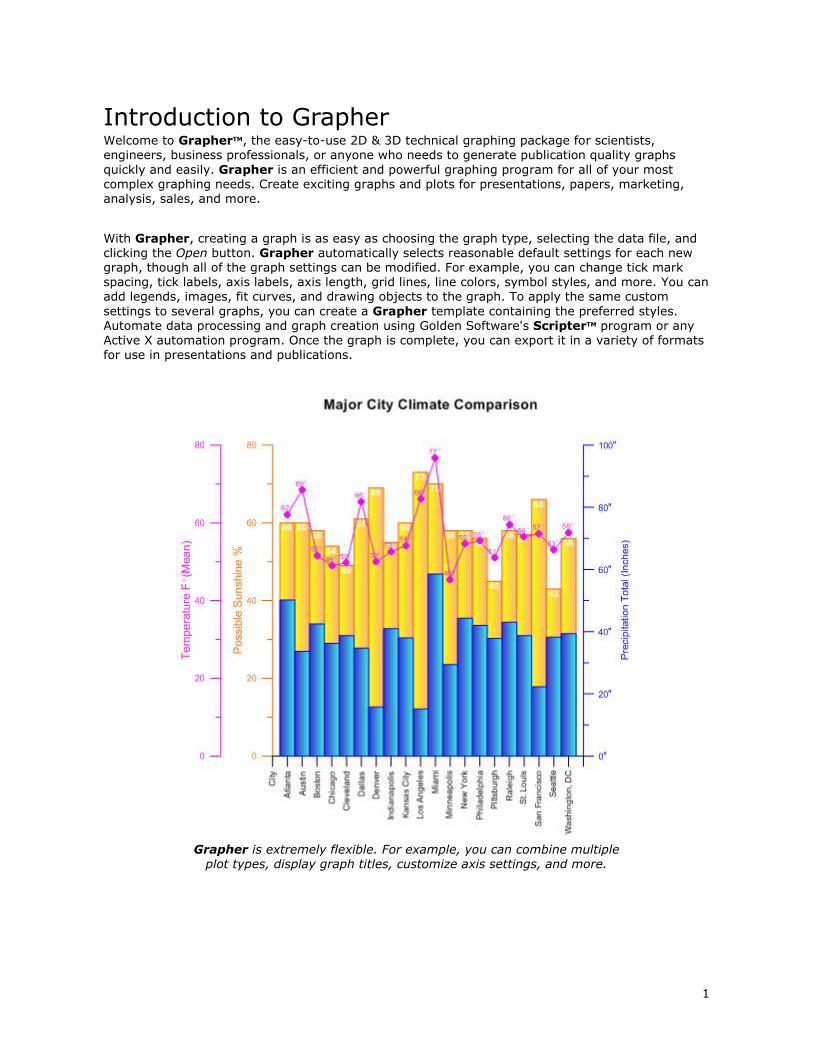
Introduction to Grapher Welcome to GrapherTM, the easy-to-use 2D & 3D technical graphing package for scientists, engineers, business professionals, or anyone who needs to generate publication quality graphs
quickly and easily. Grapher is an efficient and powerful graphing program for all of your most complex graphing needs. Create exciting graphs and plots for presentations, papers, marketing, analysis, sales, and more.
With Grapher, creating a graph is as easy as choosing the graph type, selecting the data file, and clicking the Open button. Grapher automatically selects reasonable default settings for each new graph, though all of the graph settings can be modified. For example, you can change tick mark spacing, tick labels, axis labels, axis length, grid lines, line colors, symbol styles, and more. You can add legends, images, fit curves, and drawing objects to the graph. To apply the same custom
settings to several graphs, you can create a Grapher template containing the preferred styles. Automate data processing and graph creation using Golden Software's ScripterTM program or any
Active X automation program. Once the graph is complete, you can export it in a variety of formats for use in presentations and publications.
Grapher is extremely flexible. For example, you can combine multiple
plot types, display graph titles, customize axis settings, and more.
Introduction to Grapher
2
System Requirements The minimum system requirements for Grapher are:
Windows 7, 8 (excluding RT), 10 or higher
512MB RAM minimum for simple data sets, 1GB RAM recommended
At least 500MB free hard disk space
1024x768 or higher monitor resolution with a minimum of 16-bit color depth
Installing Grapher Installing Grapher requires Administrator rights. Either an administrator account can be used to
install Grapher, or the administrator's credentials can be entered before installation while logged in to a standard user account. If you wish to use a Grapher single-user license, the product key must be activated while logged in to the user account under which Grapher will be used. For this reason,
we recommend logging into Windows under the account for the Grapher user and entering the necessary administrator credentials when prompted.
Golden Software does not recommend installing Grapher 13 over any previous version of Grapher. Grapher 13 can coexist with older versions (e.g. Grapher 12) as long as they are
installed in different directories, which is the default.
To install Grapher from a download:
1. Log into Windows under the account for the individual who is licensed to use Surfer.
2. Download Grapher according to the emailed directions you received or from the My
Products page of the Golden Software My Account portal.
3. Double-click on the downloaded file to begin the installation process.
4. Once the installation is complete, run Grapher.
5. License Grapher by activating a single-user license product key or connecting to a license server.
Uninstalling Grapher To uninstall Grapher, follow the directions below for your specific operating system. We recommend deactivating your license prior to uninstalling Grapher if you are using a single-user license.
Windows 7
To uninstall Grapher, go to the Windows Control Panel and click the Uninstall a program link. Select Grapher 13 from the list of installed applications. Click the Uninstall button to uninstall Grapher 13.
Windows 8
From the Start screen, right-click the Grapher 13 tile and click the Uninstall button at the bottom of the screen. Alternatively, right-click anywhere on the Start screen and click All apps at the
bottom of the screen. Right-click the Grapher 13 tile and click Uninstall at the bottom of the screen.
Grapher Quick Start Guide
3
Windows 10
Select Settings in the Start menu. In Settings, select System | Apps & features. Select Grapher 13, and then click Unistall. To uninstall Grapher from the Windows Control Panel, click Programs | Programs and Features. Next select Grapher 13 and click Uninstall.
Grapher Trial Functionality The Grapher trial is a fully functioning time-limited trial. This means that commands work exactly as the commands work in the full program for the duration of the trial. The trial has no further restrictions on use. The trial can be installed on any computer that meets the system requirements. The trial can be licensed by activating a product key or connecting to a license server.
Scripter The Scripter program, included with Grapher, is useful in creating, editing, and running script files that automate Grapher procedures. By writing and running script files, simple mundane tasks or complex system integration tasks can be performed precisely and repetitively without direct
interaction. Grapher also supports ActiveX Automation using any compatible client, such as Visual BASIC. The automation capabilities allow Grapher to be used as a data visualization and graph generation post-processor for any scientific modeling system.
The script recorder records commands in a script as you perform them in Grapher. Run the script, and Grapher repeats the steps. The script recorder is ideal for users that need to perform repetitive tasks but are unfamiliar with automation or for advanced users who
do not want to manually enter all of the syntax.
Three-Minute Tour We have included several sample files with Grapher so that you can quickly see some of Grapher's
capabilities. Only a few example files are discussed here, and these examples do not include all of Grapher’s many plot types and features. The Object Manager is a good source of information as to what is included in each file.
To view the sample files:
1. Open Grapher.
2. Select Sample Files in the Files list of the Welcome to Grapher dialog.
3. Select a sample file from the Sample Files list.
4. Click the Open button. The sample file is now displayed. Repeat as necessary to see the files of interest.
5. Click on various parts of the graph, axes, and plots in the Object Manager. View the object properties in the Property Manager.
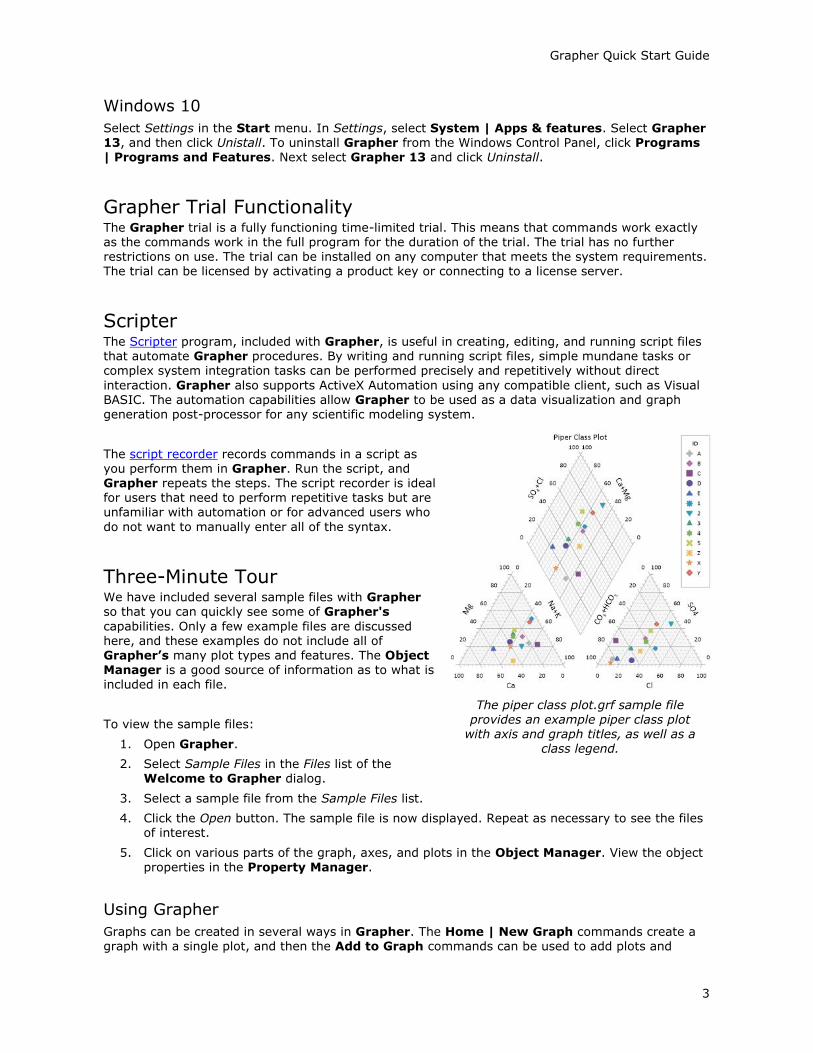
Using Grapher
Graphs can be created in several ways in Grapher. The Home | New Graph commands create a graph with a single plot, and then the Add to Graph commands can be used to add plots and
The piper class plot.grf sample file provides an example piper class plot
with axis and graph titles, as well as a class legend.

Grapher User Interface
4
features as desired. The Graph Wizard quickly creates a new graph with one or more plots from a single data file. The Graph Wizard can also be used to add features to the graph, such as legends and titles, as well as to apply a color palette to the plots in the graph.
Using Scripter
Tasks can be automated in Grapher using Golden Software's Scripter program or any ActiveX Automation-compatible client, such as Visual BASIC. A script is a text file containing a series of instructions for execution when the script is run. Scripter can be used to perform almost any task
in Grapher. You can do practically anything with a script that you can do manually with the mouse or your keyboard. Scripts are useful for automating repetitive tasks and consolidating a sequence of steps. Scripter is installed in the same location as Grapher. Refer to the Grapher Automation help book for more information about Scripter. We have included several example scripts so that you can quickly see some of Scripter's capabilities.
Example Script Files
A variety of script files are included with Grapher. You can run the script as is or you can customize the script.
To run a sample script in Grapher's Script Manager:
1. Open Grapher.
2. Check the View | Display | Script Manager command. A check mark will indicate the manager is displayed.
3. In the Script Manager, click the button.
4. In the Open dialog, select a sample .BAS file and click Open. The sample scripts folder is located at C:\Program Files\Golden Software\Grapher 13\Samples\Scripts by default. The script is displayed in the Script Manager.
5. Click the button, and the script is executed.
To run a sample script in Scripter:
1. Open Scripter by navigating to the installation folder, C:\Program Files\Golden
Software\Grapher 13. Double-click on the Scripter.exe application file.
2. Click the File | Open command and select a sample script .BAS file from the C:\Program Files\Golden Software\Grapher 13\Samples\Scripts folder.
3. Click the Script | Run command to execute the script.
Grapher User Interface Grapher contains four document window types: the plot window, worksheet window, grid window,
and Excel worksheet window. Graphs and maps are displayed and edited in the plot window. Tabular data files are displayed, edited, transformed, and saved in the worksheet window. A native Excel workbook can be opened in the Excel window. Grid files can be viewed in the grid window.
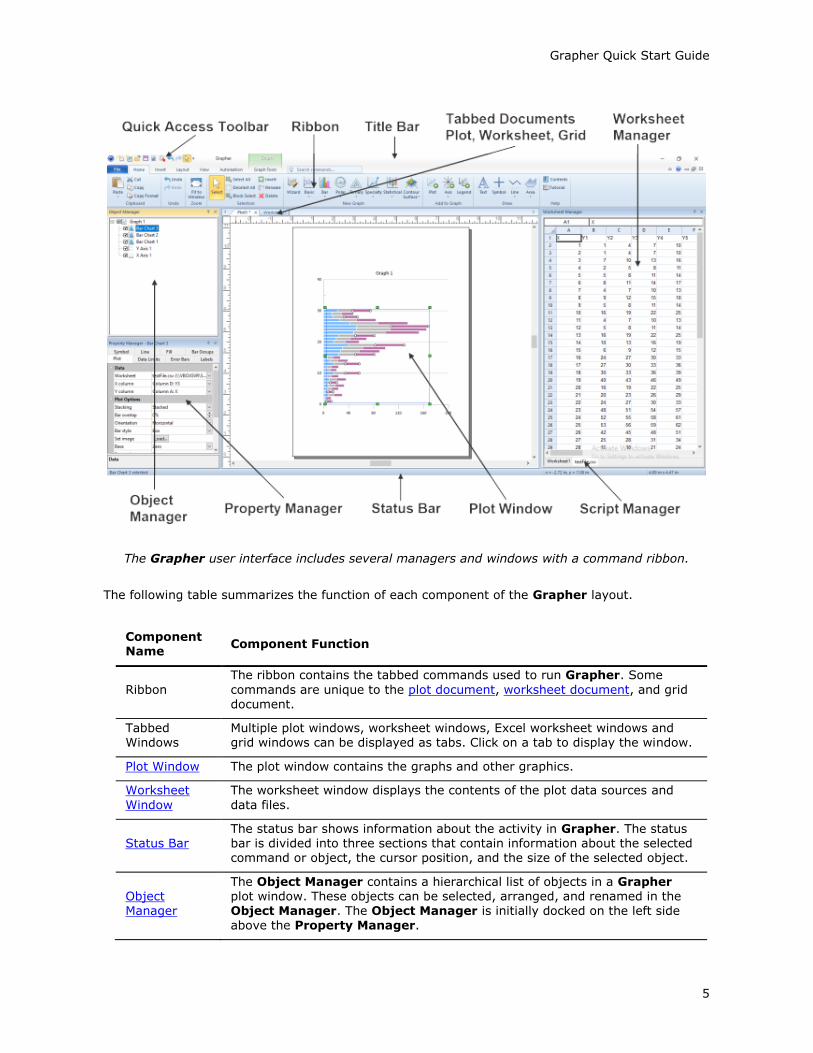
The Grapher user interface consists of the quick access toolbar, ribbon tabs and commands, tabbed documents, managers, and a status bar.
Grapher Quick Start Guide
5
The Grapher user interface includes several managers and windows with a command ribbon.
The following table summarizes the function of each component of the Grapher layout.
Component Name
Component Function
Ribbon
The ribbon contains the tabbed commands used to run Grapher. Some
commands are unique to the plot document, worksheet document, and grid document.
Tabbed Windows
Multiple plot windows, worksheet windows, Excel worksheet windows and grid windows can be displayed as tabs. Click on a tab to display the window.
Plot Window The plot window contains the graphs and other graphics.
Worksheet
Window
The worksheet window displays the contents of the plot data sources and
data files.
Status Bar
The status bar shows information about the activity in Grapher. The status bar is divided into three sections that contain information about the selected command or object, the cursor position, and the size of the selected object.
Object Manager
The Object Manager contains a hierarchical list of objects in a Grapher plot window. These objects can be selected, arranged, and renamed in the Object Manager. The Object Manager is initially docked on the left side above the Property Manager.
Grapher User Interface
6
Property Manager
The Property Manager lists the properties of a selected object. Multiple objects can be edited at the same time by selecting all of the objects and changing the shared properties. The Property Manager is initially docked on the left side below the Object Manager.
Script Manager
The Script Manager controls scripts that are recorded and run within
Grapher. Right-click in the Script Manager to see relevant menu commands for opening, saving, and running scripts. The Script Manager is hidden by default.
Worksheet Manager
The Worksheet Manager contains a view of all data loaded into Grapher.
Edits made in the Worksheet Manager are automatically reflected in the graph. Right-click in the Worksheet Manager to save, edit, transform, sort, or obtain statistics on cells. When plots are first created or when they are opened from a GRF file, the data file contents is displayed in the Worksheet Manager. When a GPJ file is opened, the embedded data is displayed in the Worksheet Manager.
Plot Window A plot window is the area used for creating and modifying graphs. When you first open Grapher, you can choose to start from an empty plot window. Multiple plot windows can be open at one time. Click the document tabs to easily move between multiple plot windows.
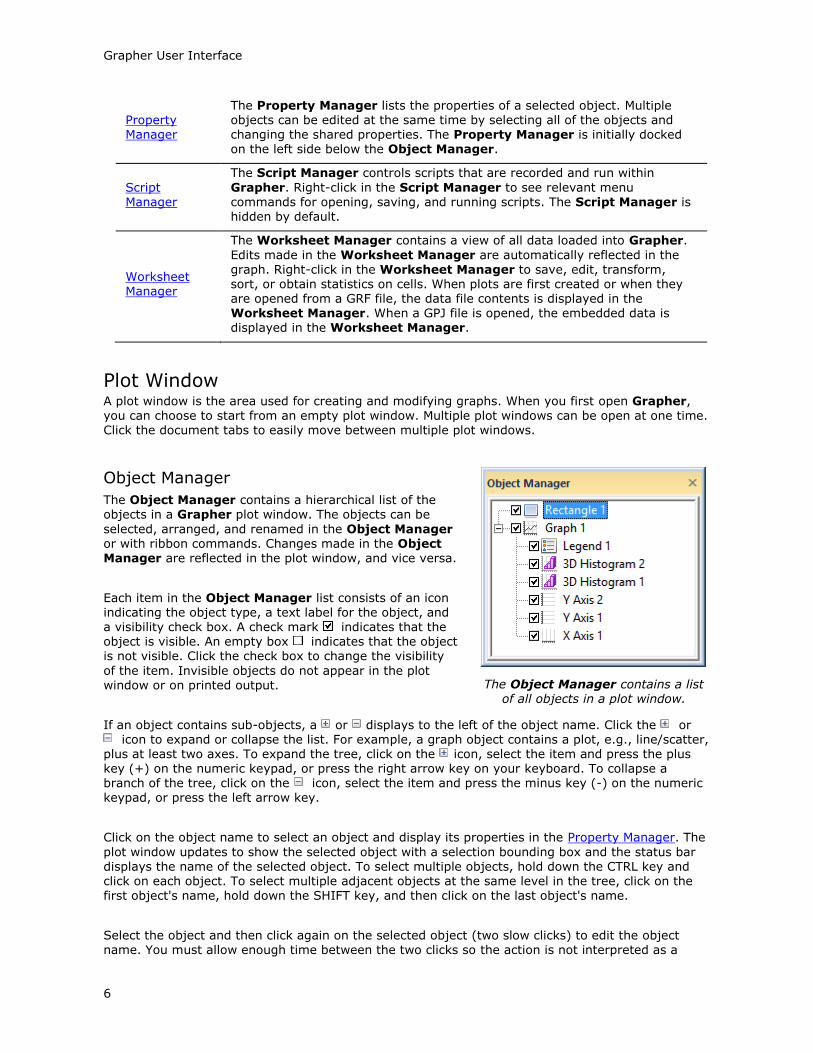
Object Manager
The Object Manager contains a hierarchical list of the objects in a Grapher plot window. The objects can be
selected, arranged, and renamed in the Object Manager or with ribbon commands. Changes made in the Object Manager are reflected in the plot window, and vice versa.
Each item in the Object Manager list consists of an icon indicating the object type, a text label for the object, and a visibility check box. A check mark indicates that the object is visible. An empty box indicates that the object is not visible. Click the check box to change the visibility
of the item. Invisible objects do not appear in the plot window or on printed output.
If an object contains sub-objects, a or displays to the left of the object name. Click the or icon to expand or collapse the list. For example, a graph object contains a plot, e.g., line/scatter,
plus at least two axes. To expand the tree, click on the icon, select the item and press the plus key (+) on the numeric keypad, or press the right arrow key on your keyboard. To collapse a branch of the tree, click on the icon, select the item and press the minus key (-) on the numeric
keypad, or press the left arrow key.
Click on the object name to select an object and display its properties in the Property Manager. The
plot window updates to show the selected object with a selection bounding box and the status bar displays the name of the selected object. To select multiple objects, hold down the CTRL key and click on each object. To select multiple adjacent objects at the same level in the tree, click on the first object's name, hold down the SHIFT key, and then click on the last object's name.
Select the object and then click again on the selected object (two slow clicks) to edit the object name. You must allow enough time between the two clicks so the action is not interpreted as a
The Object Manager contains a list of all objects in a plot window.

Grapher Quick Start Guide
7
double-click. Enter the new name into the box. Alternatively, right-click on an object name and click Rename Object, select an object and click the Home | Selection | Rename command, or select an object and press F2. Enter a name in the Rename Object dialog and click OK to rename the object.
To change the display order of the objects with the mouse, select an object and drag it to a new
position in the list above or below an object at the same level in the tree. The cursor changes to a black right arrow if the object can be moved to the cursor location or a red circle with a diagonal line if the object cannot be moved to the indicated location. For example, a line/scatter plot can be moved anywhere within its graph object or into another graph object, but not into a group object. Objects can also be arranged using the Layout | Move commands: To Front, To Back, Forward, and Backward.
To delete an object, select the object and press the DELETE key. Some objects cannot be deleted. For example, you cannot delete an axis that is currently in use by a plot in a graph.
Property Manager
The Property Manager allows you to edit the properties of an object, such as a plot or axis.
The Property Manager contains a list of all properties for a selected object. The Property Manager can be left open so that the properties of selected objects are always visible.
Sections with multiple properties appear with a plus or minus to the left of the name. To expand a section, click on the button. To collapse a section, click on the button. For
example, the expanded End styles section
contains three properties: Start, End, and Scale.
The Property Manager displays the properties for selected objects. To change a property, click on the property's value and type a new value,
scroll to a new number using the buttons, select a new value using the slider, or select a new value from the list or palette. For example, a polyline has Style, Color, Opacity, and
Width properties and an End Styles sub-section with Start, End, and Scale properties. Changing the Color requires clicking on the current color and selecting a new color from the color palette. Changing the Opacity requires typing a new value or clicking on the slider bar and dragging it left or right to a new value. Changing the Width requires typing a new number or scrolling to a new number. Changing the End requires clicking on the existing style and clicking on a new style in the list.
The selections in the Property Manager control which properties are displayed. Properties are hidden when they do not have an effect on the object. For example when the Gradient is set to
None on the Fill page, the Colormap and Fill orientation properties are hidden. When the Gradient is changed to Linear or Radial, the Colormap and Fill orientation properties are displayed, while the Pattern, Foreground color, and Foreground opacity properties are hidden.
You can modify more than one object at a time. For example, click on X Axis 1 in the Object Manager, and then hold the CTRL key and click Y Axis 1. You can change the properties of each axis simultaneously in the Property Manager. Only shared properties may be edited when multiple objects are selected. For example, only the line properties are displayed when both a
The Property Manager displays the properties associated with the selected object.
Grapher User Interface
8
polyline and polygon are selected. You can edit multiple plots of the same type at one time. However, no properties are displayed when the selected plots are different plot types.
Object properties automatically update after you select an item from a palette, press ENTER, or
click outside the property field. When using the buttons or slider, changes are displayed on the
graph immediately.
Press ALT+ENTER to access the Property Manager. Pressing ALT+ENTER will also show the
Property Manager if it is hidden or pinned. When working with the Property Manager, the up and down arrow keys move up and down in the Property Manager list. The TAB key activates the highlighted property. The right arrow key expands collapsed sections, e.g., Plot Properties, and the left arrow collapses the section.
Worksheet Manager
The Worksheet Manager contains a view of all data loaded into Grapher. Multiple data files are displayed in a tabbed format. By default, the Worksheet Manager appears at the right of the Grapher window.
Right-click inside the Worksheet Manager to open the worksheet menu commands. These commands are named similarly to the commands on the ribbon. Use the Home | New Graph commands to create a graph in the current plot window. Use the Data Tools tab commands to
transform, sort, or generate statistics for the worksheet data.
Script Manager
The Script Manager allows you to work with automation within Grapher rather than opening
Golden Software's automation program, Scripter, separately. All of Scripter's functionality is available within the Script Manager. Right-click in the Script Manager to access Scripter's menu
commands.
By default, the Script Manager is not displayed. Click the View | Display | Script Manager command to show or hide the Script Manager. A check mark indicates the manager is visible. No check mark indicates the manager is hidden. When the Script Manager is displayed, the default location is tabbed with the Worksheet Manager.
Worksheet Window The worksheet window contains commands to display, edit, enter, and save data. The worksheet window has several useful and powerful editing, transformation, and statistical operations available. Several import and export options are available for opening data files from other spreadsheet
programs. The Data Tools tab is automatically selected when you open or switch to a worksheet document.
To enter data in a worksheet, use the File | Open command to open an existing data file or click the File | New | Worksheet command to create a blank worksheet. Data already used to create plots can be opened in the worksheet window with the Graph Tools | Worksheet | Display command.

Grapher Quick Start Guide
9
The components of a worksheet window shown above are described in the following table.
Column Letters The column letters identify a column in the worksheet.
Row Numbers The row numbers identify a row in the worksheet.
Active Cell The active cell is highlighted with a bold outline. The active cell receives
data input (numeric values or text strings) from the keyboard. Only one cell is active at a time.
Active Cell Location
The active cell location is specified by column letter and row number.
Active Cell Edit Box
The active cell edit box displays the contents of the active cell. Data
typed into an empty cell appears in both the edit box and the active cell.
Worksheet Name The worksheet name displays the data file name or the worksheet number if the data file has not been saved.
Select Entire Worksheet Button
The select entire worksheet button is used to select all cells in the worksheet.
Status Bar The status bar is located at the bottom of the window. Check or clear the View | Display | Status Bar command to show or hide the status bar. The status bar displays information about the current
command or selected object in Grapher. The status bar is divided into three sections. The left section shows the selected object name. If a menu command is selected, a brief description of the command appears in the left section. The middle section shows the cursor coordinates in page units. The middle section also displays the graph's X and Y coordinates when using the Graph Tools | Digitize commands or when the Display value on click option is selected in the Options dialog. The right section displays the dimensions of the selected object.
Changing the Window Layout The managers display in a docked view by default. However, they can also be displayed as floating windows. The visibility, size, and position of each manager may also be changed.
Manager Visibility
Use the View | Display commands to show or hide the Object Manager, Property Manager, Script Manager, Worksheet Manager, and Status Bar. A check mark indicates the manager is displayed.
An empty check box indicates the manager is closed. Alternatively, you can click the button in
the title bar of the manager to close the manager window.
Grapher User Interface
10
Auto-Hiding Managers
You can increase the plot document space by minimizing the managers with the Auto Hide feature. The manager slides to the side or bottom of the Grapher main window and a tab appears with the
window name. To hide the manager, click the button in the upper right corner of the manager. When the manager is hidden, place the cursor directly over the tab to display the manager again.
Click the button to return the manager its docked position.
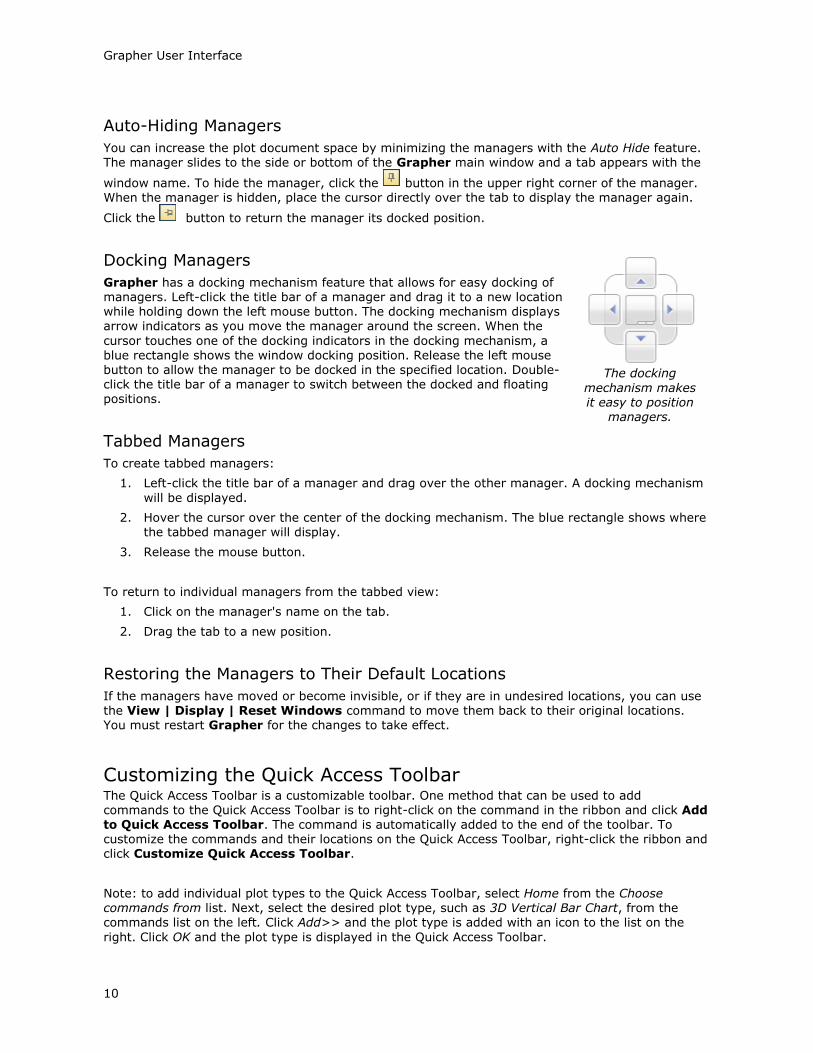
Docking Managers
Grapher has a docking mechanism feature that allows for easy docking of managers. Left-click the title bar of a manager and drag it to a new location while holding down the left mouse button. The docking mechanism displays arrow indicators as you move the manager around the screen. When the
cursor touches one of the docking indicators in the docking mechanism, a blue rectangle shows the window docking position. Release the left mouse button to allow the manager to be docked in the specified location. Double-click the title bar of a manager to switch between the docked and floating positions.
Tabbed Managers
To create tabbed managers:
1. Left-click the title bar of a manager and drag over the other manager. A docking mechanism
will be displayed.
2. Hover the cursor over the center of the docking mechanism. The blue rectangle shows where the tabbed manager will display.
3. Release the mouse button.
To return to individual managers from the tabbed view:
1. Click on the manager's name on the tab.
2. Drag the tab to a new position.
Restoring the Managers to Their Default Locations
If the managers have moved or become invisible, or if they are in undesired locations, you can use the View | Display | Reset Windows command to move them back to their original locations. You must restart Grapher for the changes to take effect.
Customizing the Quick Access Toolbar The Quick Access Toolbar is a customizable toolbar. One method that can be used to add commands to the Quick Access Toolbar is to right-click on the command in the ribbon and click Add to Quick Access Toolbar. The command is automatically added to the end of the toolbar. To customize the commands and their locations on the Quick Access Toolbar, right-click the ribbon and click Customize Quick Access Toolbar.
Note: to add individual plot types to the Quick Access Toolbar, select Home from the Choose commands from list. Next, select the desired plot type, such as 3D Vertical Bar Chart, from the commands list on the left. Click Add>> and the plot type is added with an icon to the list on the
right. Click OK and the plot type is displayed in the Quick Access Toolbar.
The docking
mechanism makes it easy to position
managers.

Grapher Quick Start Guide
11
Customizing the Ribbon The ribbon is customizable in Grapher. To customize the commands in the ribbon, right-click the ribbon and select Customize the Ribbon. In the dialog, you can add new tabs, add groups, add
commands to custom group, hide existing tabs or groups, and rearrange the tabs into an order that fits your needs better.
Customizing the Keyboard Shortcuts Keyboard shortcuts can be changed by right-clicking on the ribbon and selecting Customize the
Ribbon. In the dialog, click the Customize button next to Keyboard shortcuts. On the left side of the Customize Keyboard dialog, select the ribbon tab name in the Categories list where the desired command is located. On the right side of the dialog, click on the command name in the Commands list. Click in the Press new shortcut key box and press and hold the keys that should be
used for the command. For instance, you might press and hold the CTRL, SHIFT, and H keys on the keyboard. The key names CTRL+SHIFT+H will be listed in the Press new shortcut key box. Click
Assign to assign the shortcut to the command.
File Types Grapher primarily uses data files and Grapher files. Grid files can be used to create maps. Image files and vector data files can be imported into plot documents. There are three types of Grapher files: Grapher .GRF, .GPJ, and .GRT files. The type of file you create when saving your graphs should be determined by how you wish to link the plots and their data:
The Grapher File (*.grf) file stores a link to the data file(s) used by the plots. Data files are saved separately from the GRF file. A GRF file and one or more data files are necessary to open a GRF file.
The Grapher Project (*.gpj) file embeds the data for the plots in the GPJ file. When opening a
GPJ file, the plots are recreated exactly as they were saved. No outside data file is necessary
to open a GPJ file.
The Grapher Template (*.grt) file does not embed the data nor store links to the data. Only
the plot and graph properties and layout are saved. When opening a GRT file, Grapher will prompt you for the data files to use for your plots.
Grapher .GRF Files Grapher .GRF files contain all of the information necessary to reproduce the graph, except for the
data. When you save a Grapher file, all the scaling, formatting, and parameters for the graph are preserved in the file. Grapher .GRF files save a link to the data and do not store the data internally in the file. For example, if a .GRF file needs to be sent to a colleague, you would need to send the data file(s) used to create the graph in addition to the .GRF file. This format is preferred for graphs where the data changes and needs to link to the external source data file. When opening a GRF file,
the data files are reloaded into Grapher. If the data files haven't changed, the plots will look the
exact same as when they were saved. However, if the data files have been changed, the plots will automatically update to reflect the changes in their source data. If the data files can't be found, Grapher will prompt you for the data files to use for your plots.
Grapher .GPJ Project Files Grapher .GPJ files store all of the information necessary to reproduce the graph including embedding the data. All scaling, formatting, and parameters for the graph are preserved in the file. If a .GPJ file needs to be sent to a colleague, you would only need to send the .GPJ file. This format
File Types
12
is preferred when you want to have the data and the graph contained in a single file and the data does not change often.
Grapher .GRT Template Files Grapher .GRT files are used to create a template with set graphing preferences. A saved template file does not contain a reference to a specific data file. This means that once the template graph is created, you can use the template with any data set. You can use the template to set options such as the number of decimal places on axis tick mark labels, label angles, axis labels, graph titles, line
plot colors, fill colors, symbol size, or any other graphing option. If a .GRT file is sent to a colleague, they can use their own data set with the file to create a graph based on the specifications in the template file. This format is preferred when the layout of the graph needs to remain consistent with a variety of similarly formatted data files.
Data Files In most cases, there is a prompt for a data file when you create a graph in Grapher. Data files can be imported from a variety of sources, such as ASCII text files, Excel files, or database files. Data can be entered directly into Grapher’s worksheet if the files do not already exist. The data needs to be in column and row format. Each row represents a single point on most plots. The columns contain the different variables to be represented on the plot. Data files can be created, edited, and saved in Grapher’s worksheet. Some of the most commonly used data types are described in the
following sections.
ASCII Data
ASCII files are generic format files that can be read or produced by most applications. There are
three common ASCII data formats: .DAT, .CSV, and .TXT. These files can also be imported into most applications, including word processors, spreadsheets, and ASCII editors. The files differ in the types of delimiters, or column separators, between the data. ASCII files do not contain any
worksheet formatting information such as row height, column width, or cell formatting. This format does not have a limitation on the number of rows or columns.
Excel Files
Microsoft Excel .XLS, .XLSX, and .XLSM files contain data and retain some cell formatting in Grapher. Some information, such as formulas, is ignored. Excel files can preserve all formatting information available in the Golden Software worksheet. An Excel 2003 .XLS worksheet has a 65,536-row limit and a 256-column limit; therefore, this format cannot be used to store very large
data sets. An Excel 2007 .XLSX worksheet has a 1,048,576 row limit and a 16,384 column limit.
To save all the formatting, formulas, and worksheets in an .XLS or .XLSX file, you can use Excel directly in Grapher. Use the File | Open Excel command to utilize all of Excel’s features and create graphs in Grapher. Excel disables the save command, so you can only use the Save As command and save to a new .XLS or .XSLX file.
Use Caution when Saving Excel Files!
Use the File | Save To Multi-Sheet Excel File command to save multiple worksheets in a single Excel document.
A file can be saved in an Excel format from Grapher worksheet, but only one worksheet can be saved when using the File | Save or File | Save As command. If a multi-worksheet Excel file is opened and saved as an .XLS or .XLSX file from the Grapher worksheet, be aware that only the single worksheet is saved in the document. If the existing file is overwritten, all the unused

Grapher Quick Start Guide
13
worksheets are destroyed. In this case, a warning message is issued. The message reads: Saving this worksheet will destroy all but one of the sheets in the existing *.xls, *.xlsx file. To overwrite the file, click OK. To choose a different file name, click Cancel.
Database Files In Grapher, graphs can be created from Access .ACCDB and .MDB files and dBase .DBF files directly without first converting to a new worksheet. A graph is created directly from the database file and will reference the database. Changes made in the database table will automatically update
the graph.
Other database formats can be imported into Grapher’s worksheet. Click the File | Open
command. In the Open dialog, click the Database button. Step through the dialogs to import the file and the database is converted into a worksheet format. These files cannot be saved in their native format, but you can save the files in any of the available worksheet formats by clicking the
File | Save As command.
Grid Files Grid files are used to produce grid-based contour and surface maps in Grapher. Grid files contain a regularly spaced rectangular array of Z values organized in columns and rows. Grid files can be imported from a wide variety of sources. For example, the contour grid map.GPJ sample file uses a Surfer .GRD file to create an XY contour grid map.
Plot Types Several unique 2D and 3D plot types can be created, modified, and displayed with Grapher. The Home tab New Graph commands or the graph wizard are used to create a graph. The plot types
are organized in the Home | New Graph group by category:
Basic Plots Basic plots include 2D line plots, scatter plots, line/scatter
plots, step plots, function plots, bubble plots, and class plots. In most cases, two variables are displayed on two axes. The Basic plots also include 3D ribbon plots, 3D wall plots, 3D step plots, and 3D function plots. In these cases, two variables are displayed with a 3D view. Basic plots also include XYZ line/scatter plot, bubble plots, and class plots. These are true three-dimensional plots, using at least
three variables and three axes.
Bar Plots Bar plots include 2D, 3D, or XYZ horizontal and vertical bar charts and floating bar charts. For 2D bar charts, two variables are displayed on two axes. For 3D bar charts, two variables are displayed with a 3D aspect. 2D and 3D bar charts can also be created directly from category data. XYZ bar charts are true three-dimensional bar charts,
where three variables are displayed on three axes.
Plot Types
14
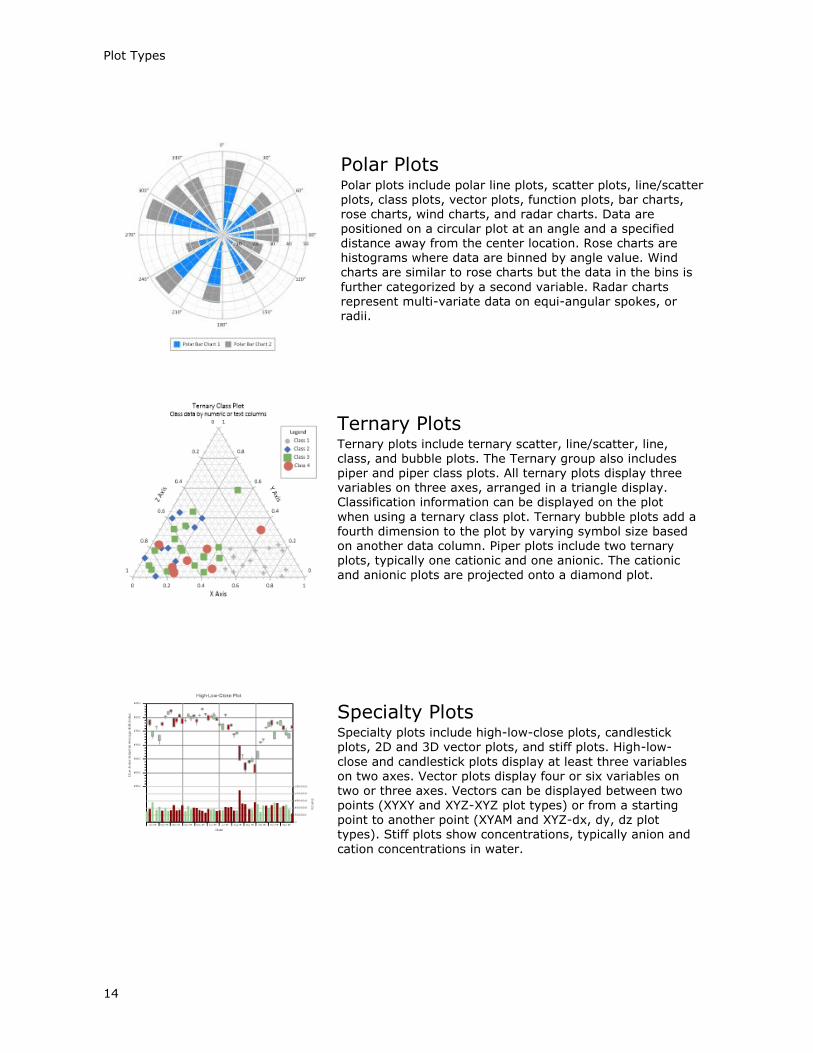
Polar Plots Polar plots include polar line plots, scatter plots, line/scatter plots, class plots, vector plots, function plots, bar charts, rose charts, wind charts, and radar charts. Data are positioned on a circular plot at an angle and a specified distance away from the center location. Rose charts are histograms where data are binned by angle value. Wind charts are similar to rose charts but the data in the bins is
further categorized by a second variable. Radar charts represent multi-variate data on equi-angular spokes, or radii.
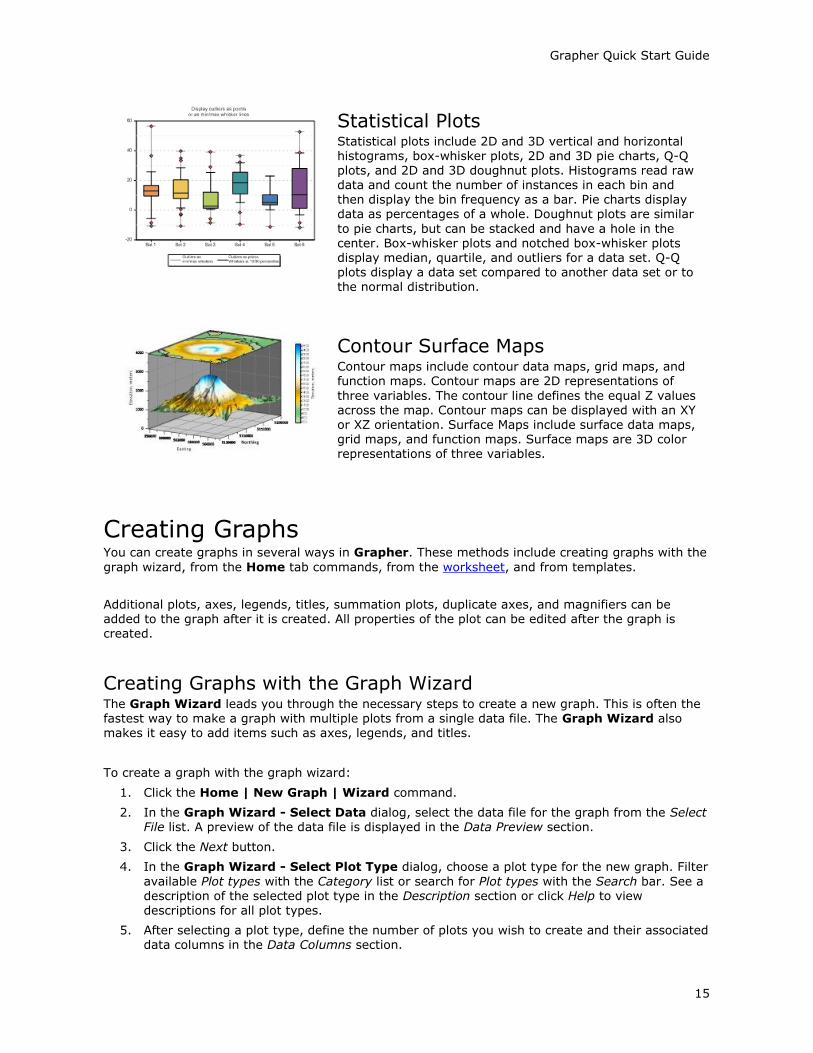
Ternary Plots Ternary plots include ternary scatter, line/scatter, line, class, and bubble plots. The Ternary group also includes piper and piper class plots. All ternary plots display three variables on three axes, arranged in a triangle display. Classification information can be displayed on the plot
when using a ternary class plot. Ternary bubble plots add a fourth dimension to the plot by varying symbol size based on another data column. Piper plots include two ternary plots, typically one cationic and one anionic. The cationic
and anionic plots are projected onto a diamond plot.
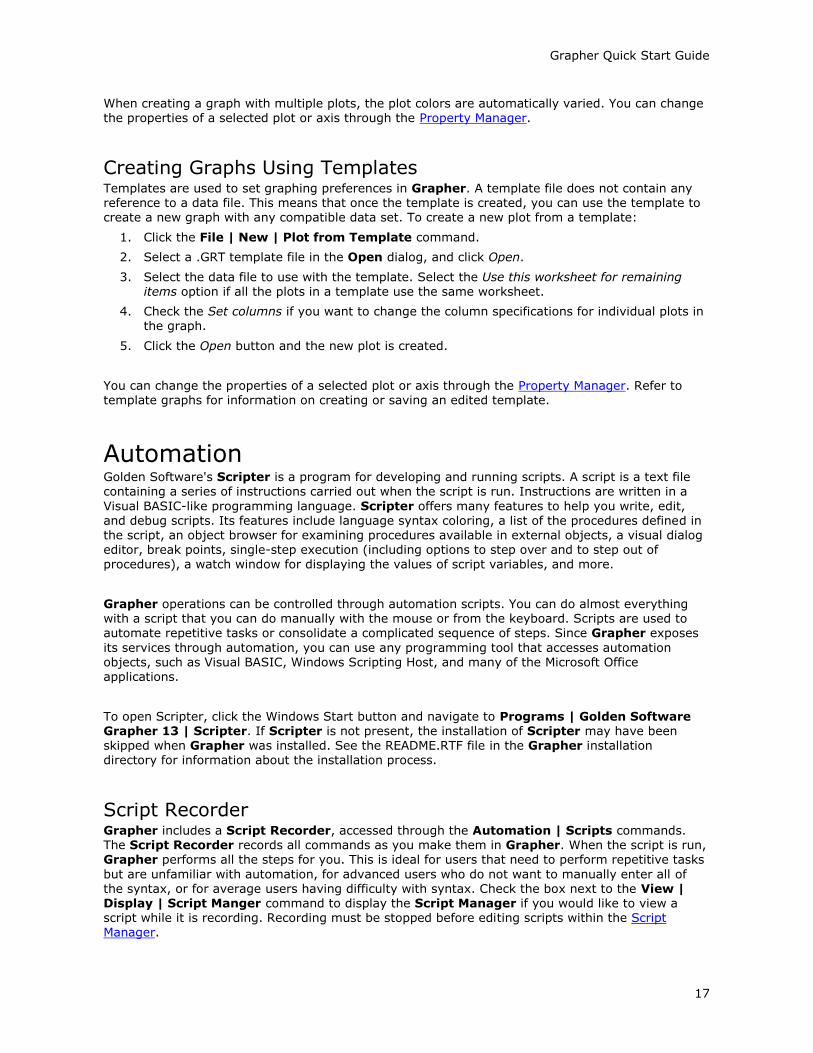
Specialty Plots Specialty plots include high-low-close plots, candlestick plots, 2D and 3D vector plots, and stiff plots. High-low-
close and candlestick plots display at least three variables on two axes. Vector plots display four or six variables on two or three axes. Vectors can be displayed between two
points (XYXY and XYZ-XYZ plot types) or from a starting point to another point (XYAM and XYZ-dx, dy, dz plot types). Stiff plots show concentrations, typically anion and
cation concentrations in water.
Grapher Quick Start Guide
15
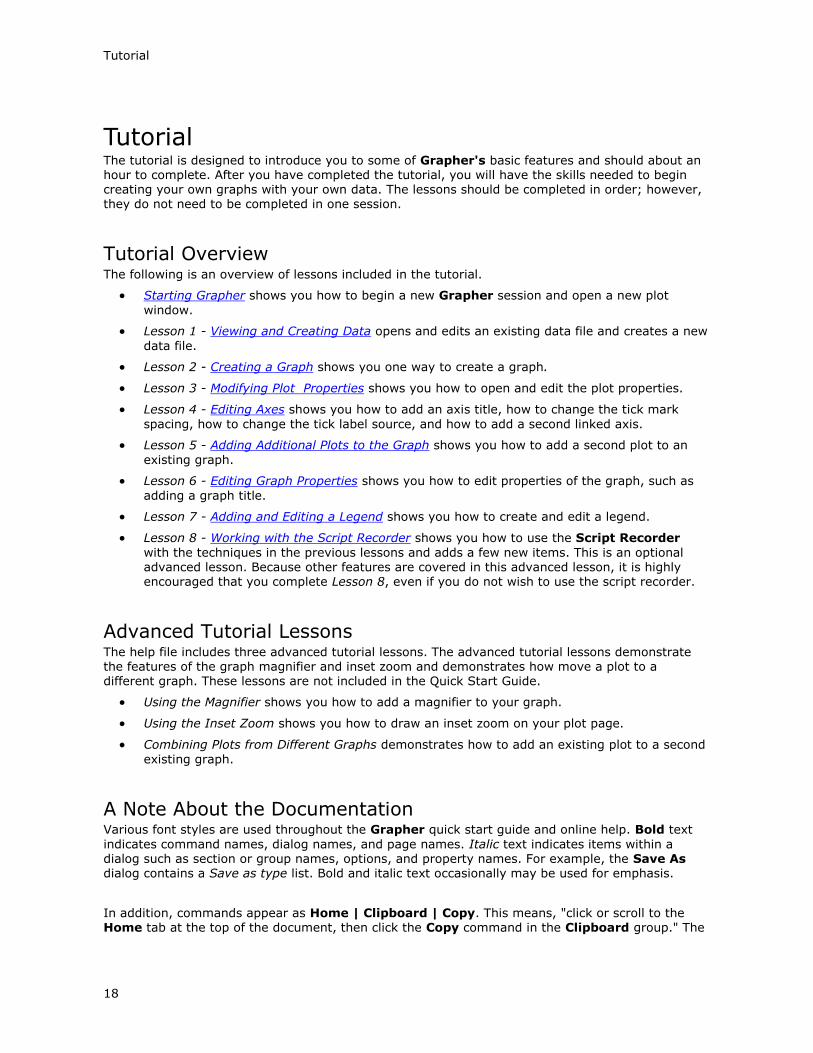
Statistical Plots Statistical plots include 2D and 3D vertical and horizontal histograms, box-whisker plots, 2D and 3D pie charts, Q-Q plots, and 2D and 3D doughnut plots. Histograms read raw data and count the number of instances in each bin and then display the bin frequency as a bar. Pie charts display data as percentages of a whole. Doughnut plots are similar
to pie charts, but can be stacked and have a hole in the center. Box-whisker plots and notched box-whisker plots display median, quartile, and outliers for a data set. Q-Q plots display a data set compared to another data set or to the normal distribution.
Contour Surface Maps Contour maps include contour data maps, grid maps, and function maps. Contour maps are 2D representations of
three variables. The contour line defines the equal Z values across the map. Contour maps can be displayed with an XY or XZ orientation. Surface Maps include surface data maps, grid maps, and function maps. Surface maps are 3D color representations of three variables.
Creating Graphs You can create graphs in several ways in Grapher. These methods include creating graphs with the
graph wizard, from the Home tab commands, from the worksheet, and from templates.
Additional plots, axes, legends, titles, summation plots, duplicate axes, and magnifiers can be added to the graph after it is created. All properties of the plot can be edited after the graph is created.
Creating Graphs with the Graph Wizard The Graph Wizard leads you through the necessary steps to create a new graph. This is often the fastest way to make a graph with multiple plots from a single data file. The Graph Wizard also makes it easy to add items such as axes, legends, and titles.
To create a graph with the graph wizard:
1. Click the Home | New Graph | Wizard command.
2. In the Graph Wizard - Select Data dialog, select the data file for the graph from the Select File list. A preview of the data file is displayed in the Data Preview section.
3. Click the Next button.
4. In the Graph Wizard - Select Plot Type dialog, choose a plot type for the new graph. Filter
available Plot types with the Category list or search for Plot types with the Search bar. See a description of the selected plot type in the Description section or click Help to view descriptions for all plot types.
5. After selecting a plot type, define the number of plots you wish to create and their associated data columns in the Data Columns section.

Creating Graphs
16
6. Click the Next button.
7. In the Graph Wizard - Properties dialog, select which graph components you wish to
display. If the graph contains multiple plots, you can select a Color palette for the plots as well.
8. Click the Finish button to create the graph.
The graph is created with the specified properties. You can change the properties of a selected graph, plot, or axis through the Property Manager.
Creating Graphs in the Plot Window The most common method of creating graphs is to use the Home | New Graph commands. To create a graph in the plot window:
1. Click or scroll to the Home tab.
2. In the New Graph group, click the Basic, Bar, Polar, Ternary, Specialty, Statistical, or Contour Surface plot category.
3. Click on the plot type you would like to create.
4. Select a data file in the Open Worksheet dialog and click Open. If you are creating a contour grid map or surface grid map, you are prompted for a .GRD file. If you are creating any type of function plot, you are not prompted for a data or grid file.
The graph is created with the default properties. You can change the properties of a selected plot or axis through the Property Manager.
Creating Graphs from the Worksheet Window If you are working with the data in the worksheet, you can create a graph without switching to the plot window. Simply select the columns you wish to plot and choose the graph type you wish to create. To create a graph from the worksheet:
1. Open the worksheet using one of the following methods:
Click the File | Open command, select a data file in the Open dialog, and click the Open button.
Click the button in the Quick Access Toolbar to open a new worksheet.
Select a plot in the plot window and click the Graph Tools | Worksheet | Display command.
In the plot window, check the View | Display | Worksheet Manager command to view data files already loaded into the program.
2. Highlight the columns to use in the plot.
3. Click the Home tab. If you are using the Worksheet Manager, right-click in the worksheet and select Home | New Graph from the context menu.
4. In the New Graph group, click the Basic, Bar, Polar, Ternary, Specialty, Statistical, or
Contour Surface button. In the Worksheet Manager, click the Basic, Bar, Polar, Ternary, Specialty, Statistical, or Contour Surface in the context menu.
5. Select the plot type you would like to create and the graph is created with the default plot properties.
Grapher Quick Start Guide
17
When creating a graph with multiple plots, the plot colors are automatically varied. You can change the properties of a selected plot or axis through the Property Manager.
Creating Graphs Using Templates Templates are used to set graphing preferences in Grapher. A template file does not contain any reference to a data file. This means that once the template is created, you can use the template to create a new graph with any compatible data set. To create a new plot from a template:
1. Click the File | New | Plot from Template command.
2. Select a .GRT template file in the Open dialog, and click Open.
3. Select the data file to use with the template. Select the Use this worksheet for remaining items option if all the plots in a template use the same worksheet.
4. Check the Set columns if you want to change the column specifications for individual plots in the graph.
5. Click the Open button and the new plot is created.
You can change the properties of a selected plot or axis through the Property Manager. Refer to template graphs for information on creating or saving an edited template.
Automation Golden Software's Scripter is a program for developing and running scripts. A script is a text file containing a series of instructions carried out when the script is run. Instructions are written in a
Visual BASIC-like programming language. Scripter offers many features to help you write, edit, and debug scripts. Its features include language syntax coloring, a list of the procedures defined in the script, an object browser for examining procedures available in external objects, a visual dialog editor, break points, single-step execution (including options to step over and to step out of
procedures), a watch window for displaying the values of script variables, and more.
Grapher operations can be controlled through automation scripts. You can do almost everything with a script that you can do manually with the mouse or from the keyboard. Scripts are used to automate repetitive tasks or consolidate a complicated sequence of steps. Since Grapher exposes
its services through automation, you can use any programming tool that accesses automation objects, such as Visual BASIC, Windows Scripting Host, and many of the Microsoft Office applications.
To open Scripter, click the Windows Start button and navigate to Programs | Golden Software Grapher 13 | Scripter. If Scripter is not present, the installation of Scripter may have been skipped when Grapher was installed. See the README.RTF file in the Grapher installation directory for information about the installation process.
Script Recorder Grapher includes a Script Recorder, accessed through the Automation | Scripts commands. The Script Recorder records all commands as you make them in Grapher. When the script is run, Grapher performs all the steps for you. This is ideal for users that need to perform repetitive tasks
but are unfamiliar with automation, for advanced users who do not want to manually enter all of the syntax, or for average users having difficulty with syntax. Check the box next to the View | Display | Script Manger command to display the Script Manager if you would like to view a script while it is recording. Recording must be stopped before editing scripts within the Script Manager.
Tutorial
18
Tutorial The tutorial is designed to introduce you to some of Grapher's basic features and should about an hour to complete. After you have completed the tutorial, you will have the skills needed to begin creating your own graphs with your own data. The lessons should be completed in order; however, they do not need to be completed in one session.
Tutorial Overview The following is an overview of lessons included in the tutorial.
Starting Grapher shows you how to begin a new Grapher session and open a new plot
window.
Lesson 1 - Viewing and Creating Data opens and edits an existing data file and creates a new
data file.
Lesson 2 - Creating a Graph shows you one way to create a graph.
Lesson 3 - Modifying Plot Properties shows you how to open and edit the plot properties.
Lesson 4 - Editing Axes shows you how to add an axis title, how to change the tick mark
spacing, how to change the tick label source, and how to add a second linked axis.
Lesson 5 - Adding Additional Plots to the Graph shows you how to add a second plot to an
existing graph.
Lesson 6 - Editing Graph Properties shows you how to edit properties of the graph, such as
adding a graph title.
Lesson 7 - Adding and Editing a Legend shows you how to create and edit a legend.
Lesson 8 - Working with the Script Recorder shows you how to use the Script Recorder
with the techniques in the previous lessons and adds a few new items. This is an optional
advanced lesson. Because other features are covered in this advanced lesson, it is highly encouraged that you complete Lesson 8, even if you do not wish to use the script recorder.
Advanced Tutorial Lessons The help file includes three advanced tutorial lessons. The advanced tutorial lessons demonstrate the features of the graph magnifier and inset zoom and demonstrates how move a plot to a different graph. These lessons are not included in the Quick Start Guide.
Using the Magnifier shows you how to add a magnifier to your graph.
Using the Inset Zoom shows you how to draw an inset zoom on your plot page.
Combining Plots from Different Graphs demonstrates how to add an existing plot to a second
existing graph.
A Note About the Documentation Various font styles are used throughout the Grapher quick start guide and online help. Bold text
indicates command names, dialog names, and page names. Italic text indicates items within a dialog such as section or group names, options, and property names. For example, the Save As dialog contains a Save as type list. Bold and italic text occasionally may be used for emphasis.
In addition, commands appear as Home | Clipboard | Copy. This means, "click or scroll to the Home tab at the top of the document, then click the Copy command in the Clipboard group." The

Grapher Quick Start Guide
19
first word is always the ribbon tab name, followed by the group name, and the last word is always the specific command.
Starting Grapher To begin a Grapher session:
1. Navigate to the installation folder, C:\Program Files\Golden Software\Grapher 13 by default.
2. Double-click on the Grapher.EXE application file.
3. Select the type of document to create in the Welcome to Grapher dialog. For the tutorial, click Plot.
4. A new empty plot window opens in Grapher. This is the work area for producing graphs.
If this is the first time that you have opened Grapher, you will be prompted to license Grapher.
Activate your Single-User product key, select a license server, or continue using the trial. Your
product key is located in the download instructions email. You may also access your product key at your Golden Software My Account page.
If you have already been working with Grapher, open a new plot window before starting the
tutorial. To open a new plot window, click the File | New | Plot command, click the button on
the quick access toolbar, or press CTRL+N on the keyboard.
Lesson 1 - Viewing and Creating Data A data file is a file that contains columns of data values. At minimum, two columns are required to
create most 2D graphs in Grapher. Data files can contain header information, labels, point identifiers, filter information, and multiple columns of data. It is often a good idea to examine the data file contents before creating your graph.
Creating a New Data File
The Grapher worksheet can be used to create a new data file. Use these steps to open a new worksheet window and begin entering data. Refer to the Worksheet Window help topic for
information about the various portions of the worksheet window.
1. Click the File | New | Worksheet command, click the button in the quick access
toolbar, or press CTRL+W on the keyboard. A new empty worksheet window is displayed.
2. Data are entered into the active cell of the worksheet. The active cell is selected by clicking on the cell or by using the arrow keys to move between cells. When a cell is active, enter a
value or text, and the information is displayed in both the active cell and the active cell edit box.
3. To preserve the typed data in the active cell, move to a new cell. Move to a new cell by
clicking a new cell with the mouse, pressing one of the arrow keys, or pressing ENTER.
Opening an Existing Data File
If you would like to view or edit data, you can open the data file in Grapher. There are several ways to view a data file. If a graph has already been created, the most common method to view
the data is to use the Worksheet Manager. If a graph is not yet created, you can open the data in the worksheet window.
1. Click the File | Open command, click the button on the quick access toolbar, or press
CTRL+O on the keyboard. The Open dialog appears.
Tutorial
20
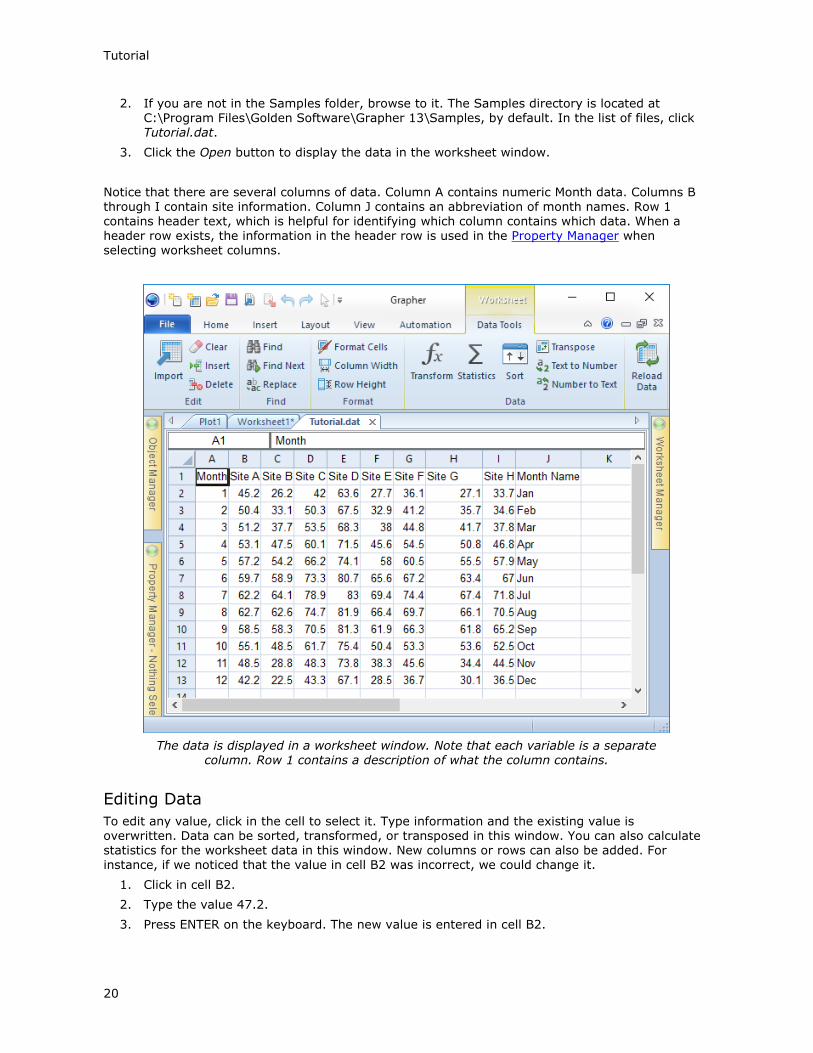
2. If you are not in the Samples folder, browse to it. The Samples directory is located at C:\Program Files\Golden Software\Grapher 13\Samples, by default. In the list of files, click Tutorial.dat.
3. Click the Open button to display the data in the worksheet window.
Notice that there are several columns of data. Column A contains numeric Month data. Columns B through I contain site information. Column J contains an abbreviation of month names. Row 1 contains header text, which is helpful for identifying which column contains which data. When a header row exists, the information in the header row is used in the Property Manager when selecting worksheet columns.
The data is displayed in a worksheet window. Note that each variable is a separate column. Row 1 contains a description of what the column contains.
Editing Data
To edit any value, click in the cell to select it. Type information and the existing value is overwritten. Data can be sorted, transformed, or transposed in this window. You can also calculate statistics for the worksheet data in this window. New columns or rows can also be added. For instance, if we noticed that the value in cell B2 was incorrect, we could change it.
1. Click in cell B2.
2. Type the value 47.2.
3. Press ENTER on the keyboard. The new value is entered in cell B2.
Grapher Quick Start Guide
21
Calculating Statistics on the Data
Sometimes, it is necessary to know some basic statistical information about the data. For instance, with this data, what is the maximum value for each site and how do the average values relate to one another? This information can be calculated in the worksheet.
To display basic statistical information for one column:
1. Click on the header B to select all of Column B: Site A.
2. Click the Data Tools | Data | Statistics command.
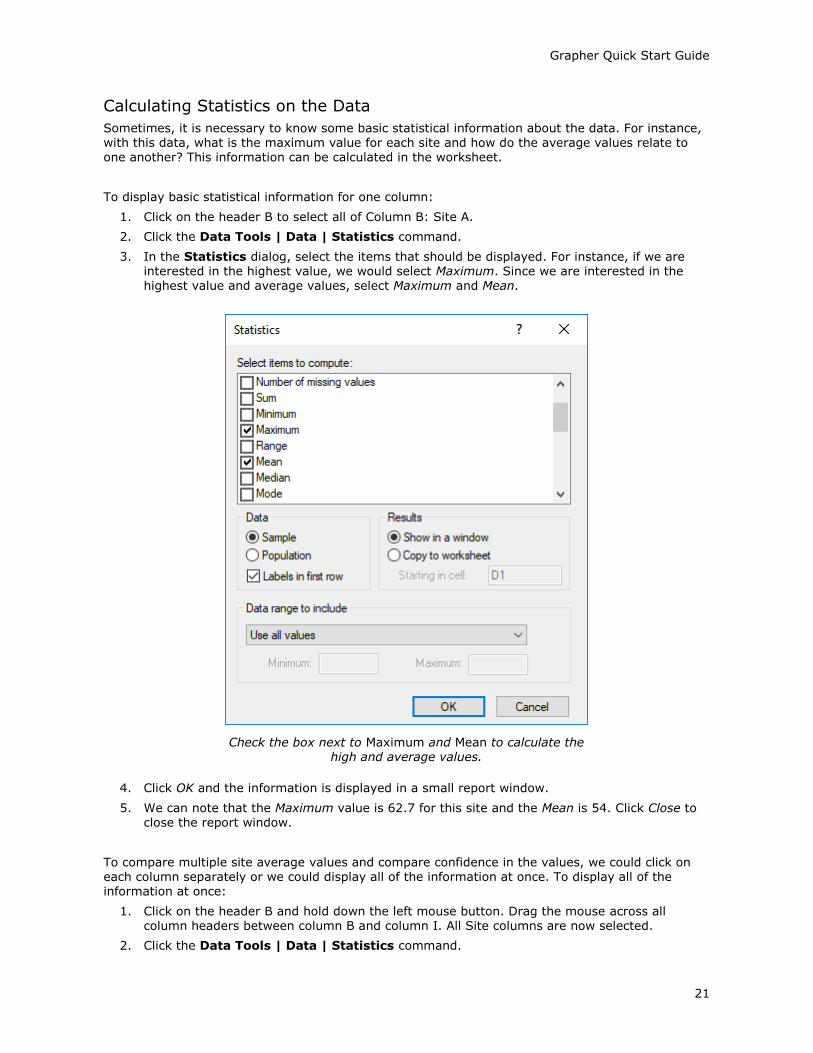
3. In the Statistics dialog, select the items that should be displayed. For instance, if we are interested in the highest value, we would select Maximum. Since we are interested in the highest value and average values, select Maximum and Mean.
Check the box next to Maximum and Mean to calculate the high and average values.
4. Click OK and the information is displayed in a small report window.
5. We can note that the Maximum value is 62.7 for this site and the Mean is 54. Click Close to close the report window.
To compare multiple site average values and compare confidence in the values, we could click on each column separately or we could display all of the information at once. To display all of the information at once:
1. Click on the header B and hold down the left mouse button. Drag the mouse across all column headers between column B and column I. All Site columns are now selected.
2. Click the Data Tools | Data | Statistics command.

Tutorial
22
3. In the dialog, select the items that should be displayed. In this case, we are interested in the maximum value, average values, and confidence in the average values. Select Maximum, Mean, Standard error of the mean, and 95% confidence interval for the mean.
4. Select Copy to worksheet and set the Starting in cell to K1 to display the summary information in the same worksheet as the actual data instead of in a report window.
Check all of the desired options and select Copy to worksheet to copy the results to the existing worksheet.
5. Click OK and the information is displayed in columns K through S.
6. Mean values can be compared visually. The standard error of the mean and 95% confidence
value can also be compared. In addition, plots can be created directly from the summary statistics information, if desired.
Visually inspect the statistical results to compare various site data.

Grapher Quick Start Guide
23
Saving the Data File
When you have completed entering all of the data, the data can be saved in a variety of formats.
1. Click the File | Save As command. The Save As dialog is displayed.
2. Specify a save location for the new data file, your Documents folder for example.
3. In the Save as type list, choose the DAT Data (*.dat) option.
4. Type Tutorial in the File name field if it is not there already.
5. Click the Save button and the Data Export Options dialog opens.
6. Accept the defaults in the Data Export Options dialog by clicking OK.
7. The file is saved in the Data .DAT format with the file name you specified. The name of the data file appears in the title bar and on the worksheet tab.
Lesson 2 - Creating a Graph You can create graphs in several ways in Grapher. Graphs can be created with the graph wizard, from the Home | New Graph commands, from the worksheet, and from templates. We will use the most common method for the tutorial, creating a graph through the Home tab New Graph
group. We will create a line/scatter plot from an existing data set.
To create a line plot graph:
1. If the worksheet window is still open, click the Plot1 tab. Alternatively, you can create a new plot window by clicking the File | New | Plot command.
2. Click the Home | New Graph | Basic | Line Plot command.
3. In the Open Worksheet dialog, select the Tutorial.dat file you saved in Lesson 1. You can select the file in the file list section or in the Open worksheets section at the bottom of the dialog. You can open the Tutorial.dat sample file if you did not complete Lesson 1.
4. Once the file is selected, click the Open button.
A line plot is created using the default properties. By default, Grapher uses the first two columns containing numeric or date/time data in the data file. In this example, the X values are in column A and the Y values are in column B.
The line plot is created with the default settings.
Tutorial
24
Lesson 3 - Modifying Plot Properties You can edit any of the plot properties after the graph has been created. You can edit the columns used to create the plot, the plot line color, the symbol display, and label display, add fill to the plot,
or change just about anything you see on the plot. In this example, let's change the line plot created in the Lesson 2 - Creating a Graph section to a scatter plot and add labels. The graph from Lesson 2 - Creating a Graph should already exist in the plot window before you proceed with this lesson.
Selecting the Line/Scatter Plot
The Object Manager is the easiest way to select the exact object you want, so this method is used throughout the tutorial. Methods for selecting objects are discussed in the Selecting Objects help topic. Once an object is selected, its properties are available for editing in the Property Manager.
To select the line/scatter plot:
1. Make sure the Object Manager is open. If you do not see the Object Manager, check the View | Display | Object Manager command. A check mark is displayed next to the visible
managers. If the Object Manager box is not checked, click in the empty box next to Object Manager to display it.
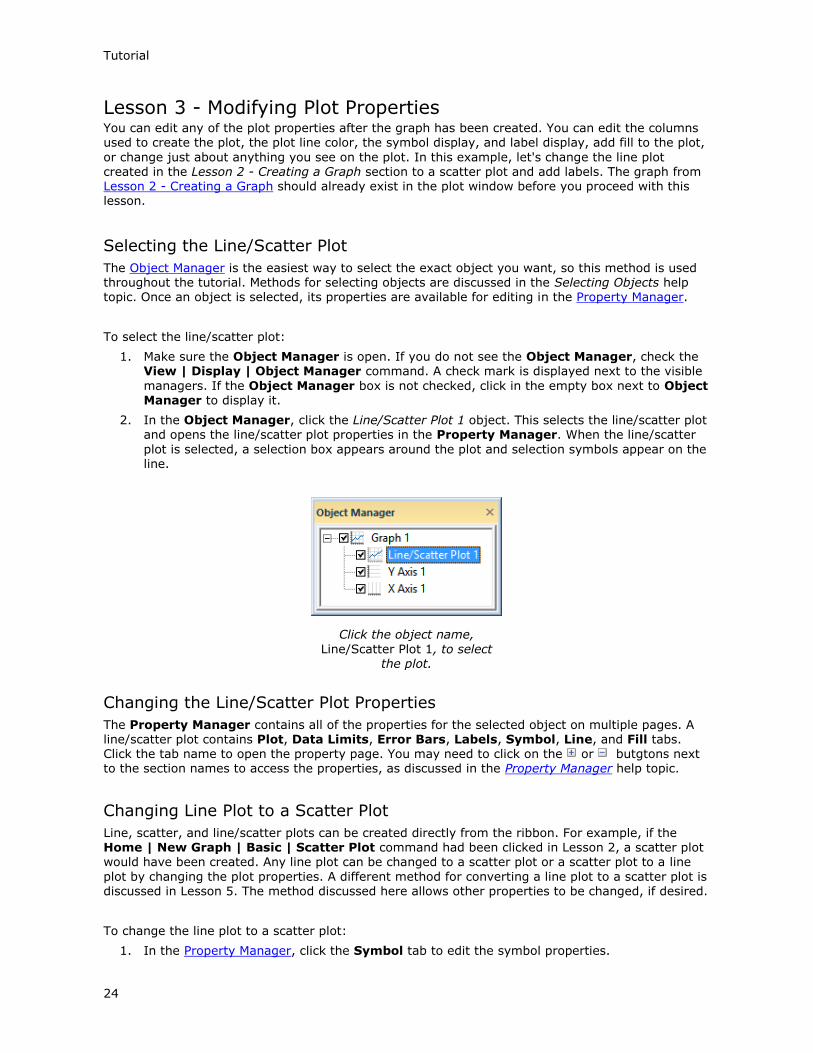
2. In the Object Manager, click the Line/Scatter Plot 1 object. This selects the line/scatter plot and opens the line/scatter plot properties in the Property Manager. When the line/scatter
plot is selected, a selection box appears around the plot and selection symbols appear on the line.
Click the object name,
Line/Scatter Plot 1, to select the plot.
Changing the Line/Scatter Plot Properties
The Property Manager contains all of the properties for the selected object on multiple pages. A line/scatter plot contains Plot, Data Limits, Error Bars, Labels, Symbol, Line, and Fill tabs. Click the tab name to open the property page. You may need to click on the or butgtons next to the section names to access the properties, as discussed in the Property Manager help topic.
Changing Line Plot to a Scatter Plot
Line, scatter, and line/scatter plots can be created directly from the ribbon. For example, if the Home | New Graph | Basic | Scatter Plot command had been clicked in Lesson 2, a scatter plot would have been created. Any line plot can be changed to a scatter plot or a scatter plot to a line
plot by changing the plot properties. A different method for converting a line plot to a scatter plot is discussed in Lesson 5. The method discussed here allows other properties to be changed, if desired.
To change the line plot to a scatter plot:
1. In the Property Manager, click the Symbol tab to edit the symbol properties.

Grapher Quick Start Guide
25
2. Set the Frequency property in the Plot Symbol Properties section to 1. The plot is updated with the default symbol at every data value.
3. The Symbol property displays the current symbol style. Click the current symbol, which by
default is a . Clicking the current symbol opens the symbol palette. Click the filled square,
Symbol 10, two boxes to the left of the default symbol. Once you click on the filled square, the symbol palette closes and the plot automatically updates to show the new symbol.
4. Click on the Line tab to edit the line properties.
5. In the Plot Line Properties section, click the current line style next to the Style property, to open the line style palette. Select the Invisible line style, which is the first entry in the line palette list. Once you click on the Invisible line style, the line style palette closes and the plot changes to a scatter plot.
A scatter plot is created by adding symbols and changing the line style to Invisible.
Displaying Plot Labels
Labels can be displayed at any data point on the plot. Labels can come from the X or Y data columns or from any other data column in the worksheet.
To display labels for the data points:
1. Click on the Line/Scatter Plot 1 in the Object Manager to select the plot.
2. In the Property Manager, click on the Labels tab to display the plot labels properties.
3. Select Column B: Site A in the Label column list in the General section.
The Y data values from column B are shown as data point labels on the plot.

Tutorial
26
Add plot labels to show values or distinguish between data points.
Moving Labels
Grapher allows you to manually move labels that are displayed for plots and axes with the Move Labels command. You can also move axis, legend, and graph titles with the Move Labels command.
To move the plot labels:
1. With the plot selected, click the Graph Tools | Plot Tools | Move Labels command. The
Move Labels command remains highlighted to indicate Move Labels mode is active. The
first label will appear with a box around it, .
2. Click on the label, hold down the left mouse button, and drag the label to the desired location. Alternatively, press the ARROW keys on the keyboard to move the label a small amount.
3. When you are finished moving this label, click on another label to move it. Repeat the clicking on labels and moving until all labels are in the desired location.
4. When finished, press the ESC key on the keyboard or click the Graph Tools | Plot Tools | Move Labels command again to end Move Labels mode.
To return the labels to their original positions, you can use the Graph Tools | Plot Tools | Reset Positions command.
Lesson 4 - Editing Axes Grapher's axes can be modified to fit any design needs. The axis scale, axis length, tick mark spacing, tick mark labels, axis titles, colors, etc. can all be customized.
Selecting the Axis
The graph from Lesson 3 - Modifying Plot Properties should already exist in the plot window before you proceed with this lesson. Click on Y Axis 1 in the Object Manager to select it and display the axis properties in the Property Manager.

Grapher Quick Start Guide
27
Adding an Axis Title
Once the axis is selected, all of the axis properties are displayed in the Property Manager. Standard axes have Axis, Ticks, Labels, Link Axis, and Line tabs. The axis title options are on the Axis page. By default, the axis title is linked to the first row in the data file. In this example, we will change the Y axis title.
To add an axis title:
1. Click the Axis tab in the Property Manager to edit the axis properties.
2. Open the Title section by clicking the next to Title if necessary.
3. Open the Title Properties section by clicking the next to Title Properties if necessary.
4. In the Text section, click the button in the Text field. The Text Editor opens.
5. In the Text Editor dialog, delete the current linked text, <<@B1>>.
6. Type Temperature (F).
7. Click in the space just before the F and click the button.
8. In the Symbol Properties dialog, change the Symbol Set to Calibri and select the degree symbol, Number 144. Click OK to return to the Text Editor. Alternatively, you can click in
the space before the F and press and hold the ALT key while typing the number 0176. This will also insert the symbol, without opening the Symbol Properties dialog. This is a good method to use when inserting Unicode or international characters in any text box.
9. Next, let's change the properties of the axis title. In the Text Editor, click and drag to
highlight the text Temperature (°F).
10. Highlight the current font size and type 18, to make the font 18 points. The font size is located to the right of the font name in the upper left corner of the dialog. Only the highlighted text changes size, so be sure to select all of the text.
11. Click the button to make the text bold.
12. Click OK to close the Text Editor and
save the changes to the axis title.
The text Temperature (°F) now appears along the Y axis.
Changing the Tick Mark Spacing
Tick marks are a means of indicating units of measure and are typically equally spaced like the lines on a ruler. Tick marks are the lines
that emerge perpendicularly from an axis. Normally, the major tick marks are longer and the minor tick marks are shorter and appear
between the major tick marks. In the graph the major tick mark spacing on the Y axis is five units, i.e., 40, 45, 50, 55, 60, and 65. In
addition, there is a single unlabeled minor tick mark between each set of major tick marks. In the following exercise, the tick spacing is changed to ten units. The number of minor tick marks is changed to five.
Axis titles are added by selecting the axis and then adding the Text in the Axis page of the
Property Manager.
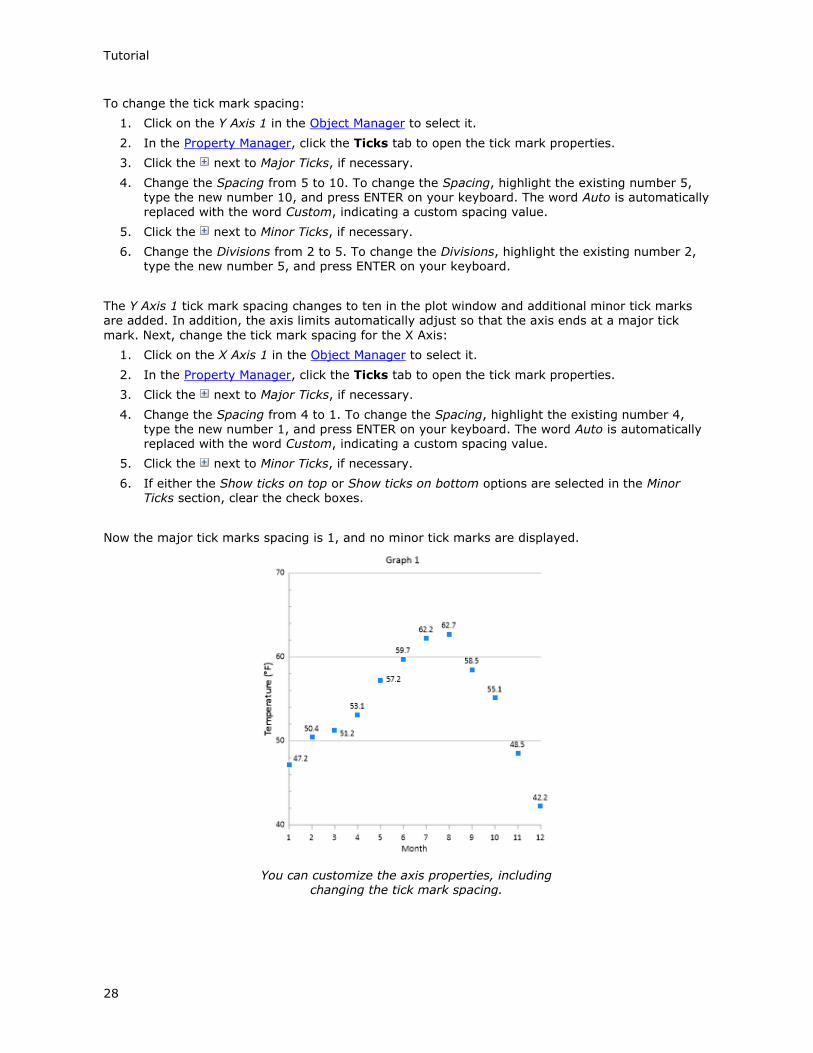
Tutorial
28
To change the tick mark spacing:
1. Click on the Y Axis 1 in the Object Manager to select it.
2. In the Property Manager, click the Ticks tab to open the tick mark properties.
3. Click the next to Major Ticks, if necessary.
4. Change the Spacing from 5 to 10. To change the Spacing, highlight the existing number 5, type the new number 10, and press ENTER on your keyboard. The word Auto is automatically replaced with the word Custom, indicating a custom spacing value.
5. Click the next to Minor Ticks, if necessary.
6. Change the Divisions from 2 to 5. To change the Divisions, highlight the existing number 2, type the new number 5, and press ENTER on your keyboard.
The Y Axis 1 tick mark spacing changes to ten in the plot window and additional minor tick marks are added. In addition, the axis limits automatically adjust so that the axis ends at a major tick
mark. Next, change the tick mark spacing for the X Axis:
1. Click on the X Axis 1 in the Object Manager to select it.
2. In the Property Manager, click the Ticks tab to open the tick mark properties.
3. Click the next to Major Ticks, if necessary.
4. Change the Spacing from 4 to 1. To change the Spacing, highlight the existing number 4, type the new number 1, and press ENTER on your keyboard. The word Auto is automatically replaced with the word Custom, indicating a custom spacing value.
5. Click the next to Minor Ticks, if necessary.
6. If either the Show ticks on top or Show ticks on bottom options are selected in the Minor Ticks section, clear the check boxes.
Now the major tick marks spacing is 1, and no minor tick marks are displayed.
You can customize the axis properties, including changing the tick mark spacing.

Grapher Quick Start Guide
29
Changing the Tick Labels
Tick labels can be displayed using different label sources including Automatic, Numeric date/time, and From worksheet. Automatic labels are the default, however there may be situations where either using either a number to represent date/time values or labels directly from a worksheet source may be useful. For this tutorial, we will change the X Axis labels to use a data column from the worksheet where we have tick label names specified.
To change the tick labels source:
1. Click on the X Axis 1 in the Object Manager to select it.
2. In the Property Manager, click on the Labels tab to open the tick label properties.
3. Click the next to General, if necessary.
4. Click the word Automatic next to the Label source option and select From worksheet in the
list. This displays the Worksheet properties in the Labels page.
5. Next to Worksheet, click the word None to display a list of open worksheets and the Browse option. The Browse option would be used to select a worksheet that is not already open. In this tutorial, the worksheet we want to use is already open. Select the Tutorial.dat file from the list.
6. Next to the Data column property, click the current column and select Column A: Month.
7. Next to the Label column property, click the current column and select Column J: Month
Name.
The graph updates with the worksheet labels defined by the text in Column J of the worksheet.
You can customize tick labels to display information from a column in the worksheet.
If the axis labels or the axis title overlap or need to be moved slightly, click the Graph Tools | Plot Tools | Move Labels command. Click on the label or axis title, hold down the left mouse button,
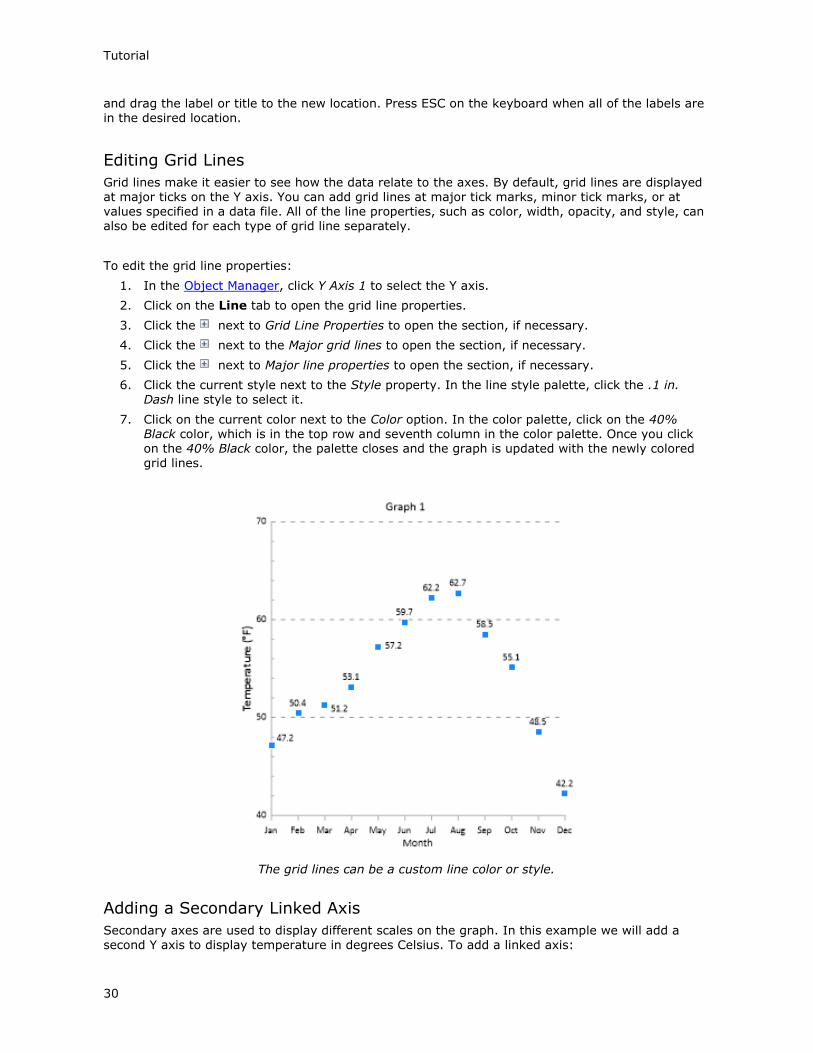
Tutorial
30
and drag the label or title to the new location. Press ESC on the keyboard when all of the labels are in the desired location.
Editing Grid Lines
Grid lines make it easier to see how the data relate to the axes. By default, grid lines are displayed at major ticks on the Y axis. You can add grid lines at major tick marks, minor tick marks, or at values specified in a data file. All of the line properties, such as color, width, opacity, and style, can also be edited for each type of grid line separately.
To edit the grid line properties:
1. In the Object Manager, click Y Axis 1 to select the Y axis.
2. Click on the Line tab to open the grid line properties.
3. Click the next to Grid Line Properties to open the section, if necessary.
4. Click the next to the Major grid lines to open the section, if necessary.
5. Click the next to Major line properties to open the section, if necessary.
6. Click the current style next to the Style property. In the line style palette, click the .1 in. Dash line style to select it.
7. Click on the current color next to the Color option. In the color palette, click on the 40% Black color, which is in the top row and seventh column in the color palette. Once you click on the 40% Black color, the palette closes and the graph is updated with the newly colored grid lines.
The grid lines can be a custom line color or style.
Adding a Secondary Linked Axis
Secondary axes are used to display different scales on the graph. In this example we will add a second Y axis to display temperature in degrees Celsius. To add a linked axis:

Grapher Quick Start Guide
31
1. Click on the Graph 1 object in the Object Manager.
2. Click the Home | Add to Graph | Axis | Y Axis command to add a second Y axis.
3. In the Position Y Axis 2 dialog, check the Flip tick marks and labels check box.
4. Click OK.
5. Click the Link Axis tab in the Property Manager to link the new axis.
6. In the Link axis field, click None and select Y Axis 1 from the list.
7. Check the Link limits check box.
8. In the Limits Y = F(X) = field, highlight the current text, type (X-32)*5/9, and press ENTER.
The axis limits automatically update to apply the equation to the linked axis limits. X in the equation refers to the controlling axis. So, the Minimum value (40) has 32 subtracted from it and then is multiplied by 5/9 to get the Minimum value for the new dependent axis. The same process is used with the Maximum value (70) to calculate the dependent axis maximum. The new axis Minimum is 4.444 and the Maximum is 21.111.
9. We also want the axis to stay located in the same relative position when the graph moves. Check the boxes next to Link X position and Link Y position. Now, when any portion of the graph is moved, the axis will also move.
10. Click the Line tab to open the Y Axis 2 line properties.
11. In the Grid Line Properties section, clear the Major tick grid line option to remove the Y Axis 2 grid lines.
Now the secondary Y axis is displayed to the right of the graph with a degrees Celsius scale. When the graph is moved or the axis limits change, the Y Axis 2 automatically updates to stay in the same relative location and the same relative axis limits as Y Axis 1. Use the processes from the previous lessons to add an axis title, change the tick mark spacing, and move any overlapping
labels if you desire.
Add multiple axes to display alternate scales on
the graph.

Tutorial
32
Lesson 5 - Adding Additional Plots to the Graph You can add several plots to one graph in Grapher. In Tutorial.dat, columns B through I are additional Y data, making it simple to add additional plots to the graph.
Adding a New Plot to a Graph
To add a plot to the graph created in Creating a Graph:
1. Click on Line/Scatter Plot 1 in the Object Manager to display the properties in the Property Manager.
2. Click the Plot tab in the Property Manager.
3. Click the button next to Add to Graph to open the section, if necessary.
4. Click the Create button next to the New plot option to add a new plot to the graph.
Clicking the Create button creates a new line/scatter plot using the same worksheet as the original plot. The same axes and plot properties are also used for the new plot, the plot color is
automatically changed. The X column stays the same and the Y column increments to the next column with data. The new plot is selected after the command is executed. The Property Manager title changes to Property Manager - Line/Scatter Plot 2 and the Y column changes to Column C: Site B.
All of the data must be contained in one data file to use the New plot feature in the Plot page. In addition, not all plot types have this option. When many plot types are selected, the Graphs | Add to Graph commands are available. These allow additional axes, duplicate axes, plots from a different data file, legends, summation plots, and magnifiers to be added to the selected graph. For
additional information on this command, see the Plot - Add to Graph help topic. The Graph Wizard can also be used to quickly create a graph with multiple plots from a single data file.
Changing the Plot Type
Let's change the new scatter plot into a line plot to help differentiate between the two curves. Previously, we changed from a line plot to a scatter plot by editing the Line and Symbol properties in the Property Manager. There is also a shortcut to changing between plot types.
To change the scatter plot into a line plot:
1. Click on the Line/Scatter Plot 2 in the Object Manager.
2. Click the Graph Tools | Convert | Plot Type | Line command. The scatter plot changes to a line plot.
3. Click on the Labels tab in the Property Manager.
4. To remove the labels, set the Label column property to None.
The Graph Tools | Convert | Plot Type command is not available for all plot types. It can be
used to convert line, scatter, line/scatter, step, and bar charts to other line, scatter, line/scatter, step, and bar charts. The Graph Tools | Convert | Graph to 2D/3D command can be used to convert a 2D graph to a 3D graph, or vice versa, when the entire graph is selected.
Adding Semi-Transparent Fill
Adding a semi-transparent fill to the line plot will help distinguish it from the scatter plot. Color gradients can be used to enhance the appearance of the fill and can be mapped to specific values.
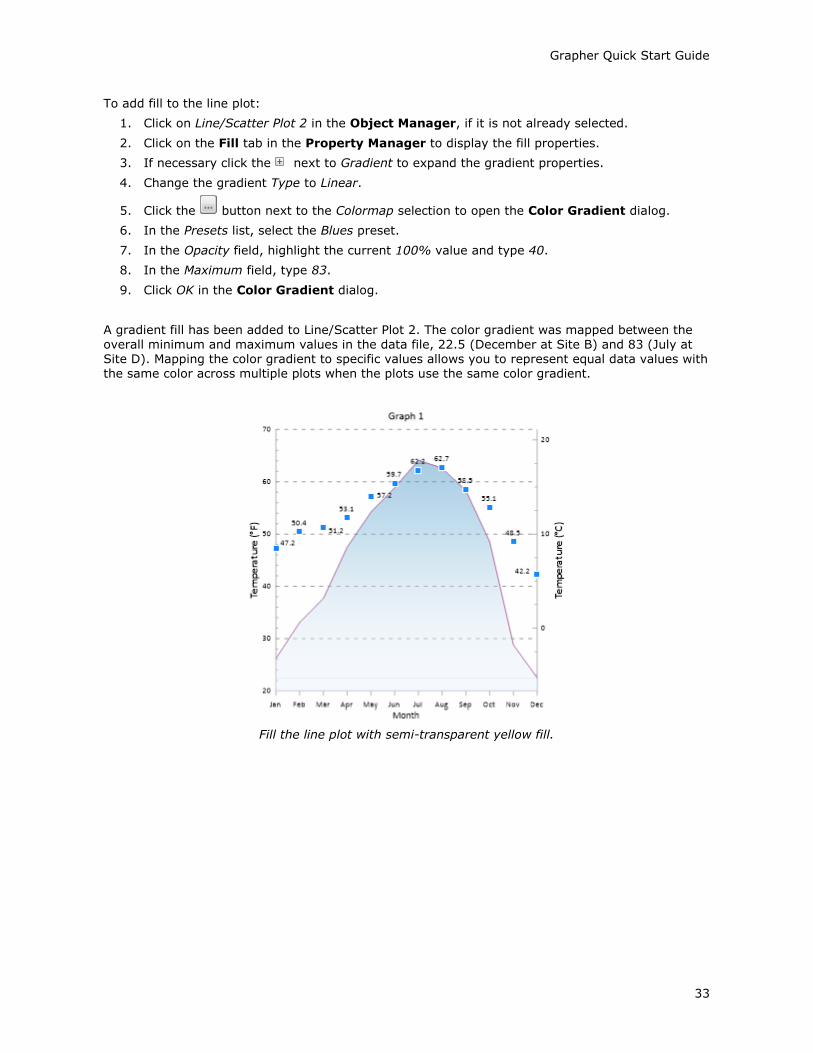
Grapher Quick Start Guide
33
To add fill to the line plot:
1. Click on Line/Scatter Plot 2 in the Object Manager, if it is not already selected.
2. Click on the Fill tab in the Property Manager to display the fill properties.
3. If necessary click the next to Gradient to expand the gradient properties.
4. Change the gradient Type to Linear.
5. Click the button next to the Colormap selection to open the Color Gradient dialog.
6. In the Presets list, select the Blues preset.
7. In the Opacity field, highlight the current 100% value and type 40.
8. In the Maximum field, type 83.
9. Click OK in the Color Gradient dialog.
A gradient fill has been added to Line/Scatter Plot 2. The color gradient was mapped between the
overall minimum and maximum values in the data file, 22.5 (December at Site B) and 83 (July at Site D). Mapping the color gradient to specific values allows you to represent equal data values with the same color across multiple plots when the plots use the same color gradient.
Fill the line plot with semi-transparent yellow fill.

Tutorial
34
Lesson 6 - Editing Graph Properties Graph properties control settings that affect the entire graph, such as titles, background line and fill colors, and fill patterns that fill between multiple plots. Let’s edit the graph title and set the
background fill and line properties for the graph.
Editing a Graph Title
To add a graph title:
1. Click on the Graph 1 object in the Object Manager to select the entire graph.
2. Click on the Title tab in the Property Manager.
3. In the Text property field, delete
Graph 1 and type the graph title,
Average Daily Maximum.
4. Click the button next to Font to open the section, if necessary.
5. Highlight the current Size (points) value and change it to 20.
The Text and Font properties can be used to quickly add and modify a simple text title. The Text Editor can be used to add multiple lines and various fonts, sizes, and colors to the title.
Setting Background Fill and Line Properties
To set the background fill and line properties:
1. With the Graph 1 selected, click on the Fill tab in the Property Manager.
2. Click the next to Background Fill Properties to open the section, if necessary.
3. Set the Foreground color to 10%
Black by clicking on the existing color and selecting the 10% Black color from the palette.
The graph now has a light gray background, and all axes and the graph are labeled.
Add a graph title to display additional information about the graph.
Set graph properties by clicking on the Graph object to add a final finished appearance to a
graph.

Grapher Quick Start Guide
35
Lesson 7 - Adding and Editing a Legend Legends provide information for interpreting a graph. You can add a legend for most plot types. Typically, legends are linked to the graph so that any changes made to the graph are automatically
updated in the legend. The legend features, such as font and legend placement, can be customized.
Adding a Legend
To add a legend:
1. Select any part of the graph by clicking on an object in the graph, such as Y Axis 1 or Line/Scatter Plot 2.
2. Click the Home | Add to Graph | Legend command.
A legend is created for the graph using the default properties. Currently, the legend displays Legend for the title and Line/Scatter Plot 1 and Line/Scatter Plot 2 for the plot names. Let's move
the legend and change the names to reflect the data.
When a legend is first created, it
contains the graph and plot names listed in the Object Manager.
Moving the Legend
To move the legend:
1. Click on Legend 1 in the Object Manager to select the legend.
2. Once the legend is selected, position the cursor over the legend in the plot window. Click and hold the left mouse button.
3. Drag the legend to a new location. Release the mouse button to position the legend in the new location.
Editing the Legend Title
To change the legend title:
1. Click on Legend 1 in the Object Manager to select the legend.
2. In the Property Manager, click on
the Title tab.
3. Type the title Site Location Key in the Text property field and press ENTER.
Drag the legend to a new location.
Tutorial
36
Editing the Plot Names
To change the plot names in the legend:
1. Click on Legend 1 in the Object Manager to select the legend.
2. In the Property Manager, click on the Legend tab to open the legend properties.
3. Next to the Entries option, click the Edit button. This opens the Legend Entries dialog.
4. In the Legend Entries dialog, click Line/Scatter Plot 1 under the Name column.
5. Click the Rename button. This opens the Text Editor.
6. Let's change the text to Site A to match the worksheet. Highlight Line/Scatter Plot 1 and type Site A.
7. Click OK to close the Text Editor.
8. In the Legend Entries dialog, click Line/Scatter Plot 2 under the Name column.
9. Click the Rename button. This opens the Text Editor.
10. Another way to change the text is to link the text from a worksheet cell. Highlight the Line/Scatter Plot 2 text and press the DELETE key on your keyboard.
11. Click the Worksheet button.
12. Select the Tutorial.dat file in the Open worksheets list, and click Open.
13. Click the Insert cell button to open the Enter Cell dialog.
14. In the Enter Cell dialog, type C1 and click OK. The text <<@C1>> will be displayed in the Text Editor, indicating linked worksheet text.
15. Click OK in the Text Editor. The Line/Scatter Plot 2 is updated to Site B, as indicated in cell C1 of the specified worksheet. This text will automatically update if the text in cell C1 of the worksheet changes.
16. Click OK to close the Legend Entries dialog. The legend updates with the modified names.
Changing the Number of Symbols
The number of symbols in a legend can be set from zero to three. To change the number of symbols:
1. Click on Legend 1 in the Object Manager to select the legend.
2. In the Property Manager, click on the Legend tab to open the legend properties.
3. Click the number 2 next to the Number of symbols option and select 1 from the list. The legend is updated displaying only one symbol.
Changing the Symbol Size
By default, legend entry symbols are the same size as the symbols in the plot. To change the symbol size to a custom value:
1. Click on Legend 1 in the Object Manager to select the legend.
2. In the Property Manager, click on the Legend tab.
3. Click the Edit button next to the Entries option to open the Legend Entries dialog.
4. Select the Site A in the Name column and click the Symbol Size button to open the Symbol Size dialog.
5. Select the Custom option in the Size group.
6. Type 0.25 in. (0.635 cm) in the Custom field.
7. Click OK in the Symbol Size dialog to make the change.
8. Click OK in the Legend Entries dialog.
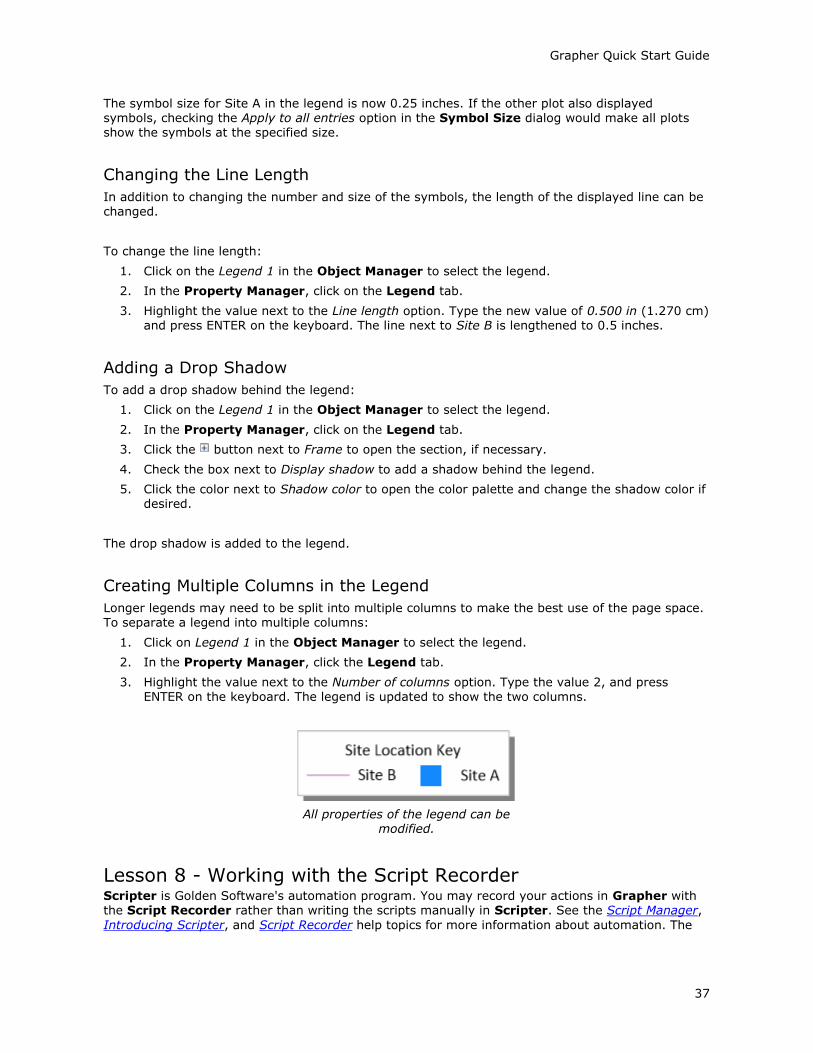
Grapher Quick Start Guide
37
The symbol size for Site A in the legend is now 0.25 inches. If the other plot also displayed symbols, checking the Apply to all entries option in the Symbol Size dialog would make all plots show the symbols at the specified size.
Changing the Line Length
In addition to changing the number and size of the symbols, the length of the displayed line can be changed.
To change the line length:
1. Click on the Legend 1 in the Object Manager to select the legend.
2. In the Property Manager, click on the Legend tab.
3. Highlight the value next to the Line length option. Type the new value of 0.500 in (1.270 cm) and press ENTER on the keyboard. The line next to Site B is lengthened to 0.5 inches.
Adding a Drop Shadow
To add a drop shadow behind the legend:
1. Click on the Legend 1 in the Object Manager to select the legend.
2. In the Property Manager, click on the Legend tab.
3. Click the button next to Frame to open the section, if necessary.
4. Check the box next to Display shadow to add a shadow behind the legend.
5. Click the color next to Shadow color to open the color palette and change the shadow color if desired.
The drop shadow is added to the legend.
Creating Multiple Columns in the Legend
Longer legends may need to be split into multiple columns to make the best use of the page space. To separate a legend into multiple columns:
1. Click on Legend 1 in the Object Manager to select the legend.
2. In the Property Manager, click the Legend tab.
3. Highlight the value next to the Number of columns option. Type the value 2, and press ENTER on the keyboard. The legend is updated to show the two columns.
All properties of the legend can be modified.
Lesson 8 - Working with the Script Recorder Scripter is Golden Software's automation program. You may record your actions in Grapher with the Script Recorder rather than writing the scripts manually in Scripter. See the Script Manager,
Introducing Scripter, and Script Recorder help topics for more information about automation. The
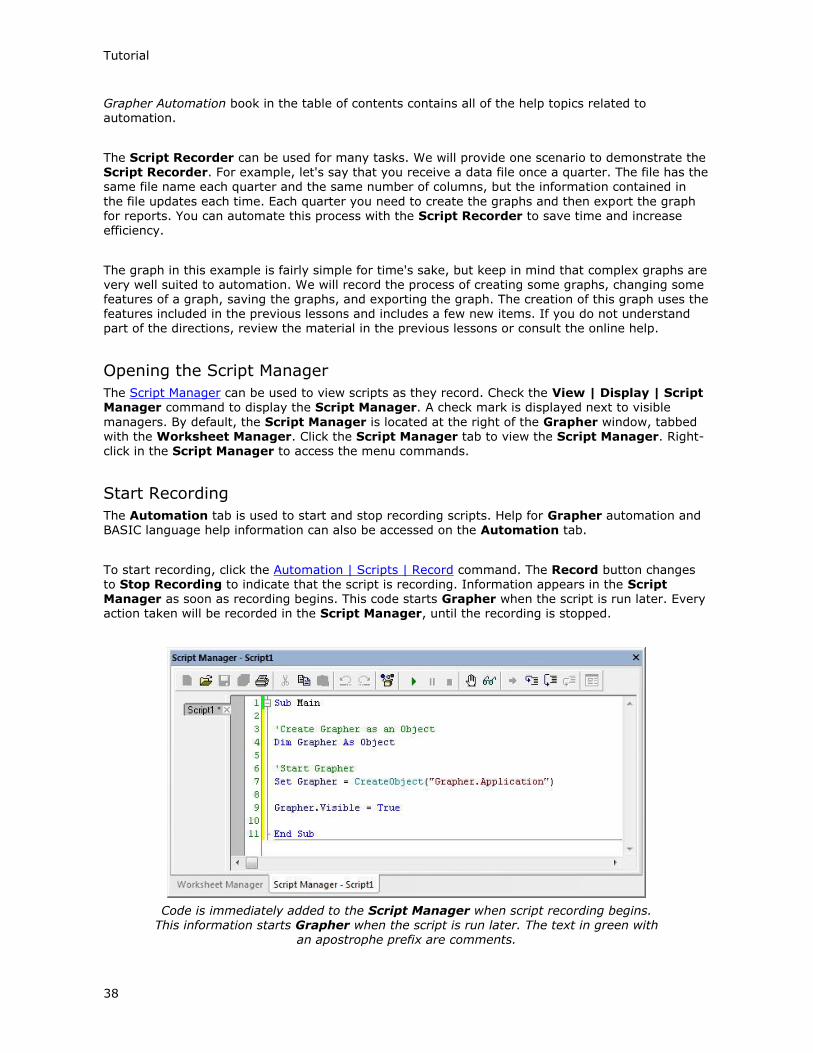
Tutorial
38
Grapher Automation book in the table of contents contains all of the help topics related to automation.
The Script Recorder can be used for many tasks. We will provide one scenario to demonstrate the Script Recorder. For example, let's say that you receive a data file once a quarter. The file has the same file name each quarter and the same number of columns, but the information contained in
the file updates each time. Each quarter you need to create the graphs and then export the graph for reports. You can automate this process with the Script Recorder to save time and increase efficiency.
The graph in this example is fairly simple for time's sake, but keep in mind that complex graphs are very well suited to automation. We will record the process of creating some graphs, changing some features of a graph, saving the graphs, and exporting the graph. The creation of this graph uses the features included in the previous lessons and includes a few new items. If you do not understand part of the directions, review the material in the previous lessons or consult the online help.
Opening the Script Manager
The Script Manager can be used to view scripts as they record. Check the View | Display | Script Manager command to display the Script Manager. A check mark is displayed next to visible
managers. By default, the Script Manager is located at the right of the Grapher window, tabbed with the Worksheet Manager. Click the Script Manager tab to view the Script Manager. Right-click in the Script Manager to access the menu commands.
Start Recording
The Automation tab is used to start and stop recording scripts. Help for Grapher automation and BASIC language help information can also be accessed on the Automation tab.
To start recording, click the Automation | Scripts | Record command. The Record button changes to Stop Recording to indicate that the script is recording. Information appears in the Script Manager as soon as recording begins. This code starts Grapher when the script is run later. Every action taken will be recorded in the Script Manager, until the recording is stopped.
Code is immediately added to the Script Manager when script recording begins. This information starts Grapher when the script is run later. The text in green with
an apostrophe prefix are comments.

Grapher Quick Start Guide
39
Creating a Line Plot
To create a line plot in a new plot window:
1. Click the File | New | Plot command.
2. Click the Home | New Graph | Basic | Line Plot command.
3. The Open Worksheet dialog appears. Browse to Grapher's Samples folder. The location of this folder varies depending on where the software was installed. If the software was installed in the default folder, the path is C:\Program Files\Golden Software\Grapher 13\Samples.
4. Select the tutorial script recorder.xls file.
5. Click Open to create the default graph and line plot.
A line plot is created with the first two available columns using the default properties. Grapher can
create graphs from data containing date/time information. In this example, column A contains dates, so dates are plotted on the X axis.
The original graph is created with the default properties.
Changing the X Axis Date/Time Limits
The axis limits can use the default limits or can be changed to show only a portion of the graph. Limits can be based on numerical values or on date/time values. To change the X Axis limits using date/time values:
1. Click X Axis 1 in the Object Manager to select it.
2. In the Property Manager, click on the Axis tab to display the axis properties.
3. Click the to the left of the Limits section to expand the axis limits.
4. Click the next to the 12/18/2008 0:00:00 value next to Minimum date/time to open the
Select Date/Time dialog.
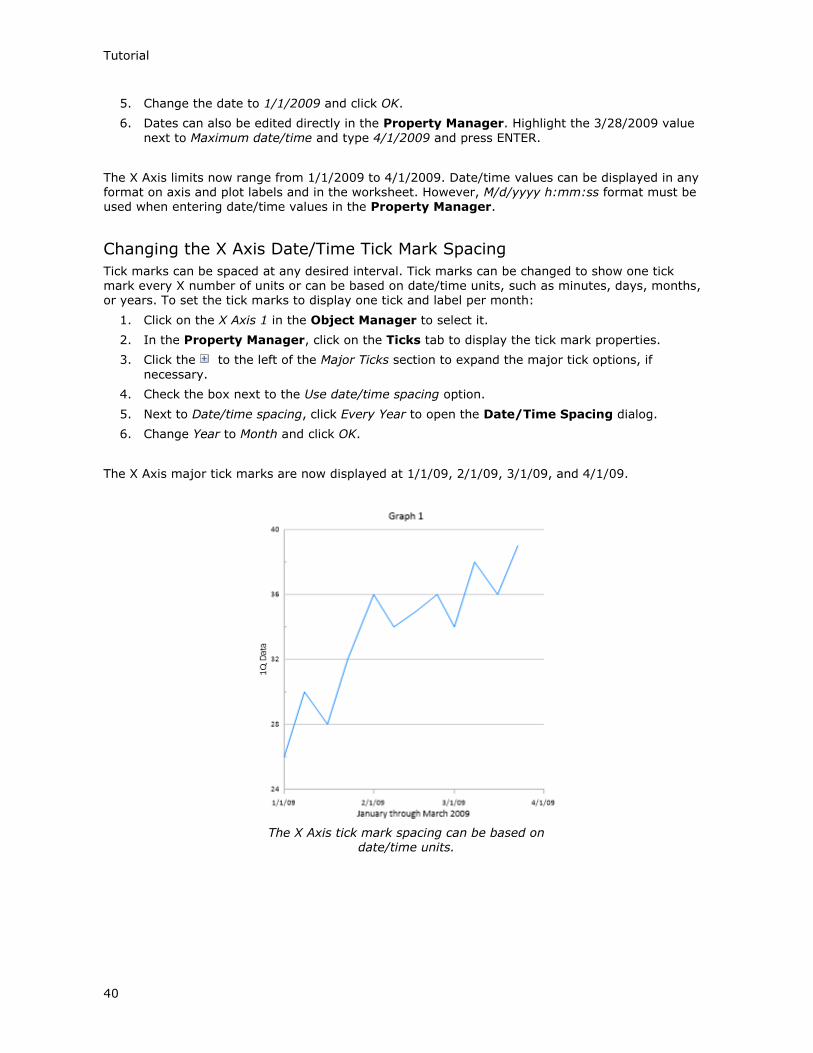
Tutorial
40
5. Change the date to 1/1/2009 and click OK.
6. Dates can also be edited directly in the Property Manager. Highlight the 3/28/2009 value
next to Maximum date/time and type 4/1/2009 and press ENTER.
The X Axis limits now range from 1/1/2009 to 4/1/2009. Date/time values can be displayed in any format on axis and plot labels and in the worksheet. However, M/d/yyyy h:mm:ss format must be used when entering date/time values in the Property Manager.
Changing the X Axis Date/Time Tick Mark Spacing
Tick marks can be spaced at any desired interval. Tick marks can be changed to show one tick mark every X number of units or can be based on date/time units, such as minutes, days, months, or years. To set the tick marks to display one tick and label per month:
1. Click on the X Axis 1 in the Object Manager to select it.
2. In the Property Manager, click on the Ticks tab to display the tick mark properties.
3. Click the to the left of the Major Ticks section to expand the major tick options, if
necessary.
4. Check the box next to the Use date/time spacing option.
5. Next to Date/time spacing, click Every Year to open the Date/Time Spacing dialog.
6. Change Year to Month and click OK.
The X Axis major tick marks are now displayed at 1/1/09, 2/1/09, 3/1/09, and 4/1/09.
The X Axis tick mark spacing can be based on date/time units.

Grapher Quick Start Guide
41
Changing the X Axis Date/Time Tick Label Format
There are a variety of tick label formatting options available. One of the options is to change the display of the date/time labels. There are many different predefined date/time labels available or you can create your own custom label format. To change the major label format from M/d/yy (1/1/2009) to MMM-yy (Jan-09):
1. Click on the X Axis 1 in the Object Manager to select it.
2. In the Property Manager, click on the Labels tab to display the tick label properties.
3. Click the to the left of the General section to expand the major label options, if necessary.
4. Click the Select button next to Major label date/time format to open the Date/Time Format Builder dialog.
5. Type MMM-yy in the Date/Time format (edit to change) field.
6. Click OK.
The X Axis tick labels are displayed in the MMM-yy format. The month abbreviations are
determined by your PC's default language setting. You can force a specific language for date/time labels by adding a language identifier before the date/time format.
Adding Linked Text to the Graph
Title
Titles can be used to indicate the information
contained in graphs. In this file, cell A1 contains the data's time range, January through March 2009. The next quarter's data file will contain April through June 2009. With linked text, the
information is updated on the graph any time the information changes in the cell in the data file. When the script is run, the date in the data
file appears on the graphs.
To add linked text information to the graph title:
1. Select Graph 1 in the Object Manager.
2. Click the Title tab in the Property Manager to open the graph title properties.
3. Next to Text, click the button to open the Text Editor.
4. Delete the Graph 1 text in the Text Editor.
5. Click the button to select the worksheet that contains the text.
6. In the Open Worksheet dialog, select the tutorial script recorder.xls file from the Open
worksheets section and click Open. The worksheet name is updated in the Text Editor.
7. Click the button in the Text Editor. Type A1 into the Enter Cell dialog and
click OK. <<@A1>> appears in the Text Editor.
8. Highlight all of the text in the Text Editor. Change the size of the text to 24 by typing 24 in
the size box or clicking the next to the size box to change the size to 24. The font size box is located to the right of the font name.
9. Change any other properties, such as text color, if desired.
10. Click OK in the Text Editor to close the dialog and apply the changes.
The X Axis date/time labels can be formatted with a predefined or custom format.

Tutorial
42
Although we could add many more features to the graph, we will stop here. Feel free to experiment
with adding or editing features and observing the script in the Script Manager.
Add the graph title with inserted text.
Exporting the Graph
Since the graphs are used to create a report, each graph must be exported for use in another
program.
To export the graph:
1. Click the File | Export command or the button on the quick access toolbar.
2. Select a save location, such as your My Documents folder, in the Export dialog.
3. Type tutorial script recorder into the File name field in the Export dialog.
4. Select PDF (Vector) (*.pdf) from the Save as type list.
5. Check the Show options dialog option if it is not already selected. Selecting this option enables you to make any changes to the export options.
6. Clear the Use graph coordinates for export (when applicable) box. The Use graph coordinates
for export (when applicable) exports the graph using graph coordinates. For reports and images, it is best to have this option unchecked.
7. Clear the Selected options only box. The Selected options only option only exports the items that are currently selected in the graph window.
8. Click the Save button.
9. In the Export Options dialog, click on the Vector PDF Options tab.
10. Click the Defaults button to return the export options to their default values.
11. Select the Embed fonts (when available) option to ensure the output PDF uses the same font as the graph.
12. Click OK and the PDF file is created.

Grapher Quick Start Guide
43
Stopping and Saving the Script
Now that the graph has been created, it is time to stop recording and save the script. To stop and save the script:
1. Click the Automation | Scripts | Stop Recording command. The Save As dialog appears.
2. Select a save location, such as your My Documents folder, in the Save As dialog.
3. Type tutorial script recorder into the File name box.
4. Click the Save button.
5. Right-click in the Script Manager and select File | Close to close the script in the Script
Manager.
The recording is stopped and the tutorial script recorder.bas is saved for future use. Congratulations, you have completed the Grapher tutorial!
Printing the Online Help The online help topics may be printed. You can print a single topic, a section of the Table of Contents, or all topics in the Table of Contents.
To print one help topic, click the topic you wish to print and click the Print button. If the Contents page is open in the help navigation pane, the Print Topics dialog appears. Select Print the selected topic and click OK.
To print one help book, click the Contents tab in the help window navigation pane. Click the book you want to print, for example click the Tutorial book. Click the Print button, and the Print Topics
dialog appears. Select Print the selected heading and all subtopics and click OK.
To print all the topics in the help file Table of Contents, select the top-level book in the Contents navigation pane, Grapher 13. Click the Print button, and the Print Topics dialog appears. Select Print the selected heading and all subtopics and click OK. WARNING: Printing the entire help file takes hundreds of letter-sized sheets of paper and is very time consuming. There is no Table of Contents or Index printed with the file.
You can purchase the PDF Grapher User's Guide that includes all of the documentation for the program. The PDF user's guide is the online help rearranged in a book format and can be printed by the user, if desired. The Grapher User's Guide includes a Table of Contents and Index. The guide
can be purchased at www.goldensoftware.com.

Getting Help
44
Getting Help You can obtain help in Grapher in several ways. Within Grapher, the online help file is opened by clicking the Home | Help | Contents command, the Home | Help | Tutorial command, the
Automation | Help | Grapher Automation Help command, or the button in the upper right corner of the program. You can also quickly search the help by typing a term in the command and help search above the ribbon and clicking Search help file in the results list. Alternatively, press F1
at anytime to open the help file.
There are several Internet help resources.
Click the Forums or Knowledge Base buttons in online help to research a question or to post
a question.
Click the File | Feedback commands to send a problem report, suggestion, or information
request by email.
Click the File | Online commands to update your copy of Grapher and for links to the
Golden Software Home Page, Frequently Asked Questions, Knowledge Base, and Forums.
The Golden Software website has a variety of resources including training videos, a support
forum, a blog, a user image gallery, and a variety of links and downloads.
The Grapher web help can be viewed in a browser window by navigating to
grapherhelp.goldensoftware.com.
Technical Support Golden Software’s technical support is free to registered users of our products. Our technical support staff is trained to help you find answers to your questions quickly and accurately. We are happy to answer any of your questions about any of our products, both before and after your purchase. We also welcome suggestions for improvements to our software and encourage you to
contact us with any ideas you may have for adding new features and capabilities to our programs.
Technical support is available Monday through Friday 8:00 AM to 5:00 PM Mountain Time, excluding major United States holidays. We will respond to email and fax technical questions within one business day. When contacting us with your question, please have the following information available:
Your Grapher product key, found in the File | License Info dialog or in the email received
with the download directions
Your Grapher version number, found in File | About Grapher
The operating system you are using (7, 8, 10 or higher)
The steps you took prior to experiencing your problem
The exact wording of the first error message (if any) that appeared
If you cannot find the answer to your question in the online help, the frequently asked questions,
the knowledge base, or the support forums, please do not hesitate to contact us:
Email: [email protected]
Web: www.GoldenSoftware.com
Phone: 303-279-1021
Fax: 303-279-0909
Mail: Golden Software, LLC, 809 14th Street, Golden, Colorado, 80401-1866, USA
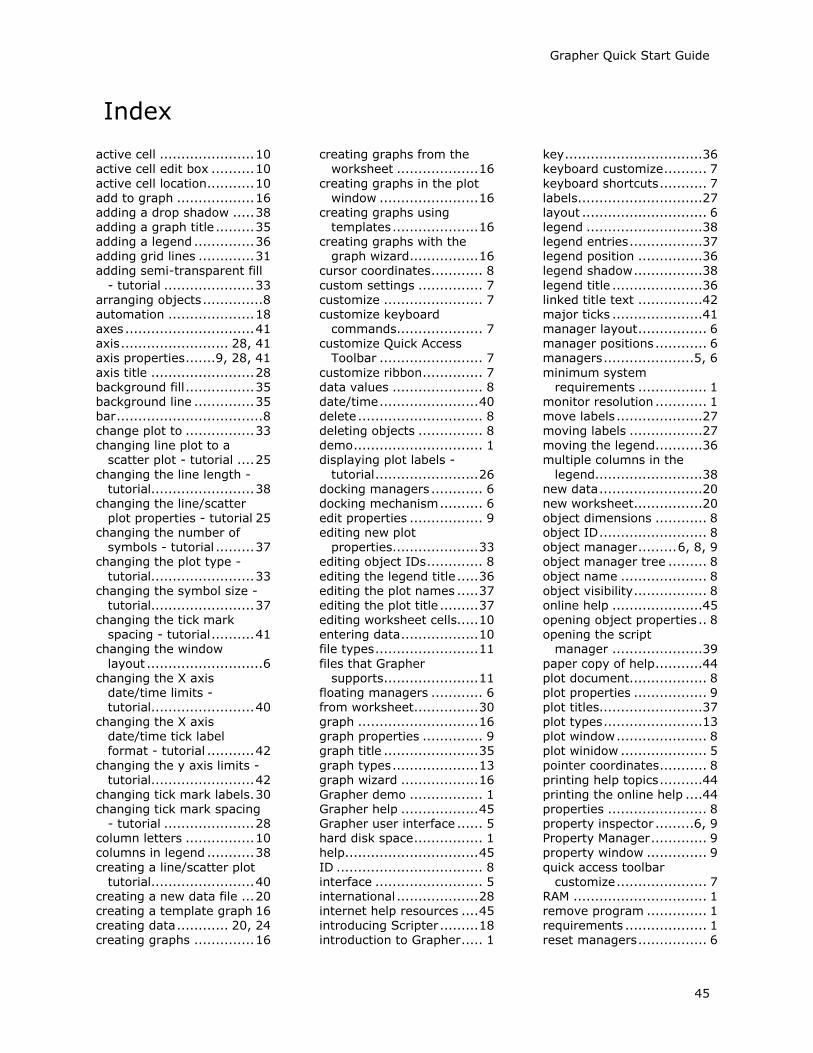
Grapher Quick Start Guide
45
Index
active cell ...................... 10 active cell edit box .......... 10
active cell location ........... 10 add to graph .................. 16 adding a drop shadow ..... 38 adding a graph title ......... 35 adding a legend .............. 36 adding grid lines ............. 31 adding semi-transparent fill
- tutorial ..................... 33 arranging objects .............. 8 automation .................... 18 axes .............................. 41
axis ......................... 28, 41 axis properties .......9, 28, 41
axis title ........................ 28 background fill ................ 35 background line .............. 35 bar .................................. 8 change plot to ................ 33 changing line plot to a
scatter plot - tutorial .... 25
changing the line length - tutorial........................ 38
changing the line/scatter plot properties - tutorial 25
changing the number of symbols - tutorial ......... 37
changing the plot type -
tutorial........................ 33 changing the symbol size -
tutorial........................ 37 changing the tick mark
spacing - tutorial .......... 41 changing the window
layout ........................... 6 changing the X axis
date/time limits - tutorial........................ 40
changing the X axis date/time tick label format - tutorial ........... 42
changing the y axis limits - tutorial........................ 42
changing tick mark labels . 30 changing tick mark spacing
- tutorial ..................... 28 column letters ................ 10 columns in legend ........... 38
creating a line/scatter plot tutorial........................ 40
creating a new data file ... 20 creating a template graph 16 creating data ............ 20, 24 creating graphs .............. 16
creating graphs from the worksheet ................... 16
creating graphs in the plot window ....................... 16
creating graphs using templates .................... 16
creating graphs with the graph wizard................ 16
cursor coordinates ............ 8
custom settings ............... 7 customize ....................... 7 customize keyboard
commands.................... 7
customize Quick Access Toolbar ........................ 7
customize ribbon .............. 7 data values ..................... 8 date/time ....................... 40 delete ............................. 8 deleting objects ............... 8 demo .............................. 1 displaying plot labels -
tutorial ........................ 26 docking managers ............ 6 docking mechanism .......... 6 edit properties ................. 9 editing new plot
properties.................... 33 editing object IDs ............. 8
editing the legend title ..... 36 editing the plot names ..... 37 editing the plot title ......... 37 editing worksheet cells..... 10 entering data .................. 10 file types ........................ 11
files that Grapher supports ...................... 11
floating managers ............ 6 from worksheet............... 30 graph ............................ 16 graph properties .............. 9 graph title ...................... 35
graph types .................... 13 graph wizard .................. 16
Grapher demo ................. 1 Grapher help .................. 45 Grapher user interface ...... 5 hard disk space ................ 1 help ............................... 45
ID .................................. 8 interface ......................... 5 international ................... 28 internet help resources .... 45 introducing Scripter ......... 18 introduction to Grapher ..... 1
key ................................36 keyboard customize .......... 7
keyboard shortcuts ........... 7 labels .............................27 layout ............................. 6 legend ...........................38 legend entries .................37 legend position ...............36 legend shadow ................38
legend title .....................36 linked title text ...............42 major ticks .....................41 manager layout ................ 6
manager positions ............ 6 managers .....................5, 6
minimum system requirements ................ 1
monitor resolution ............ 1 move labels ....................27 moving labels .................27 moving the legend ...........36 multiple columns in the
legend.........................38 new data ........................20 new worksheet................20 object dimensions ............ 8 object ID ......................... 8 object manager ......... 6, 8, 9 object manager tree ......... 8
object name .................... 8 object visibility ................. 8 online help .....................45 opening object properties .. 8 opening the script
manager .....................39
paper copy of help ...........44 plot document.................. 8 plot properties ................. 9 plot titles........................37 plot types .......................13 plot window ..................... 8 plot winidow .................... 5
pointer coordinates ........... 8 printing help topics ..........44
printing the online help ....44 properties ....................... 8 property inspector .........6, 9 Property Manager ............. 9 property window .............. 9
quick access toolbar customize ..................... 7
RAM ............................... 1 remove program .............. 1 requirements ................... 1 reset managers ................ 6
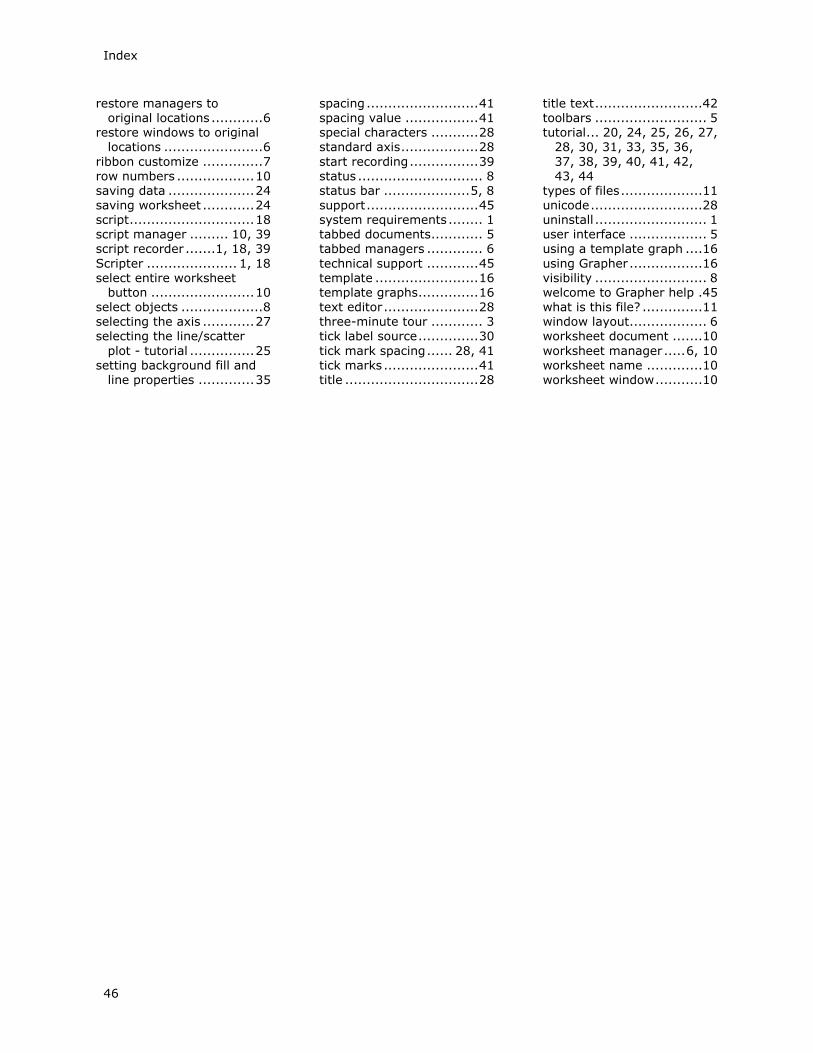
Index
46
restore managers to original locations ............ 6
restore windows to original locations ....................... 6
ribbon customize .............. 7 row numbers .................. 10 saving data .................... 24 saving worksheet ............ 24 script ............................. 18 script manager ......... 10, 39 script recorder .......1, 18, 39
Scripter ..................... 1, 18 select entire worksheet
button ........................ 10 select objects ................... 8 selecting the axis ............ 27
selecting the line/scatter
plot - tutorial ............... 25 setting background fill and
line properties ............. 35
spacing .......................... 41 spacing value ................. 41 special characters ........... 28 standard axis .................. 28
start recording ................ 39 status ............................. 8 status bar .................... 5, 8 support .......................... 45 system requirements ........ 1 tabbed documents ............ 5 tabbed managers ............. 6
technical support ............ 45 template ........................ 16 template graphs .............. 16 text editor ...................... 28 three-minute tour ............ 3
tick label source .............. 30
tick mark spacing ...... 28, 41 tick marks ...................... 41 title ............................... 28
title text .........................42 toolbars .......................... 5 tutorial ... 20, 24, 25, 26, 27,
28, 30, 31, 33, 35, 36,
37, 38, 39, 40, 41, 42, 43, 44
types of files ...................11 unicode ..........................28 uninstall .......................... 1 user interface .................. 5 using a template graph ....16
using Grapher .................16 visibility .......................... 8 welcome to Grapher help .45 what is this file? ..............11 window layout.................. 6
worksheet document .......10
worksheet manager ..... 6, 10 worksheet name .............10 worksheet window ...........10

Customer Service Resources
Before calling, please check the following available resources as your question may already be answered.
Business HoursTechnical Support:
Monday through Friday, 8:00 AM - 5:00 PM, Mountain Time
Product Sales: Online orders available 24 hours, 7 days a week
Golden Software Contact Informationwww.GoldenSoftware.comGrapherSupport@GoldenSoftware.comphone: 303-279-1021fax: 303-279-0909
Registration: Register online at www.goldensoftware.com or fax to the number below.
Knowledge Base: www.GoldenSoftware.com/knowledge-base or in the Grapher program using the File | Online | Knowledge Base command.
Forums: www.goldensoftware.com/forum or in the Grapher program using the File | Online | Forums command.
Frequently Asked Questions: In the Grapher program using the File | Online | Frequently Asked Questions command
Tutorial: Complete the tutorial section in this quick start guide or in the Grapher program using the Home | Help | Tutorial command
Online Help: In the Grapher program using the Home | Help | Contents command
Support Videos: www.GoldenSoftware.com/products/grapher#training-videos for Grapher specific training videos and webinars
Golden Software, LLC 809 14th Street Golden, Colorado 80401 USA
Phone + 1 303 279 1021 Fax + 1 303 279 0909
www.goldensoftware.com