Interpretation of aeromagnetic data over the Bida Basin ... · (i) Golden software grapher 8.0 used...
14
Available online at www.pelagiaresearchlibrary.com Pelagia Research Library Advances in Applied Science Research, 2015, 6(3): 50-63 ISSN: 0976-8610 CODEN (USA): AASRFC 50 Pelagia Research Library Interpretation of aeromagnetic data over the Bida Basin, North Central, Nigeria Obi D. A. 1 , Ilozobhie A. J. 2 and Abua J. U. 1 1 Department of Geology, University of Calabar, Nigeria 2 Department of Physics, University of Calabar, Nigeria _____________________________________________________________________________________________ ABSTRACT The Bida basin in the North central Nigeria is studied using two (2) aeromagnetic sheet with a scale of 1:100,000 (sheet 184 and 185). The data was acquired at the Nigeria Geological survey Agency and subjected to manual digitization of fifty four (54) lines from where a total of 2398 data points were obtained. The data was then subjected to both manual and computer processed analysis which involved map merging polynomial filtering lineament analysis and depth to magnetic source estimations. The results from manual lineament trend reveals a major NW–SE dominant trend and a minor NE – SW trend, this agree with regional trend of NW – SE from computer processed analysis. The merged total intensity field map and the residual also revealed loose contour S at Bida areas typical of sedimentary basins and tightly packed contourS at Paiko representing areas from basement. The depth to magnetic sources reveals two depocenters (Kataeregi and Datoraki) with depth 4.4km and 4.8km within the Bida area, Other areas within the paiko (Lapai 0.6km, Nagadi 9.8km, and paiko 0.8km) has shallow depth sources typical of basement areas which are unsuitable for further hydrocarbon exploration. The Bida areas with sediment thickness reaching depth 4.8km are good targets for further hydrocarbon exploration activities. Keywords: aeromagnetics, digitization, filtering, depocenters, sedimentary _____________________________________________________________________________________________ INTRODUCTION The Bida basin is often referred to as the mid – Niger basin or the Nupe basin, it is delimited in the NE and SW by the basement complex and merges with the Anambra and Sokoto basin to the SE and NW respectively [1]. The study area is located between latitude 9 0 .00 to 9 o .30 N and longitude 6 0. 00 and 7 0. 00 E. The Bida basin has not been extensively studied using deep subsurface geophysical tools when compared to studies made from the adjourning Anambra basin and the Sokoto basins, this research intends to add value to the scare literature of the geophysical study of the Bida basin. However, earlier studies in the upper Benue trough reveals the existence of a deep seated central positive anomaly flanked by negative anomalies typical of rift structures [4], [10]. Also, average sediment thickeness from previous gravity and magnetic studies in adjourning Afikpo basin, Anambra basin, and upper Benue trough reveals that the average sediment thickness within these area is 3.50 km, [3],[4],[14],[17],[19]. The present study shall determine the depth to magnetic sources vis-à-vis sediments thickness of the Bida basin and the structural trend of the lineaments in the area. GEOLOGICAL SETTINGS The Bida basin is a gentle down-warped trough with it’s origin closely connected to Santonian orogenic movement in the south east Nigeria and the Benue Trough.[7],[8].The origin of the basin is connected to sinistral offset along
Transcript of Interpretation of aeromagnetic data over the Bida Basin ... · (i) Golden software grapher 8.0 used...
Available online at www.pelagiaresearchlibrary.com
Pelagia Research Library
Advances in Applied Science Research, 2015, 6(3): 50-63
ISSN: 0976-8610 CODEN (USA): AASRFC
50 Pelagia Research Library
Interpretation of aeromagnetic data over the Bida Basin, North Central, Nigeria
Obi D. A.1, Ilozobhie A. J.2 and Abua J. U.1
1Department of Geology, University of Calabar, Nigeria 2Department of Physics, University of Calabar, Nigeria
_____________________________________________________________________________________________
ABSTRACT The Bida basin in the North central Nigeria is studied using two (2) aeromagnetic sheet with a scale of 1:100,000 (sheet 184 and 185). The data was acquired at the Nigeria Geological survey Agency and subjected to manual digitization of fifty four (54) lines from where a total of 2398 data points were obtained. The data was then subjected to both manual and computer processed analysis which involved map merging polynomial filtering lineament analysis and depth to magnetic source estimations. The results from manual lineament trend reveals a major NW–SE dominant trend and a minor NE – SW trend, this agree with regional trend of NW – SE from computer processed analysis. The merged total intensity field map and the residual also revealed loose contour S at Bida areas typical of sedimentary basins and tightly packed contourS at Paiko representing areas from basement. The depth to magnetic sources reveals two depocenters (Kataeregi and Datoraki) with depth 4.4km and 4.8km within the Bida area, Other areas within the paiko (Lapai 0.6km, Nagadi 9.8km, and paiko 0.8km) has shallow depth sources typical of basement areas which are unsuitable for further hydrocarbon exploration. The Bida areas with sediment thickness reaching depth 4.8km are good targets for further hydrocarbon exploration activities. Keywords: aeromagnetics, digitization, filtering, depocenters, sedimentary _____________________________________________________________________________________________
INTRODUCTION
The Bida basin is often referred to as the mid – Niger basin or the Nupe basin, it is delimited in the NE and SW by the basement complex and merges with the Anambra and Sokoto basin to the SE and NW respectively [1]. The study area is located between latitude 90.00 to 9o.30 N and longitude 60.00 and 70.00 E. The Bida basin has not been extensively studied using deep subsurface geophysical tools when compared to studies made from the adjourning Anambra basin and the Sokoto basins, this research intends to add value to the scare literature of the geophysical study of the Bida basin. However, earlier studies in the upper Benue trough reveals the existence of a deep seated central positive anomaly flanked by negative anomalies typical of rift structures [4], [10]. Also, average sediment thickeness from previous gravity and magnetic studies in adjourning Afikpo basin, Anambra basin, and upper Benue trough reveals that the average sediment thickness within these area is 3.50 km, [3],[4],[14],[17],[19]. The present study shall determine the depth to magnetic sources vis-à-vis sediments thickness of the Bida basin and the structural trend of the lineaments in the area. GEOLOGICAL SETTINGS The Bida basin is a gentle down-warped trough with it’s origin closely connected to Santonian orogenic movement in the south east Nigeria and the Benue Trough.[7],[8].The origin of the basin is connected to sinistral offset along
Obi D. A. et al Adv. Appl. Sci. Res., 2015, 6(3):50-63 _____________________________________________________________________________
51 Pelagia Research Library
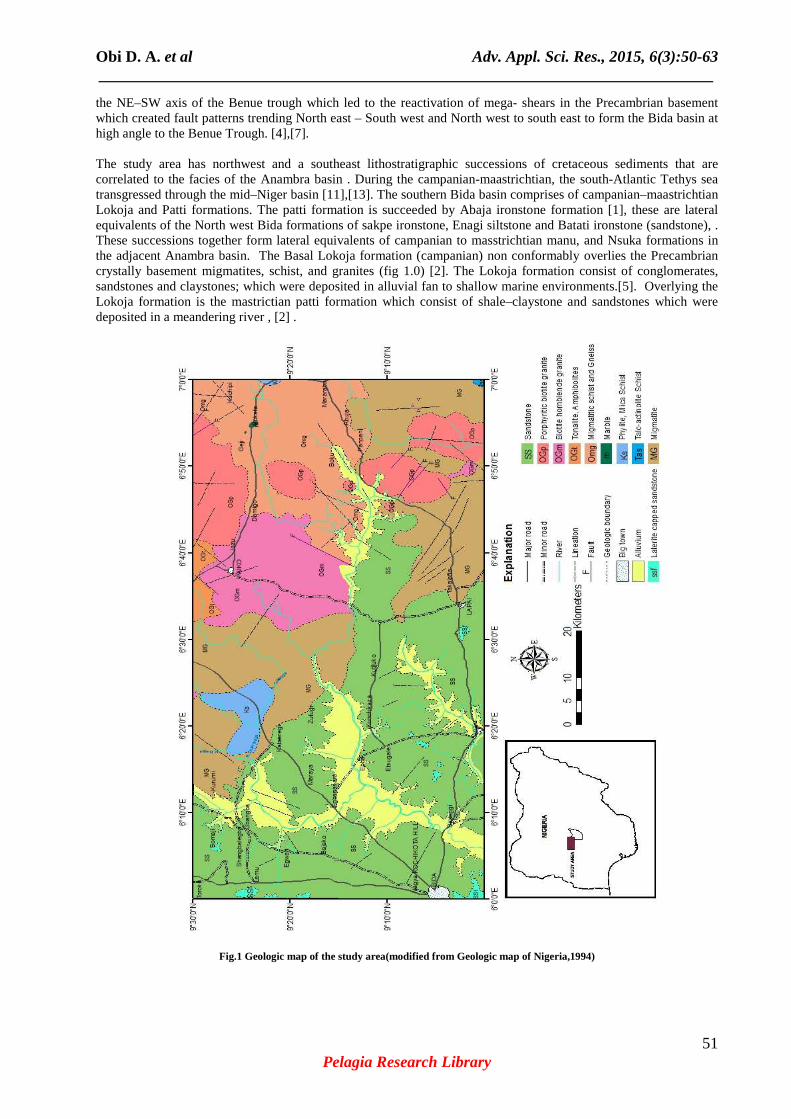
the NE–SW axis of the Benue trough which led to the reactivation of mega- shears in the Precambrian basement which created fault patterns trending North east – South west and North west to south east to form the Bida basin at high angle to the Benue Trough. [4],[7]. The study area has northwest and a southeast lithostratigraphic successions of cretaceous sediments that are correlated to the facies of the Anambra basin . During the campanian-maastrichtian, the south-Atlantic Tethys sea transgressed through the mid–Niger basin [11],[13]. The southern Bida basin comprises of campanian–maastrichtian Lokoja and Patti formations. The patti formation is succeeded by Abaja ironstone formation [1], these are lateral equivalents of the North west Bida formations of sakpe ironstone, Enagi siltstone and Batati ironstone (sandstone), . These successions together form lateral equivalents of campanian to masstrichtian manu, and Nsuka formations in the adjacent Anambra basin. The Basal Lokoja formation (campanian) non conformably overlies the Precambrian crystally basement migmatites, schist, and granites (fig 1.0) [2]. The Lokoja formation consist of conglomerates, sandstones and claystones; which were deposited in alluvial fan to shallow marine environments.[5]. Overlying the Lokoja formation is the mastrictian patti formation which consist of shale–claystone and sandstones which were deposited in a meandering river , [2] .
Fig.1 Geologic map of the study area(modified from Geologic map of Nigeria,1994)

Obi D. A. et al Adv. Appl. Sci. Res., 2015, 6(3):50-63 _____________________________________________________________________________
52 Pelagia Research Library
MATERIALS AND METHODS
The materials used for this study include, two (2) sheet of Aeromagnetic maps (sheets 184 and 185) and a geologic maps of Nigeria, both obtained from the Nigerian Geological survey Agency (NGSA) Kaduna. A mathematical set, a calculator, a drawing board, T- square, pencils tracing papers, erasers, marking tapes, the protractor in the mathematical set is used for angular measurements of lineaments orientation, while other items mentioned above where used for digitization of x, y and z values. Many software applications were used these include: United states geological services (U.S.G.S) potential field software version 2.2 used for processing and interpretation of aeromagnetic maps. (i) Golden software grapher 8.0 used for depth estimate plots and lineament orientation Rosettes. (ii) Golden software surfer 8.0 used in plotting depth to source of magnetic anomaly map. Method of Study The method used in this study are both manual and computer processed. The manual method include digitization, lineament trend analysis, petters half slope and maximum slope methods. Digitization involves the extraction of discrete points along flight lines on aeromagnetic total intensity field map at 1.0 cm intervals, where values of longitude, latitude and total field values are documented as x y and z. This method is adapted to suite the USGS processing software subroutine programmes. Lineament analysis involves a desk table analysis where measurements of orientations of anomaly trends are made, an overlay of transparent paper is placed on the aeromagnetic map and all the anomalies traced and labeled, their width’s, lengths, and orientations are measured. Computation of frequencies of occurrence and percentage frequencies of angular measurement are determined. The above procedure produces lineament maps and Rosette diagrams. Also, manual depth estimate using Petter’s half slope and maximum slope methods, are used,[18]. Depth estimates using Petter’s half slope involves the manual extraction of values of total field (z) and their corresponding distance (m) along a profile line often choosen to cut across prominent anomalies. In this study 10 profile lines will be choosen in each map. The Petter half slope method involves choosing a point that in half the maximum anomaly and it’s corresponding distance taken as the depth to the magnetic anomaly. The Petters maximum slope method utilizes the maximum point of deviation from an anomaly curve, the inflection points of deviations are traced to their corresponding distances, which are regarded as depth to source of anomalies.[9], [12], [18]. The computer processed method include map merging, regional and residual filtering using polynomial regression software “ SURFIT” map merging involves using the digitized x, y, z, data, since the flight elevation was same in both maps, no continuation was applied. The x y z data from both maps will be typed in word pad and stored as a single file to be used in the following USGS softwares (A2xy2, DETOUR GEOCON, GMERGER, P2GRD, SURFIT and PC CONTOUR, (Phillips 1997. The process involved map merging, residual and regional separation of anomalies and their various maps contoured.
RESULTS AND DISCUSSION
The process of manual digitization was applied to the two sheets along flight lines extracting 2,398 values of longitude X, Latitude Y, and total field z at 1.0cm intervals. This data is stored in a typed file using word pad for further computer processed analysis. Manual analysis involved the numbering of all the anomalies and measurements of their orientations, widths, and lengths (Table 1.0) The overlay showing the lengths of the anomalous trends is shown as lineament trends maps (fig.2a,b). Also, the frequency of occurrence of anomaly orientations was used to plot rosettle diagrams showing major lineaments trends for both Paik and Bida areas. (fig.3a,b,). Computer processes software of A2xy2, was used on the word pad xyz digitized data to convert the data from binary to ascii, this creates a post binary file used in DETOUR, P2GRD, GMERGER and Pc contour software to produce a merged total intensity field aeromagnetic map (fig.4). The produced total field grid file was used in the “SURFIT” software to produce the residual and regional maps of the study area (fig.5,6). The mathematical expressions of the polynomial regression analysis is expressed in [6], [14]. Manual depth was computed using Petters half slope and maximum slope methods on ten (10) profile lines on each sheet of the aeromagnetic maps. The illustration of depth computations using different methods is shown as profile plots (fig7) and results are displayed in a tabular form ( table. 2) .

Obi D. A. et al Adv. Appl. Sci. Res., 2015, 6(3):50-63 _____________________________________________________________________________
53 Pelagia Research Library
The coordinates of the depth points along the profile lines were then digitized, at the computed depth positions to obtain each calculated depth point latitude, longitude and depth value from which the golden software sulfer 9.0 was used to contour the depth to magnetic basement map of the study area (fig.8).
Fig.2a Lineaments Trend map of Bida area
Fig.2b Lineament Trend map of Paiko area

Obi D. A. et al Adv. Appl. Sci. Res., 2015, 6(3):50-63 _____________________________________________________________________________
54 Pelagia Research Library
TABLE ia: Frequency distribution of lineaments in the Bida sheet
Orientation(⁰) Frequency Length (km) Normal length (L/LT) % of normal length (L/LTx100/1) 1 - 10/ 180 - 190 - - - - 11 - 20/191 - 200 - - - - 21 - 30/201 - 210 - - - - 31 - 40/211 - 220 - - - - 41 - 50/221 -230 3 15.6 0.052 5.28 51 - 60/231 - 240 1 5.7 0.0193 1.93 61 - 70/241 - 250 3 19.8 0.0670 6.7 71 – 80/251 - 260 12 66.9 0.2266 22.66 81 - 90/261 - 270 7 42.4 0.1436 14.36
91 – 100/271 - 280 10 51.0 0.1727 17.27 101 – 110/ 281 - 290 12 54.2 0.1836 18.36 111 – 120/ 291 - 300 3 8.3 0.0281 2.81 121 – 130/301 - 310 1 4.8 0.0162 1.62 131 – 140/311 - 320 1 15.5 0.525 5.25 141 - 150/321 - 330 1 5.5 0.0186 1.86 151 – 160/331 - 340 2 5.5 0.0186 1.86 161 – 170/341 - 350 - - - - 171 – 180/351 - 360 - - - -
Total 295.2 99.96
Table ib: Table Showing Frequency Distribution of Lineament in Paiko Sheet
Orientation(⁰) Frequency Length, L (km) Normal length (L/Lt) % Of Normal Length (L/LTx100/1)
1-10/180 - 190 - - - - 11 – 20/191 - 200 - - - - 21 – 30/201 - 210 - - - - 31 - 40/211 - 220 1 8.1 0.0587 5.87 41 – 50/221 - 230 - - - - 51 – 60/231 - 240 1 4.5 0.0326 3.26 61 – 70/24 - 250 6 35.5 0.2574 25.74 71 - 80/251 - 260 3 5.9 0.0427 4.27 81 - 90/261 - 270 6 22.8 0.1653 16.53
91 – 100/271 - 280 6 35.5 0.2574 25.74 101 - 110/281 - 290 5 15.6 0.1131 11.31 111 - 120/291 - 300 2 7.0 0.0507 5.07 121 – 130/301 - 310 - - - - 131 – 140/311 - 320 1 3.0 0.0217 2.17 141 - 150/321 - 330 - - - - 151 - 160/331 - 340 - - - - 161 – 170/341 - 350 - - - -
171/180/351-360 - - - - Total 137.9 99.96

Obi D. A. et al Adv. Appl. Sci. Res., 2015, 6(3):50-63 _____________________________________________________________________________
55 Pelagia Research Library

Obi D. A. et al Adv. Appl. Sci. Res., 2015, 6(3):50-63 _____________________________________________________________________________
56 Pelagia Research Library

Obi D. A. et al Adv. Appl. Sci. Res., 2015, 6(3):50-63 _____________________________________________________________________________
57 Pelagia Research Library
Fig.4 Total Magnetic field intensity map of the study area (contoured at 50nT)

Obi D. A. et al Adv. Appl. Sci. Res., 2015, 6(3):50-63 _____________________________________________________________________________
58 Pelagia Research Library
Fig.5 Residual Magnetic field intensity of the study area (contoured at 50nT)

Obi D. A. et al Adv. Appl. Sci. Res., 2015, 6(3):50-63 _____________________________________________________________________________
59 Pelagia Research Library
Fig.6 Regional Magnetic Field Intensity map of the study area (contoured at 10nT)

Obi D. A. et al Adv. Appl. Sci. Res., 2015, 6(3):50-63 _____________________________________________________________________________
60 Pelagia Research Library
0 5 10 15 20 25 30 35 40 45 50 55Distance (Km)
7600
7700
7800
7900
8000
Tot
alM
agne
ticIn
tens
ity
(nT
)
Maximum Slope
Half Slope
Scale:x: 1cm = 5kmy: 2cm = 100km
Bida Profile L-11
Fig. 7a Illustrative plots of petterS maximum slope and half- width depth extimation methods along profile line 11 Bida sheet

Obi D. A. et al Adv. Appl. Sci. Res., 2015, 6(3):50-63 _____________________________________________________________________________
61 Pelagia Research Library
0 5 10 15 20 25 30 35 40 45 50 55
Distance (Km)
7550
7600
7650
7700
7750
7800
7850
7900
7950
Tota
lMag
net
icIn
ten
sity
(nT
)Bida Profile L-15
Maximum Slope
Half Slope
Scale:x: 1cm = 5kmy: 1cm = 50km
Fig.7 b Illustrative plots of petterS maximum slope and half- width depth extimation methods along profile line 15 paiko sheet

Obi D. A. et al Adv. Appl. Sci. Res., 2015, 6(3):50-63 _____________________________________________________________________________
62 Pelagia Research Library
Table ii: Depth Estimation for the Different Profil es from Bida and Paiko areas
Depth estimation for Bida using Peter’s half slope and maximum slope methods S/n Profile No Maximum Slope(Km) Half Slope (Km) 1 Line 4 3.4, 2.0 1.9, 2.3 2 Line 7 1.9, 4.4 1.5, 4.2 3 Line 11 4.8,4.2, 2.0 1.3,1.8, 1.9 4 Line 15 3.4, 1.3 2.0, 1.5 5 Line 21 1.2, 1.7 1.0, 2.1 6 Line 25 3.6, 2.1 3.9, 1.8
Depth estimation for Paiko using Peter’s half slope and maximum slope methods 1 Line 5 1.0,1.9, 0.9 1.4, 0.3, 1.0 2 Line 8 0.6, 1.6 0.3, 0.7 3 Line 10 0.8, 0.9, 0.5 0.3, 0.3, 0.2 4 Line 12 3.0 2.3 5 Line 15 1.6, 1.8 1.7, 1.0 6 Line 20 0.9, 0.6 0,5, 0.8
Fig.8 Depth to Magnetic Basement Map of the study area (contour intervals 0.2km)
DISCUSSION
The study area has a total magnetic field intensity which range between 7750nT to 7785nT, and a regional field which range between 7810 nT to 7870nT (fig.4). The residual field decreases from (17) positive anomaly values in the south east (Paiko) to 14 negative values in the north west Bida indicating increasing sediments towards the North West (bida) area (fig.5). The lineament trends analysis indicate two dominant trends which reveals a dominant NW-SE and a les pronounced NE–SW trend. However, the lineament analysis unreaveled two faults identified in the area using criteria such as abrupt changes in contour orientation, spacing of contour lines and changes in amplitude amount of total magnetic field intensity, [9],[15],[19]. The first fault stretches from Gbangba to neighbouring Kataeregi while the other lies between Paiko and Nagadi area (fig.5). The depth estimates from the study area reveals two depocenters which are the Kataeregi and Daloraki areas with depths of 3.2 and 4.2 km, these areas are separated by shallow depth areas which range between 0.2 and 1km which include Paiko, Lapai, and Nagadi, Generally the areas with depths considered good for hydrocarbon generation

Obi D. A. et al Adv. Appl. Sci. Res., 2015, 6(3):50-63 _____________________________________________________________________________
63 Pelagia Research Library
include Bida (2.2-2.4km), Datoraki (3.2 4km), et Sugale (2.2-3.2km) and Gbangba (2.2-2.6km). Debegha and Weber (1990), Cordel and Grauch (1985) (fig.8). Other areas with depths to magnetic source less < 2.0km are not favourable for further hydrocarbon exploration [14],[16].
CONCLUSION
Conclusively, aeromagnetic interpretation of the Bida basin has revealed the dominant lineament trends to be in the NW-SE, two major faults within the Gbangha and Paiko areas and a maximum sediment thickness of 4.4km within the Bida (Datoraki) area. Also all depth estimates in the area greater than > 2.0km are favourable depths for potential hydrocarbon deposits provided other geological conditions remains favourable. So its recommended that further geological and geochemical investigations should be done in the study area prior to seismic exploration investigations. Acknowledgement The authors wish to acknowledge the Nigerian Geological Survey Agency Kaduna, who supplied the aeromagnetic maps used in this study.
REFERENCES
[1] Adeleye D. R. Dessauvagie, T. F . J ., African Geol. 1972, pp 181 – 186. [2] Agyingi C., Unpublished Ph.D Thesis, University of Ibadan. 1991 . 501 pp. [3] Adighige C. I. Tectonophysics 1981, 109-128. [4] Ajakaiye D. E . Earth Evolution Science 1981, 110-125. [5] Akande S. O . Ojo, O. J. Ladipo, K., A field guide book Musuro Publisher 2005a, 60 pp. [6] Beltrao F. J. Silva, J. B . C and Costa J. C, Geophysics 1991, PP 80-89. [7] Benkheli .l, J. 1982. Geological Magazine 1982, pp. 115 – 168. [8] Burke K. . and Dewey, J. F., Journal of Geology 1973, pp. 406 -433. [9] Dobrin M. B., and Sarvit C. H,. Introduction to Geophysical prospecting (4th ed) New York 1988 . Mc Graw-Hill Book Company. [10] Fairhead J. D . and Okereke C. S,. Jour of African Earth Sciences 1990, pp. 329 – 355. [11] Ladipo K. O,. Jour of African earth Sciences 1988, PP 865-871. [12] Nur A, . Jour of mining and Geol 2000, pp 77-84. [13] Ladipo K. O., Akande S. O ., and Mucke A . Jour of mining Geol 1994, PP 161-168. [14] Obi D. A. , Unpublished Ph.D Thesis University of Calabar Nigeria 2000. [15] Obi D. A., Okereke, C.S. Egeh, E. U. and Olagundoye, O. O. Jour of mining and Geol. 2008, pp 151-160. [16] Obi D. A., Okereke C. S., Egeh E. U. and Olagundoye O .O., Global Jour of geol sciences. 2008, pp 175 – 183. [17] Ofoegbu C. O., Okereke C.S., Braunsch weig: Friedr Viewing and Sohn ,1989 PP1-18 [18] Okeke F. N., Journal of Physics 1992, PP 103 – 113 [19] Olagundoye O. O Unpublished Ph.D thesis University of Calabar,2004 . [20] Phillips J.D., U.S Geological survey open file report 1997, pp 1-32