Grain Transportation Report · 19/7/2018 · Outlook : Projected Grain Exports Lower, but Wheat...
22
A weekly publication of the Agricultural Marketing Service www.ams.usda.gov/GTR July 19, 2018 Contents Article/ Calendar Grain Transportation Indicators Rail Barge Truck Exports Ocean Brazil Mexico Grain Truck/Ocean Rate Advisory Datasets Specialists Subscription Information -------------- The next release is July 26, 2018 Preferred citation: U.S. Dept. of Agriculture, Agricultural Marketing Service. Grain Transportation Report. July 19, 2018. Web: http://dx.doi.org/10.9752/TS056.07-19-2018 Grain Transportation Report Contact Us WEEKLY HIGHLIGHTS Secretary Perdue to Deliver Keynote Address at the Agricultural Transportation Summit Next Week On July 25, Secretary of Agriculture Sonny Perdue will present the keynote address at the 2018 Agricultural Transportation Summit, “Connecting Growing Supply with Growing Demand,” in Arlington, VA. The Summit—hosted by the National Grain and Feed Association, Soy Transportation Coalition, and USDA—focuses on the importance of inland waterway, rail, truck, and vessel transportation to the competitiveness and profitability of U.S. agriculture. Agricultural stakeholders will hear updates and learn from experts in the transportation industry, academia, USDA, U.S. Army Corps of Engineers, and the Surface Transportation Board on how the transportation system affects agriculture’s competitiveness. The Summit will take place on July 25-26. To register, please visit the official website: https://www.ngfa.org/upcoming-events/transportation-summit/. Wheat Inspections Rebound For the week ending July 12, total inspections of grain (corn, wheat, and soybeans) for export from all major U.S. export regions reached 2.36 million metric tons (mmt); down 3 percent from the previous week, up 15 percent from last year, and 22 percent above the 3-year average. Grain inspections continued to fall due to a 17 percent drop in corn inspections and a 5 percent decrease in inspections of soybeans. Despite the drop in total inspections, wheat inspections jumped 75 percent from the previous week due primarily to increased shipments to Latin America. Pacific Northwest (PNW) inspections decreased 19 percent from the past week, while Mississippi Gulf inspections remained unchanged. Outstanding (unshipped) export sales of grain continued to fall for corn, wheat, and soybeans. Weekly Barge Grain Shipments Decrease Due to the high water conditions and lock and dam repairs, grain barge shipments experienced a notable drop in tonnages for the week ending July 14. Grain barge shipments from the Mississippi River system were 741,950 tons, a 36 percent drop compared to the previous week. The total grain shipments though Mississippi River Locks 27 (near Granite City, IL) and Ohio River Locks 52 (near Brookport, IL), were 612,000 and 94,950 tons, a 33 percent and 53 percent drop, respectively, from the previous week. The barge industry expects further delays in operations with the on-going repair work at Ohio River Locks 52 and the scheduled closure of the main chamber at Melvin Price Locks and Dam (Upper Mississippi River, near E. Alton, IL) for the last half of July. Snapshots by Sector Export Sales For the week ending July 5, unshipped balances of wheat, corn, and soybeans totaled 23.1 mmt, up 17 percent from the same time last year. Net weekly wheat export sales were .136 mmt, down 69 percent from the previous week. Net corn export sales were .402 mmt, down 9 percent from the previous week. Net soybean export sales were .159 mmt, down 66 percent from the previous week. Rail U.S. Class I railroads originated 21,297 grain carloads for the week ending July 7, down 9 percent from the previous week, but up 18 percent from last year, and 11 percent from the 3-year average. Average July shuttle secondary railcar bids/offers, per car, were $431 above tariff for the week ending July 12, up $56 from last week, and $581 higher than last year. There were no non-shuttle bids/offers this week. Barge For the week ending July 14, barge grain movements totaled 741,950 tons, 36 percent lower than the previous week and down 19 percent from the same period last year. For the week ending July 14, 473 grain barges moved down river, 267 barges less than the previous week. There were 776 grain barges unloaded in New Orleans, 9 percent higher than the previous week. Ocean For the week ending July 12, 28 ocean-going grain vessels were loaded in the Gulf, 20 percent less than the same period last year. Forty-eight vessels are expected to be loaded within the next 10 days, 14 percent less than the same period last year. For the week ending July 12, the ocean freight rate for shipping bulk grain, from the Gulf to Japan, was $44.00 per metric ton, 1 percent more than the previous week. The cost of shipping from the PNW to Japan was $24.75 per metric ton, unchanged from the previous week. Fuel For the week ending July 16, the U.S. average diesel fuel price remained unchanged from the previous week at $3.24 per gallon, 75 cents higher than the same week last year.
Transcript of Grain Transportation Report · 19/7/2018 · Outlook : Projected Grain Exports Lower, but Wheat...
A weekly publication of the Agricultural Marketing Service www.ams.usda.gov/GTR
July 19, 2018
Contents
Article/ Calendar
Grain
Transportation Indicators
Rail
Barge
Truck
Exports
Ocean
Brazil
Mexico
Grain Truck/Ocean Rate Advisory
Datasets
Specialists
Subscription Information
--------------
The next release is
July 26, 2018
Preferred citation: U.S. Dept. of Agriculture, Agricultural Marketing Service. Grain Transportation Report. July 19, 2018. Web: http://dx.doi.org/10.9752/TS056.07-19-2018
Grain Transportation Report
Contact Us
WEEKLY HIGHLIGHTS
Secretary Perdue to Deliver Keynote Address at the Agricultural Transportation Summit Next Week On July 25, Secretary of Agriculture Sonny Perdue will present the keynote address at the 2018 Agricultural Transportation Summit,
“Connecting Growing Supply with Growing Demand,” in Arlington, VA. The Summit—hosted by the National Grain and Feed
Association, Soy Transportation Coalition, and USDA—focuses on the importance of inland waterway, rail, truck, and vessel
transportation to the competitiveness and profitability of U.S. agriculture. Agricultural stakeholders will hear updates and learn from
experts in the transportation industry, academia, USDA, U.S. Army Corps of Engineers, and the Surface Transportation Board on how
the transportation system affects agriculture’s competitiveness. The Summit will take place on July 25-26. To register, please visit the
official website: https://www.ngfa.org/upcoming-events/transportation-summit/.
Wheat Inspections Rebound
For the week ending July 12, total inspections of grain (corn, wheat, and soybeans) for export from all major U.S. export regions
reached 2.36 million metric tons (mmt); down 3 percent from the previous week, up 15 percent from last year, and 22 percent above
the 3-year average. Grain inspections continued to fall due to a 17 percent drop in corn inspections and a 5 percent decrease in
inspections of soybeans. Despite the drop in total inspections, wheat inspections jumped 75 percent from the previous week due
primarily to increased shipments to Latin America. Pacific Northwest (PNW) inspections decreased 19 percent from the past week,
while Mississippi Gulf inspections remained unchanged. Outstanding (unshipped) export sales of grain continued to fall for corn,
wheat, and soybeans.
Weekly Barge Grain Shipments Decrease
Due to the high water conditions and lock and dam repairs, grain barge shipments experienced a notable drop in tonnages for the week
ending July 14. Grain barge shipments from the Mississippi River system were 741,950 tons, a 36 percent drop compared to the
previous week. The total grain shipments though Mississippi River Locks 27 (near Granite City, IL) and Ohio River Locks 52 (near
Brookport, IL), were 612,000 and 94,950 tons, a 33 percent and 53 percent drop, respectively, from the previous week. The barge
industry expects further delays in operations with the on-going repair work at Ohio River Locks 52 and the scheduled closure of the
main chamber at Melvin Price Locks and Dam (Upper Mississippi River, near E. Alton, IL) for the last half of July.
Snapshots by Sector
Export Sales
For the week ending July 5, unshipped balances of wheat, corn, and soybeans totaled 23.1 mmt, up 17 percent from the same time
last year. Net weekly wheat export sales were .136 mmt, down 69 percent from the previous week. Net corn export sales were .402
mmt, down 9 percent from the previous week. Net soybean export sales were .159 mmt, down 66 percent from the previous week.
Rail
U.S. Class I railroads originated 21,297 grain carloads for the week ending July 7, down 9 percent from the previous week, but up 18
percent from last year, and 11 percent from the 3-year average.
Average July shuttle secondary railcar bids/offers, per car, were $431 above tariff for the week ending July 12, up $56 from last
week, and $581 higher than last year. There were no non-shuttle bids/offers this week.
Barge For the week ending July 14, barge grain movements totaled 741,950 tons, 36 percent lower than the previous week and down 19
percent from the same period last year.
For the week ending July 14, 473 grain barges moved down river, 267 barges less than the previous week. There were 776 grain
barges unloaded in New Orleans, 9 percent higher than the previous week.
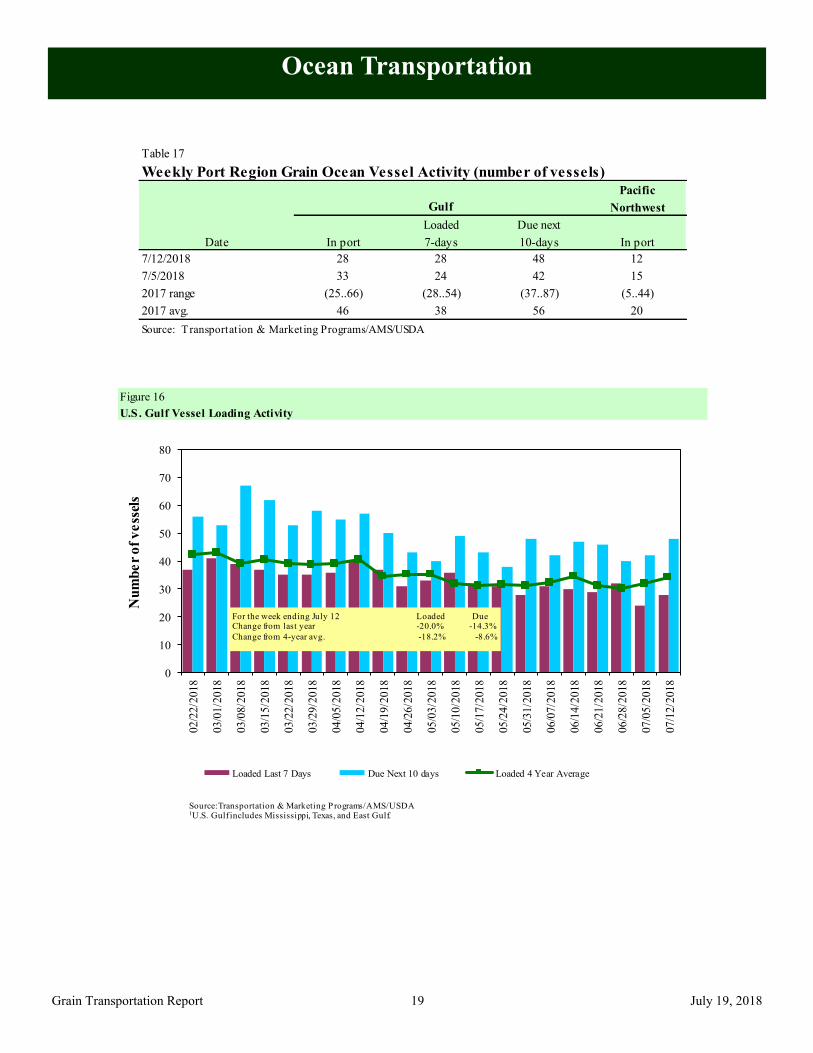
Ocean
For the week ending July 12, 28 ocean-going grain vessels were loaded in the Gulf, 20 percent less than the same period last year.
Forty-eight vessels are expected to be loaded within the next 10 days, 14 percent less than the same period last year.
For the week ending July 12, the ocean freight rate for shipping bulk grain, from the Gulf to Japan, was $44.00 per metric ton, 1
percent more than the previous week. The cost of shipping from the PNW to Japan was $24.75 per metric ton, unchanged from the
previous week.
Fuel
For the week ending July 16, the U.S. average diesel fuel price remained unchanged from the previous week at $3.24 per gallon, 75
cents higher than the same week last year.
July 19, 2018
Grain Transportation Report 2
Feature Article/Calendar
Grain Transportation Update
Grain traffic, as measured by rail and barge movements, saw a stronger second quarter compared to the beginning of
2018. Rail shipments of grain, from April to June, were 4 percent above last year and 15 percent higher than the
prior 3-year average. These shipments were generally associated with higher rates in the secondary auction market
and weakened service performance. Year-to-date grain barge tonnages, through the locking portions of the
Mississippi, Ohio, and Arkansas Rivers, remained strong. Bulk grain ocean freight rates and diesel fuel prices were
above last year, and have been relatively stable in recent weeks. Demand for grain transportation is expected to
remain relatively stable, as USDA projects only a slight drop in grain production (corn, soybeans, and wheat), with
total exports declining by the end of the year. However, USDA projects these declines may be offset by domestic
usage (July World Agricultural Supply and Demand Estimates (WASDE) report).
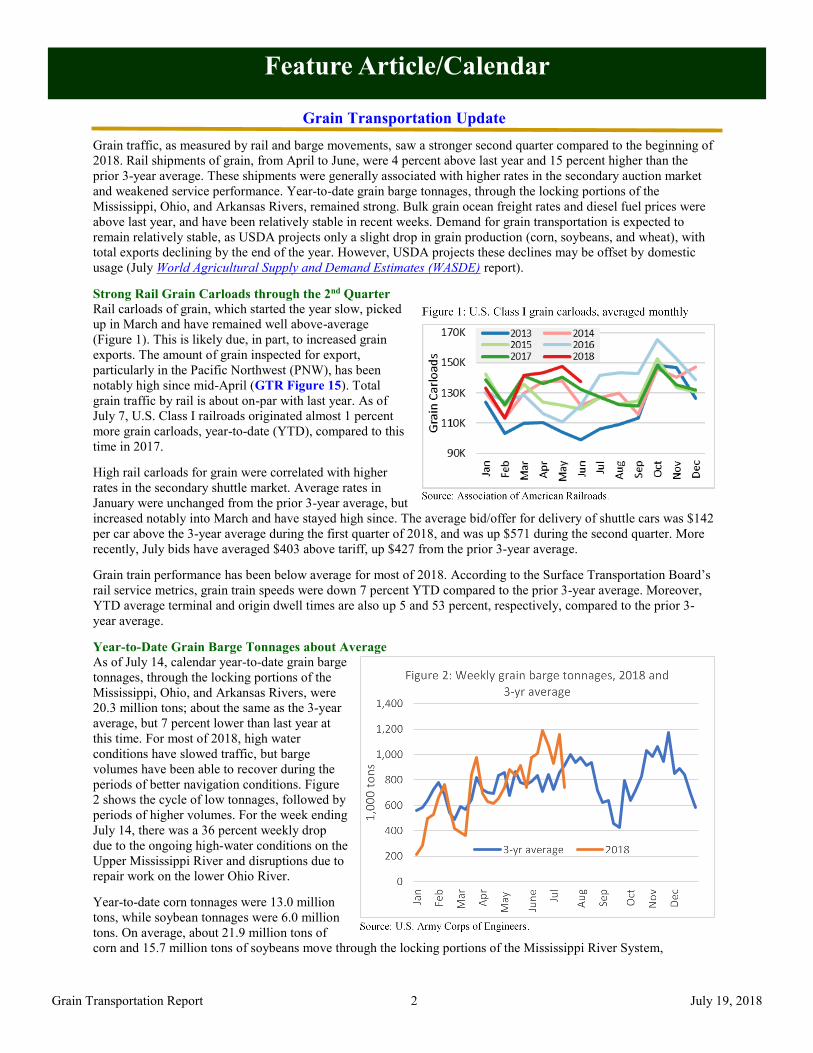
Strong Rail Grain Carloads through the 2nd Quarter
Rail carloads of grain, which started the year slow, picked
up in March and have remained well above-average
(Figure 1). This is likely due, in part, to increased grain
exports. The amount of grain inspected for export,
particularly in the Pacific Northwest (PNW), has been
notably high since mid-April (GTR Figure 15). Total
grain traffic by rail is about on-par with last year. As of
July 7, U.S. Class I railroads originated almost 1 percent
more grain carloads, year-to-date (YTD), compared to this
time in 2017.
High rail carloads for grain were correlated with higher
rates in the secondary shuttle market. Average rates in
January were unchanged from the prior 3-year average, but
increased notably into March and have stayed high since. The average bid/offer for delivery of shuttle cars was $142
per car above the 3-year average during the first quarter of 2018, and was up $571 during the second quarter. More
recently, July bids have averaged $403 above tariff, up $427 from the prior 3-year average.
Grain train performance has been below average for most of 2018. According to the Surface Transportation Board’s
rail service metrics, grain train speeds were down 7 percent YTD compared to the prior 3-year average. Moreover,
YTD average terminal and origin dwell times are also up 5 and 53 percent, respectively, compared to the prior 3-
year average.
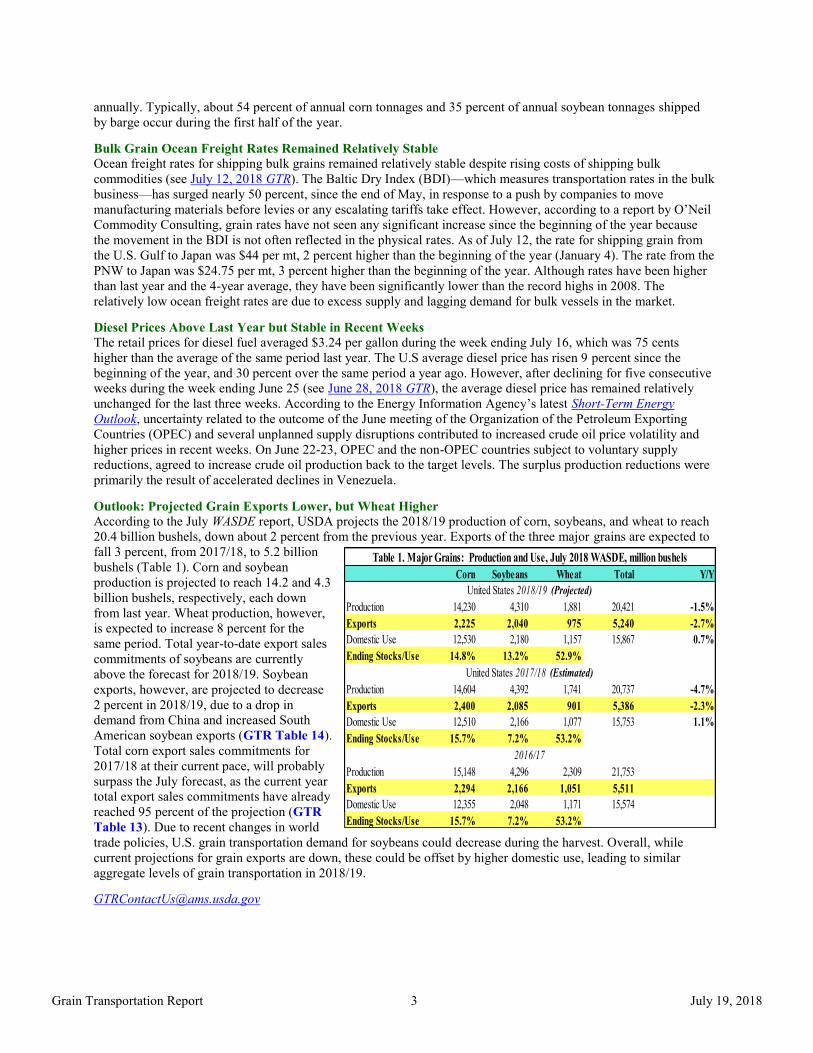
Year-to-Date Grain Barge Tonnages about Average
As of July 14, calendar year-to-date grain barge
tonnages, through the locking portions of the
Mississippi, Ohio, and Arkansas Rivers, were
20.3 million tons; about the same as the 3-year
average, but 7 percent lower than last year at
this time. For most of 2018, high water
conditions have slowed traffic, but barge
volumes have been able to recover during the
periods of better navigation conditions. Figure
2 shows the cycle of low tonnages, followed by
periods of higher volumes. For the week ending
July 14, there was a 36 percent weekly drop
due to the ongoing high-water conditions on the
Upper Mississippi River and disruptions due to
repair work on the lower Ohio River.
Year-to-date corn tonnages were 13.0 million
tons, while soybean tonnages were 6.0 million
tons. On average, about 21.9 million tons of
corn and 15.7 million tons of soybeans move through the locking portions of the Mississippi River System,
July 19, 2018 Grain Transportation Report 3
annually. Typically, about 54 percent of annual corn tonnages and 35 percent of annual soybean tonnages shipped
by barge occur during the first half of the year.
Bulk Grain Ocean Freight Rates Remained Relatively Stable
Ocean freight rates for shipping bulk grains remained relatively stable despite rising costs of shipping bulk
commodities (see July 12, 2018 GTR). The Baltic Dry Index (BDI)—which measures transportation rates in the bulk
business—has surged nearly 50 percent, since the end of May, in response to a push by companies to move
manufacturing materials before levies or any escalating tariffs take effect. However, according to a report by O’Neil
Commodity Consulting, grain rates have not seen any significant increase since the beginning of the year because
the movement in the BDI is not often reflected in the physical rates. As of July 12, the rate for shipping grain from
the U.S. Gulf to Japan was $44 per mt, 2 percent higher than the beginning of the year (January 4). The rate from the
PNW to Japan was $24.75 per mt, 3 percent higher than the beginning of the year. Although rates have been higher
than last year and the 4-year average, they have been significantly lower than the record highs in 2008. The
relatively low ocean freight rates are due to excess supply and lagging demand for bulk vessels in the market.
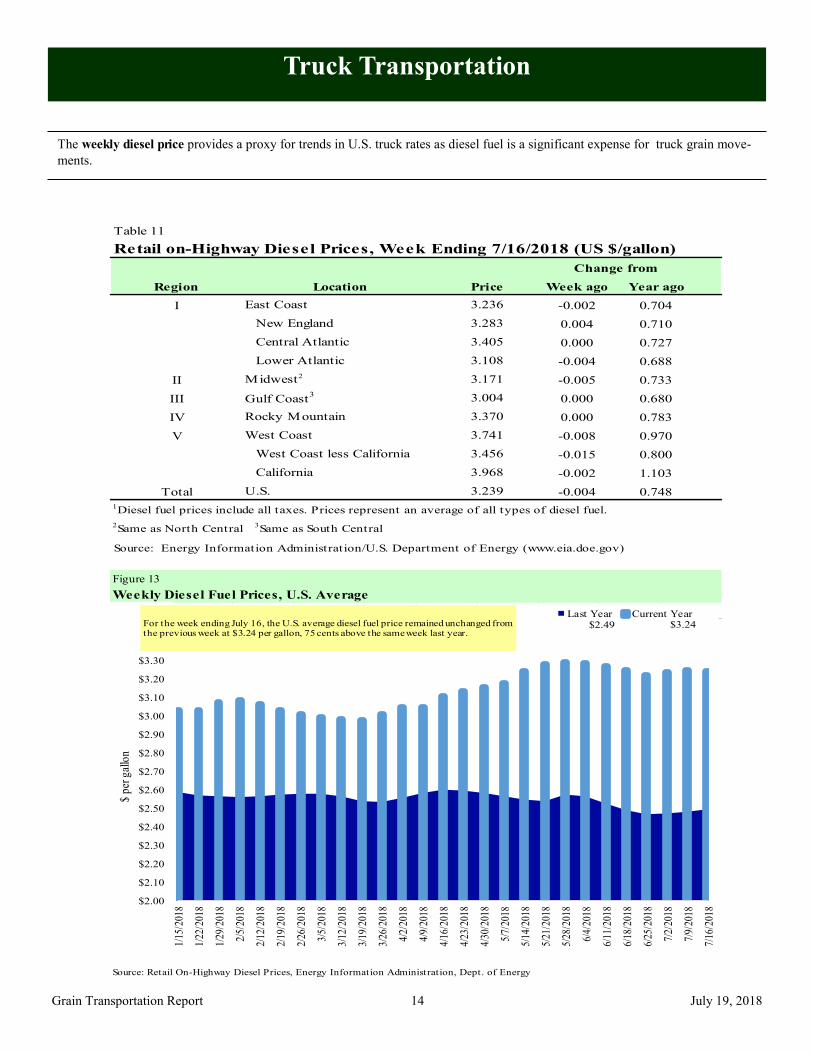
Diesel Prices Above Last Year but Stable in Recent Weeks
The retail prices for diesel fuel averaged $3.24 per gallon during the week ending July 16, which was 75 cents
higher than the average of the same period last year. The U.S average diesel price has risen 9 percent since the
beginning of the year, and 30 percent over the same period a year ago. However, after declining for five consecutive
weeks during the week ending June 25 (see June 28, 2018 GTR), the average diesel price has remained relatively
unchanged for the last three weeks. According to the Energy Information Agency’s latest Short-Term Energy
Outlook, uncertainty related to the outcome of the June meeting of the Organization of the Petroleum Exporting
Countries (OPEC) and several unplanned supply disruptions contributed to increased crude oil price volatility and
higher prices in recent weeks. On June 22-23, OPEC and the non-OPEC countries subject to voluntary supply
reductions, agreed to increase crude oil production back to the target levels. The surplus production reductions were
primarily the result of accelerated declines in Venezuela.
Outlook: Projected Grain Exports Lower, but Wheat Higher
According to the July WASDE report, USDA projects the 2018/19 production of corn, soybeans, and wheat to reach
20.4 billion bushels, down about 2 percent from the previous year. Exports of the three major grains are expected to
fall 3 percent, from 2017/18, to 5.2 billion
bushels (Table 1). Corn and soybean
production is projected to reach 14.2 and 4.3
billion bushels, respectively, each down
from last year. Wheat production, however,
is expected to increase 8 percent for the
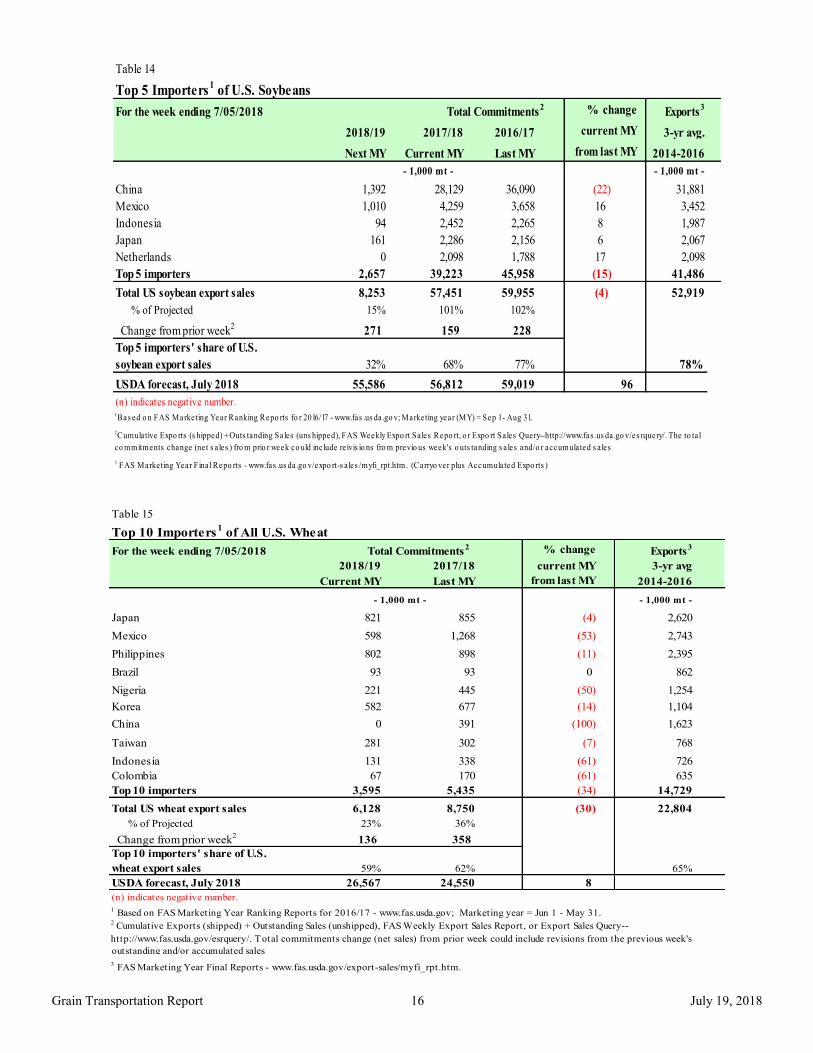
same period. Total year-to-date export sales
commitments of soybeans are currently
above the forecast for 2018/19. Soybean
exports, however, are projected to decrease
2 percent in 2018/19, due to a drop in
demand from China and increased South
American soybean exports (GTR Table 14).
Total corn export sales commitments for
2017/18 at their current pace, will probably
surpass the July forecast, as the current year
total export sales commitments have already
reached 95 percent of the projection (GTR
Table 13). Due to recent changes in world
trade policies, U.S. grain transportation demand for soybeans could decrease during the harvest. Overall, while
current projections for grain exports are down, these could be offset by higher domestic use, leading to similar
aggregate levels of grain transportation in 2018/19.
Corn Soybeans Wheat Total Y/Y
Production 14,230 4,310 1,881 20,421 -1.5%
Exports 2,225 2,040 975 5,240 -2.7%
Domestic Use 12,530 2,180 1,157 15,867 0.7%
Ending Stocks/Use 14.8% 13.2% 52.9%
Production 14,604 4,392 1,741 20,737 -4.7%
Exports 2,400 2,085 901 5,386 -2.3%
Domestic Use 12,510 2,166 1,077 15,753 1.1%
Ending Stocks/Use 15.7% 7.2% 53.2%
Production 15,148 4,296 2,309 21,753
Exports 2,294 2,166 1,051 5,511
Domestic Use 12,355 2,048 1,171 15,574
Ending Stocks/Use 15.7% 7.2% 53.2%
Table 1. Major Grains: Production and Use, July 2018 WASDE, million bushels
United States 2018/19 (Projected)
United States 2017/18 (Estimated)
2016/17
July 19, 2018
Grain Transportation Report 4
Grain Transportation Indicators
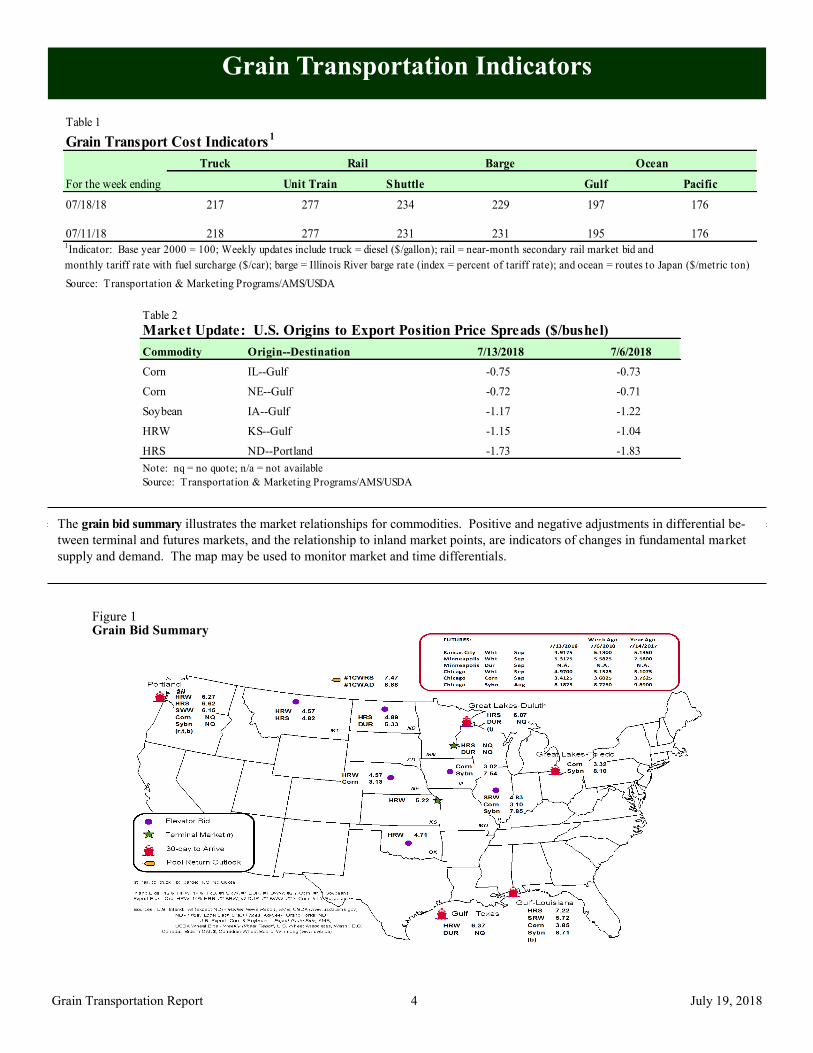
The grain bid summary illustrates the market relationships for commodities. Positive and negative adjustments in differential be-
tween terminal and futures markets, and the relationship to inland market points, are indicators of changes in fundamental market
supply and demand. The map may be used to monitor market and time differentials.
Table 2
Market Update: U.S. Origins to Export Position Price Spreads ($/bushel)
Commodity Origin--Destination 7/13/2018 7/6/2018
Corn IL--Gulf -0.75 -0.73
Corn NE--Gulf -0.72 -0.71
Soybean IA--Gulf -1.17 -1.22
HRW KS--Gulf -1.15 -1.04
HRS ND--Portland -1.73 -1.83
Note: nq = no quote; n/a = not available
Source: Transportation & Marketing Programs/AMS/USDA
Table 1
Grain Transport Cost Indicators1
Truck Barge Ocean
For the week ending Unit Train Shuttle Gulf Pacific
07/18/18 217 277 234 229 197 1760 % # D IV / 0 ! - 1% 1% 0 %
07/11/18 218 277 231 231 195 176
Source: Transportation & Marketing Programs/AMS/USDA
Rail
1Indicator: Base year 2000 = 100; Weekly updates include truck = diesel ($/gallon); rail = near-month secondary rail market bid and
monthly tariff rate with fuel surcharge ($/car); barge = Illinois River barge rate (index = percent of tariff rate); and ocean = routes to Japan ($/metric ton)
Figure 1 Grain Bid Summary
July 19, 2018
Grain Transportation Report 5
Rail Transportation
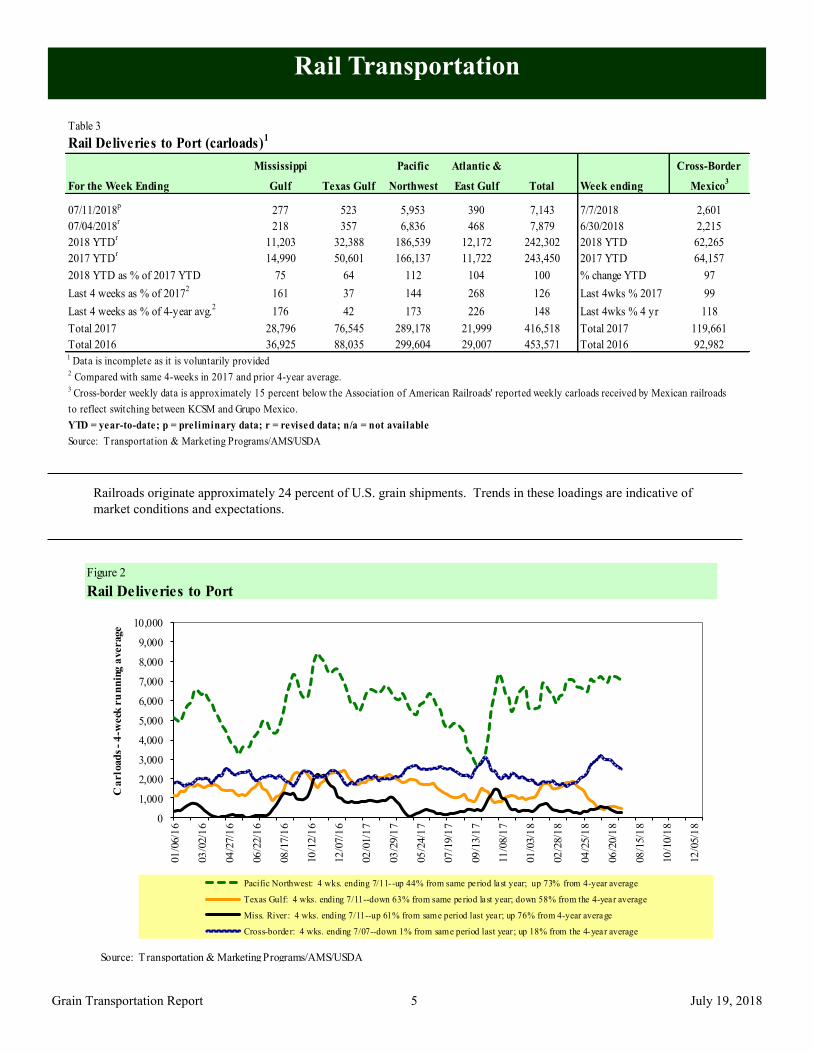
Railroads originate approximately 24 percent of U.S. grain shipments. Trends in these loadings are indicative of
market conditions and expectations.
Figure 2
Rail Deliveries to Port
0
1,000
2,000
3,000
4,000
5,000
6,000
7,000
8,000
9,000
10,000
01
/06/1
6
03
/02/1
6
04
/27/1
6
06
/22/1
6
08
/17/1
6
10
/12/1
6
12
/07/1
6
02
/01/1
7
03
/29/1
7
05
/24/1
7
07
/19/1
7
09
/13/1
7
11
/08/1
7
01
/03/1
8
02
/28/1
8
04
/25/1
8
06
/20/1
8
08
/15/1
8
10
/10/1
8
12
/05/1
8
Ca
rlo
ad
s -
4-w
eek
ru
nn
ing
average
Pacific Northwest: 4 wks. ending 7/11--up 44% from same period last year; up 73% from 4-year average
Texas Gulf: 4 wks. ending 7/11--down 63% from same period last year; down 58% from the 4-year average
Miss. River : 4 wks. ending 7/11--up 61% from same period last year; up 76% from 4-year average
Cross-border: 4 wks. ending 7/07--down 1% from same period last year ; up 18% from the 4-year average
Source: Transportation & Marketing Programs/AMS/USDA
Table 3
Rail Deliveries to Port (carloads)1
Mississippi Pacific Atlantic & Cross-Border
For the Week Ending Gulf Texas Gulf Northwest East Gulf Total Week ending Mexico3
07/11/2018p
277 523 5,953 390 7,143 7/7/2018 2,601
07/04/2018r
218 357 6,836 468 7,879 6/30/2018 2,215
2018 YTDr
11,203 32,388 186,539 12,172 242,302 2018 YTD 62,265
2017 YTDr
14,990 50,601 166,137 11,722 243,450 2017 YTD 64,157
2018 YTD as % of 2017 YTD 75 64 112 104 100 % change YTD 97
Last 4 weeks as % of 20172
161 37 144 268 126 Last 4wks % 2017 99
Last 4 weeks as % of 4-year avg.2
176 42 173 226 148 Last 4wks % 4 yr 118
Total 2017 28,796 76,545 289,178 21,999 416,518 Total 2017 119,661
Total 2016 36,925 88,035 299,604 29,007 453,571 Total 2016 92,9821
Data is incomplete as it is voluntarily provided2 Compared with same 4-weeks in 2017 and prior 4-year average. 3
Cross-border weekly data is approximately 15 percent below the Association of American Railroads' reported weekly carloads received by Mexican railroads
to reflect switching between KCSM and Grupo Mexico.
YTD = year-to-date; p = preliminary data; r = revised data; n/a = not available
Source: Transportation & Marketing Programs/AMS/USDA
July 19, 2018
Grain Transportation Report 6
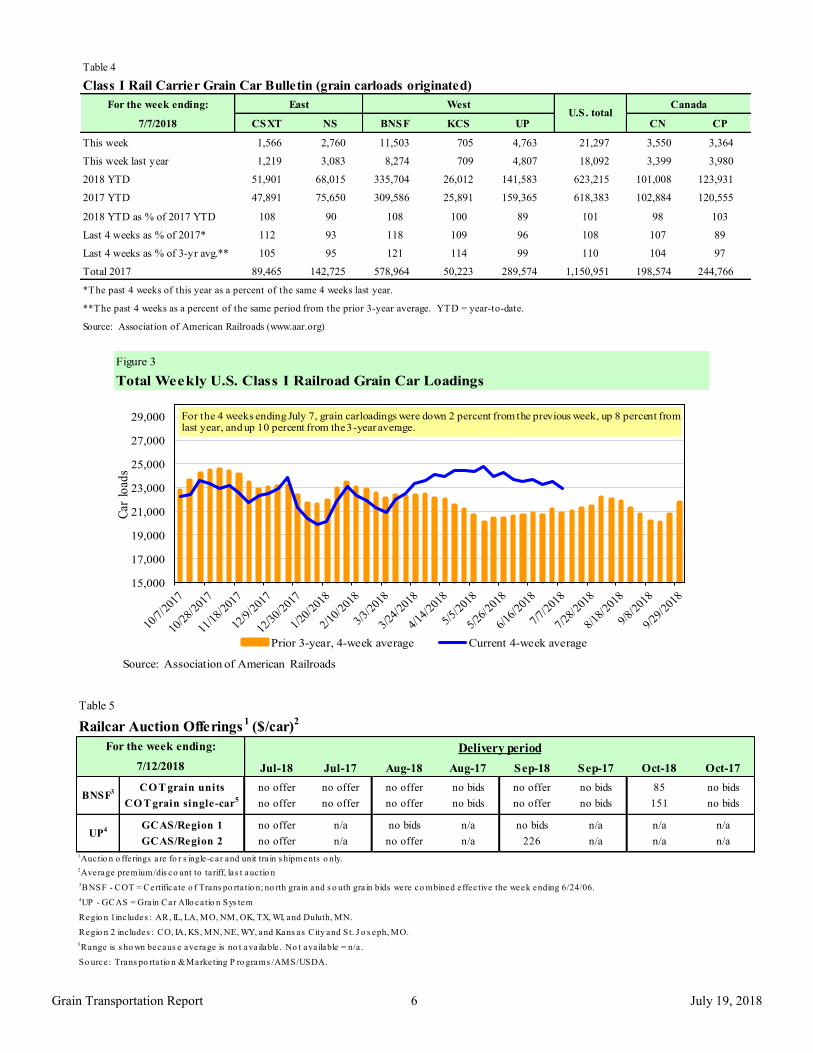
Table 4
Class I Rail Carrier Grain Car Bulletin (grain carloads originated)
For the week ending:
7/7/2018 CSXT NS BNSF KCS UP CN CP
This week 1,566 2,760 11,503 705 4,763 21,297 3,550 3,364
This week last year 1,219 3,083 8,274 709 4,807 18,092 3,399 3,980
2018 YTD 51,901 68,015 335,704 26,012 141,583 623,215 101,008 123,931
2017 YTD 47,891 75,650 309,586 25,891 159,365 618,383 102,884 120,555
2018 YTD as % of 2017 YTD 108 90 108 100 89 101 98 103
Last 4 weeks as % of 2017* 112 93 118 109 96 108 107 89
Last 4 weeks as % of 3-yr avg.** 105 95 121 114 99 110 104 97
Total 2017 89,465 142,725 578,964 50,223 289,574 1,150,951 198,574 244,766
*The past 4 weeks of this year as a percent of the same 4 weeks last year.
**The past 4 weeks as a percent of the same period from the prior 3-year average. YTD = year-to-date.
Source: Association of American Railroads (www.aar.org)
East WestU.S. total
Canada
Table 5
Railcar Auction Offerings1
($/car)2
Jul-18 Jul-17 Aug-18 Aug-17 Sep-18 Sep-17 Oct-18 Oct-17
CO T grain units no offer no offer no offer no bids no offer no bids 85 no bids
CO T grain single-car5 no offer no offer no offer no bids no offer no bids 151 no bids
GCAS/Region 1 no offer n/a no bids n/a no bids n/a n/a n/a
GCAS/Region 2 no offer n/a no offer n/a 226 n/a n/a n/a
1Auctio n o fferings a re fo r s ingle-car and unit tra in s hipments o nly.2Average premium/dis co unt to ta riff, las t auc tio n
3BNSF - COT = Certifica te o f Trans po rta tio n; no rth gra in and s o uth gra in bids were co mbined effec tive the week ending 6/24/06.
4UP - GCAS = Grain Car Allo ca tio n Sys tem
Regio n 1 inc ludes : AR, IL, LA, MO, NM, OK, TX, WI, and Duluth, MN.
Regio n 2 inc ludes : CO, IA, KS, MN, NE, WY, and Kans as City and St. J o s eph, MO.
5Range is s ho wn becaus e average is no t ava ilable . No t ava ilable = n/a .
So urce : Trans po rta tio n & Marketing P ro grams /AMS/USDA.
UP4
Delivery period
BNSF3
For the week ending:
7/12/2018
Figure 3
Total Weekly U.S. Class I Railroad Grain Car Loadings
15,000
17,000
19,000
21,000
23,000
25,000
27,000
29,000
Car
lo
ads
Prior 3-year, 4-week average Current 4-week average
For the 4 weeks ending July 7, grain carloadings were down 2 percent from the previous week, up 8 percent from last year, and up 10 percent from the 3-year average.
Source: Association of American Railroads
July 19, 2018
Grain Transportation Report 7
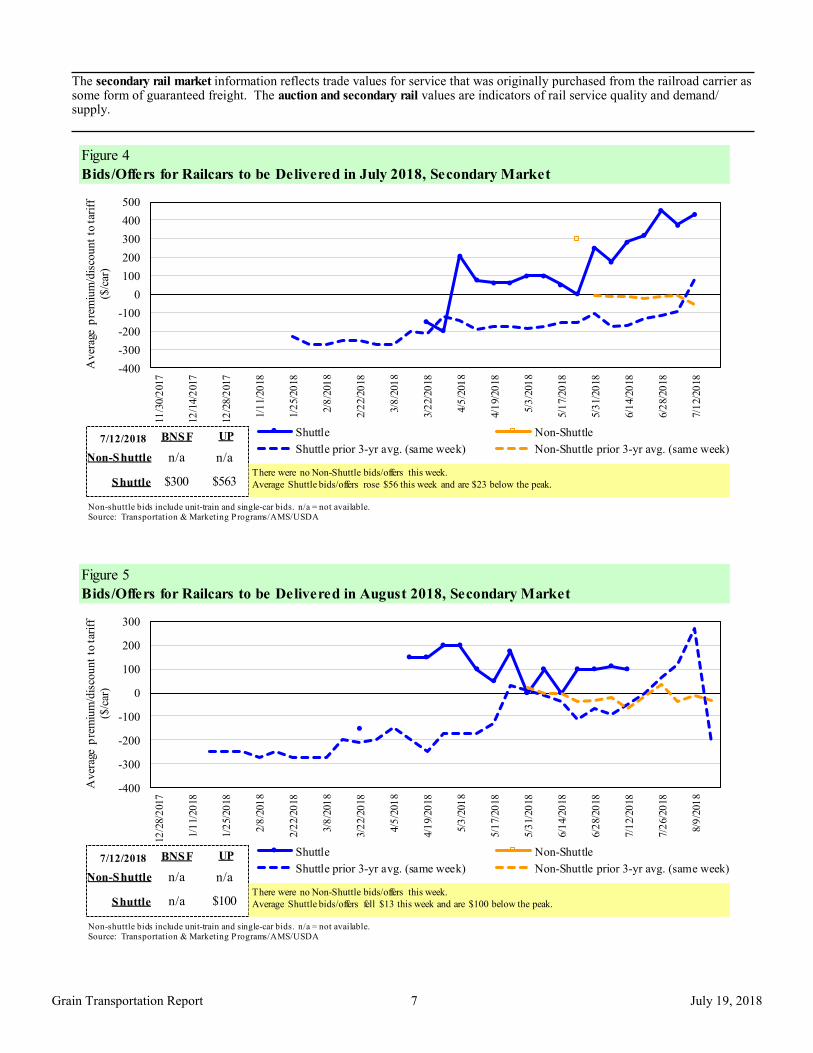
The secondary rail market information reflects trade values for service that was originally purchased from the railroad carrier as some form of guaranteed freight. The auction and secondary rail values are indicators of rail service quality and demand/supply.
Figure 4
Bids/Offers for Railcars to be Delivered in July 2018, Secondary Market
-400
-300
-200
-100
0
100
200
300
400
500
11
/30/2
017
12
/14/2
017
12
/28/2
017
1/1
1/20
18
1/2
5/20
18
2/8
/201
8
2/2
2/20
18
3/8
/201
8
3/2
2/20
18
4/5
/201
8
4/1
9/20
18
5/3
/201
8
5/1
7/20
18
5/3
1/20
18
6/1
4/20
18
6/2
8/20
18
7/1
2/20
18
Aver
age
pre
miu
m/d
isco
unt
to t
arif
f
($/c
ar)
Shuttle Non-Shuttle
Shuttle prior 3-yr avg. (same week) Non-Shuttle prior 3-yr avg. (same week)7/12/2018
Non-shuttle bids include unit-train and single-car bids. n/a = not available.Source: Transportation & Marketing Programs/AMS/USDA
n/a
UPBNSF
$300
n/a
$563Shuttle
Non-Shuttle
There were no Non-Shuttle bids/offers this week.
Average Shuttle bids/offers rose $56 this week and are $23 below the peak.
Figure 5
Bids/Offers for Railcars to be Delivered in August 2018, Secondary Market
-400
-300
-200
-100
0
100
200
300
12
/28/2
017
1/1
1/20
18
1/2
5/20
18
2/8
/201
8
2/2
2/20
18
3/8
/201
8
3/2
2/20
18
4/5
/201
8
4/1
9/20
18
5/3
/201
8
5/1
7/20
18
5/3
1/20
18
6/1
4/20
18
6/2
8/20
18
7/1
2/20
18
7/2
6/20
18
8/9
/201
8
Aver
age
pre
miu
m/d
isco
unt
to t
arif
f
($/c
ar)
Shuttle Non-Shuttle
Shuttle prior 3-yr avg. (same week) Non-Shuttle prior 3-yr avg. (same week)7/12/2018
Non-shuttle bids include unit-train and single-car bids. n/a = not available.Source: Transportation & Marketing Programs/AMS/USDA
n/a
UPBNSF
n/a
n/a
$100Shuttle
Non-Shuttle
There were no Non-Shuttle bids/offers this week.
Average Shuttle bids/offers fell $13 this week and are $100 below the peak.
July 19, 2018
Grain Transportation Report 8
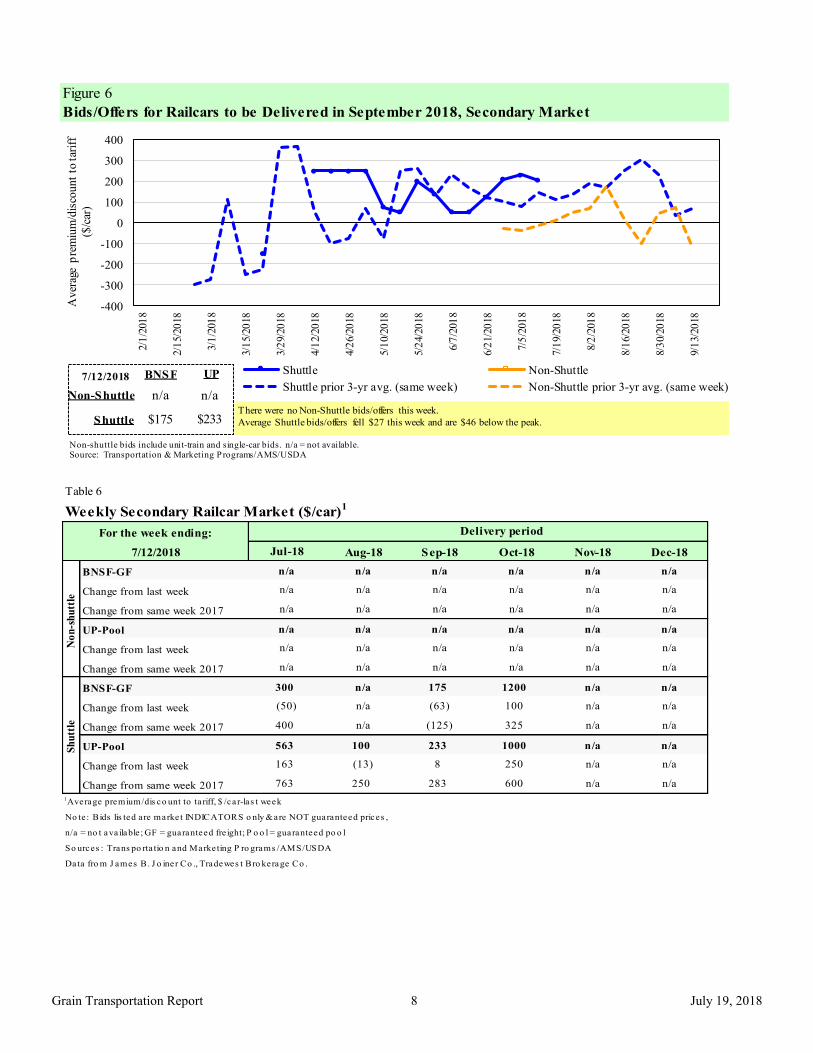
Figure 6
Bids/Offers for Railcars to be Delivered in September 2018, Secondary Market
-400
-300
-200
-100
0
100
200
300
4002/
1/2
018
2/1
5/20
18
3/1
/201
8
3/1
5/20
18
3/2
9/20
18
4/1
2/20
18
4/2
6/20
18
5/1
0/20
18
5/2
4/20
18
6/7
/201
8
6/2
1/20
18
7/5
/201
8
7/1
9/20
18
8/2
/201
8
8/1
6/20
18
8/3
0/20
18
9/1
3/20
18
Av
erag
e p
rem
ium
/dis
cou
nt
to t
arif
f
($/c
ar)
Shuttle Non-Shuttle
Shuttle prior 3-yr avg. (same week) Non-Shuttle prior 3-yr avg. (same week)7/12/2018
Non-shuttle bids include unit-train and single-car bids. n/a = not available.Source: Transportation & Marketing Programs/AMS/USDA
n/a
UPBNSF
$175
n/a
$233Shuttle
Non-Shuttle
There were no Non-Shuttle bids/offers this week.
Average Shuttle bids/offers fell $27 this week and are $46 below the peak.
Table 6
Weekly Secondary Railcar Market ($/car)1
Jul-18 Aug-18 Sep-18 Oct-18 Nov-18 Dec-18
BNSF-GF n/a n/a n/a n/a n/a n/a
Change from last week n/a n/a n/a n/a n/a n/a
Change from same week 2017 n/a n/a n/a n/a n/a n/a
UP-Pool n/a n/a n/a n/a n/a n/a
Change from last week n/a n/a n/a n/a n/a n/a
Change from same week 2017 n/a n/a n/a n/a n/a n/a
BNSF-GF 300 n/a 175 1200 n/a n/a
Change from last week (50) n/a (63) 100 n/a n/a
Change from same week 2017 400 n/a (125) 325 n/a n/a
UP-Pool 563 100 233 1000 n/a n/a
Change from last week 163 (13) 8 250 n/a n/a
Change from same week 2017 763 250 283 600 n/a n/a
1Average premium/dis co unt to ta riff, $ /car-las t week
No te : Bids lis ted are market INDICATORS o nly & are NOT guaranteed prices ,
n/a = no t ava ilable ; GF = guaranteed fre ight; P o o l = guaranteed po o l
So urces : Trans po rta tio n and Marketing P ro grams /AMS/USDA
Data fro m J ames B. J o iner Co ., Tradewes t Bro kerage Co .
No
n-s
hu
ttle
For the week ending:
7/12/2018
Sh
utt
le
Delivery period
July 19, 2018
Grain Transportation Report 9
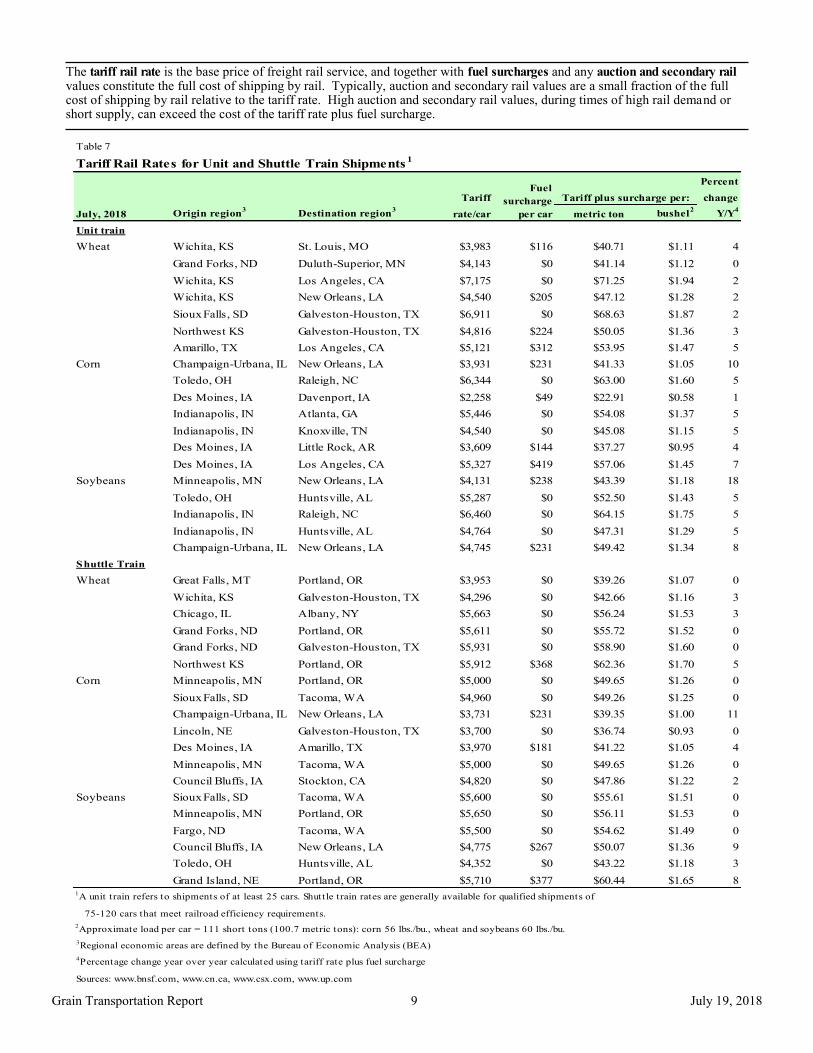
The tariff rail rate is the base price of freight rail service, and together with fuel surcharges and any auction and secondary rail values constitute the full cost of shipping by rail. Typically, auction and secondary rail values are a small fraction of the full cost of shipping by rail relative to the tariff rate. High auction and secondary rail values, during times of high rail demand or short supply, can exceed the cost of the tariff rate plus fuel surcharge.
Table 7
Tariff Rail Rates for Unit and Shuttle Train Shipments1
Percent
Tariff change
July, 2018 Origin region3
Destination region3
rate/car metric ton bushel2
Y/Y4
Unit train
Wheat Wichita, KS St. Louis, MO $3,983 $116 $40.71 $1.11 4
Grand Forks, ND Duluth-Superior, MN $4,143 $0 $41.14 $1.12 0
Wichita, KS Los Angeles, CA $7,175 $0 $71.25 $1.94 2
Wichita, KS New Orleans, LA $4,540 $205 $47.12 $1.28 2
Sioux Falls, SD Galveston-Houston, TX $6,911 $0 $68.63 $1.87 2
Northwest KS Galveston-Houston, TX $4,816 $224 $50.05 $1.36 3
Amarillo, TX Los Angeles, CA $5,121 $312 $53.95 $1.47 5
Corn Champaign-Urbana, IL New Orleans, LA $3,931 $231 $41.33 $1.05 10
Toledo, OH Raleigh, NC $6,344 $0 $63.00 $1.60 5
Des Moines, IA Davenport, IA $2,258 $49 $22.91 $0.58 1
Indianapolis, IN Atlanta, GA $5,446 $0 $54.08 $1.37 5
Indianapolis, IN Knoxville, TN $4,540 $0 $45.08 $1.15 5
Des Moines, IA Little Rock, AR $3,609 $144 $37.27 $0.95 4
Des Moines, IA Los Angeles, CA $5,327 $419 $57.06 $1.45 7
Soybeans Minneapolis, MN New Orleans, LA $4,131 $238 $43.39 $1.18 18
Toledo, OH Huntsville, AL $5,287 $0 $52.50 $1.43 5
Indianapolis, IN Raleigh, NC $6,460 $0 $64.15 $1.75 5
Indianapolis, IN Huntsville, AL $4,764 $0 $47.31 $1.29 5
Champaign-Urbana, IL New Orleans, LA $4,745 $231 $49.42 $1.34 8
Shuttle Train
Wheat Great Falls, MT Portland, OR $3,953 $0 $39.26 $1.07 0
Wichita, KS Galveston-Houston, TX $4,296 $0 $42.66 $1.16 3
Chicago, IL Albany, NY $5,663 $0 $56.24 $1.53 3
Grand Forks, ND Portland, OR $5,611 $0 $55.72 $1.52 0
Grand Forks, ND Galveston-Houston, TX $5,931 $0 $58.90 $1.60 0
Northwest KS Portland, OR $5,912 $368 $62.36 $1.70 5
Corn Minneapolis, MN Portland, OR $5,000 $0 $49.65 $1.26 0
Sioux Falls, SD Tacoma, WA $4,960 $0 $49.26 $1.25 0
Champaign-Urbana, IL New Orleans, LA $3,731 $231 $39.35 $1.00 11
Lincoln, NE Galveston-Houston, TX $3,700 $0 $36.74 $0.93 0
Des Moines, IA Amarillo, TX $3,970 $181 $41.22 $1.05 4
Minneapolis, MN Tacoma, WA $5,000 $0 $49.65 $1.26 0
Council Bluffs, IA Stockton, CA $4,820 $0 $47.86 $1.22 2
Soybeans Sioux Falls, SD Tacoma, WA $5,600 $0 $55.61 $1.51 0
Minneapolis, MN Portland, OR $5,650 $0 $56.11 $1.53 0
Fargo, ND Tacoma, WA $5,500 $0 $54.62 $1.49 0
Council Bluffs, IA New Orleans, LA $4,775 $267 $50.07 $1.36 9
Toledo, OH Huntsville, AL $4,352 $0 $43.22 $1.18 3
Grand Island, NE Portland, OR $5,710 $377 $60.44 $1.65 81A unit train refers to shipments of at least 25 cars. Shuttle train rates are generally available for qualified shipments of
75-120 cars that meet railroad efficiency requirements.
2Approximate load per car = 111 short tons (100.7 metric tons): corn 56 lbs./bu., wheat and soybeans 60 lbs./bu.
3Regional economic areas are defined by the Bureau of Economic Analysis (BEA)
4Percentage change year over year calculated using tariff rate plus fuel surcharge
Sources: www.bnsf.com, www.cn.ca, www.csx.com, www.up.com
Tariff plus surcharge per:Fuel
surcharge
per car
July 19, 2018
Grain Transportation Report 10
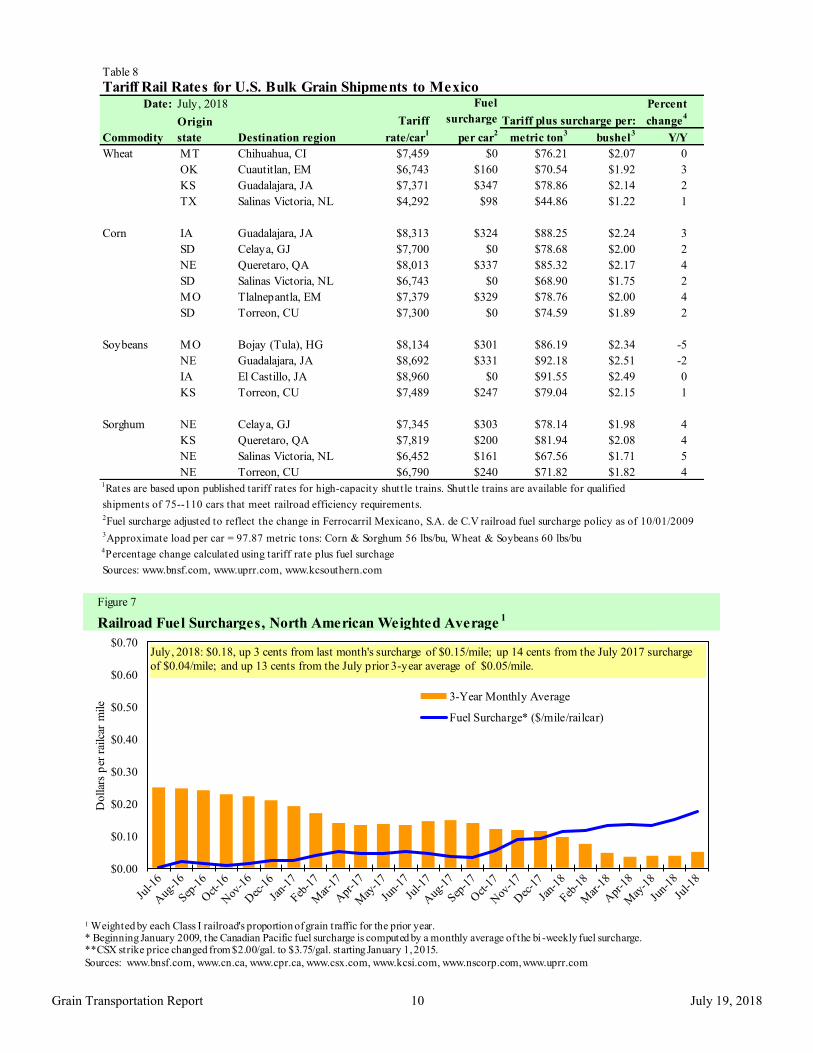
Figure 7
Railroad Fuel Surcharges, North American Weighted Average1
$0.00
$0.10
$0.20
$0.30
$0.40
$0.50
$0.60
$0.70
Do
llar
s p
er r
ailc
ar m
ile
3-Year Monthly Average
Fuel Surcharge* ($/mile/railcar)
July, 2018: $0.18, up 3 cents from last month's surcharge of $0.15/mile; up 14 cents from the July 2017 surcharge
of $0.04/mile; and up 13 cents from the July prior 3-year average of $0.05/mile.
1 Weighted by each Class I railroad's proportion of grain traffic for the prior year. * Beginning January 2009, the Canadian Pacific fuel surcharge is computed by a monthly average of the bi -weekly fuel surcharge.**CSX strike price changed from $2.00/gal. to $3.75/gal. starting January 1, 2015.
Sources: www.bnsf.com, www.cn.ca, www.cpr.ca, www.csx.com, www.kcsi.com, www.nscorp.com, www.uprr.com
Table 8
Tariff Rail Rates for U.S. Bulk Grain Shipments to MexicoDate: Percent
Tariff change4
Commodity Destination region rate/car1
metric ton3 bushel
3Y/Y
Wheat MT Chihuahua, CI $7,459 $0 $76.21 $2.07 0
OK Cuautitlan, EM $6,743 $160 $70.54 $1.92 3
KS Guadalajara, JA $7,371 $347 $78.86 $2.14 2
TX Salinas Victoria, NL $4,292 $98 $44.86 $1.22 1
Corn IA Guadalajara, JA $8,313 $324 $88.25 $2.24 3
SD Celaya, GJ $7,700 $0 $78.68 $2.00 2
NE Queretaro, QA $8,013 $337 $85.32 $2.17 4
SD Salinas Victoria, NL $6,743 $0 $68.90 $1.75 2
MO Tlalnepantla, EM $7,379 $329 $78.76 $2.00 4
SD Torreon, CU $7,300 $0 $74.59 $1.89 2
Soybeans MO Bojay (Tula), HG $8,134 $301 $86.19 $2.34 -5
NE Guadalajara, JA $8,692 $331 $92.18 $2.51 -2
IA El Castillo, JA $8,960 $0 $91.55 $2.49 0
KS Torreon, CU $7,489 $247 $79.04 $2.15 1
Sorghum NE Celaya, GJ $7,345 $303 $78.14 $1.98 4
KS Queretaro, QA $7,819 $200 $81.94 $2.08 4
NE Salinas Victoria, NL $6,452 $161 $67.56 $1.71 5
NE Torreon, CU $6,790 $240 $71.82 $1.82 41Rates are based upon published tariff rates for high-capacity shuttle trains. Shuttle trains are available for qualified
shipments of 75--110 cars that meet railroad efficiency requirements.2Fuel surcharge adjusted to reflect the change in Ferrocarril Mexicano, S.A. de C.V railroad fuel surcharge policy as of 10/01/2009
3Approximate load per car = 97.87 metric tons: Corn & Sorghum 56 lbs/bu, Wheat & Soybeans 60 lbs/bu
4Percentage change calculated using tariff rate plus fuel surchage
Sources: www.bnsf.com, www.uprr.com, www.kcsouthern.com
Fuel
surcharge
per car2
Tariff plus surcharge per:Origin
state
July, 2018

July 19, 2018
Grain Transportation Report 11
Barge Transportation
Figure 9 Benchmark tariff rates Calculating barge rate per ton: (Rate * 1976 tariff benchmark rate per ton)/100
Select applicable index from market quotes included in tables on this page. The 1976 benchmark rates per ton are provided in map.
Twin Cities 6.19
Mid-Mississippi 5.32
St. Louis 3.99
Cairo-Memphis 3.14
Illinois 4.64 Cincinnati 4.69
Lower Ohio 4.04
Figure 8
Illinois River Barge Freight Rate1,2
1Rate = percent of 1976 tariff benchmark index (1976 = 100 percent);
24-week moving average of the 3-year average.
Source: Transportation & Marketing Programs/AMS/USDA
0
200
400
600
800
1000
120007/1
8/1
7
08/0
1/1
7
08/1
5/1
7
08/2
9/1
7
09/1
2/1
7
09/2
6/1
7
10/1
0/1
7
10/2
4/1
7
11/0
7/1
7
11/2
1/1
7
12/0
5/1
7
12/1
9/1
7
01/0
2/1
8
01/1
6/1
8
01/3
0/1
8
02/1
3/1
8
02/2
7/1
8
03/1
3/1
8
03/2
7/1
8
04/1
0/1
8
04/2
4/1
8
05/0
8/1
8
05/2
2/1
8
06/0
5/1
8
06/1
9/1
8
07/0
3/1
8
07/1
7/1
8
Per
cen
t of
tar
iff Weekly rate
3-year avg. for
the week
For the week ending July 17: 1 percent lower than last week, 34 percent higher than last year, and 22 percent higher than the 3-year average.
Table 9
Weekly Barge Freight Rates: Southbound Only
Twin
Cities
Mid-
Mississippi
Lower
Illinois
River St. Louis Cincinnati
Lower
Ohio
Cairo-
Memphis
Rate1
7/17/2018 463 415 413 306 388 400 280
7/10/2018 460 416 416 315 335 335 271
$/ton 7/17/2018 28.66 22.08 19.16 12.21 18.20 16.16 8.79
7/10/2018 28.47 22.13 19.30 12.57 15.71 13.53 8.51
Current week % change from the same week:
Last year 28 35 34 33 60 65 51
3-year avg. 2
4 8 22 16 39 44 25-2 6 6
Rate1
August 463 418 418 310 388 390 288
October 563 530 523 428 525 525 413
Source: Transportation & Marketing Programs/AMS/USDA
1Rate = percent of 1976 tariff benchmark index (1976 = 100 percent);
24-week moving average; ton = 2,000 pounds;

July 19, 2018
Grain Transportation Report 12
Figure 10
Barge Movements on the Mississippi River1 (Locks 27 - Granite City, IL)
1 The 3-year average is a 4-week moving average.
Source: U.S. Army Corps of Engineers
0
200
400
600
800
1,000
1,200
1,40007
/15/1
7
07
/29/1
7
08
/12/1
7
08
/26/1
7
09
/09/1
7
09
/23/1
7
10
/07/1
7
10
/21/1
7
11
/04/1
7
11
/18/1
7
12
/02/1
7
12
/16/1
7
12
/30/1
7
01
/13/1
8
01
/27/1
8
02
/10/1
8
02
/24/1
8
03
/10/1
8
03
/24/1
8
04
/07/1
8
04
/21/1
8
05
/05/1
8
05
/19/1
8
06
/02/1
8
06
/16/1
8
06
/30/1
8
07
/14/1
8
07
/28/1
8
08
/11/1
8
1,0
00
to
ns
Soybeans
Wheat
Corn
3-Year Average
For the week ending July 14: 20 percent lower than last year, and10 percent lower than the3-yr avg.
Table 10
Barge Grain Movements (1,000 tons)
For the week ending 07/14/2018 Corn Wheat Soybeans Other Total
Mississippi River
Rock Island, IL (L15) 157 0 57 0 214
Winfield, MO (L25) 221 2 100 0 323
Alton, IL (L26) 385 2 199 0 586
Granite City, IL (L27) 398 2 213 0 612
Illinois River (L8) 153 0 81 0 234
Ohio River (L52) 44 18 33 0 95
Arkansas River (L1) 0 31 4 0 35
Weekly total - 2018 441 50 250 0 742
Weekly total - 2017 560 109 246 5 920
2018 YTD1
13,035 949 6,240 66 20,290
2017 YTD 13,682 1,295 6,560 164 21,700
2018 as % of 2017 YTD 95 73 95 41 94
Last 4 weeks as % of 20172
118 80 111 48 112
Total 2017 22,242 2,210 16,123 360 40,936
2 As a percent of same period in 2017.
Source: U.S. Army Corps of Engineers
Note: Total may not add exactly, due to rounding.
1 Weekly total, YTD (year-to-date) and calendar year total includes Miss/27, Ohio/52, and Ark/1; "Other" refers to oats, barley,
sorghum, and rye.
July 19, 2018
Grain Transportation Report 13
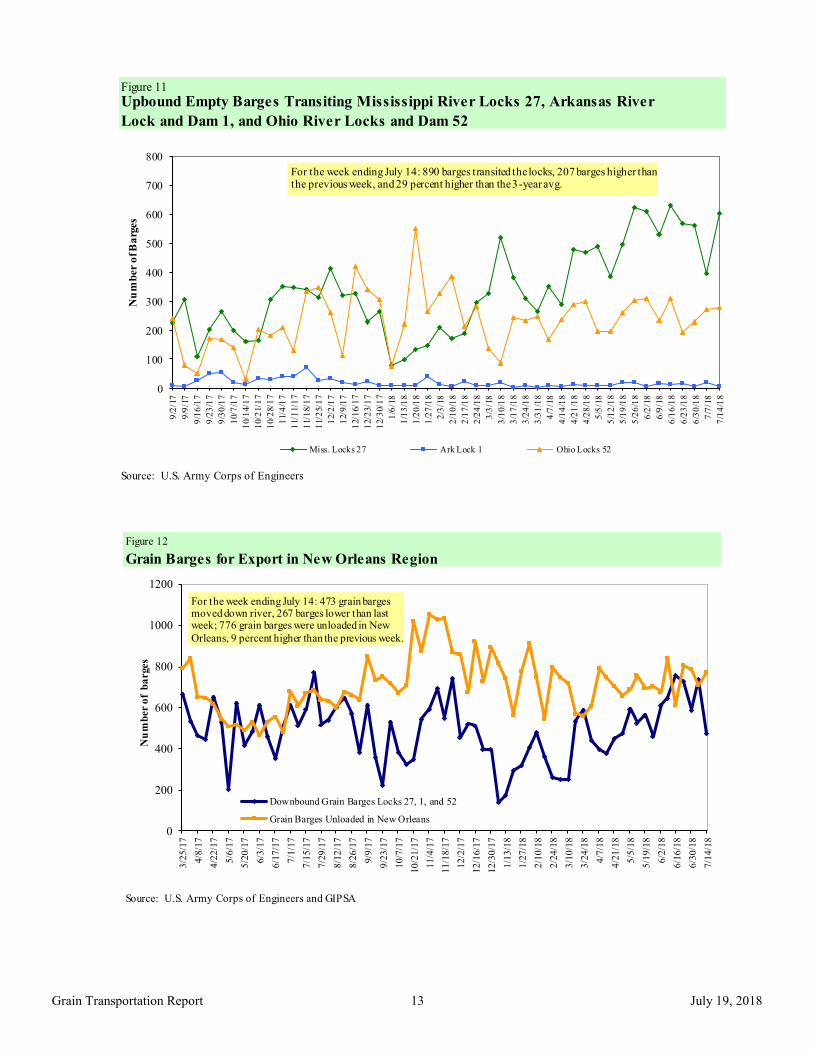
Figure 12
Grain Barges for Export in New Orleans Region
Source: U.S. Army Corps of Engineers and GIPSA
0
200
400
600
800
1000
1200
3/2
5/1
7
4/8
/17
4/2
2/1
7
5/6
/17
5/2
0/1
7
6/3
/17
6/1
7/1
7
7/1
/17
7/1
5/1
7
7/2
9/1
7
8/1
2/1
7
8/2
6/1
7
9/9
/17
9/2
3/1
7
10
/7/1
7
10
/21
/17
11/4
/17
11/1
8/1
7
12/2
/17
12/1
6/1
7
12/3
0/1
7
1/1
3/1
8
1/2
7/1
8
2/1
0/1
8
2/2
4/1
8
3/1
0/1
8
3/2
4/1
8
4/7
/18
4/2
1/1
8
5/5
/18
5/1
9/1
8
6/2
/18
6/1
6/1
8
6/3
0/1
8
7/1
4/1
8
Downbound Grain Barges Locks 27, 1, and 52
Grain Barges Unloaded in New Orleans
Nu
mb
er o
f b
arges
For the week ending July 14: 473 grain bargesmoved down river, 267 barges lower than last week; 776 grain barges were unloaded in New
Orleans, 9 percent higher than the previous week.
Figure 11
Source: U.S. Army Corps of Engineers
Upbound Empty Barges Transiting Mississippi River Locks 27, Arkansas River
Lock and Dam 1, and Ohio River Locks and Dam 52
0
100
200
300
400
500
600
700
800
9/2
/17
9/9
/17
9/1
6/1
7
9/2
3/1
7
9/3
0/1
7
10/
7/1
7
10/
14/
17
10/
21/
17
10/
28/
17
11/
4/1
7
11/
11/
17
11/
18/
17
11/
25/
17
12/
2/1
7
12/
9/1
7
12/
16/
17
12/
23/
17
12/
30/
17
1/6
/18
1/1
3/1
8
1/2
0/1
8
1/2
7/1
8
2/3
/18
2/1
0/1
8
2/1
7/1
8
2/2
4/1
8
3/3
/18
3/1
0/1
8
3/1
7/1
8
3/2
4/1
8
3/3
1/1
8
4/7
/18
4/1
4/1
8
4/2
1/1
8
4/2
8/1
8
5/5
/18
5/1
2/1
8
5/1
9/1
8
5/2
6/1
8
6/2
/18
6/9
/18
6/1
6/1
8
6/2
3/1
8
6/3
0/1
8
7/7
/18
7/1
4/1
8
Nu
mb
er o
f B
arg
es
Miss. Locks 27 Ark Lock 1 Ohio Locks 52
For the week ending July 14: 890 barges transited the locks, 207 barges higher than the previous week, and 29 percent higher than the 3-year avg.
July 19, 2018
Grain Transportation Report 14
The weekly diesel price provides a proxy for trends in U.S. truck rates as diesel fuel is a significant expense for truck grain move-
ments.
Truck Transportation
Table 11
Change from
Region Location Price Week ago Year ago
I East Coast 3.236 -0.002 0.704
New England 3.283 0.004 0.710
Central Atlantic 3.405 0.000 0.727
Lower Atlantic 3.108 -0.004 0.688
II Midwest2 3.171 -0.005 0.733
III Gulf Coast3 3.004 0.000 0.680
IV Rocky Mountain 3.370 0.000 0.783
V West Coast 3.741 -0.008 0.970
West Coast less California 3.456 -0.015 0.800
California 3.968 -0.002 1.103
Total U.S. 3.239 -0.004 0.748
1Diesel fuel prices include all taxes. Prices represent an average of all types of diesel fuel.
2Same as North Central
3Same as South Central
Source: Energy Information Administration/U.S. Department of Energy (www.eia.doe.gov)
Retail on-Highway Diesel Prices, Week Ending 7/16/2018 (US $/gallon)
Figure 13
Weekly Diesel Fuel Prices, U.S. Average
Source: Retail On-Highway Diesel Prices, Energy Information Administration, Dept. of Energy
$3.24 $2.49
$2.00
$2.10
$2.20
$2.30
$2.40
$2.50
$2.60
$2.70
$2.80
$2.90
$3.00
$3.10
$3.20
$3.30
1/15
/201
8
1/22
/201
8
1/29
/201
8
2/5/
2018
2/12
/201
8
2/19
/201
8
2/26
/201
8
3/5/
2018
3/12
/201
8
3/19
/201
8
3/26
/201
8
4/2/
2018
4/9/
2018
4/16
/201
8
4/23
/201
8
4/30
/201
8
5/7/
2018
5/14
/201
8
5/21
/201
8
5/28
/201
8
6/4/
2018
6/11
/201
8
6/18
/201
8
6/25
/201
8
7/2/
2018
7/9/
2018
7/16
/201
8
$ p
er g
allo
n
Last Year Current YearFor the week ending July 16, the U.S. average diesel fuel price remained unchanged from the previous week at $3.24 per gallon, 75 cents above the same week last year.

July 19, 2018
Grain Transportation Report 15
Grain Exports
Table 12
U.S. Export Balances and Cumulative Exports (1,000 metric tons)
Wheat Corn Soybeans Total
For the week ending HRW SRW HRS SWW DUR All wheat
Export Balances1
7/5/2018 1,122 505 1,440 1,155 140 4,362 11,533 7,165 23,059
This week year ago 1,659 665 1,529 1,566 128 5,547 7,472 6,663 19,682
Cumulative exports-marketing year 2
2017/18 YTD 411 251 531 566 9 1,767 46,563 50,286 98,615
2016/17 YTD 1,382 252 818 677 76 3,203 48,292 53,291 104,787
YTD 2017/18 as % of 2016/17 30 100 65 84 11 55 96 94 94
Last 4 wks as % of same period 2016/17 64 77 97 77 96 79 174 117 128
2016/17 Total 11,096 2,285 7,923 4,254 484 26,042 41,864 51,156 119,062
2015/16 Total 5,538 3,057 6,285 3,551 670 19,101 45,564 49,821 114,4861 Current unshipped (outstanding) export sales to date2 Shipped export sales to date; new marketing year now in effect for wheat
Note: YTD = year-to-date. Marketing Year: wheat = 6/01-5/31, corn & soybeans = 9/01-8/31
Source: Foreign Agricultural Service/USDA (www.fas.usda.gov)
Table 13
Top 5 Importers 1 of U.S. Corn
For the week ending 7/05/2018 % change Exports3
2018/19 2017/18 2016/17 current MY 3-year avg
Next MY Current MY Last MY from last MY 2014-2016
Mexico 1,919 14,722 13,465 9 12,297
Japan 1,018 11,146 11,499 (3) 11,450
Korea 391 5,492 5,630 (2) 4,494
Colombia 15 4,472 4,182 7 4,179
Peru 25 3,075 2,965 4 2,693
Top 5 Importers 3,368 38,907 37,740 3 35,113
Total US corn export sales 4,648 58,095 55,764 4 49,308
% of Projected 8% 95% 96%
Change from prior week2
128 402 161
Top 5 importers' share of U.S. corn
export sales 72% 67% 68% 71%
USDA forecast, July 2018 56,616 61,069 58,372 5
Corn Use for Ethanol USDA forecast,
July 2018 142,875 142,240 137,973 3
1Based on FAS Marketing Year Ranking Reports for 2016/17 - www.fas.usda.gov; Marketing year (MY) = Sep 1 - Aug 31.
Total Commitments2
- 1,000 mt -
3FAS Marketing Year Ranking Reports - http://apps.fas.usda.gov/export-sales/myrkaug.htm; 3-yr average
2Cumulative Exports (shipped) + Outstanding Sales (unshipped), FAS Weekly Export Sales Report, or Export Sales Query--
http://www.fas.usda.gov/esrquery/. Total commitments change (net sales) from prior week could include revisions from previous week's outstanding
sales or accumulated sales.
(n) indicates negative number.
July 19, 2018
Grain Transportation Report 16
Table 14
Top 5 Importers1 of U.S. Soybeans
For the week ending 7/05/2018 % change
Exports3
2018/19 2017/18 2016/17 current MY 3-yr avg.
Next MY Current MY Last MY from last MY 2014-2016
- 1,000 mt - - 1,000 mt -
China 1,392 28,129 36,090 (22) 31,881
Mexico 1,010 4,259 3,658 16 3,452
Indonesia 94 2,452 2,265 8 1,987
Japan 161 2,286 2,156 6 2,067
Netherlands 0 2,098 1,788 17 2,098
Top 5 importers 2,657 39,223 45,958 (15) 41,486
Total US soybean export sales 8,253 57,451 59,955 (4) 52,919
% of Projected 15% 101% 102%
Change from prior week2
271 159 228
Top 5 importers' share of U.S.
soybean export sales 32% 68% 77% 78%
USDA forecast, July 2018 55,586 56,812 59,019 96
1Bas ed o n FAS Marketing Year Ranking Repo rts fo r 2016/17 - www.fas .us da .go v; Marketing year (MY) = Sep 1 - Aug 31.
3 FAS Marketing Year Fina l Repo rts - www.fas .us da .go v/expo rt-s a les /myfi_rpt.htm. (Carryo ver plus Accumula ted Expo rts )
(n) indicates negative number.
2Cumula tive Expo rts (s hipped) + Outs tanding Sales (uns hipped), FAS Weekly Expo rt Sa les Repo rt, o r Expo rt Sa les Query--http://www.fas .us da .go v/es rquery/. The to ta l
co mmitments change (ne t s a les ) fro m prio r week co uld inc lude re ivis io ns fro m previo us week's o uts tanding s a les and/o r accumula ted s a les
Total Commitments2
Table 15
Top 10 Importers1 of All U.S. Wheat
For the week ending 7/05/2018 % change Exports3
2018/19 2017/18 current MY 3-yr avg
Current MY Last MY from last MY 2014-2016
- 1,000 mt -
Japan 821 855 (4) 2,620
Mexico 598 1,268 (53) 2,743
Philippines 802 898 (11) 2,395
Brazil 93 93 0 862
Nigeria 221 445 (50) 1,254
Korea 582 677 (14) 1,104
China 0 391 (100) 1,623
Taiwan 281 302 (7) 768
Indonesia 131 338 (61) 726
Colombia 67 170 (61) 635
Top 10 importers 3,595 5,435 (34) 14,729
Total US wheat export sales 6,128 8,750 (30) 22,804
% of Projected 23% 36%
Change from prior week2
136 358
Top 10 importers' share of U.S.
wheat export sales 59% 62% 65%
USDA forecast, July 2018 26,567 24,550 8
1 Based on FAS Marketing Year Ranking Reports for 2016/17 - www.fas.usda.gov; Marketing year = Jun 1 - May 31.
outstanding and/or accumulated sales
Total Commitments2
3 FAS Marketing Year Final Reports - www.fas.usda.gov/export-sales/myfi_rpt.htm.
(n) indicates negative number.
2 Cumulative Exports (shipped) + Outstanding Sales (unshipped), FAS Weekly Export Sales Report, or Export Sales Query--
http://www.fas.usda.gov/esrquery/. Total commitments change (net sales) from prior week could include revisions from the previous week's
- 1,000 mt -

July 19, 2018
Grain Transportation Report 17
The United States exports approximately one-quarter of the grain it produces. On average, this includes nearly 45 percent of U.S.-grown wheat, 50 percent of U.S.-grown soybeans, and 20 percent of the U.S.-grown corn. Approximately 55 percent of the U.S. export grain ship-ments departed through the U.S. Gulf region in 2017.
Table 16
Grain Inspections for Export by U.S. Port Region (1,000 metric tons)
For the Week Ending Previous Current Week 2018 YTD as
07/12/18 Week* as % of Previous 2017 YTD* % of 2017 YTD Last Year Prior 3-yr. avg.
Pacific Northwest
Wheat 312 208 150 6,659 8,485 78 93 130 14,805
Corn 334 612 55 12,303 8,608 143 215 166 10,928
Soybeans 140 148 94 5,453 4,670 117 221 605 13,246
Total 785 969 81 24,416 21,763 112 156 169 38,978
Mississippi Gulf
Wheat 108 52 208 2,260 2,677 84 71 75 4,198
Corn 668 703 95 19,178 19,195 100 117 112 28,690
Soybeans 362 377 96 12,446 12,148 102 186 195 32,911
Total 1,138 1,133 100 33,884 34,020 100 128 126 65,800
Texas Gulf
Wheat 32 1 n/a 1,931 4,105 47 12 16 6,354
Corn 28 30 90 433 407 107 188 95 733
Soybeans 0 0 n/a 67 0 n/a n/a n/a 292
Total 59 32 188 2,431 4,511 54 21 24 7,379
Interior
Wheat 41 12 332 810 1,022 79 51 69 1,727
Corn 124 92 135 4,592 4,658 99 86 107 8,758
Soybeans 142 119 120 3,559 2,740 130 144 171 5,508
Total 307 223 138 8,961 8,420 106 97 120 15,993
Great Lakes
Wheat 0 7 0 263 368 72 18 19 711
Corn 43 3 n/a 280 115 244 548 177 192
Soybeans 21 0 n/a 248 159 156 293 509 890
Total 65 11 608 791 641 123 134 120 1,793
Atlantic
Wheat 1 1 79 66 37 177 n/a 5 46
Corn 0 0 n/a 67 5 n/a n/a 0 32
Soybeans 3 59 6 1,207 901 134 741 498 2,001
Total 4 60 7 1,340 942 142 749 216 2,079
U.S. total from ports*
Wheat 494 282 175 11,987 16,694 72 62 77 27,841
Corn 1,196 1,441 83 36,855 32,987 112 136 126 49,333
Soybeans 669 703 95 22,980 20,617 111 192 229 54,847
Total 2,359 2,426 97 71,823 70,298 102 124 130 132,021
*Data includes revisions from prior weeks; some regional totals may not add exactly due to rounding.
Source: Grain Inspection, Packers and Stockyards Administration/USDA (www.gipsa.usda.gov); YTD= year-to-date; n/a = not applicable
Last 4-weeks as % of:
Port Regions 2017 Total*2018 YTD*

July 19, 2018
Grain Transportation Report 18
Figure 14
U.S. grain inspected for export (wheat, corn, and soybeans)
Source: Grain Inspection, Packers and Stockyards Administration/USDA (www.gipsa.usda.gov)
Note: 3-year average consists of 4-week running average
0
20
40
60
80
100
120
140
160
180
20012
/15/2
016
1/1
2/2
017
2/9
/201
7
3/9
/201
7
4/6
/201
7
5/4
/201
7
6/1
/201
7
6/2
9/2
017
7/2
7/2
017
8/2
4/2
017
9/2
1/2
017
10
/19/2
017
11
/16/2
017
12
/14/2
017
1/1
1/2
018
2/8
/201
8
3/8
/201
8
4/5
/201
8
5/3
/201
8
5/3
1/2
018
6/2
8/2
018
7/2
6/2
018
8/2
3/2
018
9/2
0/2
018
10
/18/2
018
11
/15/2
018
Mil
lion
bu
shels
(m
bu
)
Current week 3-year average
For the week ending Jul. 12: 89.8 mbu, down 3 percent from the previous week, up 15 percent from same week last year, and up 22 percent from the 3-year average.
Figure 15
U.S. Grain Inspections: U.S. Gulf and PNW1 (wheat, corn, and soybeans)
-
10
20
30
40
50
60
70
80
90
100
11
/24/1
6
12
/24/1
6
1/2
4/1
7
2/2
4/1
7
3/2
4/1
7
4/2
4/1
7
5/2
4/1
7
6/2
4/1
7
7/2
4/1
7
8/2
4/1
7
9/2
4/1
7
10
/24/1
7
11
/24/1
7
12
/24/1
7
1/2
4/1
8
2/2
4/1
8
3/2
4/1
8
4/2
4/1
8
5/2
4/1
8
6/2
4/1
8
7/2
4/1
8
8/2
4/1
8
9/2
4/1
8
10
/24/1
8
Mil
lion
bu
shels
(m
bu
)
Miss. Gulf 3-Year avg - Miss. Gulf
PNW 3-Year avg - PNW
Texas Gulf 3-Year avg - TX Gulf
Source: Grain Inspection, Packers and Stockyards Administration/USDA (www.gipsa.usda.gov)
Last Week:
Last Year (same week):
3-yr avg. (4-wk. mov. Avg):
MS Gulf TX Gulf U.S. Gulf PNW
unchanged
up 18
up 22
up 82
down 53
down 57
up 3
up 10
up 12
down 20
up 37
up 50
Percent change from:Week ending 07/12/18 inspections (mbu):
Mississippi Gulf:
PNW:
Texas Gulf:
43.6
29.7
2.3
July 19, 2018
Grain Transportation Report 19
Ocean Transportation
Figure 16
U.S. Gulf Vessel Loading Activity
0
10
20
30
40
50
60
70
80
02/2
2/2
018
03/0
1/2
018
03/0
8/2
018
03/1
5/2
018
03/2
2/2
018
03/2
9/2
018
04/0
5/2
018
04/1
2/2
018
04/1
9/2
018
04/2
6/2
018
05/0
3/2
018
05/1
0/2
018
05/1
7/2
018
05/2
4/2
018
05/3
1/2
018
06/0
7/2
018
06/1
4/2
018
06/2
1/2
018
06/2
8/2
018
07/0
5/2
018
07/1
2/2
018
Nu
mb
er
of
ve
ssel
s
Loaded Last 7 Days Due Next 10 days Loaded 4 Year Average
Source:Transportation & Marketing Programs/AMS/USDA1U.S. Gulf includes Mississippi, Texas, and East Gulf.
For the week ending July 12 Loaded Due Change from last year -20.0% -14.3%
Change from 4-year avg. -18.2% -8.6%
Table 17
Weekly Port Region Grain Ocean Vessel Activity (number of vessels)
Pacific
Gulf Northwest
Loaded Due next
Date In port 7-days 10-days In port
7/12/2018 28 28 48 12
7/5/2018 33 24 42 15
2017 range (25..66) (28..54) (37..87) (5..44)
2017 avg. 46 38 56 20
Source: Transportation & Marketing Programs/AMS/USDA

July 19, 2018
Grain Transportation Report 20
Figure 17
Grain Vessel Rates, U.S. to Japan
Data Source: O'Neil Commodity Consulting
0
5
10
15
20
25
30
35
40
45
50
June
16
Aug
. 16
Oct
. 16
Dec
. 16
Feb.
17
Apr
. 17
June
17
Aug
. 17
Oct
. 17
Dec
. 17
Feb.
18
Apr
. 18
June
18
US
$/m
etri
c to
n
Spread Gulf vs. PNW to Japan Rate Gulf to Japan Rate PNW to Japan
Gulf PNW Spread Ocean rates for June '18 $43.44 $24.69 $18.72 Change from June '17 18.9% 32.7% 5.9%
Change from 4-year avg. 24.1% 31.4% 15.6%
Table 18
Ocean Freight Rates For Selected Shipments, Week Ending 07/14/2018
Export Import Grain Loading Volume loads Freight rate
region region types date (metric tons) (US$/metric ton)
U.S. Gulf Egypt Heavy Grain Jun 26/30 60,000 27.75
U.S. Gulf Rotterdam Heavy Grain Jun 25/30 65,000 23.00
U.S. Gulf Djibouti Sorghum Apr 16/26 18,200 69.87*
PNW Yemen Wheat Jul 26/Aug 9 27,500 83.70*
PNW Bangladesh Wheat Apr 6/16 43,500 63.35*
Brazil China Heavy Grain Jul 18/28 60,000 36.00
Brazil China Heavy Grain Jun 22/30 60,000 35.00
Brazil China Heavy Grain Jun 22/30 60,000 33.75
Brazil China Heavy Grain Jun 20/30 60,000 33.25
Brazil China Heavy Grain Jun 20/26 60,000 32.50
Brazil China Heavy Grain Jun 12/20 66,000 30.75
Brazil China Heavy Grain May 26/Jun 2 66,000 31.50
Brazil Malaysia Heavy Grain Aug 17/24 65,000 31.00
Rates shown are per metric ton (2,204.62 lbs. = 1 metric ton), F.O.B., except where otherwise indicated; op = option *50 percent of food aid from the United States is required to be shipped on U.S.-flag vessels.
Source: Maritime Research Inc. (www.maritime-research.com)

July 19, 2018
Grain Transportation Report 21
In 2017, containers were used to transport 7 percent of total U.S. waterborne grain exports. Approximately 62 percent of U.S. wa-terborne grain exports in 2017 went to Asia, of which 10 percent were moved in containers. Approximately 93 percent of U.S. wa-terborne containerized grain exports were destined for Asia.
Figure 18
Top 10 Destination Markets for U.S. Containerized Grain Exports, January-March 2018
Source: USDA/Agricultural Marketing Service/Transportation Services Division analysis of Port Import Export Reporting
Service (PIERS) data
Note: The following Harmonized Tariff Codes are used to calculate containerized grains movements: 100190, 100200,
100300, 100400, 100590, 100700, 110100, 230310, 110220, 110290, 120100, 230210, 230990, 230330, and 120810.
Taiwan23%
Vietnam16%
Thailand12%
Indonesia
10%Korea
9%
China7%
Japan
5%
Malaysia
3%
Philippines1%
Sri Lanka1%
Other13%
Figure 19
Monthly Shipments of Containerized Grain to Asia
Source: USDA/Agricultural Marketing Service/Transportation Services Division analysis of Port Import Export Reporting Service (PIERS) data.
Note: The following Harmonized Tariff Codes are used to calculate containerized grains movements: 100190, 100200, 100300, 100400, 100590,
100700, 110100, 110220, 110290, 120100, 120810, 230210, 230310, 230330, and 230990.
0
5
10
15
20
25
30
35
40
45
50
55
60
65
70
75
80
Jan.
Feb
.
Mar
.
Apr.
May
Jun
.
Jul.
Aug
.
Sep
.
Oct
.
Nov
.
Dec
.
Th
ou
san
d
20
-ft
equ
ivale
nt
un
its
2017
2018
5-year avg
March 2018: Up 7.7% from last year but 15% lower than
the 5-year average
July 19, 2018
Grain Transportation Report 22
Coordinators Surajudeen (Deen) Olowolayemo [email protected] (202) 720 - 0119 Pierre Bahizi [email protected] (202) 690 - 0992 Adam Sparger [email protected] (202) 205 - 8701
Weekly Highlight Editors Surajudeen (Deen) Olowolayemo [email protected] (202) 720 - 0119 April Taylor [email protected] (202) 720 - 7880 Nicholas Marathon [email protected] (202) 690 - 4430
Grain Transportation Indicators Surajudeen (Deen) Olowolayemo [email protected] (202) 720 - 0119
Rail Transportation Adam Sparger [email protected] (202) 205 - 8701 Johnny Hill [email protected] (202) 690 - 3295 Jesse Gastelle [email protected] (202) 690 - 1144 Peter Caffarelli [email protected] (202) 690 - 3244
Barge Transportation Nicholas Marathon [email protected] (202) 690 - 4430 April Taylor [email protected] (202) 720 - 7880 Matt Chang [email protected] (202) 720 - 0299
Truck Transportation April Taylor [email protected] (202) 720 - 7880 Sergio Sotelo [email protected] (202) 756 - 2577
Grain Exports Johnny Hill [email protected] (202) 690 - 3295 Ocean Transportation Surajudeen (Deen) Olowolayemo [email protected] (202) 720 - 0119 (Freight rates and vessels) April Taylor [email protected] (202) 720 - 7880 (Container movements)
Subscription Information: Send relevant information to [email protected] for an electronic copy (printed copies are also available upon request).
Preferred citation: U.S. Dept. of Agriculture, Agricultural Marketing Service. Grain Transportation Report. July 19, 2018. Web: http://dx.doi.org/10.9752/TS056.07-19-2018
Contacts and Links
In accordance with Federal civil rights law and U.S. Department of Agriculture (USDA) civil rights regulations and policies, the USDA, its Agencies, offices, and employees, and institutions participating in or administering USDA programs are prohibited from discriminating based on race, color, national origin, religion, sex, gender identity (including gender expression), sexual orientation, disability, age, marital status, family/parental status, income derived from a public assistance program, political beliefs, or reprisal or retaliation for prior civil rights activity, in any program or activity conducted or funded by USDA (not all bases apply to all programs). Remedies and complaint filing deadlines vary by pro-gram or incident. Persons with disabilities who require alternative means of communication for program information (e.g., Braille, large print, audiotape, American Sign Language, etc.) should contact the responsible Agency or USDA's TARGET Center at (202) 720-2600 (voice and TTY) or contact USDA through the Federal Relay Service at (800) 877-8339. Additionally, program information may be made available in languages other than English. To file a program discrimination complaint, complete the USDA Program Discrimination Complaint Form, AD-3027, found online at How to File a Program Discrimination Complaint and at any USDA office or write a letter addressed to USDA and provide in the letter all of the infor-mation requested in the form. To request a copy of the complaint form, call (866) 632-9992. Submit your completed form or letter to USDA by: (1) mail: U.S. Department of Agriculture, Office of the Assistant Secretary for Civil Rights, 1400 Independence Avenue, SW, Washington, D.C. 20250-9410; (2) fax: (202) 690-7442; or (3) email: [email protected]. USDA is an equal opportunity provider, employer, and lender.