World Agricultural Supply and Demand...
40
ISSN: 1554-9089 World Agricultural Supply and Demand Estimates United States Department of Agriculture Office of the Chief Economist Agricultural Marketing Service Farm Service Agency Economic Research Service Foreign Agricultural Service WASDE - 479 Approved by the World Agricultural Outlook Board February 9, 2010 NOTE: The Federal government in the Washington, DC, area closed on February 9 due to inclement weather. The USDA Production, Supply, and Distribution (PS&D) online database, located on the Foreign Agricultural Service website, will be updated to reflect today’s World Agricultural Supply and Demand Estimates report after the government in the DC area re-opens. WHEAT: U.S. wheat ending stocks for 2009/10 are projected 5 million bushels higher this month reflecting an increase in expected imports. Imports are raised based on expected shipments of South American and European feed quality wheat into the southeastern U.S. market. Exports of all wheat are unchanged, but by-class adjustments include a 10-million- bushel increase in hard red winter wheat and 5-million-bushel decreases in both hard red spring and durum wheat. The projected marketing-year average farm price is narrowed 5 cents on both ends of the range to $4.75 to $4.95 per bushel. Global wheat supplies for 2009/10 are projected 1.4 million tons higher reflecting production increases for Argentina and Ukraine. Argentina production is raised 1.0 million tons as abundant, late-season rains raised harvested area and yields in key eastern growing areas. Ukraine production is increased 0.4 million tons as the latest revisions to state statistical committee estimates boost yields, more than offsetting a small reduction in harvested area. Global wheat imports and exports for 2009/10 are both raised this month mostly reflecting higher expected shipments for Argentina and increased regional trade for Turkey. Exports are raised 1.0 million tons for Argentina with larger supplies and recently more favorable government policies toward exports. Exports for Turkey are raised 0.3 million tons reflecting stronger shipments to other countries in the region. Partly offsetting are reductions of 0.5 million tons and 0.2 million tons, respectively, for Pakistan and Uruguay exports. Imports are raised 0.7 million tons for Afghanistan and 0.5 million tons for Turkey. Imports are raised 0.4 million tons for Uzbekistan. Partly offsetting is a 0.5-million-ton import reduction for Pakistan. Global wheat consumption for 2009/10 is raised 1.1 million tons mostly on higher feeding in Canada and increased food use in Afghanistan. Higher consumption mostly offsets this month’s increase in world production with projected global ending stocks rising 0.3 million tons. COARSE GRAINS: U.S. feed grain ending stocks for 2009/10 are projected lower this month with higher expected corn use and sorghum exports. Corn used for ethanol is projected 100 million bushels higher reflecting the latest ethanol production data from the Energy Information Agency. November’s record ethanol production was up 3 percent from the previous record in October as higher prices for ethanol and distillers grains boosted ethanol producer returns. September-November corn use for ethanol was up 16 percent from the same period in 2008/09. Although returns have declined since November, recently lower corn prices continue to support profitability for ethanol producers. A 5-million-bushel reduction in expected corn use for sweeteners partly offsets the increase for ethanol. Corn exports for 2009/10 are projected
Transcript of World Agricultural Supply and Demand...

ISSN: 1554-9089
World Agricultural Supply and Demand Estimates
United States Department of Agriculture Office of the Chief Economist
Agricultural Marketing Service Farm Service Agency
Economic Research Service Foreign Agricultural Service
WASDE - 479 Approved by the World Agricultural Outlook Board February 9, 2010 NOTE: The Federal government in the Washington, DC, area closed on February 9 due to inclement weather. The USDA Production, Supply, and Distribution (PS&D) online database, located on the Foreign Agricultural Service website, will be updated to reflect today’s World Agricultural Supply and Demand Estimates report after the government in the DC area re-opens. WHEAT: U.S. wheat ending stocks for 2009/10 are projected 5 million bushels higher this month reflecting an increase in expected imports. Imports are raised based on expected shipments of South American and European feed quality wheat into the southeastern U.S. market. Exports of all wheat are unchanged, but by-class adjustments include a 10-million-bushel increase in hard red winter wheat and 5-million-bushel decreases in both hard red spring and durum wheat. The projected marketing-year average farm price is narrowed 5 cents on both ends of the range to $4.75 to $4.95 per bushel. Global wheat supplies for 2009/10 are projected 1.4 million tons higher reflecting production increases for Argentina and Ukraine. Argentina production is raised 1.0 million tons as abundant, late-season rains raised harvested area and yields in key eastern growing areas. Ukraine production is increased 0.4 million tons as the latest revisions to state statistical committee estimates boost yields, more than offsetting a small reduction in harvested area. Global wheat imports and exports for 2009/10 are both raised this month mostly reflecting higher expected shipments for Argentina and increased regional trade for Turkey. Exports are raised 1.0 million tons for Argentina with larger supplies and recently more favorable government policies toward exports. Exports for Turkey are raised 0.3 million tons reflecting stronger shipments to other countries in the region. Partly offsetting are reductions of 0.5 million tons and 0.2 million tons, respectively, for Pakistan and Uruguay exports. Imports are raised 0.7 million tons for Afghanistan and 0.5 million tons for Turkey. Imports are raised 0.4 million tons for Uzbekistan. Partly offsetting is a 0.5-million-ton import reduction for Pakistan. Global wheat consumption for 2009/10 is raised 1.1 million tons mostly on higher feeding in Canada and increased food use in Afghanistan. Higher consumption mostly offsets this month’s increase in world production with projected global ending stocks rising 0.3 million tons. COARSE GRAINS: U.S. feed grain ending stocks for 2009/10 are projected lower this month with higher expected corn use and sorghum exports. Corn used for ethanol is projected 100 million bushels higher reflecting the latest ethanol production data from the Energy Information Agency. November’s record ethanol production was up 3 percent from the previous record in October as higher prices for ethanol and distillers grains boosted ethanol producer returns. September-November corn use for ethanol was up 16 percent from the same period in 2008/09. Although returns have declined since November, recently lower corn prices continue to support profitability for ethanol producers. A 5-million-bushel reduction in expected corn use for sweeteners partly offsets the increase for ethanol. Corn exports for 2009/10 are projected

WASDE-479-2
50 million bushels lower on increased competition from Argentina. Ending stocks are projected 45 million bushels lower. The projected marketing-year average farm price for corn is narrowed 5 cents on both ends of the range to $3.45 to $3.95 per bushel. Global coarse grain production for 2009/10 is projected 1.6 million tons higher this month with higher Argentina corn production only partly offset by lower EU-27 corn production and lower Ukraine barley and oats production. Argentina corn production is raised 2.2 million tons with higher expected yields and harvested area as growing conditions continue to improve with additional rainfall in the main corn areas. Late planting and short-term heat stress in the western growing areas temper prospects as a substantial portion of the growing season is still ahead. EU-27 corn production is lowered 0.4 million tons on downward revisions to area for Italy. Ukraine barley and oats production are each lowered 0.2 million tons reflecting the latest revisions to state statistical committee estimates. A number of small, offsetting revisions are made for Russia coarse grains production. Global coarse grain imports and exports for 2009/10 are both raised slightly this month. The reduction in U.S. corn exports is more than offset by a 1.5-million-ton increase for Argentina. Sorghum imports are raised for Japan and Mexico with the increase in U.S. sorghum exports. Other major trade changes this month include a 0.5-million-ton reduction in EU-27 barley exports and a 0.5-million-ton increase in Turkey barley exports. Global coarse grain consumption is increased 3.4 million tons this month with higher corn and sorghum use more than offsetting a reduction for barley. Higher corn use for ethanol in the United States and higher corn feeding in Argentina account for most of the increase. Sorghum feeding is raised for Australia, Japan, and Mexico. Barley feeding is lowered for Australia, Iran, Turkey, and Ukraine. Global coarse grain ending stocks are projected 1.0 million tons lower with a 2.1-million-ton reduction for corn partly offset by a 1.1-million-ton increase for barley. RICE: No changes are made on the supply side of the U.S. 2009/10 rice supply and use balance sheet. However, 2009/10 domestic and residual use and exports are each increased resulting in an increase in total use of 3 million cwt to 231.5 million. Domestic and residual use is raised 1 million cwt to 130.5 million, and exports are increased 2 million to 101.0 million. The 2009/10 by-class export projections are each raised 1 million cwt to 70.0 million for long-grain and 31.0 million for combined medium- and short-grain rice. The increase in exports is all in the rough rice category now projected at 37.0 million cwt. The increase in use results in a decrease in ending stocks to 39.8 million cwt, down 7 percent from last month. The 2009/10 long-grain, season-average price is projected at $12.90 to $13.40 per cwt, up 40 cents per cwt on the low end of the range, but down 10 cents per cwt on the high end compared to a revised $14.90 per cwt for 2008/09. The combined medium- and short-grain price is projected at $17.50 to $18.00 per cwt, up 50 cents per cwt on the low end of the range and no change on the high end compared to a revised $24.80 per cwt for 2008/09. The all rice season-average price is forecast at $14.05 to $14.55 per cwt, up 40 cents per cwt on the low end of the range, but down 10 cents per cwt on the high end compared to $16.80 for 2008/09. The price projections are based on National Agricultural Statistics Service reported prices through mid-January and expected prices the remainder of the marketing year. Global 2009/10 rice production, consumption, trade, and ending stocks are raised from a month ago. The increase in global production is due mostly to an increase in the Indonesian rice crop, which is offset partially by small downward adjustments in the Philippines and

WASDE-479-3
Thailand. Indonesia’s rice crop is forecast at 38.8 million tons, up 5 percent from last month due to an expected increase in average yield. Crop prospects have improved since a month ago, particularly in central and eastern Java as the effects of El Nino have moderated. World exports are raised slightly mostly due to increases for the United States and Egypt, which is partially offset by a reduction for Burma. Imports are raised for a number of West African countries which is partially offset by reduction for Bangladesh. Global ending stocks are raised to 92.5 million tons, up 1.8 million from a month ago with most of the increase in Indonesia -- up 1.5 million from last month. Other notable changes in ending stocks include an increase for Thailand and reductions for the United States, the Philippines, Egypt, and Senegal. OILSEEDS: Projected U.S. soybean ending stocks for 2009/10 are reduced to 210 million bushels, down 35 million from last month due to increased exports and crush. Soybean exports are raised 25 million bushels to 1.400 billion as export shipments continue to exceed earlier projections. Although a record South American harvest is expected to reach the market in coming weeks, tight old-crop South American supplies resulting from last year=s historic drought in Argentina continue to support U.S. exports. Soybean crush is raised 10 million bushels to 1.720 billion reflecting a strong soybean meal exports and a lower soybean meal extraction rate. Soybean oil stocks are projected higher this month as the increased crush more than offsets a small reduction in the soybean oil extraction rate. Soybean oil used for methyl ester is unchanged this month despite reduced production due to the loss of the $1.00 per gallon blending credit at the end of December. The recent Environmental Protection Agency announcement of final rules for the 2009 and 2010 biodiesel mandates is expected to result in offsetting production gains through the end of the 2009/10 marketing year. The U.S. season-average soybean price range for 2009/10 is projected at $8.70 to $10.20 per bushel, down 20 cents on both ends of the range. The soybean meal price is projected at $270 to $320 per short ton, up 5 dollars on both ends. The soybean oil price is projected at 33.5 to 36.5 cents per pound, down 2.5 cents on both ends of the range. Global oilseed production for 2009/10 is projected at 433.7 million tons, up 2.1 million from last month. Global soybean production is raised 1.6 million tons to 255 million tons. Improved production prospects for South America account for most of the change. Soybean production for Brazil is projected at 66 million tons, up 1 million from last month due to higher yields. Soybean production is also raised for Paraguay and Uruguay. Global sunflowerseed production is projected higher due to gains for Ukraine and Russia. Global rapeseed production is raised this month due to a larger projected crop for EU-27. Global oilseed trade is raised 0.9 million tons to 96.3 million tons, mainly due to increased soybean imports for China and Egypt. Higher global oilseed crush mainly reflects increased rapeseed crush in Canada, China, and EU-27. Global oilseed stocks are mostly unchanged at 71.1 million tons. SUGAR: Projected 2009/10 sugar supply is decreased 85,000 short tons, raw value, from last month due to lower imports from Mexico more than offsetting higher sugar production. Beet sugar production and Louisiana cane sugar production are increased a combined 150,000 tons to reflect anticipated higher output in September 2010. Florida cane sugar production is reduced 15,000 tons based on lower forecast production of sugarcane. Imports from Mexico are decreased 220,000 tons in line with a decrease in production based on continued reports of weather-reduced sugar yields. Sugar use is unchanged.

WASDE-479-4
LIVESTOCK, POULTRY, AND DAIRY: Total U.S. meat production for 2010 is little changed as higher beef production is more than offset by lower forecast production of pork and turkey. The Cattle report estimated the cattle numbers on January 1, 2010, declined from the previous year, but implied the number of cattle outside feedlots remains close to last year. Thus, forecast placements and marketings are raised, resulting in higher forecast cattle slaughter. However, partly offsetting the increase in expected slaughter, cattle weights are reduced for early 2010 due to severe weather which has impacted weight gain. Pork production is reduced as slaughter has been lower than expected and weights slightly lighter. Turkey production for 2010 was reduced as the pace of growth implied by hatchery data has been less than expected. Broiler meat and egg production forecasts are unchanged from last month. Estimated meat production for 2009 is adjusted to reflect December slaughter data. Only small changes are made to 2009 beef exports. There are no changes to red meat export forecasts for 2010 but the broiler export forecast is reduced from last month. Recently announced duties on U.S. broilers by China and continued trade restrictions in several other countries will pressure broiler exports. Cattle price forecasts are lowered for 2010 as larger numbers of fed cattle are expected to pressure prices. Hog prices are raised as tighter supplies may help support prices. Broiler prices are forecast higher in 2010 as domestic demand is expected to grow. The milk production forecasts are raised for 2009 and 2010. The forecast for 2009 reflects recent USDA estimates of fourth-quarter production. Milk production is forecast higher for 2010 based on the higher-than-expected January 1 dairy replacement heifer estimate. Herds are not expected to decline as rapidly as forecast last month, boosting milk production. Dairy exports on a skim-solids basis for 2010 are raised, reflecting higher sales of cheese and nonfat dry milk. Import forecasts are lowered for 2010. Fat and skim-solids ending stocks are estimated higher for 2009 and stocks for 2010 are raised in the face of higher production. Cheese and butter price forecasts for 2010 are little changed from last month. The Class III price is raised from last month due to higher forecast whey prices, but the Class IV price forecast is lowered reflecting weaker nonfat dry milk prices. The all milk price is forecast at $16.20 to $16.90 for 2010. COTTON: The 2009/10 U.S. cotton supply and demand estimates show sharply higher exports, lower ending stocks, and higher prices relative to last month. Production and domestic mill use are unchanged. The export forecast is raised 1.0 million bales to 12.0 million, as new export sales of more than 1.8 million bales were made in January. Led by a drop in the New York futures market, recent lower prices for U.S. cotton combined with strong foreign mill demand have boosted export prospects. Accordingly, U.S. ending stocks are now forecast at 3.3 million bales, 21.4 percent of total use. If realized, this would be the lowest stocks-to-use ratio since 2003/04. The forecast range of 59 to 65 cents per pound for the marketing-year average price received by producers is raised 2 cents on the lower end and 1 cent on the upper end, based on a higher-than-expected average price received for the month of December. This month’s world cotton 2009/10 forecasts show higher beginning stocks, largely offset by higher consumption. Beginning stocks are raised in China due to modest reductions in estimated consumption for marketing years 2007/08 and 2008/09. World production is virtually

WASDE-479-5
unchanged. Higher forecast 2009/10 world consumption includes increases for China and India, based on a stronger estimated recovery in demand than previously anticipated. Total world trade is about unchanged, as higher U.S. exports are mainly offset by a reduction in exports by India. World ending stocks are raised marginally from last month. Approved by the Secretary of Agriculture and the Chairperson of the World Agricultural Outlook Board, Gerald A. Bange, (202) 720-6030. This report was prepared by the Interagency Commodity Estimates Committees.
APPROVED BY:
JAMES MILLER
ACTING SECRETARY OF AGRICULTURE
New WASDE Report Formats Available Starting Feb. 9, 2010 USDA is introducing two new formats for the World Agricultural Supply and Demand Estimates (WASDE) report. On February 9, 2009, USDA will begin posting XML and Microsoft Excel file versions of the report by 12:00 noon following the regular 8:30 a.m. EST release of the report in TXT and PDF file formats. The new file versions will be posted at: http://www.usda.gov/oce/commodity/wasde/newformat.htm. There will be no change in layout or page numbers. Beginning on July 9, 2010, the WASDE report will be released in four formats (TXT, PDF, XML, and Microsoft Excel) at 8:30 a.m. EST on the OCE Website. On October 8, 2010, USDA will discontinue issuing the TXT file version. For further information, please contact Hunter Colby at 202-690-2477 ([email protected]).

WASDE-479-6
INTERAGENCY COMMODITY ESTIMATES COMMITTEES
Note: The World Agricultural Outlook Board reviews and approves the World Agricultural Supply and
Demand Estimates (WASDE) report. The Board’s analysts chair the Interagency Commodity
Estimates Committees (ICECs) that prepare the monthly report.
Wheat: Jerry Norton, ICEC Chair, WAOB, E-mail: [email protected] Gary Vocke, ERS; Teresa McKeivier, FAS; William Chambers, FSA. Rice: Andrew C. Aaronson, ICEC Chair, WAOB, E-mail: [email protected] Nathan Childs, ERS; Debbie Rubas, FAS; Mark Simone, FSA. Feed Grains: Jerry Norton, ICEC Chair, WAOB, E-mail: [email protected] Allen Baker, ERS; Richard O=Meara, FAS; Pete Riley, FSA. Oilseeds: Keith Menzie, ICEC Chair, WAOB, E-mail: [email protected] Mark Ash, ERS; Bill George, FAS; Max Fisher, FSA. Cotton: Carol Skelly, ICEC Chair, WAOB, E-mail: [email protected] Darryl Earnest, AMS; Leslie Meyer, ERS; James Johnson, FAS; Steven Neff, FSA. Sugar: John Love, ICEC Chair, WAOB, E-mail: [email protected] Stephen Haley, ERS; Ron Lord, FAS; Barbara Fecso, FSA. Meat Animals: Shayle Shagam, ICEC Chair, WAOB, E-mail: [email protected] Sherry Wise, AMS; Mildred M. Haley, ERS; Claire Mezoughem, FAS; Dale Leuck, FSA. Poultry: Shayle Shagam, ICEC Chair, WAOB, E-mail: [email protected] Larry Haller, AMS; David Harvey, ERS; Claire Mezoughem, FAS; Milton Madison, FSA. Dairy: Shayle Shagam, ICEC Chair, WAOB, E-mail: [email protected] Jerry Cessna, AMS; Roger Hoskin, ERS; Paul Kiendl, FAS; Milton Madison, FSA.
In 2010, the WASDE report will be released on Mar. 10, Apr. 9, May 11, Jun. 10, Jul. 9, Aug. 12, Sep. 10, Oct. 8, Nov. 9, and Dec. 10.

WASDE-479-7
T A B L E OF C O N T E N T S
Page
Highlights............................................................................................................... 1
Interagency Commodity Estimates Committees..................................................... 6
World & U.S. Supply & Use for Grains................................................................... 8
World & U.S. Supply & Use for Cotton................................................................... 9
World & U.S. Supply & Use for Oilseeds ............................................................. 10
U.S. Wheat Supply & Use.................................................................................... 11
U.S. Wheat Supply & Use by Class ..................................................................... 11
U.S. Feed Grain & Corn Supply & Use ................................................................ 12
U.S. Sorghum, Barley & Oats Supply & Use........................................................ 13
U.S. Rice Supply & Use....................................................................................... 14
U.S. Soybeans & Products Supply & Use ............................................................ 15
U.S. Sugar Supply & Use..................................................................................... 16
Mexico Sugar Supply and Use............................................................................. 16
U.S. Cotton Supply & Use.................................................................................... 17
World Wheat Supply & Use ................................................................................. 18
World Coarse Grains Supply & Use..................................................................... 20
World Corn Supply & Use .................................................................................... 22
World Rice Supply & Use..................................................................................... 24
World Cotton Supply & Use ................................................................................. 26
World Soybean Supply & Use.............................................................................. 28
World Soybean Meal Supply & Use ..................................................................... 29
World Soybean Oil Supply & Use ........................................................................ 30
U.S. Quarterly Animal Product Production ........................................................... 31
U.S. Quarterly Prices for Animal Products ........................................................... 31
U.S. Meats Supply and Use................................................................................. 32
U.S. Egg Supply & Use........................................................................................ 33
U.S. Milk Supply and Use .................................................................................... 33
U.S. Dairy Prices ................................................................................................. 34
Reliability Tables ................................................................................................. 35
Related USDA Reports ........................................................................................ 38
Metric Conversion Factors ................................................................................... 38
Electronic Access and Subscriptions ................................................................... 40

WASDE-479-8 February 2010 World and U.S. Supply and Use for Grains 1/ Million Metric Tons =============================================================================== : : Total : : Total : Ending Commodity : Output : Supply : Trade 2/ : Use : Stocks =============================================================================== : : World Total grains 3/ : 2007/08 : 2,122.70 2,464.07 275.58 2,101.52 362.55 2008/09 (Est.) : 2,231.58 2,594.13 283.52 2,147.21 446.92 2009/10 (Proj.) : January : 2,204.78 2,649.81 264.45 2,183.32 466.49 February : 2,209.20 2,656.12 265.40 2,188.49 467.63 Wheat : 2007/08 : 610.46 738.05 117.20 616.98 121.07 2008/09 (Est.) : 682.69 803.76 142.89 639.75 164.01 2009/10 (Proj.) : January : 676.13 840.07 123.20 644.47 195.60 February : 677.44 841.45 123.80 645.60 195.86 Coarse grains 4/ : 2007/08 : 1,077.86 1,216.54 127.13 1,056.03 160.51 2008/09 (Est.) : 1,101.58 1,262.08 112.03 1,072.52 189.56 2009/10 (Proj.) : January : 1,093.93 1,282.60 110.34 1,102.38 180.23 February : 1,095.48 1,285.04 110.55 1,105.77 179.27 Rice, milled : 2007/08 : 434.38 509.48 31.24 428.51 80.98 2008/09 (Est.) : 447.31 528.28 28.60 434.94 93.34 2009/10 (Proj.) : January : 434.73 527.14 30.91 436.47 90.66 February : 436.28 529.62 31.05 437.12 92.50 : : United States Total grains 3/ : 2007/08 : 412.03 469.15 107.61 307.23 54.32 2008/09 (Est.) : 400.40 461.84 81.80 314.14 65.90 2009/10 (Proj.) : January : 417.60 489.73 81.41 330.57 77.75 February : 417.60 489.86 80.46 333.01 76.39 Wheat : 2007/08 : 55.82 71.30 34.36 28.61 8.32 2008/09 (Est.) : 68.02 79.80 27.64 34.29 17.87 2009/10 (Proj.) : January : 60.31 81.18 22.45 32.17 26.55 February : 60.31 81.31 22.45 32.17 26.69 Coarse grains 4/ : 2007/08 : 349.86 389.48 69.89 274.53 45.06 2008/09 (Est.) : 325.87 373.98 51.17 275.75 47.06 2009/10 (Proj.) : January : 350.26 399.88 55.79 294.26 49.83 February : 350.26 399.88 54.78 296.67 48.43 Rice, milled : 2007/08 : 6.34 8.37 3.35 4.08 0.94 2008/09 (Est.) : 6.52 8.07 2.99 4.10 0.97 2009/10 (Proj.) : January : 7.03 8.67 3.17 4.14 1.37 February : 7.03 8.67 3.23 4.17 1.27 =============================================================================== 1/ Aggregate of local marketing years. 2/ Based on export estimate. See individual commodity tables for treatment of export/import imbalances. 3/ Wheat, coarse grains and milled rice. 4/ Corn, sorghum, barley, oats, rye, millet and mixed grains (for U.S. excludes millet and mixed grains).
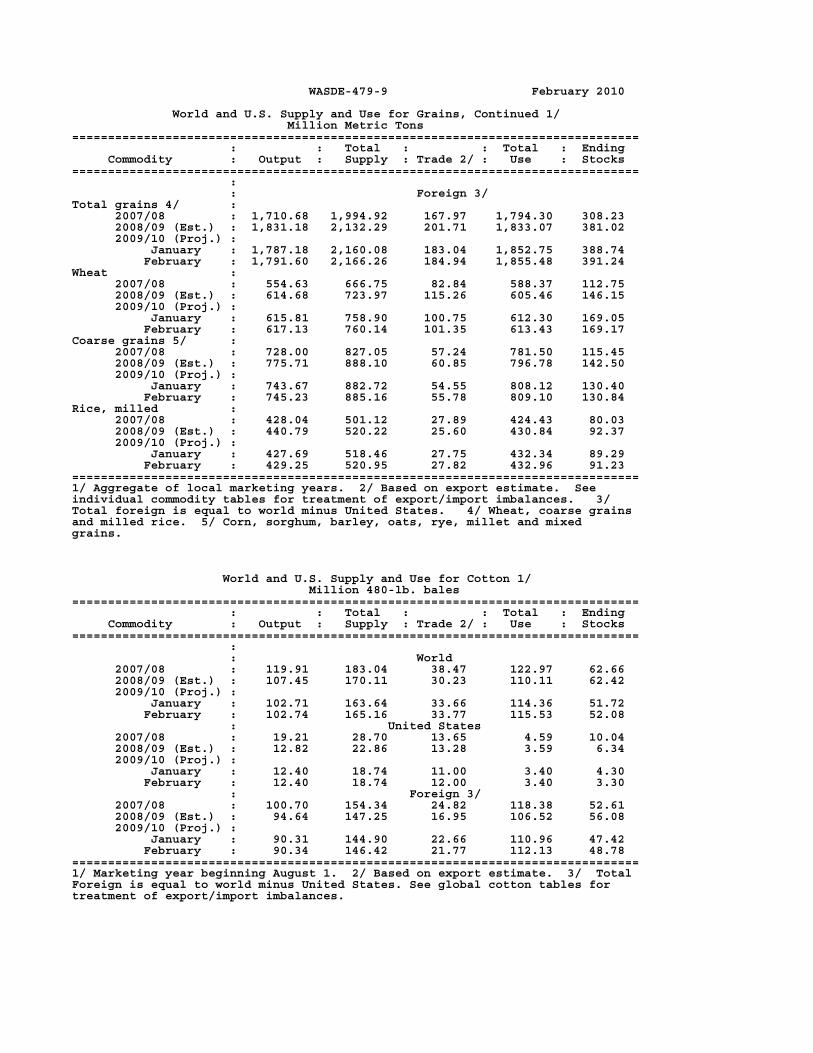
WASDE-479-9 February 2010 World and U.S. Supply and Use for Grains, Continued 1/ Million Metric Tons =============================================================================== : : Total : : Total : Ending Commodity : Output : Supply : Trade 2/ : Use : Stocks =============================================================================== : : Foreign 3/ Total grains 4/ : 2007/08 : 1,710.68 1,994.92 167.97 1,794.30 308.23 2008/09 (Est.) : 1,831.18 2,132.29 201.71 1,833.07 381.02 2009/10 (Proj.) : January : 1,787.18 2,160.08 183.04 1,852.75 388.74 February : 1,791.60 2,166.26 184.94 1,855.48 391.24 Wheat : 2007/08 : 554.63 666.75 82.84 588.37 112.75 2008/09 (Est.) : 614.68 723.97 115.26 605.46 146.15 2009/10 (Proj.) : January : 615.81 758.90 100.75 612.30 169.05 February : 617.13 760.14 101.35 613.43 169.17 Coarse grains 5/ : 2007/08 : 728.00 827.05 57.24 781.50 115.45 2008/09 (Est.) : 775.71 888.10 60.85 796.78 142.50 2009/10 (Proj.) : January : 743.67 882.72 54.55 808.12 130.40 February : 745.23 885.16 55.78 809.10 130.84 Rice, milled : 2007/08 : 428.04 501.12 27.89 424.43 80.03 2008/09 (Est.) : 440.79 520.22 25.60 430.84 92.37 2009/10 (Proj.) : January : 427.69 518.46 27.75 432.34 89.29 February : 429.25 520.95 27.82 432.96 91.23 =============================================================================== 1/ Aggregate of local marketing years. 2/ Based on export estimate. See individual commodity tables for treatment of export/import imbalances. 3/ Total foreign is equal to world minus United States. 4/ Wheat, coarse grains and milled rice. 5/ Corn, sorghum, barley, oats, rye, millet and mixed grains. World and U.S. Supply and Use for Cotton 1/ Million 480-lb. bales =============================================================================== : : Total : : Total : Ending Commodity : Output : Supply : Trade 2/ : Use : Stocks =============================================================================== : : World 2007/08 : 119.91 183.04 38.47 122.97 62.66 2008/09 (Est.) : 107.45 170.11 30.23 110.11 62.42 2009/10 (Proj.) : January : 102.71 163.64 33.66 114.36 51.72 February : 102.74 165.16 33.77 115.53 52.08 : United States 2007/08 : 19.21 28.70 13.65 4.59 10.04 2008/09 (Est.) : 12.82 22.86 13.28 3.59 6.34 2009/10 (Proj.) : January : 12.40 18.74 11.00 3.40 4.30 February : 12.40 18.74 12.00 3.40 3.30 : Foreign 3/ 2007/08 : 100.70 154.34 24.82 118.38 52.61 2008/09 (Est.) : 94.64 147.25 16.95 106.52 56.08 2009/10 (Proj.) : January : 90.31 144.90 22.66 110.96 47.42 February : 90.34 146.42 21.77 112.13 48.78 =============================================================================== 1/ Marketing year beginning August 1. 2/ Based on export estimate. 3/ Total Foreign is equal to world minus United States. See global cotton tables for treatment of export/import imbalances.
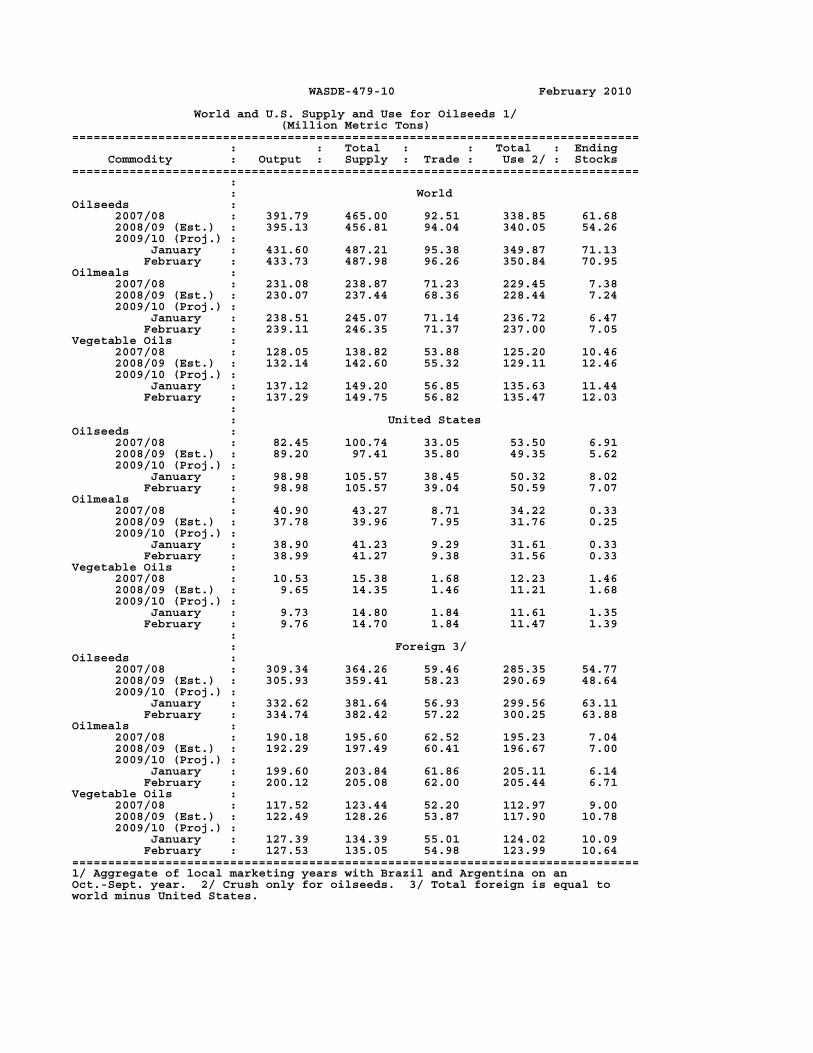
WASDE-479-10 February 2010 World and U.S. Supply and Use for Oilseeds 1/ (Million Metric Tons) =============================================================================== : : Total : : Total : Ending Commodity : Output : Supply : Trade : Use 2/ : Stocks =============================================================================== : : World Oilseeds : 2007/08 : 391.79 465.00 92.51 338.85 61.68 2008/09 (Est.) : 395.13 456.81 94.04 340.05 54.26 2009/10 (Proj.) : January : 431.60 487.21 95.38 349.87 71.13 February : 433.73 487.98 96.26 350.84 70.95 Oilmeals : 2007/08 : 231.08 238.87 71.23 229.45 7.38 2008/09 (Est.) : 230.07 237.44 68.36 228.44 7.24 2009/10 (Proj.) : January : 238.51 245.07 71.14 236.72 6.47 February : 239.11 246.35 71.37 237.00 7.05 Vegetable Oils : 2007/08 : 128.05 138.82 53.88 125.20 10.46 2008/09 (Est.) : 132.14 142.60 55.32 129.11 12.46 2009/10 (Proj.) : January : 137.12 149.20 56.85 135.63 11.44 February : 137.29 149.75 56.82 135.47 12.03 : : United States Oilseeds : 2007/08 : 82.45 100.74 33.05 53.50 6.91 2008/09 (Est.) : 89.20 97.41 35.80 49.35 5.62 2009/10 (Proj.) : January : 98.98 105.57 38.45 50.32 8.02 February : 98.98 105.57 39.04 50.59 7.07 Oilmeals : 2007/08 : 40.90 43.27 8.71 34.22 0.33 2008/09 (Est.) : 37.78 39.96 7.95 31.76 0.25 2009/10 (Proj.) : January : 38.90 41.23 9.29 31.61 0.33 February : 38.99 41.27 9.38 31.56 0.33 Vegetable Oils : 2007/08 : 10.53 15.38 1.68 12.23 1.46 2008/09 (Est.) : 9.65 14.35 1.46 11.21 1.68 2009/10 (Proj.) : January : 9.73 14.80 1.84 11.61 1.35 February : 9.76 14.70 1.84 11.47 1.39 : : Foreign 3/ Oilseeds : 2007/08 : 309.34 364.26 59.46 285.35 54.77 2008/09 (Est.) : 305.93 359.41 58.23 290.69 48.64 2009/10 (Proj.) : January : 332.62 381.64 56.93 299.56 63.11 February : 334.74 382.42 57.22 300.25 63.88 Oilmeals : 2007/08 : 190.18 195.60 62.52 195.23 7.04 2008/09 (Est.) : 192.29 197.49 60.41 196.67 7.00 2009/10 (Proj.) : January : 199.60 203.84 61.86 205.11 6.14 February : 200.12 205.08 62.00 205.44 6.71 Vegetable Oils : 2007/08 : 117.52 123.44 52.20 112.97 9.00 2008/09 (Est.) : 122.49 128.26 53.87 117.90 10.78 2009/10 (Proj.) : January : 127.39 134.39 55.01 124.02 10.09 February : 127.53 135.05 54.98 123.99 10.64 =============================================================================== 1/ Aggregate of local marketing years with Brazil and Argentina on an Oct.-Sept. year. 2/ Crush only for oilseeds. 3/ Total foreign is equal to world minus United States.

WASDE-479-11 February 2010 U.S. Wheat Supply and Use 1/ =============================================================================== : : : 2009/10 Projections Item : 2007/08 : 2008/09 :============================== : : Est. : January February =============================================================================== Area : Million acres Planted : 60.5 63.2 59.1 59.1 Harvested : 51.0 55.7 49.9 49.9 Yield per harvested : Bushels acre : 40.2 44.9 44.4 44.4 : Million bushels Beginning stocks : 456 306 657 657 Production : 2,051 2,499 2,216 2,216 Imports : 113 127 110 115 Supply, total : 2,620 2,932 2,983 2,988 Food : 948 927 940 940 Seed : 88 75 72 72 Feed and residual : 16 258 170 170 Domestic, total : 1,051 1,260 1,182 1,182 Exports : 1,263 1,015 825 825 Use, total : 2,314 2,275 2,007 2,007 Ending stocks : 306 657 976 981 CCC inventory : 0 0 0 0 Free stocks : 306 657 976 981 Outstanding loans : 1 27 30 30 Avg. farm price ($/bu) 2/ : 6.48 6.78 4.70- 5.00 4.75- 4.95 =============================================================================== U.S. Wheat by Class: Supply and Use =============================================================================== Year beginning : Hard : Hard : Soft : : : June 1 : Winter : Spring : Red : White : Durum : Total =============================================================================== 2008/09 (estimated) : Million bushels Beginning stocks : 138 68 55 37 8 306 Production : 1,035 512 614 255 84 2,499 Supply, total 3/ : 1,174 625 702 300 130 2,932 Domestic use : 472 273 332 100 81 1,260 Exports : 447 210 199 136 24 1,015 Use, total : 919 483 531 236 105 2,275 Ending stocks, total : 254 142 171 64 25 657 : 2009/10 (projected) : Beginning stocks : 254 142 171 64 25 657 Production : 919 548 404 237 109 2,216 Supply, total 3/ : 1,174 730 599 311 174 2,988 Domestic use : 443 263 291 101 84 1,182 Exports : 310 195 105 170 45 825 Use, total : 753 458 396 271 129 2,007 Ending stocks, total : February : 421 272 203 40 45 981 January : 431 267 196 42 40 976 =============================================================================== Note: Totals may not add due to rounding. 1/ Marketing year beginning June 1. 2/ Marketing-year weighted average price received by farmers. 3/ Includes imports.

WASDE-479-12 February 2010 U.S. Feed Grain and Corn Supply and Use 1/ =============================================================================== : : : 2009/10 Projections Item : 2007/08 : 2008/09 :============================== : : Est. : January February =============================================================================== FEED GRAINS : Area : Million acres Planted : 109.0 101.8 100.1 100.1 Harvested : 98.3 91.0 89.6 89.6 Yield per harvested : Metric tons acre : 3.56 3.58 3.91 3.91 : Million metric tons Beginning stocks : 36.2 45.1 47.0 47.0 Production : 349.7 325.7 350.1 350.1 Imports : 3.3 3.0 2.4 2.4 Supply, total : 389.1 373.7 399.6 399.6 Feed and residual : 157.1 142.5 147.9 147.9 Food, seed & industrial : 117.1 133.0 146.0 148.4 Domestic, total : 274.2 275.5 294.0 296.4 Exports : 69.9 51.2 55.8 54.8 Use, total : 344.1 326.6 349.7 351.1 Ending stocks, total : 45.1 47.0 49.8 48.4 CCC inventory : 0.0 0.0 0.0 0.0 Free stocks : 45.1 47.0 49.8 48.4 Outstanding loans : 2.7 4.4 5.8 5.8 : CORN : Area : Million acres Planted : 93.5 86.0 86.5 86.5 Harvested : 86.5 78.6 79.6 79.6 Yield per harvested : Bushels acre : 150.7 153.9 165.2 165.2 : Million bushels Beginning stocks : 1,304 1,624 1,673 1,673 Production : 13,038 12,092 13,151 13,151 Imports : 20 14 10 10 Supply, total : 14,362 13,729 14,834 14,834 Feed and residual : 5,913 5,246 5,550 5,550 Food, seed & industrial : 4,387 4,953 5,470 5,565 Ethanol for fuel 2/ : 3,049 3,677 4,200 4,300 Domestic, total : 10,300 10,198 11,020 11,115 Exports : 2,437 1,858 2,050 2,000 Use, total : 12,737 12,056 13,070 13,115 Ending stocks, total : 1,624 1,673 1,764 1,719 CCC inventory : 0 0 0 0 Free stocks : 1,624 1,673 1,764 1,719 Outstanding loans : 106 171 225 225 Avg. farm price ($/bu) 3/ : 4.20 4.06 3.40- 4.00 3.45- 3.95 =============================================================================== Note: Totals may not add due to rounding. 1/ Marketing year beginning September 1 for corn and sorghum; June 1 for barley and oats. 2/ For a further breakout of FSI corn uses including ethanol, see the ERS Feed Outlook table 5, or Feed Grains Database at "www.ers.usda.gov/db/feedgrains." 3/ Marketing-year weighted average price received by farmers.

WASDE-479-13 February 2010 U.S. Sorghum, Barley and Oats Supply and Use 1/ =============================================================================== : : : 2009/10 Projections Item : 2007/08 : 2008/09 :============================== : : Est. : January February =============================================================================== : Million bushels SORGHUM : Area planted (mil. acres) : 7.7 8.3 6.6 6.6 Area harv. (mil. acres) : 6.8 7.3 5.5 5.5 Yield (bushels/acre) : 73.2 65.0 69.4 69.4 Beginning stocks : 32 53 55 55 Production : 497 472 383 383 Imports : 0 0 0 0 Supply, total : 530 525 438 438 Feed and residual : 165 232 150 150 Food, seed & industrial : 35 95 90 90 Total domestic : 200 327 240 240 Exports : 277 143 140 150 Use, total : 477 471 380 390 Ending stocks, total : 53 55 58 48 Avg. farm price ($/bu) 2/ : 4.08 3.20 3.05- 3.55 3.10- 3.50 : BARLEY : Area planted (mil. acres) : 4.0 4.2 3.6 3.6 Area harv. (mil. acres) : 3.5 3.8 3.1 3.1 Yield (bushels/acre) : 60.0 63.6 73.0 73.0 Beginning stocks : 69 68 89 89 Production : 210 240 227 227 Imports : 29 29 25 25 Supply, total : 308 337 341 341 Feed and residual : 30 67 50 50 Food, seed & industrial : 169 169 170 170 Total domestic : 199 236 220 220 Exports : 41 13 5 5 Use, total : 240 249 225 225 Ending stocks, total : 68 89 116 116 Avg. farm price ($/bu) 2/ : 4.02 5.37 4.20- 4.60 4.25- 4.55 : OATS : Area planted (mil. acres) : 3.8 3.2 3.4 3.4 Area harv. (mil. acres) : 1.5 1.4 1.4 1.4 Yield (bushels/acre) : 60.1 63.7 67.5 67.5 Beginning stocks : 51 67 84 84 Production : 90 89 93 93 Imports : 123 115 95 95 Supply, total : 264 270 272 272 Feed and residual : 120 109 125 125 Food, seed & industrial : 74 74 75 75 Total domestic : 195 183 200 200 Exports : 3 3 3 3 Use, total : 198 186 203 203 Ending stocks, total : 67 84 69 69 Avg. farm price ($/bu) 2/ : 2.63 3.15 2.00- 2.20 2.00- 2.20 =============================================================================== Note: Totals may not add due to rounding. 1/ Marketing year beginning September 1 for sorghum, June 1 for barley and oats. 2/ Marketing-year weighted average price received by farmers.

WASDE-479-14 February 2010 U.S. Rice Supply and Use 1/ (Rough Equivalent of Rough and Milled Rice) =============================================================================== : : : 2009/10 Projections Item : 2007/08 : 2008/09 :============================== : : Est. : January February =============================================================================== TOTAL : Area : Million acres Planted : 2.76 3.00 3.14 3.14 Harvested : 2.75 2.98 3.10 3.10 Yield per harvested : Pounds acre : 7,219 6,846 7,085 7,085 : : Million hundredweight Beginning stocks 2/ : 39.3 29.4 30.4 30.4 Production : 198.4 203.7 219.9 219.9 Imports : 23.9 19.2 21.0 21.0 Supply, total : 261.6 252.4 271.3 271.3 Domestic & residual 3/ : 127.4 128.4 129.5 130.5 Exports, total 4/ : 104.7 93.6 99.0 101.0 Rough : 37.7 31.1 35.0 37.0 Milled (rough equiv.) : 67.1 62.5 64.0 64.0 Use, total : 232.2 222.0 228.5 231.5 Ending stocks : 29.4 30.4 42.8 39.8 Avg. milling yield (%) 5/ : 70.5 70.5 70.5 70.5 Avg. farm price ($/cwt) 6/ : 12.80 16.80 13.65-14.65 14.05-14.55 : LONG GRAIN : Harvested acres (mil.) : 2.05 2.35 2.27 2.27 Yield (pounds/acre) : 6,980 6,522 6,743 6,743 Beginning stocks : 28.5 19.0 20.1 20.1 Production : 143.2 153.3 152.7 152.7 Supply, total 7/ : 189.4 188.2 190.8 190.8 Domestic & Residual 3/ : 91.3 103.0 99.5 99.5 Exports 8/ : 79.1 65.1 69.0 70.0 Use, total : 170.4 168.1 168.5 169.5 Ending stocks : 19.0 20.1 22.3 21.3 Avg. farm price ($/cwt) 6/ : 12.40 14.90 12.50-13.50 12.90-13.40 : MEDIUM & SHORT GRAIN : Harvested acres (mil.) : 0.70 0.63 0.84 0.84 Yield (pounds/acre) : 7,924 8,063 8,010 8,010 Beginning stocks : 10.0 9.1 8.0 8.0 Production : 55.2 50.5 67.1 67.1 Supply, total 7/ : 70.8 61.9 78.1 78.1 Domestic & Residual 3/ : 36.1 25.3 30.0 31.0 Exports 8/ : 25.7 28.5 30.0 31.0 Use, total : 61.8 53.9 60.0 62.0 Ending stocks : 9.1 8.0 18.1 16.1 Avg. farm price ($/cwt) 6/ : 14.60 24.80 17.00-18.00 17.50-18.00 =============================================================================== Note: Totals may not add due to rounding. 1/ Marketing year beginning August 1. 2/ Includes the following quantities of broken kernel rice (type undetermined) not included in estimates of beginning stocks by type (in mil. cwt): 2007/08-0.8; 2008/09-1.3; 2009/10-2.4. 3/ Residual includes unreported use, processing losses, and estimating errors. Use by type may not add to total rice use because of the difference in brokens between beginning and ending stocks. 4/ Includes rough rice and milled rice exports. Milled rice exports are converted to an equivalent rough basis. 5/ Expressed as a percent, i.e., the total quantity of whole kernel and broken rice produced divided by the quantity of rough rice milled. 6/ Marketing-year weighted average price received by farmers. 7/ Includes imports. 8/ Exports by type of rice are estimated.

WASDE-479-15 February 2010 U.S. Soybeans and Products Supply and Use (Domestic Measure) 1/ =============================================================================== : : : 2009/10 Projections Item : 2007/08 : 2008/09 :=============================== : : Est. : January February =============================================================================== SOYBEANS: : Million acres Area : Planted : 64.7 75.7 77.5 77.5 Harvested : 64.1 74.7 76.4 76.4 : : Bushels Yield per harvested : acre : 41.7 39.7 44.0 44.0 : : Million bushels : Beginning stocks : 574 205 138 138 Production : 2,677 2,967 3,361 3,361 Imports : 10 13 8 8 Supply, total : 3,261 3,185 3,507 3,507 Crushings : 1,803 1,662 1,710 1,720 Exports : 1,159 1,283 1,375 1,400 Seed : 93 95 94 94 Residual : 0 6 83 83 Use, total : 3,056 3,047 3,262 3,297 Ending stocks : 205 138 245 210 Avg. farm price ($/bu) 2/ : 10.10 9.97 8.90-10.40 8.70 -10.20 : : : Million pounds SOYBEAN OIL: : Beginning stocks : 3,085 2,485 2,742 2,742 Production : 20,580 18,746 19,085 19,160 Imports : 65 90 75 75 Supply, total : 23,730 21,321 21,902 21,977 Domestic : 18,335 16,385 16,500 16,500 For methyl ester : 3,245 1,907 2,200 2,200 Exports : 2,911 2,193 3,250 3,250 Use, total : 21,246 18,578 19,750 19,750 Ending stocks : 2,485 2,742 2,152 2,227 Average price (c/lb) 2/ : 52.03 32.16 36.00- 33.50- : 39.00 36.50 : : Thousand short tons SOYBEAN MEAL: : Beginning stocks : 343 294 235 235 Production : 42,284 39,104 40,425 40,525 Imports : 141 88 140 140 Supply, total : 42,768 39,486 40,800 40,900 Domestic : 33,232 30,743 30,600 30,600 Exports : 9,242 8,508 9,900 10,000 Use, total : 42,474 39,251 40,500 40,600 Ending stocks : 294 235 300 300 Average price ($/s.t.) 2/ : 335.94 331.17 265.00- 270.00- : 315.00 320.00 =============================================================================== Note: Reliability calculations at end of report. 1/ Marketing year beginning September 1 for soybeans; October 1 for soybean oil and meal. 2/ Prices: soybeans, marketing year weighted average price received by farmers; for oil, simple average of crude soybean oil, Decatur; for meal, simple average of 48 percent, Decatur.

WASDE-479-16 February 2010 U.S. Sugar Supply and Use 1/ ====================================================================== : : : 2009/10 Projections Item : 2007/08 : 2008/09 :======================= : : Est. : January February ====================================================================== : 1,000 short tons, raw value : Beginning stocks : 1,799 1,660 1,451 1,451 Production 2/ : 8,152 7,484 7,837 7,972 Beet sugar : 4,721 4,166 4,400 4,500 Cane sugar : 3,431 3,318 3,437 3,472 Florida : 1,645 1,577 1,680 1,665 Hawaii : 182 192 137 137 Louisiana : 1,446 1,397 1,450 1,500 Texas : 158 152 170 170 Imports : 2,620 3,082 2,377 2,157 TRQ 3/ : 1,354 1,370 1,257 1,257 Other program 4/ : 565 308 350 350 Other 5/ : 701 1,404 770 550 Mexico : 694 1,402 760 540 Total supply : 12,571 12,226 11,665 11,580 : Exports : 203 137 150 150 Deliveries : 10,708 10,638 10,375 10,375 Food 6/ : 10,506 10,479 10,140 10,140 Other 7/ : 202 159 235 235 Miscellaneous : 0 0 0 0 Total use : 10,911 10,775 10,525 10,525 Ending stocks : 1,660 1,451 1,140 1,055 : Stocks to use ratio : 15.2 13.5 10.8 10.0 ====================================================================== 1/ Fiscal years beginning Oct 1. Includes Puerto Rico. Historical data are from FSA, "Sweetener Market Data" (SMD) except imports (U.S. Customs Service, Census Bureau). 2/ Production projections for 2009/10 are based on Crop Production and trend recovery rates. 3/ For 2009/10, includes shortfall of 200,000 tons. 4/ Includes sugar under the re-export and polyhydric alcohol programs. 5/ For 2009/10, other high-tier (10) and other (0). 6/Combines SMD deliveries for domestic human food use, SMD miscellaneous uses, and the difference between SMD imports and WASDE imports. 7/ Transfers to sugar- containing products for reexport, and for nonedible alcohol and feed. Mexico Sugar Supply and Use and High Fructose Corn Syrup Imports 1/ ========================================================================== : Supply : Use : Fiscal :====================================================: Ending year : Beginning : Production: Imports : Domestic: Exports: stocks : stocks : : : 2/ : : ========================================================================== 1,000 metric tons, raw value Sugar 2008/09 est. Jan 1,975 5,260 160 5,540 1,367 488 Feb 1,975 5,260 160 5,540 1,367 488 2009/10 proj. Jan 488 5,300 720 5,300 690 518 Feb 488 5,100 720 5,300 490 518` ========================================================================== 1/ U.S. HFCS exports to Mexico (metric tons, dry-weight basis): Oct-Nov 2008 = 53,366; Oct-Nov 2009 = 136,491; Oct-Sep 2008/09 = 297,231. Footnote source: U.S. Census Bureau. 2/Includes domestic consumption and Mexico's products export program (IMMEX).

WASDE-479-17 February 2010 U. S. Cotton Supply and Use 1/ =============================================================================== : : : 2009/10 Projections Item : 2007/08 : 2008/09 :=============================== : : Est. : January February =============================================================================== : Million acres Area : Planted : 10.83 9.47 9.15 9.15 Harvested : 10.49 7.57 7.69 7.69 : : Pounds Yield per harvested : acre : 879 813 774 774 : : Million 480 pound bales : Beginning stocks 2/ : 9.48 10.04 6.34 6.34 Production : 19.21 12.82 12.40 12.40 Imports : 0.01 0.00 0.01 0.01 Supply, total : 28.70 22.86 18.74 18.74 Domestic use : 4.59 3.59 3.40 3.40 Exports : 13.65 13.28 11.00 12.00 Use, total : 18.24 16.86 14.40 15.40 Unaccounted 3/ : 0.41 -0.34 0.04 0.04 Ending stocks : 10.04 6.34 4.30 3.30 : Avg. farm price 4/ : 59.3 47.8 57.0-64.0 59.0-65.0 =============================================================================== Note: Reliability calculations at end of report. 1/ Upland and extra-long staple; marketing year beginning August 1. Totals may not add due to rounding. 2/ Based on Bureau of Census data. 3/ Reflects the difference between the previous season's supply less total use and ending stocks based on Bureau of Census data. 4/ Cents per pound for upland cotton. ===============================================================================

WASDE-479-18 February 2010 World Wheat Supply and Use 1/ (Million Metric Tons) =============================================================================== : Supply : Use : :=========================:=======================:Ending Region : : : : Domestic 2/ : :stocks :Beginning:Produc-: :===============: : : stocks : tion :Imports: Feed : Total :Exports: =============================================================================== : : 2007/08 : World 3/ : 127.59 610.46 113.45 96.32 616.98 117.20 121.07 United States : 12.41 55.82 3.07 0.43 28.61 34.36 8.32 Total foreign : 115.18 554.63 110.38 95.88 588.37 82.84 112.75 Major exporters 4/ : 26.26 171.76 7.47 58.18 134.95 47.07 23.47 Argentina : 1.37 18.00 0.02 0.08 5.13 11.19 3.07 Australia : 3.95 13.57 0.12 3.50 6.50 7.49 3.65 Canada : 6.87 20.05 0.39 2.17 6.79 16.12 4.41 EU-27 5/ : 14.08 120.13 6.94 52.44 116.54 12.27 12.34 Major importers 6/ : 62.16 175.24 59.10 10.76 225.97 8.72 61.82 Brazil : 0.98 3.83 6.71 0.10 10.30 0.77 0.45 China : 38.45 109.30 0.05 8.00 106.00 2.84 38.96 Select. Mideast 7/ : 6.73 20.37 9.32 1.15 29.20 0.56 6.65 N. Africa 8/ : 9.75 13.95 21.73 0.25 36.04 0.26 9.13 Pakistan : 1.99 23.30 1.49 0.40 22.40 2.20 2.18 Southeast Asia 9/ : 2.61 0.00 10.96 0.46 10.52 0.50 2.55 Selected other : India : 4.50 75.81 1.96 0.20 76.42 0.05 5.80 FSU-12 : 9.26 92.54 6.02 23.53 75.00 22.21 10.61 Russia : 2.23 49.40 0.44 15.05 37.70 12.55 1.82 Kazakhstan : 1.65 16.45 0.04 2.70 7.50 8.18 2.46 Ukraine : 1.38 13.90 0.33 3.00 12.30 1.24 2.07 : : 2008/09 (Estimated) : World 3/ : 121.07 682.69 136.52 112.70 639.75 142.89 164.01 United States : 8.32 68.02 3.46 7.03 34.29 27.64 17.87 Total foreign : 112.75 614.68 133.06 105.67 605.46 115.26 146.15 Major exporters 4/ : 23.47 209.63 8.27 68.04 147.36 65.54 28.47 Argentina : 3.07 9.00 0.03 0.08 4.98 6.69 0.43 Australia : 3.65 20.94 0.13 3.75 6.85 14.72 3.14 Canada : 4.41 28.61 0.38 3.21 8.03 18.81 6.56 EU-27 5/ : 12.34 151.08 7.74 61.00 127.50 25.32 18.35 Major importers 6/ : 61.82 172.62 73.89 9.22 228.51 6.26 73.56 Brazil : 0.45 5.88 6.00 0.20 10.70 0.40 1.23 China : 38.96 112.46 0.48 5.00 102.50 0.72 48.69 Select. Mideast 7/ : 6.65 13.31 20.36 1.55 31.60 0.71 8.01 N. Africa 8/ : 9.13 14.59 23.47 0.25 37.35 0.23 9.60 Pakistan : 2.18 21.50 3.13 0.40 22.80 2.10 1.91 Southeast Asia 9/ : 2.55 0.00 11.96 1.42 11.66 0.42 2.43 Selected other : India : 5.80 78.57 0.01 0.10 70.77 0.10 13.51 FSU-12 : 10.61 115.59 6.54 24.88 76.57 37.66 18.51 Russia : 1.82 63.70 0.20 16.20 38.90 18.39 8.43 Kazakhstan : 2.46 12.55 0.12 2.70 7.53 5.70 1.90 Ukraine : 2.07 25.90 0.07 2.90 11.90 13.04 3.11 =============================================================================== 1/ Aggregate of local marketing years. 2/ Total foreign and world use adjusted to reflect the differences in world imports and exports. 3/ World imports and exports may not balance due to differences in marketing years, grain in transit, and reporting discrepancies in some countries. 4/ Argentina, Australia, Canada, and the EU-27. 5/ Trade excludes intra-trade. 6/ Brazil, China, Japan, Mexico, N. Africa, Pakistan, selected Middle East, and Southeast Asia. 7/ Lebanon, Iraq, Iran, Israel, Jordan, Kuwait, Saudi Arabia, Yemen, United Arab Emirates, and Oman. 8/ Algeria, Egypt, Libya, Morocco, and Tunisia. 9/ Indonesia, Malaysia, Philippines, Thailand, and Vietnam.
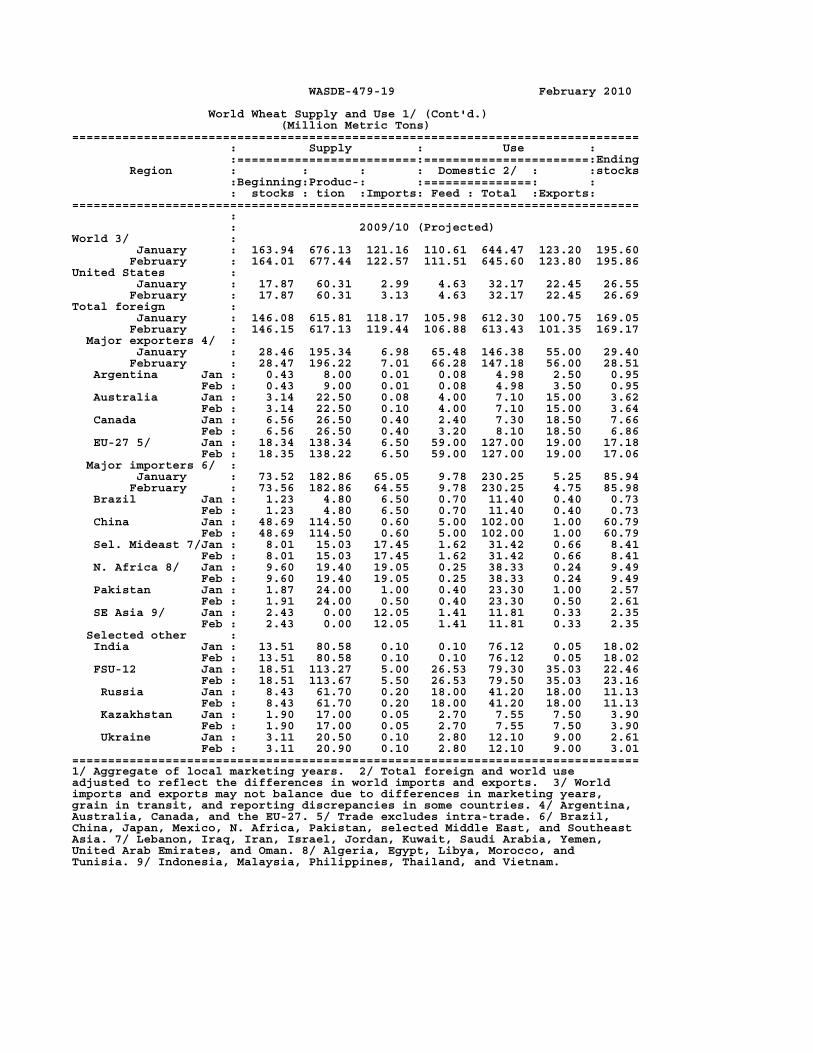
WASDE-479-19 February 2010 World Wheat Supply and Use 1/ (Cont'd.) (Million Metric Tons) =============================================================================== : Supply : Use : :=========================:=======================:Ending Region : : : : Domestic 2/ : :stocks :Beginning:Produc-: :===============: : : stocks : tion :Imports: Feed : Total :Exports: =============================================================================== : : 2009/10 (Projected) World 3/ : January : 163.94 676.13 121.16 110.61 644.47 123.20 195.60 February : 164.01 677.44 122.57 111.51 645.60 123.80 195.86 United States : January : 17.87 60.31 2.99 4.63 32.17 22.45 26.55 February : 17.87 60.31 3.13 4.63 32.17 22.45 26.69 Total foreign : January : 146.08 615.81 118.17 105.98 612.30 100.75 169.05 February : 146.15 617.13 119.44 106.88 613.43 101.35 169.17 Major exporters 4/ : January : 28.46 195.34 6.98 65.48 146.38 55.00 29.40 February : 28.47 196.22 7.01 66.28 147.18 56.00 28.51 Argentina Jan : 0.43 8.00 0.01 0.08 4.98 2.50 0.95 Feb : 0.43 9.00 0.01 0.08 4.98 3.50 0.95 Australia Jan : 3.14 22.50 0.08 4.00 7.10 15.00 3.62 Feb : 3.14 22.50 0.10 4.00 7.10 15.00 3.64 Canada Jan : 6.56 26.50 0.40 2.40 7.30 18.50 7.66 Feb : 6.56 26.50 0.40 3.20 8.10 18.50 6.86 EU-27 5/ Jan : 18.34 138.34 6.50 59.00 127.00 19.00 17.18 Feb : 18.35 138.22 6.50 59.00 127.00 19.00 17.06 Major importers 6/ : January : 73.52 182.86 65.05 9.78 230.25 5.25 85.94 February : 73.56 182.86 64.55 9.78 230.25 4.75 85.98 Brazil Jan : 1.23 4.80 6.50 0.70 11.40 0.40 0.73 Feb : 1.23 4.80 6.50 0.70 11.40 0.40 0.73 China Jan : 48.69 114.50 0.60 5.00 102.00 1.00 60.79 Feb : 48.69 114.50 0.60 5.00 102.00 1.00 60.79 Sel. Mideast 7/Jan : 8.01 15.03 17.45 1.62 31.42 0.66 8.41 Feb : 8.01 15.03 17.45 1.62 31.42 0.66 8.41 N. Africa 8/ Jan : 9.60 19.40 19.05 0.25 38.33 0.24 9.49 Feb : 9.60 19.40 19.05 0.25 38.33 0.24 9.49 Pakistan Jan : 1.87 24.00 1.00 0.40 23.30 1.00 2.57 Feb : 1.91 24.00 0.50 0.40 23.30 0.50 2.61 SE Asia 9/ Jan : 2.43 0.00 12.05 1.41 11.81 0.33 2.35 Feb : 2.43 0.00 12.05 1.41 11.81 0.33 2.35 Selected other : India Jan : 13.51 80.58 0.10 0.10 76.12 0.05 18.02 Feb : 13.51 80.58 0.10 0.10 76.12 0.05 18.02 FSU-12 Jan : 18.51 113.27 5.00 26.53 79.30 35.03 22.46 Feb : 18.51 113.67 5.50 26.53 79.50 35.03 23.16 Russia Jan : 8.43 61.70 0.20 18.00 41.20 18.00 11.13 Feb : 8.43 61.70 0.20 18.00 41.20 18.00 11.13 Kazakhstan Jan : 1.90 17.00 0.05 2.70 7.55 7.50 3.90 Feb : 1.90 17.00 0.05 2.70 7.55 7.50 3.90 Ukraine Jan : 3.11 20.50 0.10 2.80 12.10 9.00 2.61 Feb : 3.11 20.90 0.10 2.80 12.10 9.00 3.01 =============================================================================== 1/ Aggregate of local marketing years. 2/ Total foreign and world use adjusted to reflect the differences in world imports and exports. 3/ World imports and exports may not balance due to differences in marketing years, grain in transit, and reporting discrepancies in some countries. 4/ Argentina, Australia, Canada, and the EU-27. 5/ Trade excludes intra-trade. 6/ Brazil, China, Japan, Mexico, N. Africa, Pakistan, selected Middle East, and Southeast Asia. 7/ Lebanon, Iraq, Iran, Israel, Jordan, Kuwait, Saudi Arabia, Yemen, United Arab Emirates, and Oman. 8/ Algeria, Egypt, Libya, Morocco, and Tunisia. 9/ Indonesia, Malaysia, Philippines, Thailand, and Vietnam.

WASDE-479-20 February 2010 World Coarse Grain Supply and Use 1/ (Million Metric Tons) =============================================================================== : Supply : Use : :=========================:=======================:Ending Region : : : : Domestic 2/ : :stocks :Beginning:Produc-: :===============: : : stocks : tion :Imports: Feed : Total :Exports: =============================================================================== : : 2007/08 : World 3/ : 138.68 1077.86 126.70 655.42 1056.03 127.13 160.51 United States : 36.17 349.86 3.45 157.23 274.53 69.89 45.06 Total foreign : 102.50 728.00 123.25 498.19 781.50 57.24 115.45 Major exporters 4/ : 8.58 81.40 3.55 35.68 51.09 30.14 12.30 Argentina : 2.10 26.97 0.13 7.24 9.90 16.93 2.37 Australia : 1.21 12.90 0.03 5.67 7.02 4.44 2.67 Canada : 3.50 27.84 3.25 18.44 24.02 6.57 4.01 Major importers 5/ : 35.82 216.94 97.81 236.97 310.44 5.41 34.71 EU-27 6/ : 15.14 136.12 20.29 118.90 154.16 4.63 12.77 Japan : 1.76 0.20 19.21 14.55 19.46 0.00 1.71 Mexico : 3.43 30.58 10.98 23.62 40.31 0.11 4.57 N. Afr & Mideast 7/: 8.32 24.94 19.61 38.86 45.80 0.03 7.04 Saudi Arabia : 2.61 0.33 9.37 9.43 9.68 0.00 2.63 Southeast Asia 8/ : 2.56 24.37 4.31 20.00 27.41 0.65 3.19 South Korea : 1.32 0.35 9.36 7.10 8.95 0.00 2.08 Selected other : Brazil : 3.77 61.34 0.97 38.18 45.28 7.94 12.87 China : 38.03 159.10 1.16 105.82 157.01 0.85 40.43 FSU-12 : 5.09 53.91 1.00 34.81 50.44 5.26 4.30 Russia : 1.67 29.33 0.55 18.73 28.88 1.22 1.44 Ukraine : 1.97 14.59 0.03 8.74 11.84 3.14 1.61 : : 2008/09 (Estimated) : World 3/ : 160.51 1101.58 110.08 644.32 1072.52 112.03 189.56 United States : 45.06 325.87 3.05 142.53 275.75 51.17 47.06 Total foreign : 115.45 775.71 107.02 501.79 796.78 60.85 142.50 Major exporters 4/ : 12.30 68.44 2.19 30.56 46.79 22.65 13.49 Argentina : 2.37 16.22 0.13 4.11 6.67 11.62 0.42 Australia : 2.67 11.97 0.00 5.34 6.70 4.61 3.33 Canada : 4.01 27.17 1.90 16.66 22.85 3.87 6.36 Major importers 5/ : 34.71 242.66 82.27 233.73 311.14 6.65 41.86 EU-27 6/ : 12.77 161.58 3.41 113.90 152.10 5.55 20.10 Japan : 1.71 0.22 19.61 14.80 19.71 0.00 1.83 Mexico : 4.57 31.49 10.47 25.22 42.14 0.16 4.22 N. Afr & Mideast 7/: 7.04 24.19 23.10 39.14 46.35 0.15 7.83 Saudi Arabia : 2.63 0.34 9.09 9.33 9.58 0.01 2.47 Southeast Asia 8/ : 3.19 24.43 4.67 20.36 28.27 0.78 3.24 South Korea : 2.08 0.36 7.25 6.41 8.20 0.00 1.49 Selected other : Brazil : 12.87 53.62 1.60 39.28 47.50 7.01 13.58 China : 40.43 172.70 1.65 110.83 160.43 0.22 54.13 FSU-12 : 4.30 78.14 0.55 40.58 57.44 17.05 8.51 Russia : 1.44 40.70 0.16 21.75 32.65 4.79 4.85 Ukraine : 1.61 26.22 0.03 10.10 13.72 11.88 2.26 =============================================================================== 1/ Aggregate of local marketing years. Coarse grains include corn, sorghum, barley, oats, rye, millet, and mixed grains (for U.S. excludes millet and mixed grains). 2/ Total foreign and world use adjusted to reflect the differences in world imports and exports. 3/ World imports and exports may not balance due to differences in marketing years, grain in transit, and reporting discrepancies in some countries. 4/ Argentina, Australia, Canada, and South Africa. 5/ The EU-27, Mexico, Japan, selected North Africa and Middle East, South Korea, Southeast Asia, and Taiwan. 6/ Trade excludes intra-trade. 7/ Algeria, Egypt, Iran, Israel, Jordan, Libya, Morocco, Syria, Tunisia, and Turkey. 8/ Indonesia, Malaysia, Philippines, Thailand, and Vietnam.

WASDE-479-21 February 2010 World Coarse Grain Supply and Use 1/ (Cont'd.) (Million Metric Tons) =============================================================================== : Supply : Use : :=========================:=======================:Ending Region : : : : Domestic 2/ : :stocks :Beginning:Produc-: :===============: : : stocks : tion :Imports: Feed : Total :Exports: =============================================================================== : : 2009/10 (Projected) World 3/ : January : 188.67 1093.93 107.69 660.28 1102.38 110.34 180.23 February : 189.56 1095.48 107.94 661.07 1105.77 110.55 179.27 United States : January : 47.06 350.26 2.56 148.01 294.26 55.79 49.83 February : 47.06 350.26 2.56 148.01 296.67 54.78 48.43 Total foreign : January : 141.61 743.67 105.13 512.28 808.12 54.55 130.40 February : 142.50 745.23 105.38 513.06 809.10 55.78 130.84 Major exporters 4/ : January : 13.39 66.67 2.23 31.75 48.54 20.03 13.71 February : 13.49 68.87 2.23 33.05 49.84 21.53 13.22 Argentina Jan : 0.74 20.47 0.03 6.16 8.87 9.91 2.46 Feb : 0.42 22.67 0.03 7.36 10.07 11.41 1.64 Australia Jan : 2.91 11.82 0.00 5.22 6.69 4.96 3.08 Feb : 3.33 11.82 0.00 5.32 6.79 4.96 3.40 Canada Jan : 6.36 22.37 2.07 15.81 22.17 3.63 5.00 Feb : 6.36 22.37 2.07 15.81 22.17 3.63 5.00 Major importers 5/ : January : 41.06 237.47 80.27 235.49 314.65 5.05 39.10 February : 41.86 237.16 80.48 235.39 314.56 4.97 39.97 EU-27 6/ Jan : 20.14 152.89 2.88 114.20 153.30 3.81 18.80 Feb : 20.10 152.58 2.78 114.10 153.21 3.28 18.98 Japan Jan : 1.83 0.19 19.36 14.58 19.51 0.00 1.88 Feb : 1.83 0.19 19.46 14.68 19.61 0.00 1.88 Mexico Jan : 4.24 29.33 12.35 25.33 42.45 0.05 3.42 Feb : 4.22 29.33 12.45 25.43 42.55 0.05 3.40 N Afr/M.East 7/Jan : 7.26 29.21 19.26 40.42 47.88 0.31 7.55 Feb : 7.83 29.21 19.16 39.92 47.38 0.76 8.07 Saudi Arabia Jan : 2.49 0.34 9.80 9.83 10.08 0.00 2.55 Feb : 2.47 0.34 9.81 9.83 10.08 0.00 2.53 S.-east Asia 8/Jan : 2.94 25.06 4.33 20.46 28.56 0.89 2.88 Feb : 3.24 25.06 4.53 20.76 28.86 0.89 3.08 South Korea Jan : 1.49 0.35 7.57 6.05 8.03 0.00 1.38 Feb : 1.49 0.35 7.57 6.05 8.03 0.00 1.38 Selected other : Brazil Jan : 13.59 53.61 0.75 40.68 48.28 9.10 10.57 Feb : 13.58 53.61 0.75 40.68 48.28 9.10 10.57 China Jan : 54.13 162.00 1.59 116.68 167.57 0.57 49.57 Feb : 54.13 162.00 1.64 116.68 167.57 0.57 49.62 FSU-12 Jan : 8.43 67.77 0.60 39.60 56.01 14.35 6.45 Feb : 8.51 67.44 0.55 39.32 55.80 14.15 6.56 Russia Jan : 4.75 31.80 0.35 20.95 31.30 2.45 3.15 Feb : 4.85 31.80 0.30 20.98 31.45 2.45 3.05 Ukraine Jan : 2.28 24.45 0.02 10.35 14.00 11.02 1.73 Feb : 2.26 24.12 0.02 10.00 13.59 11.02 1.79 =============================================================================== 1/ Aggregate of local marketing years. Coarse grains include corn, sorghum, barley, oats, rye, millet, and mixed grains (for U.S. excludes millet and mixed grains). 2/ Total foreign and world use adjusted to reflect the differences in world imports and exports. 3/ World imports and exports may not balance due to differences in marketing years, grain in transit, and reporting discrepancies in some countries. 4/ Argentina, Australia, Canada, and South Africa. 5/ The EU-27, Mexico, Japan, selected North Africa and Middle East, South Korea, Southeast Asia, and Taiwan. 6/ Trade excludes intra-trade. 7/ Algeria, Egypt, Iran, Israel, Jordan, Libya, Morocco, Syria, Tunisia, and Turkey. 8/ Indonesia, Malaysia, Philippines, Thailand, and Vietnam.

WASDE-479-22 February 2010 World Corn Supply and Use 1/ (Million Metric Tons) =============================================================================== : Supply : Use : :=========================:=======================:Ending Region : : : : Domestic 2/ : :stocks :Beginning:Produc-: :===============: : : stocks : tion :Imports: Feed : Total :Exports: =============================================================================== : : 2007/08 : World 3/ : 108.87 791.87 98.35 496.33 771.13 98.61 129.60 United States : 33.11 331.18 0.51 150.21 261.63 61.91 41.26 Total foreign : 75.75 460.69 97.84 346.12 509.50 36.70 88.35 Major exporters 4/ : 3.32 35.16 0.15 9.40 16.60 16.96 5.08 Argentina : 1.66 22.00 0.12 5.10 7.00 14.80 1.99 South Africa : 1.66 13.16 0.03 4.30 9.60 2.16 3.09 Major importers 5/ : 17.09 101.77 62.46 118.90 163.49 1.32 16.51 Egypt : 0.92 6.17 4.15 8.30 10.40 0.00 0.85 EU-27 6/ : 7.38 47.56 14.02 51.00 64.00 0.59 4.36 Japan : 1.15 0.00 16.61 12.00 16.60 0.00 1.16 Mexico : 3.08 23.60 9.56 16.20 32.00 0.11 4.13 Southeast Asia 7/ : 2.56 24.32 4.28 19.95 27.35 0.62 3.19 South Korea : 1.32 0.08 9.31 7.05 8.64 0.00 2.08 Selected other : Brazil : 3.59 58.60 0.68 36.00 42.50 7.79 12.58 Canada : 1.34 11.65 3.18 10.18 13.77 0.94 1.46 China : 36.60 152.30 0.04 105.00 149.00 0.55 39.39 FSU-12 : 1.77 13.79 0.62 11.16 12.90 2.13 1.14 Ukraine : 1.07 7.40 0.02 5.00 5.75 2.07 0.67 : : 2008/09 (Estimated) : World 3/ : 129.60 791.50 81.80 478.43 775.22 83.28 145.88 United States : 41.26 307.14 0.34 133.24 259.05 47.18 42.50 Total foreign : 88.35 484.36 81.45 345.19 516.17 36.09 103.38 Major exporters 4/ : 5.08 25.17 0.15 7.50 15.00 12.00 3.39 Argentina : 1.99 12.60 0.13 3.10 5.00 9.50 0.21 South Africa : 3.09 12.57 0.03 4.40 10.00 2.50 3.18 Major importers 5/ : 16.51 117.67 48.43 115.37 162.33 2.67 17.61 Egypt : 0.85 6.22 5.00 8.50 10.80 0.00 1.26 EU-27 6/ : 4.36 62.72 2.74 47.50 62.00 1.74 6.08 Japan : 1.16 0.00 16.53 11.80 16.40 0.00 1.30 Mexico : 4.13 24.23 7.76 16.40 32.40 0.16 3.56 Southeast Asia 7/ : 3.19 24.37 4.65 20.30 28.20 0.77 3.24 South Korea : 2.08 0.09 7.19 6.37 7.88 0.00 1.49 Selected other : Brazil : 12.58 51.00 1.20 37.00 44.50 7.00 13.28 Canada : 1.46 10.59 1.84 7.53 11.66 0.37 1.86 China : 39.39 165.90 0.05 110.00 152.00 0.17 53.17 FSU-12 : 1.14 21.32 0.32 12.42 14.26 6.86 1.67 Ukraine : 0.67 11.40 0.03 4.90 5.65 5.50 0.95 =============================================================================== 1/ Aggregate of local marketing years. 2/ Total foreign and world use adjusted to reflect the differences in world imports and exports. 3/ World imports and exports may not balance due to differences in marketing years, grain in transit, and reporting discrepancies in some countries. 4/ Argentina and South Africa. 5/ Egypt, the EU-27, Mexico, Japan, South Korea, Taiwan, and Southeast Asia. 6/ Trade excludes intra-trade. 7/ Indonesia, Malaysia, Philippines, Thailand, and Vietnam.
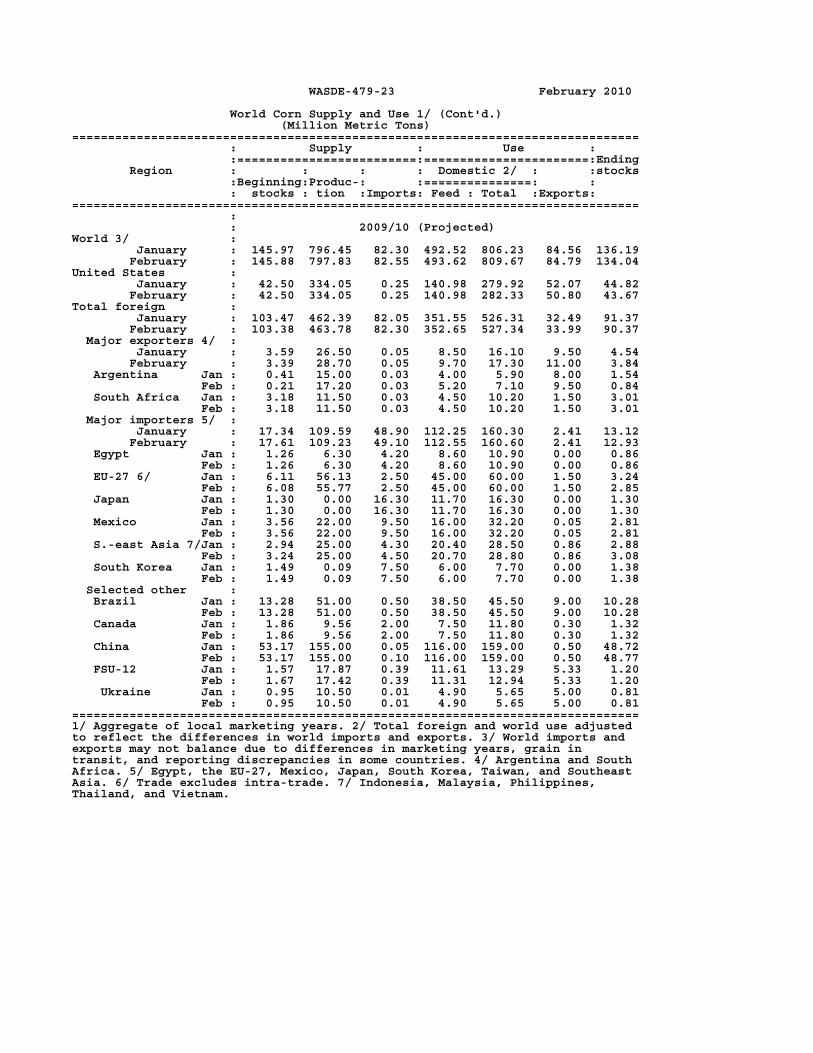
WASDE-479-23 February 2010 World Corn Supply and Use 1/ (Cont'd.) (Million Metric Tons) =============================================================================== : Supply : Use : :=========================:=======================:Ending Region : : : : Domestic 2/ : :stocks :Beginning:Produc-: :===============: : : stocks : tion :Imports: Feed : Total :Exports: =============================================================================== : : 2009/10 (Projected) World 3/ : January : 145.97 796.45 82.30 492.52 806.23 84.56 136.19 February : 145.88 797.83 82.55 493.62 809.67 84.79 134.04 United States : January : 42.50 334.05 0.25 140.98 279.92 52.07 44.82 February : 42.50 334.05 0.25 140.98 282.33 50.80 43.67 Total foreign : January : 103.47 462.39 82.05 351.55 526.31 32.49 91.37 February : 103.38 463.78 82.30 352.65 527.34 33.99 90.37 Major exporters 4/ : January : 3.59 26.50 0.05 8.50 16.10 9.50 4.54 February : 3.39 28.70 0.05 9.70 17.30 11.00 3.84 Argentina Jan : 0.41 15.00 0.03 4.00 5.90 8.00 1.54 Feb : 0.21 17.20 0.03 5.20 7.10 9.50 0.84 South Africa Jan : 3.18 11.50 0.03 4.50 10.20 1.50 3.01 Feb : 3.18 11.50 0.03 4.50 10.20 1.50 3.01 Major importers 5/ : January : 17.34 109.59 48.90 112.25 160.30 2.41 13.12 February : 17.61 109.23 49.10 112.55 160.60 2.41 12.93 Egypt Jan : 1.26 6.30 4.20 8.60 10.90 0.00 0.86 Feb : 1.26 6.30 4.20 8.60 10.90 0.00 0.86 EU-27 6/ Jan : 6.11 56.13 2.50 45.00 60.00 1.50 3.24 Feb : 6.08 55.77 2.50 45.00 60.00 1.50 2.85 Japan Jan : 1.30 0.00 16.30 11.70 16.30 0.00 1.30 Feb : 1.30 0.00 16.30 11.70 16.30 0.00 1.30 Mexico Jan : 3.56 22.00 9.50 16.00 32.20 0.05 2.81 Feb : 3.56 22.00 9.50 16.00 32.20 0.05 2.81 S.-east Asia 7/Jan : 2.94 25.00 4.30 20.40 28.50 0.86 2.88 Feb : 3.24 25.00 4.50 20.70 28.80 0.86 3.08 South Korea Jan : 1.49 0.09 7.50 6.00 7.70 0.00 1.38 Feb : 1.49 0.09 7.50 6.00 7.70 0.00 1.38 Selected other : Brazil Jan : 13.28 51.00 0.50 38.50 45.50 9.00 10.28 Feb : 13.28 51.00 0.50 38.50 45.50 9.00 10.28 Canada Jan : 1.86 9.56 2.00 7.50 11.80 0.30 1.32 Feb : 1.86 9.56 2.00 7.50 11.80 0.30 1.32 China Jan : 53.17 155.00 0.05 116.00 159.00 0.50 48.72 Feb : 53.17 155.00 0.10 116.00 159.00 0.50 48.77 FSU-12 Jan : 1.57 17.87 0.39 11.61 13.29 5.33 1.20 Feb : 1.67 17.42 0.39 11.31 12.94 5.33 1.20 Ukraine Jan : 0.95 10.50 0.01 4.90 5.65 5.00 0.81 Feb : 0.95 10.50 0.01 4.90 5.65 5.00 0.81 =============================================================================== 1/ Aggregate of local marketing years. 2/ Total foreign and world use adjusted to reflect the differences in world imports and exports. 3/ World imports and exports may not balance due to differences in marketing years, grain in transit, and reporting discrepancies in some countries. 4/ Argentina and South Africa. 5/ Egypt, the EU-27, Mexico, Japan, South Korea, Taiwan, and Southeast Asia. 6/ Trade excludes intra-trade. 7/ Indonesia, Malaysia, Philippines, Thailand, and Vietnam.

WASDE-479-24 February 2010 World Rice Supply and Use (Milled Basis) 1/ (Million Metric Tons) =============================================================================== : Supply : Use : :=========================:===================: Ending Region : : : : : : stocks :Beginning:Produc-: : Total 2/: : : stocks : tion :Imports: Domestic: Exports : =============================================================================== : : 2007/08 World 3/ : 75.10 434.38 29.20 428.51 31.24 80.98 United States : 1.27 6.34 0.76 4.08 3.35 0.94 Total foreign : 73.83 428.04 28.44 424.43 27.89 80.03 Major exporters 4/ : 16.03 146.56 0.31 122.17 22.31 18.43 India : 11.43 96.69 0.00 90.47 4.65 13.00 Pakistan : 0.70 5.70 0.00 2.70 3.00 0.70 Thailand : 2.51 19.80 0.01 9.60 10.01 2.71 Vietnam : 1.39 24.38 0.30 19.40 4.65 2.02 Major importers 5/ : 13.70 63.21 11.39 73.15 0.72 14.43 Brazil : 1.16 8.20 0.42 8.25 0.55 0.97 EU-27 6/ : 1.14 1.76 1.57 3.19 0.15 1.13 Indonesia : 4.61 37.00 0.35 36.35 0.00 5.61 Nigeria : 0.47 3.00 1.80 4.50 0.00 0.77 Philippines : 4.87 10.48 2.57 13.50 0.00 4.42 Sel. Mideast 7/ : 1.34 2.38 3.44 5.70 0.02 1.43 Selected other : Burma : 0.60 10.73 0.05 10.25 0.54 0.59 C. Amer & Carib 8/ : 0.48 1.33 1.57 2.98 0.00 0.39 China : 35.92 130.22 0.30 127.45 0.97 38.02 Egypt : 0.37 4.39 0.02 3.34 0.75 0.69 Japan : 2.41 7.93 0.60 8.18 0.20 2.56 Mexico : 0.14 0.18 0.58 0.70 0.01 0.19 South Korea : 0.70 4.41 0.25 4.67 0.00 0.69 : : 2008/09 (Estimated) World 3/ : 80.98 447.31 27.36 434.94 28.60 93.34 United States : 0.94 6.52 0.61 4.10 2.99 0.97 Total foreign : 80.03 440.79 26.75 430.84 25.60 92.37 Major exporters 4/ : 18.43 150.09 0.80 125.05 19.52 24.74 India : 13.00 99.15 0.00 93.15 2.00 17.00 Pakistan : 0.70 6.70 0.00 3.40 3.00 1.00 Thailand : 2.71 19.85 0.30 9.50 8.57 4.79 Vietnam : 2.02 24.39 0.50 19.00 5.95 1.96 Major importers 5/ : 14.43 64.61 11.78 74.92 0.82 15.08 Brazil : 0.97 8.57 0.65 8.53 0.65 1.01 EU-27 6/ : 1.13 1.68 1.32 2.97 0.14 1.02 Indonesia : 5.61 38.30 0.25 37.09 0.01 7.06 Nigeria : 0.77 3.20 1.70 5.10 0.00 0.57 Philippines : 4.42 10.75 2.60 13.65 0.00 4.12 Sel. Mideast 7/ : 1.43 1.67 4.06 5.93 0.02 1.21 Selected other : Burma : 0.59 10.15 0.03 9.55 1.05 0.17 C. Amer & Carib 8/ : 0.39 1.50 1.27 2.85 0.00 0.32 China : 38.02 134.33 0.33 129.00 0.76 42.92 Egypt : 0.69 4.39 0.02 4.00 0.30 0.79 Japan : 2.56 8.03 0.70 8.37 0.20 2.72 Mexico : 0.19 0.18 0.59 0.78 0.01 0.17 South Korea : 0.69 4.84 0.26 4.97 0.00 0.83 =============================================================================== 1/ Aggregate of local marketing years. 2/ Total foreign and world use adjusted to reflect the differences in world imports and exports. Total domestic includes both domestic use and unreported disappearance. 3/ World imports and exports may not balance due to differences in some countries. 4/ India, Pakistan, Thailand, and Vietnam. 5/ Brazil, Indonesia, Hong Kong, Cote d'Ivoire, Nigeria, Philippines, selected Middle East, and the EU-27. 6/ Trade excludes intra-trade. 7/ Selected Middle East includes Iran, Iraq, and Saudi Arabia. 8/ Central American and Caribbean countries.
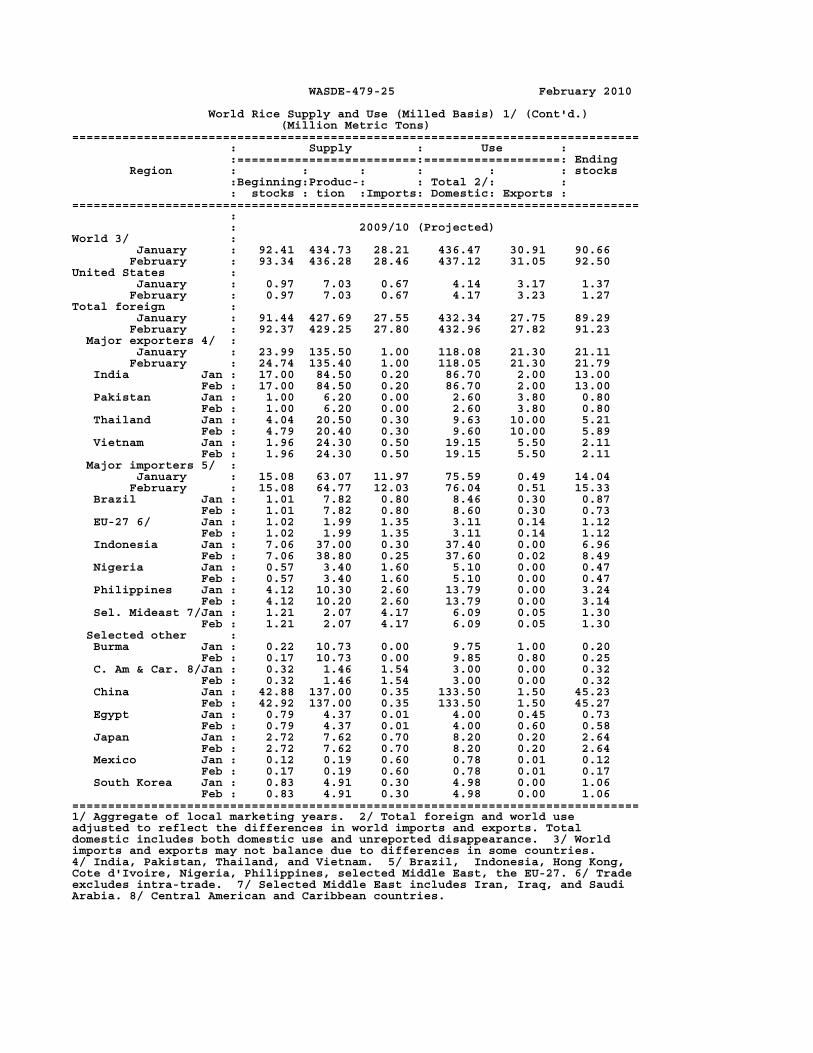
WASDE-479-25 February 2010 World Rice Supply and Use (Milled Basis) 1/ (Cont'd.) (Million Metric Tons) =============================================================================== : Supply : Use : :=========================:===================: Ending Region : : : : : : stocks :Beginning:Produc-: : Total 2/: : : stocks : tion :Imports: Domestic: Exports : =============================================================================== : : 2009/10 (Projected) World 3/ : January : 92.41 434.73 28.21 436.47 30.91 90.66 February : 93.34 436.28 28.46 437.12 31.05 92.50 United States : January : 0.97 7.03 0.67 4.14 3.17 1.37 February : 0.97 7.03 0.67 4.17 3.23 1.27 Total foreign : January : 91.44 427.69 27.55 432.34 27.75 89.29 February : 92.37 429.25 27.80 432.96 27.82 91.23 Major exporters 4/ : January : 23.99 135.50 1.00 118.08 21.30 21.11 February : 24.74 135.40 1.00 118.05 21.30 21.79 India Jan : 17.00 84.50 0.20 86.70 2.00 13.00 Feb : 17.00 84.50 0.20 86.70 2.00 13.00 Pakistan Jan : 1.00 6.20 0.00 2.60 3.80 0.80 Feb : 1.00 6.20 0.00 2.60 3.80 0.80 Thailand Jan : 4.04 20.50 0.30 9.63 10.00 5.21 Feb : 4.79 20.40 0.30 9.60 10.00 5.89 Vietnam Jan : 1.96 24.30 0.50 19.15 5.50 2.11 Feb : 1.96 24.30 0.50 19.15 5.50 2.11 Major importers 5/ : January : 15.08 63.07 11.97 75.59 0.49 14.04 February : 15.08 64.77 12.03 76.04 0.51 15.33 Brazil Jan : 1.01 7.82 0.80 8.46 0.30 0.87 Feb : 1.01 7.82 0.80 8.60 0.30 0.73 EU-27 6/ Jan : 1.02 1.99 1.35 3.11 0.14 1.12 Feb : 1.02 1.99 1.35 3.11 0.14 1.12 Indonesia Jan : 7.06 37.00 0.30 37.40 0.00 6.96 Feb : 7.06 38.80 0.25 37.60 0.02 8.49 Nigeria Jan : 0.57 3.40 1.60 5.10 0.00 0.47 Feb : 0.57 3.40 1.60 5.10 0.00 0.47 Philippines Jan : 4.12 10.30 2.60 13.79 0.00 3.24 Feb : 4.12 10.20 2.60 13.79 0.00 3.14 Sel. Mideast 7/Jan : 1.21 2.07 4.17 6.09 0.05 1.30 Feb : 1.21 2.07 4.17 6.09 0.05 1.30 Selected other : Burma Jan : 0.22 10.73 0.00 9.75 1.00 0.20 Feb : 0.17 10.73 0.00 9.85 0.80 0.25 C. Am & Car. 8/Jan : 0.32 1.46 1.54 3.00 0.00 0.32 Feb : 0.32 1.46 1.54 3.00 0.00 0.32 China Jan : 42.88 137.00 0.35 133.50 1.50 45.23 Feb : 42.92 137.00 0.35 133.50 1.50 45.27 Egypt Jan : 0.79 4.37 0.01 4.00 0.45 0.73 Feb : 0.79 4.37 0.01 4.00 0.60 0.58 Japan Jan : 2.72 7.62 0.70 8.20 0.20 2.64 Feb : 2.72 7.62 0.70 8.20 0.20 2.64 Mexico Jan : 0.12 0.19 0.60 0.78 0.01 0.12 Feb : 0.17 0.19 0.60 0.78 0.01 0.17 South Korea Jan : 0.83 4.91 0.30 4.98 0.00 1.06 Feb : 0.83 4.91 0.30 4.98 0.00 1.06 =============================================================================== 1/ Aggregate of local marketing years. 2/ Total foreign and world use adjusted to reflect the differences in world imports and exports. Total domestic includes both domestic use and unreported disappearance. 3/ World imports and exports may not balance due to differences in some countries. 4/ India, Pakistan, Thailand, and Vietnam. 5/ Brazil, Indonesia, Hong Kong, Cote d'Ivoire, Nigeria, Philippines, selected Middle East, the EU-27. 6/ Trade excludes intra-trade. 7/ Selected Middle East includes Iran, Iraq, and Saudi Arabia. 8/ Central American and Caribbean countries.
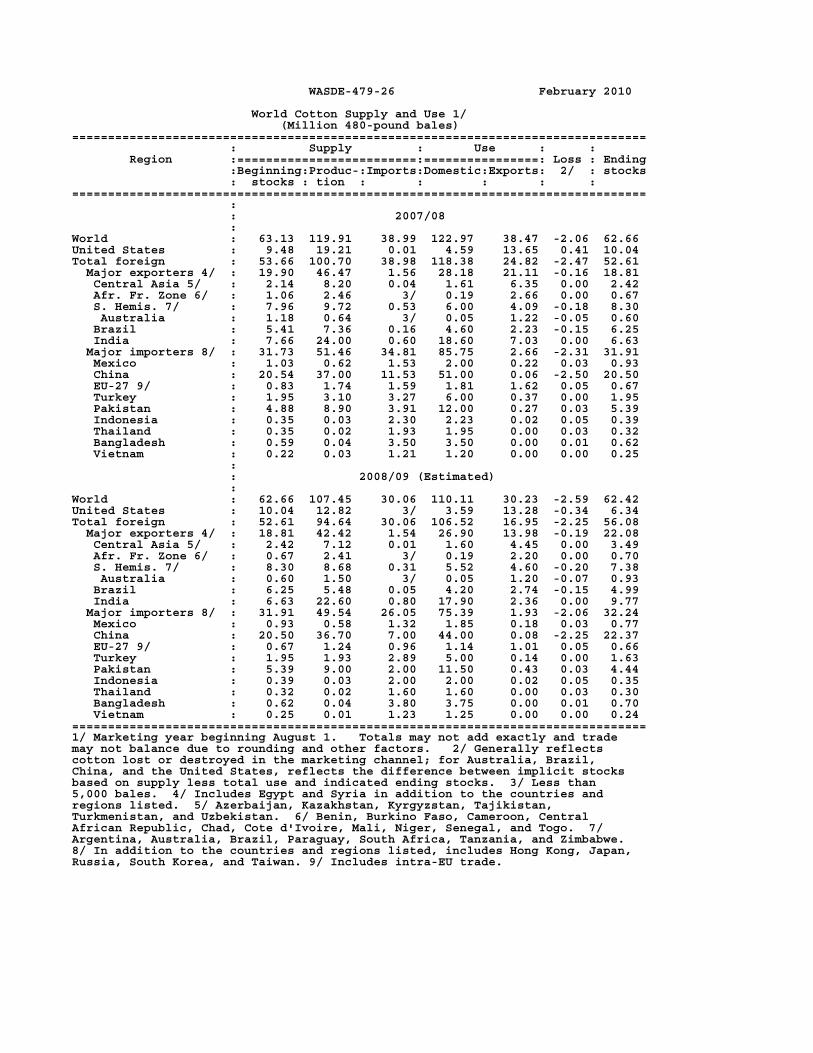
WASDE-479-26 February 2010 World Cotton Supply and Use 1/ (Million 480-pound bales) ================================================================================ : Supply : Use : : Region :=========================:================: Loss : Ending :Beginning:Produc-:Imports:Domestic:Exports: 2/ : stocks : stocks : tion : : : : : ================================================================================ : : 2007/08 : World : 63.13 119.91 38.99 122.97 38.47 -2.06 62.66 United States : 9.48 19.21 0.01 4.59 13.65 0.41 10.04 Total foreign : 53.66 100.70 38.98 118.38 24.82 -2.47 52.61 Major exporters 4/ : 19.90 46.47 1.56 28.18 21.11 -0.16 18.81 Central Asia 5/ : 2.14 8.20 0.04 1.61 6.35 0.00 2.42 Afr. Fr. Zone 6/ : 1.06 2.46 3/ 0.19 2.66 0.00 0.67 S. Hemis. 7/ : 7.96 9.72 0.53 6.00 4.09 -0.18 8.30 Australia : 1.18 0.64 3/ 0.05 1.22 -0.05 0.60 Brazil : 5.41 7.36 0.16 4.60 2.23 -0.15 6.25 India : 7.66 24.00 0.60 18.60 7.03 0.00 6.63 Major importers 8/ : 31.73 51.46 34.81 85.75 2.66 -2.31 31.91 Mexico : 1.03 0.62 1.53 2.00 0.22 0.03 0.93 China : 20.54 37.00 11.53 51.00 0.06 -2.50 20.50 EU-27 9/ : 0.83 1.74 1.59 1.81 1.62 0.05 0.67 Turkey : 1.95 3.10 3.27 6.00 0.37 0.00 1.95 Pakistan : 4.88 8.90 3.91 12.00 0.27 0.03 5.39 Indonesia : 0.35 0.03 2.30 2.23 0.02 0.05 0.39 Thailand : 0.35 0.02 1.93 1.95 0.00 0.03 0.32 Bangladesh : 0.59 0.04 3.50 3.50 0.00 0.01 0.62 Vietnam : 0.22 0.03 1.21 1.20 0.00 0.00 0.25 : : 2008/09 (Estimated) : World : 62.66 107.45 30.06 110.11 30.23 -2.59 62.42 United States : 10.04 12.82 3/ 3.59 13.28 -0.34 6.34 Total foreign : 52.61 94.64 30.06 106.52 16.95 -2.25 56.08 Major exporters 4/ : 18.81 42.42 1.54 26.90 13.98 -0.19 22.08 Central Asia 5/ : 2.42 7.12 0.01 1.60 4.45 0.00 3.49 Afr. Fr. Zone 6/ : 0.67 2.41 3/ 0.19 2.20 0.00 0.70 S. Hemis. 7/ : 8.30 8.68 0.31 5.52 4.60 -0.20 7.38 Australia : 0.60 1.50 3/ 0.05 1.20 -0.07 0.93 Brazil : 6.25 5.48 0.05 4.20 2.74 -0.15 4.99 India : 6.63 22.60 0.80 17.90 2.36 0.00 9.77 Major importers 8/ : 31.91 49.54 26.05 75.39 1.93 -2.06 32.24 Mexico : 0.93 0.58 1.32 1.85 0.18 0.03 0.77 China : 20.50 36.70 7.00 44.00 0.08 -2.25 22.37 EU-27 9/ : 0.67 1.24 0.96 1.14 1.01 0.05 0.66 Turkey : 1.95 1.93 2.89 5.00 0.14 0.00 1.63 Pakistan : 5.39 9.00 2.00 11.50 0.43 0.03 4.44 Indonesia : 0.39 0.03 2.00 2.00 0.02 0.05 0.35 Thailand : 0.32 0.02 1.60 1.60 0.00 0.03 0.30 Bangladesh : 0.62 0.04 3.80 3.75 0.00 0.01 0.70 Vietnam : 0.25 0.01 1.23 1.25 0.00 0.00 0.24 ================================================================================ 1/ Marketing year beginning August 1. Totals may not add exactly and trade may not balance due to rounding and other factors. 2/ Generally reflects cotton lost or destroyed in the marketing channel; for Australia, Brazil, China, and the United States, reflects the difference between implicit stocks based on supply less total use and indicated ending stocks. 3/ Less than 5,000 bales. 4/ Includes Egypt and Syria in addition to the countries and regions listed. 5/ Azerbaijan, Kazakhstan, Kyrgyzstan, Tajikistan, Turkmenistan, and Uzbekistan. 6/ Benin, Burkino Faso, Cameroon, Central African Republic, Chad, Cote d'Ivoire, Mali, Niger, Senegal, and Togo. 7/ Argentina, Australia, Brazil, Paraguay, South Africa, Tanzania, and Zimbabwe. 8/ In addition to the countries and regions listed, includes Hong Kong, Japan, Russia, South Korea, and Taiwan. 9/ Includes intra-EU trade.

WASDE-479-27 February 2010 World Cotton Supply and Use 1/ (Million 480-pound bales) ================================================================================ : Supply : Use : : Region :=========================:================: Loss : Ending :Beginning:Produc-:Imports:Domestic:Exports: 2/ : stocks : stocks : tion : : : : : ================================================================================ : : 2009/10 (Projected) World : January : 60.93 102.71 33.65 114.36 33.66 -2.46 51.72 February : 62.42 102.74 33.76 115.53 33.77 -2.46 52.08 United States : January : 6.34 12.40 0.01 3.40 11.00 0.04 4.30 February : 6.34 12.40 0.01 3.40 12.00 0.04 3.30 Total foreign : January : 54.59 90.31 33.64 110.96 22.66 -2.50 47.42 February : 56.08 90.34 33.76 112.13 21.77 -2.50 48.78 Major exporters 4/ : January : 22.08 42.76 1.36 27.76 19.64 -0.19 18.99 February : 22.08 42.81 1.36 28.21 18.74 -0.19 19.49 Central Asia 5/Jan : 3.49 6.37 0.01 1.59 6.02 0.00 2.26 Feb : 3.49 6.37 0.01 1.59 6.02 0.00 2.26 Afr. Fr. Zn. 6/Jan : 0.70 2.38 3/ 0.19 2.26 0.00 0.64 Feb : 0.70 2.38 3/ 0.19 2.26 0.00 0.64 S. Hemis 7/ Jan : 7.38 9.09 0.35 5.51 4.49 -0.20 7.02 Feb : 7.38 9.14 0.35 5.51 4.49 -0.20 7.07 Australia Jan : 0.93 1.75 3/ 0.04 1.70 -0.07 1.01 Feb : 0.93 1.75 3/ 0.04 1.70 -0.07 1.01 Brazil Jan : 4.99 5.55 0.10 4.20 2.00 -0.15 4.59 Feb : 4.99 5.55 0.10 4.20 2.00 -0.15 4.59 India Jan : 9.77 23.50 0.60 18.75 6.60 0.00 8.52 Feb : 9.77 23.50 0.60 19.20 5.70 0.00 8.97 Major importers 8/ : January : 30.74 45.02 29.68 78.95 2.00 -2.31 26.80 February : 32.24 45.02 29.77 79.70 2.00 -2.31 27.64 Mexico Jan : 0.77 0.42 1.50 1.90 0.10 0.03 0.66 Feb : 0.77 0.42 1.50 1.90 0.10 0.03 0.66 China Jan : 20.87 32.00 9.00 46.75 0.08 -2.50 17.54 Feb : 22.37 32.00 9.00 47.50 0.08 -2.50 18.29 EU-27 9/ Jan : 0.66 1.01 0.93 1.00 1.06 0.05 0.48 Feb : 0.66 1.01 0.92 1.00 1.07 0.05 0.47 Turkey Jan : 1.63 1.70 3.30 5.10 0.13 0.00 1.41 Feb : 1.63 1.70 3.30 5.10 0.13 0.00 1.41 Pakistan Jan : 4.44 9.80 2.65 12.00 0.50 0.03 4.36 Feb : 4.44 9.80 2.75 12.00 0.50 0.03 4.46 Indonesia Jan : 0.35 0.03 2.08 2.05 0.02 0.05 0.33 Feb : 0.35 0.03 2.08 2.05 0.02 0.05 0.33 Thailand Jan : 0.30 0.01 1.80 1.78 0.00 0.03 0.31 Feb : 0.30 0.01 1.80 1.78 0.00 0.03 0.31 Bangladesh Jan : 0.70 0.04 4.00 4.00 0.00 0.01 0.73 Feb : 0.70 0.04 4.00 4.00 0.00 0.01 0.73 Vietnam Jan : 0.24 0.01 1.35 1.35 0.00 0.00 0.25 Feb : 0.24 0.01 1.35 1.35 0.00 0.00 0.25 ================================================================================ 1/ Marketing year beginning August 1. Totals may not add exactly and trade may not balance due to rounding and other factors. 2/ Generally reflects cotton lost or destroyed in the marketing channel; for Australia, Brazil, and the United States, reflects the difference between implicit stocks based on supply less total use and indicated ending stocks. 3/ Less than 5,000 bales. 4/ Includes Egypt and Syria in addition to the countries and regions listed. 5/ Azerbaijan, Kazakhstan, Kyrgyzstan, Tajikistan, Turkmenistan, and Uzbekistan. 6/ Benin, Burkino Faso, Cameroon, Central African Republic, Chad, Cote d'Ivoire, Mali, Niger, Senegal, and Togo. 7/ Argentina, Australia, Brazil, Paraguay, South Africa, Tanzania, and Zimbabwe. 8/ In addition to the countries and regions listed, includes Hong Kong, Japan, Russia, South Korea, and Taiwan. 9/ Includes intra-EU trade.

WASDE-479-28 February 2010 World Soybean Supply and Use 1/ (Million Metric Tons) =============================================================================== : Supply : Use : :=========================:=======================:Ending Region : : : : : :stocks :Beginning:Produc-: : Domestic : : : stocks : tion :Imports: Crush : Total :Exports: =============================================================================== : : 2007/08 World 2/ : 62.89 221.14 78.12 201.87 229.67 79.53 52.95 United States : 15.62 72.86 0.27 49.08 51.63 31.54 5.58 Total foreign : 47.27 148.28 77.85 152.79 178.05 47.99 47.37 Major exporters 3/ : 40.98 114.10 3.12 68.12 72.78 44.60 40.81 Argentina : 22.61 46.20 2.95 34.61 36.16 13.84 21.76 Brazil : 18.19 61.00 0.15 32.11 35.07 25.36 18.90 Major importers 4/ : 4.42 16.03 63.98 62.82 78.30 0.53 5.61 China : 2.70 14.00 37.82 39.52 49.82 0.45 4.25 EU-27 : 1.12 0.72 15.12 14.87 16.11 0.04 0.81 Japan : 0.26 0.23 4.01 2.89 4.22 0.01 0.27 Mexico : 0.04 0.09 3.58 3.62 3.66 0.00 0.06 : : 2008/09 (Estimated) World 2/ : 52.95 210.86 77.17 194.55 222.55 76.79 41.64 United States : 5.58 80.75 0.36 45.23 48.00 34.93 3.76 Total foreign : 47.37 130.11 76.81 149.32 174.54 41.87 37.88 Major exporters 3/ : 40.81 92.90 1.34 65.92 70.30 37.97 26.78 Argentina : 21.76 32.00 1.29 31.91 33.27 5.59 16.19 Brazil : 18.90 57.00 0.04 32.51 35.41 29.99 10.55 Major importers 4/ : 5.61 17.50 64.50 61.69 77.33 0.45 9.83 China : 4.25 15.50 41.10 41.04 51.44 0.40 9.01 EU-27 : 0.81 0.64 13.21 12.86 14.09 0.02 0.56 Japan : 0.27 0.23 3.40 2.50 3.80 0.00 0.09 Mexico : 0.06 0.15 3.33 3.47 3.50 0.00 0.04 : : 2009/10 (Projected) World 2/ : January : 42.87 253.38 78.91 203.86 234.75 80.61 59.80 February : 41.64 255.02 79.58 204.22 235.12 81.39 59.73 United States : January : 3.76 91.47 0.22 46.54 51.36 37.42 6.67 February : 3.76 91.47 0.22 46.81 51.64 38.10 5.71 Total foreign : January : 39.11 161.91 78.69 157.33 183.38 43.19 53.13 February : 37.88 163.54 79.36 157.41 183.48 43.29 54.01 Major exporters 3/ : January : 27.90 124.70 0.32 68.65 73.36 38.75 40.80 February : 26.78 126.10 0.17 68.45 73.17 38.45 41.43 Argentina Jan : 16.19 53.00 0.15 35.00 36.63 9.85 22.86 Feb : 16.19 53.00 0.00 35.30 36.94 7.85 24.40 Brazil Jan : 11.67 65.00 0.15 32.10 35.05 24.00 17.77 Feb : 10.55 66.00 0.15 31.60 34.55 25.30 16.85 Major importers 4/ : January : 9.93 16.80 66.44 65.64 81.70 0.56 10.90 February : 9.83 16.80 66.94 65.71 81.79 0.56 11.21 China Jan : 9.01 14.50 42.00 44.78 55.31 0.50 9.70 Feb : 9.01 14.50 42.50 44.93 55.46 0.50 10.05 EU-27 Jan : 0.68 0.99 13.00 12.60 13.85 0.03 0.79 Feb : 0.56 0.99 13.00 12.50 13.77 0.03 0.75 Japan Jan : 0.09 0.23 3.95 2.75 4.11 0.00 0.16 Feb : 0.09 0.23 3.95 2.75 4.11 0.00 0.16 Mexico Jan : 0.04 0.11 3.50 3.56 3.60 0.00 0.05 Feb : 0.04 0.11 3.50 3.56 3.60 0.00 0.05 =============================================================================== 1/ Data based on local marketing years except Argentina and Brazil which are adjusted to an October-September year. 2/ World imports and exports may not balance due to differences in local marketing years and to time lags between reported exports and imports. Therefore, world supply may not equal world use. 3/ Argentina, Brazil and Paraguay. 4/ Japan, China, and EU, Mexico, and Southeast Asia (includes Indonesia, Malaysia, Philippines, and Thailand).

WASDE-479-29 February 2010 World Soybean Meal Supply and Use 1/ (Million Metric Tons) =============================================================================== : Supply : Use : :=========================:===================: Ending Region : : : : : : stocks :Beginning:Produc-: : Total : : : stocks : tion :Imports: Domestic: Exports : =============================================================================== : : 2007/08 World 2/ : 6.54 158.42 54.30 157.33 55.78 6.16 United States : 0.31 38.36 0.13 30.15 8.38 0.27 Total foreign : 6.23 120.06 54.17 127.18 47.39 5.90 Major exporters 3/ : 3.85 58.48 0.19 14.94 43.74 3.83 Argentina : 1.50 27.07 0.00 0.62 26.82 1.14 Brazil : 1.91 24.89 0.18 12.26 12.14 2.59 India : 0.43 6.52 0.00 2.06 4.79 0.11 Major importers 4/ : 1.19 44.59 31.05 74.48 1.10 1.24 EU-27 : 0.86 11.72 24.07 35.17 0.41 1.07 China : 0.00 31.28 0.20 30.85 0.63 0.00 : : 2008/09 (Estimated) World 2/ : 6.16 152.95 51.06 152.55 52.03 5.59 United States : 0.27 35.48 0.08 27.89 7.72 0.21 Total foreign : 5.90 117.48 50.98 124.66 44.32 5.38 Major exporters 3/ : 3.83 56.14 0.11 15.56 40.16 4.37 Argentina : 1.14 24.95 0.00 0.63 24.00 1.46 Brazil : 2.59 25.20 0.11 12.44 13.00 2.45 India : 0.11 5.99 0.00 2.48 3.16 0.45 Major importers 4/ : 1.24 44.12 28.10 71.64 1.54 0.29 EU-27 : 1.07 10.13 20.98 31.58 0.47 0.13 China : 0.00 32.48 0.22 31.67 1.02 0.00 : : 2009/10 (Projected) World 2/ : January : 4.93 160.39 53.83 158.79 55.23 5.13 February : 5.59 160.64 54.07 159.42 55.12 5.76 United States : January : 0.21 36.67 0.13 27.76 8.98 0.27 February : 0.21 36.76 0.13 27.76 9.07 0.27 Total foreign : January : 4.72 123.72 53.71 131.03 46.24 4.86 February : 5.38 123.88 53.94 131.66 46.05 5.49 Major exporters 3/ : January : 3.60 58.32 0.16 16.20 42.27 3.61 February : 4.37 58.17 0.16 16.27 42.15 4.28 Argentina Jan : 1.46 27.37 0.00 0.68 26.72 1.44 Feb : 1.46 27.60 0.00 0.68 26.95 1.44 Brazil Jan : 1.68 24.88 0.15 12.63 12.35 1.74 Feb : 2.45 24.50 0.15 12.70 12.00 2.41 India Jan : 0.45 6.07 0.00 2.89 3.20 0.43 Feb : 0.45 6.07 0.00 2.89 3.20 0.43 Major importers 4/ : January : 0.45 46.98 30.50 76.22 1.10 0.61 February : 0.29 47.02 30.49 75.96 1.28 0.57 EU-27 Jan : 0.29 9.93 22.80 32.30 0.32 0.40 Feb : 0.13 9.85 22.80 32.02 0.40 0.36 China Jan : 0.00 35.44 0.20 34.91 0.73 0.00 Feb : 0.00 35.56 0.20 34.93 0.83 0.00 =============================================================================== 1/ Data based on local marketing years except for Argentina and Brazil which are adjusted to an October-September year. 2/ World imports and exports may not balance due to differences in local marketing years and to time lags between reported exports and imports. Therefore, world supply may not equal world use. 3/ Argentina, Brazil, and India. 4/ Eastern Europe, China, EU, and Southeast Asia (includes Indonesia, Malaysia, Philippines, and Thailand).

WASDE-479-30 February 2010 World Soybean Oil Supply and Use 1/ (Million Metric Tons) =============================================================================== : Supply : Use : :=========================:===================: Ending Region : : : : : : stocks :Beginning:Produc-: : Total : : : stocks : tion :Imports: Domestic: Exports : =============================================================================== : : 2007/08 World 2/ : 3.56 37.54 10.40 37.61 10.87 3.02 United States : 1.40 9.34 0.03 8.32 1.32 1.13 Total foreign : 2.16 28.21 10.37 29.29 9.55 1.89 Major exporters 3/ : 1.10 15.45 1.11 8.29 8.51 0.86 Argentina : 0.38 6.63 0.00 1.00 5.79 0.22 Brazil : 0.51 6.16 0.07 3.92 2.39 0.43 EU-27 : 0.21 2.67 1.04 3.38 0.33 0.21 Major importers 4/ : 0.50 8.51 3.52 12.05 0.11 0.37 China : 0.25 7.05 2.73 9.69 0.10 0.23 India : 0.25 1.46 0.73 2.30 0.01 0.13 Pakistan : 0.00 0.00 0.06 0.06 0.00 0.01 : : 2008/09 (Estimated) World 2/ : 3.02 36.09 8.85 35.81 9.06 3.08 United States : 1.13 8.50 0.04 7.43 1.00 1.24 Total foreign : 1.89 27.58 8.81 28.38 8.07 1.84 Major exporters 3/ : 0.86 14.68 0.80 8.46 7.02 0.86 Argentina : 0.22 6.12 0.00 1.41 4.71 0.23 Brazil : 0.43 6.24 0.01 4.27 1.91 0.49 EU-27 : 0.21 2.31 0.79 2.78 0.40 0.14 Major importers 4/ : 0.37 8.65 3.60 11.86 0.09 0.66 China : 0.23 7.31 2.49 9.49 0.08 0.47 India : 0.13 1.34 1.06 2.33 0.01 0.19 Pakistan : 0.01 0.00 0.04 0.05 0.00 0.00 : : 2009/10 (Projected) World 2/ : January : 2.88 37.72 8.96 37.51 9.51 2.54 February : 3.08 37.75 8.91 37.67 9.34 2.73 United States : January : 1.24 8.66 0.03 7.49 1.47 0.98 February : 1.24 8.69 0.03 7.49 1.47 1.01 Total foreign : January : 1.63 29.06 8.92 30.02 8.04 1.56 February : 1.84 29.06 8.87 30.18 7.87 1.72 Major exporters 3/ : January : 0.64 15.15 0.65 8.88 6.94 0.62 February : 0.86 15.09 0.65 9.01 6.79 0.80 Argentina Jan : 0.23 6.72 0.00 1.54 5.22 0.19 Feb : 0.23 6.78 0.00 1.65 5.18 0.19 Brazil Jan : 0.27 6.16 0.05 4.71 1.53 0.25 Feb : 0.49 6.06 0.05 4.76 1.43 0.42 EU-27 Jan : 0.13 2.27 0.60 2.63 0.19 0.18 Feb : 0.14 2.25 0.60 2.61 0.19 0.19 Major importers 4/ : January : 0.66 9.35 3.32 12.59 0.11 0.62 February : 0.66 9.37 3.32 12.62 0.11 0.62 China Jan : 0.47 7.98 2.40 10.32 0.10 0.43 Feb : 0.47 8.01 2.40 10.35 0.10 0.43 India Jan : 0.19 1.36 0.89 2.24 0.01 0.19 Feb : 0.19 1.36 0.89 2.24 0.01 0.19 Pakistan Jan : 0.00 0.00 0.03 0.03 0.00 0.00 Feb : 0.00 0.00 0.03 0.03 0.00 0.00 =============================================================================== 1/ Data based on local marketing years except for Argentina and Brazil which are adjusted to an October-September year. 2/ World imports and exports may not balance due to differences in local marketing years and to time lags between reported exports and imports. Therefore, world supply may not equal world use. 3/ Argentina, Brazil and EU. 4/ India, China and Pakistan.

WASDE-479-31 February 2010 U.S. Quarterly Animal Product Production 1/ =============================================================================== Year : : : Red : : : Total: Red : : : and : : : meat : : :poultry: meat & : : : quarter : Beef : Pork : 2/ :Broiler:Turkey: 3/ : poultry: Egg : Milk : =============================================================================== : Million pounds Mil doz Bil lbs 2008 : Annual : 26561 23347 50225 36906 6246 43712 93937 7509 190.0 : 2009 : I : 6248 5811 12136 8574 1385 10077 22213 1857 47.4 II : 6602 5488 12165 8937 1420 10487 22652 1867 48.9 III : 6689 5698 12462 9172 1417 10725 23187 1878 46.8 IV : 6424 5996 12502 8806 1441 10364 22866 1923 46.2 Annual : Jan Est : 25954 23002 49264 35533 5647 41679 90943 7517 189.2 Feb Est : 25963 22993 49265 35489 5663 41653 90918 7525 189.3 : 2010 : I* : 6185 5630 11893 8600 1300 10020 21913 1865 47.1 II* : 6490 5400 11965 8975 1375 10480 22445 1880 48.6 III* : 6660 5500 12236 9250 1425 10805 23041 1895 46.7 IV* : 6315 5990 12384 9075 1475 10675 23059 1925 46.4 Annual : Jan Proj : 25475 22635 48422 35900 5650 42055 90477 7565 188.4 Feb Proj : 25650 22520 48478 35900 5575 41980 90458 7565 188.9 =============================================================================== * Projection. 1/ Commercial production for red meats; federally inspected for poultry meats. 2/ Beef, pork, veal and lamb & mutton. 3/ Broilers, turkeys and mature chicken. U.S. Quarterly Prices for Animal Products 1/ =============================================================================== Year : Choice : Barrows : : : : : and : steers :and gilts : Broilers : Turkeys : Eggs : Milk : quarter : 2/ : 3/ : 4/ : 5/ : 6/ : 7/ : =============================================================================== : Dol./cwt Dol./cwt Cents/lb. Cents/lb. Cents/doz. Dol./cwt 2008 : Annual : 92.27 47.84 79.7 87.5 128.3 18.29 : 2009 : I : 80.98 42.11 79.7 73.8 109.7 12.23 II : 84.53 42.74 81.9 79.1 89.7 11.60 III : 82.78 38.90 76.8 81.4 94.8 12.07 IV : 82.43 41.20 72.1 83.8 117.7 15.33 Annual : Jan Est : 82.68 41.24 77.6 79.9 102.9 12.79 Feb Est : 82.68 41.24 77.6 79.5 103.0 12.81 : 2010 : I* : 82-84 47-49 80-82 75-77 115-119 15.65-15.95 II* : 85-91 46-48 78-82 80-84 107-113 15.60-16.20 III* : 86-94 49-53 77-83 81-87 96-104 16.25-17.15 IV* : 88-96 43-47 74-80 84-90 115-125 17.20-18.20 Annual : Jan Proj : 86-93 44-48 76-81 79-85 106-113 16.20-17.00 Feb Proj : 85-91 46-49 77-82 80-85 108-115 16.20-16.90 =============================================================================== *Projection. 1/ Simple average of months. 2/ Nebraska, Direct, 1100-1300 lbs. 3/ National Base, Live equiv 51-52% lean. 4/ Wholesale, 12-city average. 5/ 8-12 lbs, hens Eastern Region. 6/ Grade A large, New York, volume buyers. 7/ Prices received by farmers for all milk.

WASDE-479-32 February 2010 U.S. Meats Supply and Use =============================================================================== : Supply : Use :----------------------------------------------------------- : : : : : : : Disappearance : : Pro- : : : : :-------------- : Beg- : duc- : : : : End- : : Per Item :inning: tion : Im- : Total : Ex- : ing : :capita :stocks: 1/ :ports: supply: ports:stocks:Total : 2/ 3/ =============================================================================== : Million pounds 4/ BEEF : 2008 : 630 26663 2538 29831 1887 642 27302 62.7 2009 Est. Jan : 642 26056 2703 29401 1861 555 26985 61.4 Feb : 642 26065 2643 29350 1871 564 26915 61.3 2010 Proj. Jan : 555 25577 2795 28927 2040 460 26427 59.6 Feb : 564 25752 2775 29091 2040 460 26591 59.9 : PORK : 2008 : 519 23367 832 24717 4667 635 19415 49.4 2009 Est. Jan : 635 23022 841 24498 4151 575 19772 49.9 Feb : 635 23013 841 24489 4151 530 19808 50.0 2010 Proj. Jan : 575 22655 900 24130 4500 550 19080 47.7 Feb : 530 22540 900 23970 4500 525 18945 47.3 : TOTAL RED MEAT 5/ : 2008 : 1169 50361 3553 55083 6566 1307 47210 113.5 2009 Est. Jan : 1307 49399 3714 54420 6029 1152 47239 112.7 Feb : 1307 49400 3654 54361 6039 1117 47205 112.6 2010 Proj. Jan : 1152 48557 3879 53588 6556 1031 46001 108.6 Feb : 1117 48613 3862 53592 6556 1005 46031 108.7 : BROILERS : 2008 : 719 36511 79 37309 6961 745 29603 83.4 2009 Est. Jan : 745 35153 82 35980 6802 640 28538 79.7 Feb : 745 35109 82 35936 6802 614 28520 79.7 2010 Proj. Jan : 640 35516 80 36236 6025 705 29506 81.6 Feb : 614 35516 80 36210 5825 705 29680 82.1 : TURKEYS : 2008 : 261 6165 8 6434 676 396 5361 17.6 2009 Est. Jan : 396 5573 13 5982 536 260 5187 16.9 Feb : 396 5589 13 5998 536 250 5212 17.0 2010 Proj. Jan : 260 5576 12 5848 545 290 5013 16.1 Feb : 250 5502 12 5764 545 290 4929 15.9 : TOTAL POULTRY 6/ : 2008 : 982 43235 92 44309 7785 1144 35379 102.4 2009 Est. Jan : 1144 41224 100 42469 7452 903 34114 97.9 Feb : 1144 41199 100 42443 7452 866 34125 97.9 2010 Proj. Jan : 903 41596 100 42599 6710 998 34891 99.0 Feb : 866 41522 100 42488 6510 998 34980 99.2 : RED MEAT & POULTRY : 2008 : 2151 93596 3646 99392 14352 2451 82589 215.9 2009 Est. Jan : 2451 90623 3814 96888 13480 2055 81353 210.6 Feb : 2451 90598 3754 96804 13490 1983 81330 210.5 2010 Proj. Jan : 2055 90153 3979 96187 13266 2029 80892 207.6 Feb : 1983 90135 3962 96080 13066 2003 81011 207.9 =============================================================================== 1/ Total including farm production for red meats and, for poultry, federally inspected plus non-federally inspected, less condemnations. 2/ Pounds, retail-weight basis. 3/ Population source: Dept. of Commerce, Census Bureau. 4/ Carcass weight for red meats and certified ready-to-cook weight for poultry. 5/ Beef, pork, veal, lamb and mutton. 6/ Broilers, turkeys and mature chicken.

WASDE-479-33 February 2010 U.S. Egg Supply and Use =============================================================================== : : : 2009 Estimated : 2010 Projected : : :-----------------:----------------- Commodity : 2007 : 2008 : Jan : Feb : Jan : Feb =============================================================================== EGGS : Million dozen Supply : Beginning stocks : 12.5 11.1 17.2 17.2 15.0 18.5 Production : 7587.0 7509.0 7517.0 7525.0 7565.0 7565.0 Imports : 13.6 14.6 11.4 11.4 12.0 12.0 Total supply : 7613.1 7534.7 7545.6 7553.6 7592.0 7595.5 : Use : Exports : 250.3 206.3 239.5 239.5 220.0 220.0 Hatching use : 1016.3 994.9 950.3 950.5 970.0 970.0 Ending stocks : 11.1 17.2 15.0 18.5 15.0 16.0 Disappearance : Total : 6335.4 6316.3 6340.8 6345.1 6387.0 6389.5 Per capita (number) : 251.7 248.7 247.5 247.6 246.8 246.9 =============================================================================== U.S. Milk Supply and Use =============================================================================== : : : 2009 Estimated : 2010 Projected Commodity : : :-----------------:----------------- : 2007 : 2008 : Jan : Feb : Jan : Feb =============================================================================== : Billion pounds Milk : Production : 185.7 190.0 189.2 189.3 188.4 188.9 Farm use : 1.1 1.1 1.1 1.1 1.1 1.1 : Fat Basis Supply : Beg. commercial stocks : 9.5 10.4 10.0 10.0 11.1 11.3 Marketings : 184.6 188.9 188.2 188.2 187.4 187.8 Imports : 4.6 3.9 4.1 4.1 4.2 4.1 Total cml. supply : 198.7 203.2 202.3 202.3 202.7 203.2 : Fat Basis Use : Commercial Exports : 5.7 8.7 4.0 4.0 4.8 4.8 Ending commercial stks : 10.4 10.0 11.1 11.3 8.9 9.1 CCC net removals 1/ : 0.0 0.0 0.6 0.6 0.4 0.4 Commercial use 2/ : 182.7 184.4 186.4 186.2 188.6 188.8 : Skim-solids Basis Supply : Beg. commercial stocks : 9.1 9.9 10.9 10.9 11.0 11.2 Marketings : 184.6 188.9 188.2 188.2 187.4 187.8 Imports : 4.4 3.7 3.6 3.6 4.0 3.9 Total cml. supply : 198.1 202.6 202.7 202.7 202.4 202.9 : Skim-solids Basis Use : Commercial Exports : 24.5 26.6 23.1 22.7 25.5 25.7 Ending commercial stks : 9.9 10.9 11.0 11.2 9.5 9.8 CCC net removals 1/ : 0.0 1.3 2.9 2.9 -0.6 -0.6 Commercial use 2/ : 163.7 163.8 166.2 166.4 168.3 168.3 : : Million pounds CCC product net removals 1/: Butter : 0 0 23 23 16 16 Cheese : 0 0 2 2 2 2 Nonfat dry milk : 0 111 248 248 -50 -50 Dry whole milk : 0 0 0 0 0 0 =============================================================================== Note: Totals may not add due to rounding. 1/ Includes products exported under the Dairy Export Incentive Program. 2/ Domestic commercial use only. 2009 and 2010 adjusted for the Barter Program

WASDE-479-34 February 2010 U.S. Dairy Prices =============================================================================== : : : 2009 Estimated : 2010 Projected : : : ------------------------:------------------ Commodity : 2007 : 2008 : Jan : Feb : Jan : Feb =============================================================================== : Dollars per pound : Product Prices 1/ : Cheese : 1.7380 1.8954 1.2966 1.2966 1.570- 1.575- : 1.650 1.645 : Butter : 1.3441 1.4356 1.2096 1.2096 1.390- 1.395- : 1.500 1.495 : Nonfat dry milk : 1.7083 1.2256 0.9223 0.9223 1.270- 1.175- : 1.330 1.235 : Dry whey : 0.6004 0.2504 0.2585 0.2585 0.365- 0.375- : 0.395 0.405 : : Dollars per cwt Milk Prices 2/ : Class III : 18.04 17.44 11.36 11.36 14.75- 14.90- : 15.55 15.60 : Class IV : 18.36 14.65 10.89 10.89 14.70- 13.95- : 15.60 14.75 : All milk 3/ : 19.13 18.29 12.79 12.81 16.20- 16.20- : 17.00 16.90 : =============================================================================== 1/ Simple average of monthly prices calculated by AMS from NASS weekly average dairy product prices for class price computations. Details may be found at http://www.ams.usda.gov/dyfmos/mib/fedordprc_dscrp.htm. 2/ Annual Class III and Class IV prices are the simple averages of monthly minimum Federal order milk prices paid by regulated plants for milk used in the respective classes. All milk price is the simple average of monthly prices received by farmers for milk at average test. 3/ Does not reflect any deductions from producers as authorized by legislation.

WASDE-479-35 February 2010 Note: Tables on pages 35-37 present a 28-year record of the differences between the February projection and the final estimate. Using world wheat production as an example, changes between the February projection and the final estimate have averaged 2.3 million tons (0.4%) ranging from -7.3 to 6.8 million tons. The February projection has been below the estimate 20 times and above 8 times. Reliability of February Projections =============================================================================== :Differences between proj. & final estimate,1981/82-2008/09 1/ Commodity and :============================================================= region : Avg. : Avg. : Difference : Below final : Above final =============================================================================== WHEAT :Percent Million metric tons Number of years Production : World : 0.4 2.3 -7.3 6.8 20 8 U.S. : 0.1 0.0 -0.2 0.1 11 7 Foreign : 0.5 2.3 -7.3 6.8 20 8 Exports : World : 3.4 4.0 -18.8 5.0 20 8 U.S. : 3.2 1.0 -1.7 3.0 15 13 Foreign : 4.4 3.8 -18.4 4.1 23 5 Domestic use : World : 0.8 4.3 -9.7 13.1 12 16 U.S. : 3.1 0.9 -2.4 2.4 10 17 Foreign : 0.8 4.0 -8.2 13.1 14 14 Ending stocks : World : 3.8 4.9 -14.8 7.8 19 9 U.S. : 6.9 1.3 -4.4 3.2 18 10 Foreign : 4.2 4.4 -14.7 9.1 18 10 : COARSE GRAINS 2/ : Production : World : 1.0 8.5 -26.0 7.3 22 6 U.S. : 0.0 0.1 -0.2 1.3 13 6 Foreign : 1.4 8.5 -26.0 7.3 20 7 Exports : World : 3.8 4.0 -10.4 13.8 22 6 U.S. : 7.3 3.7 -8.7 12.2 13 15 Foreign : 6.8 3.7 -12.6 7.2 19 9 Domestic use : World : 0.9 7.5 -16.2 28.9 13 15 U.S. : 2.3 4.3 -17.3 11.5 12 16 Foreign : 1.0 6.7 -12.9 22.2 18 10 Ending stocks : World : 8.0 11.3 -29.9 16.4 23 5 U.S. : 9.9 5.3 -16.9 18.5 16 12 Foreign : 9.8 8.6 -28.2 11.2 23 5 : RICE, milled : Production : World : 1.3 4.6 -14.0 1.9 21 7 U.S. : 1.0 0.1 -0.3 0.2 11 4 Foreign : 1.3 4.5 -14.0 1.8 21 7 Exports : World : 6.5 1.3 -5.2 1.3 22 6 U.S. : 6.2 0.2 -0.6 0.3 14 12 Foreign : 7.3 1.2 -5.0 1.2 21 7 Domestic use : World : 1.0 3.3 -12.8 2.3 20 8 U.S. : 5.1 0.1 -0.4 0.4 12 16 Foreign : 1.0 3.3 -13.0 2.5 20 8 Ending stocks : World : 7.0 3.7 -13.9 4.0 21 7 U.S. : 17.0 0.2 -0.5 0.4 15 13 Foreign : 7.2 3.7 -13.8 4.0 21 6 =============================================================================== 1/ Footnotes at end of table. CONTINUED

WASDE-479-36 February 2010 Reliability of February Projections (Continued) =============================================================================== :Differences between proj. & final estimate,1981/82-2008/09 1/ Commodity and :============================================================= region : Avg. : Avg. : Difference : Below final : Above final =============================================================================== SOYBEANS :Percent Million metric tons Number of years Production : World : 2.2 3.5 -7.4 15.3 18 10 U.S. : 1.0 0.6 -2.5 1.8 12 11 Foreign : 3.9 3.5 -7.4 14.8 19 9 Exports : World : 4.5 2.0 -7.0 12.0 18 10 U.S. : 5.8 1.4 -4.2 3.7 18 10 Foreign : 12.7 1.9 -5.9 11.6 13 15 Domestic use : World : 2.0 2.8 -5.4 10.9 16 12 U.S. : 2.6 1.1 -3.0 2.9 19 9 Foreign : 2.3 2.3 -4.2 12.5 16 12 Ending stocks : World : 11.9 3.3 -7.2 19.3 17 11 U.S. : 22.9 1.7 -3.4 5.0 8 20 Foreign : 14.5 2.9 -6.7 14.2 19 9 : COTTON : Million 480-pound bales Production : World : 1.8 1.7 -5.4 2.8 21 7 U.S. : 0.7 0.1 -0.2 0.3 11 16 Foreign : 2.2 1.7 -5.7 2.7 21 7 Exports : World : 3.5 1.0 -3.5 2.3 16 12 U.S. : 7.8 0.6 -1.8 2.1 14 13 Foreign : 4.2 0.8 -3.5 1.4 16 12 Mill use : World : 1.8 1.6 -6.0 3.0 15 13 U.S. : 3.6 0.3 -0.9 0.8 19 8 Foreign : 1.8 1.5 -5.5 3.0 16 12 Ending stocks : World : 7.4 2.8 -7.9 7.9 17 10 U.S. : 14.1 0.8 -1.8 2.1 9 19 Foreign : 8.1 2.7 -6.7 7.4 18 10 =============================================================================== 1/ Final estimate for 1981/82-2008/09 is defined as the first November estimate following the marketing year. 2/ Includes corn, sorghum, barley, oats, rye, millet, and mixed grain.

WASDE-479-37 February 2010 Reliability of United States February Projections 1/ =============================================================================== :Differences between proj. & final estimate,1981/82-2008/09 2/ Commodity and :============================================================= region : Avg. : Avg. : Difference : Below final : Above final =============================================================================== CORN :Percent Million bushels Number of years Production : 0.0 2 -8 38 2 1 Exports : 7.6 133 -379 384 12 16 Domestic use : 2.3 152 -474 424 14 14 Ending stocks : 11.6 208 -635 838 18 10 : SORGHUM : Production : 0.0 0 0 4 0 2 Exports : 12.1 28 -90 97 17 10 Domestic use : 7.9 33 -178 100 11 17 Ending stocks : 28.4 29 -69 148 11 17 : BARLEY : Production : 0.3 1 -3 11 12 4 Exports : 15.5 7 -35 23 9 17 Domestic use : 4.8 17 -38 70 13 13 Ending stocks : 9.5 14 -52 24 19 8 : OATS : Production : 0.1 0 -2 1 4 3 Exports : 25.9 1 -1 3 6 5 Domestic use : 3.2 11 -26 36 13 15 Ending stocks : 11.0 12 -47 21 16 12 : : Thousand short tons SOYBEAN MEAL : Production : 2.2 740 -2328 1542 21 7 Exports : 7.4 522 -1900 941 21 7 Domestic use : 2.0 535 -1256 2066 18 10 Ending stocks : 28.7 71 -214 208 12 15 : : Million pounds SOYBEAN OIL : Production : 2.2 343 -1173 442 19 9 Exports : 16.9 283 -1025 814 15 13 Domestic use : 2.2 311 -735 1261 18 9 Ending stocks : 15.2 255 -692 415 16 12 ------------------------------------------------------------------------------- : ANIMAL PROD. 3/ : Million pounds Beef : 2.6 646 -1367 1613 18 8 Pork : 2.4 422 -1240 1717 18 8 Broilers : 1.4 324 -729 484 17 9 Turkeys : 2.0 94 -206 172 15 11 : : Million dozen Eggs : 1.2 77 -127 169 14 12 : : Billion pounds Milk : 1.2 1.8 -4.9 5.7 14 12 =============================================================================== 1/ See pages 35 and 36 for record of reliability for U.S. wheat, rice, soybeans, and cotton. 2/ Final estimate for 1981/82-2008/09 is defined as the first November estimate following the marketing year. 3/ Calendar years 1983 thru 2008 for meats, eggs, and milk. Final for animal products is defined as latest annual production estimate published by NASS.
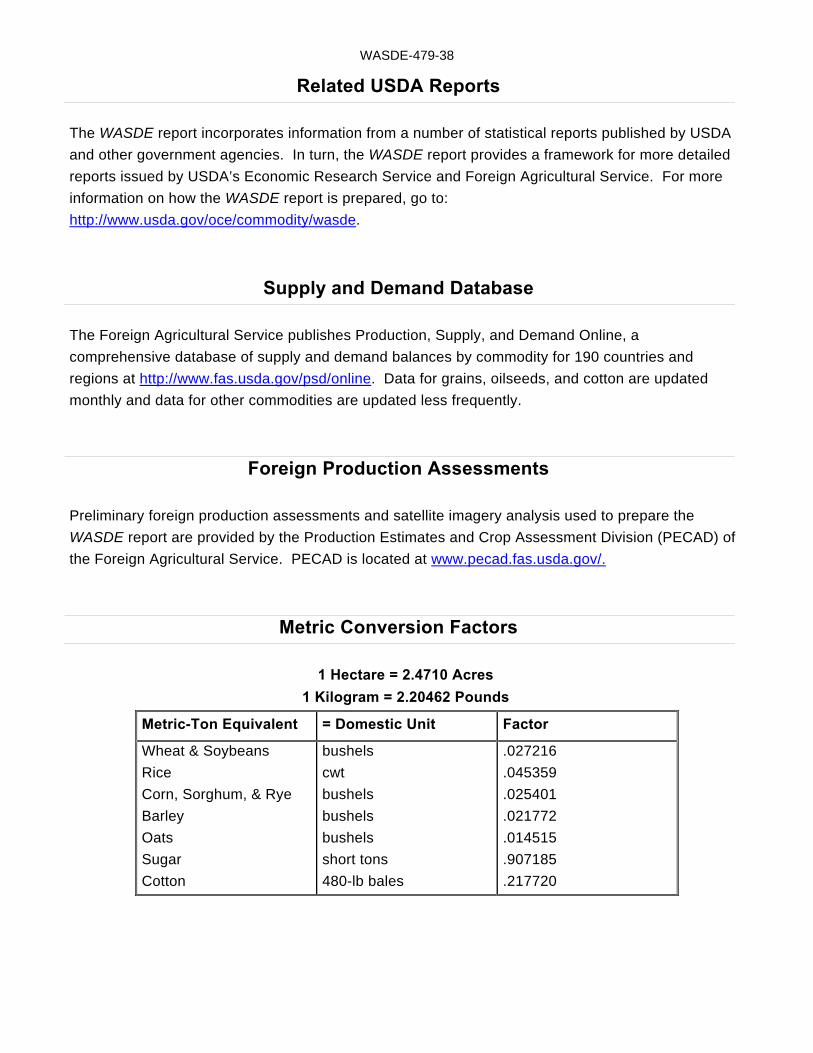
WASDE-479-38
Related USDA Reports
The WASDE report incorporates information from a number of statistical reports published by USDA
and other government agencies. In turn, the WASDE report provides a framework for more detailed
reports issued by USDA’s Economic Research Service and Foreign Agricultural Service. For more
information on how the WASDE report is prepared, go to:
http://www.usda.gov/oce/commodity/wasde.
Supply and Demand Database
The Foreign Agricultural Service publishes Production, Supply, and Demand Online, a
comprehensive database of supply and demand balances by commodity for 190 countries and
regions at http://www.fas.usda.gov/psd/online. Data for grains, oilseeds, and cotton are updated
monthly and data for other commodities are updated less frequently.
Foreign Production Assessments
Preliminary foreign production assessments and satellite imagery analysis used to prepare the
WASDE report are provided by the Production Estimates and Crop Assessment Division (PECAD) of
the Foreign Agricultural Service. PECAD is located at www.pecad.fas.usda.gov/.
Metric Conversion Factors
1 Hectare = 2.4710 Acres
1 Kilogram = 2.20462 Pounds
Metric-Ton Equivalent = Domestic Unit Factor
Wheat & Soybeans
Rice
Corn, Sorghum, & Rye
Barley
Oats
Sugar
Cotton
bushels
cwt
bushels
bushels
bushels
short tons
480-lb bales
.027216
.045359
.025401
.021772
.014515
.907185
.217720

Sustainable Agriculture: The Key to Health & Prosperity
Secretary of Agriculture Tom Vilsack invites you to join USDA’s annual Agricultural Outlook Forum
The Secretary will deliver the keynote address
and a panel of distinguished speakers has been invited to discuss:
“Sustainability, Stakeholders & Customers:
Achieving a Healthier & Secure Future”
February 18-19, 2010 Crystal City Gateway Marriott Hotel
Arlington, Virginia Topical Sessions Cover: *Rural Communities *Conservation *Food Security & Safety *Nutrition *Sustainability & Organics *World Commerce *Risk Management *Climate Change *Energy And the traditional Food Price, Farm Income, and Commodity Outlook Sessions
Registration $375
Program & registration available at:
www.usda.gov/oce/forum

UNITED STATES DEPARTMENT OF AGRICULTURE WORLD AGRICULTURAL OUTLOOK BOARD WASHINGTON, D.C. 20250-3812 ___________________ OFFICIAL BUSINESS Penalty for Private Use, $300
FIRST-CLASS MAIL POSTAGE & FEES PAID
USDA PERMIT NO. G-289
World Agricultural Supply and Demand Estimates
WASDE-479 – February 9, 2010
Electronic Subscriptions: Download the WASDE report at http://usda.mannlib.cornell.edu/.
Get a free e-mail subscription to the WASDE and other USDA crop reports at
http://usda.mannlib.cornell.edu. Select the “Reports by E-Mail” bar to sign up.
Print Subscriptions: For print subscriptions, call the National Technical Information Service
(NTIS) at 1-800-999-6779 or 703-605-6220.
The U.S. Department of Agriculture (USDA) prohibits discrimination in all its programs and
activities on the basis of race, color, national origin, gender, religion, age, disability, political
beliefs, sexual orientation, and marital or family status. (Not all prohibited bases apply to all
programs.) Persons with disabilities who require alternative means for communication of program
information (Braille, large print, audiotape, etc.) should contact USDA’s TARGET Center at 202-
720-2600 (voice and TDD).
To file a complaint of discrimination, write USDA, Director, Office of Civil Rights, Room 326-W,
Whitten Building, 1400 Independence Avenue, SW, Washington, D.C. 20250-9410 or call (202)
720-5964 (voice or TDD). USDA is an equal opportunity provider and employer.