Grahamstown Public School€¦ · Grahamstown Public School Annual School Report 2014 ......
17
Grahamstown Public School Annual School Report 2014 4609
Transcript of Grahamstown Public School€¦ · Grahamstown Public School Annual School Report 2014 ......
[school code]
Grahamstown Public School
Annual School Report 2014
4609

1
School context statement A quality learning environment with a focus
on technology integration, pride in uniform
and extensive sporting and cultural activities
make Grahamstown Public School an exciting
school for students.
Grahamstown attracts equity funding which
has been used for staff professional learning
and improvement in the teaching of writing.
Students are provided with a wide variety of
quality educational opportunities delivered
by highly qualified, innovative and dedicated
teachers. Programs are tailored to individual
learning styles and the needs of all students.
Students build social skills through our peer
support and leadership initiatives. Our
Student Parliament provides opportunity for
our students to participate in school decision
making. Strong debating and public speaking
programs for Year 1 to Year 6 develop
student confidence and communication skills.
Our Positive Behaviour for Learning (PBL) has
developed a consistent approach to discipline
and has built a structure of expectations
which are delivered in class lessons and
whole school assemblies.
A welcoming and friendly school, we work in
close partnership with parents and the wider
community. Grahamstown Public School
prides itself on providing an environment of
innovation, opportunity and success for its
students.
Princpal’s message The students of Grahamstown Public School have
demonstrated their capacity to adapt, be
supportive, lead and learn throughout 2014. They
have had opportunity to experience many extra-
curricular activities during the year and have
demonstrated their commitment to their chosen
activity by rehearsing, practising, performing and
playing in their own time. Grahamstown staff and
students are a dedicated group who are strongly
supported by parents and the school community
in the endeavours and goals for which we strive.
The Gifted and Talented Program (GATS) has seen
students participate in Starstruck, Tournament of
the Minds, Science and engineering challenge
days and literary and visual art activities. The
students were also given opportunity to make
connections with Newcastle University through a
University Reading Program for Year 2, a Year 6
discovery day and a Year 4 Smart Science Show.
Further connections were also developed with
the local high school through Year 4 and 5
students participating in the GATS enrichment
program in varying fields through terms two and
three.
The dedicated debating team trained during
lunch breaks and achieved success in several of
their debating opportunities. They will be a force
to be reckoned with in future endeavours as their
skills and confidence continue to grow.
Grahamstown Public School was again well
represented in the zone Public Speaking Finals.
The students consistently demonstrate their
confidence and capacity to engage an audience
when representing the school in zone and
regional finals.
Students were also given opportunity to
represent their school in softball, netball, rugby
league, soccer, touch football, cricket and
basketball. On each occasion the teams
represented the school with pride and were
praised for their excellent behaviour and
sportsmanship. As a school we are very proud of
the reputation our students build as good sports

2
and citizens. They represent our school with pride
and reflect the values taught and the expectation
of our school community.
Students were given many opportunities to
develop their leadership skills whilst preparing
activities for the 007 Program, the Peer Support
Program and Peer Tutoring Program. Our senior
students excelled in operating the programs
while demonstrating their citizenship as each of
the activities relies on volunteers.
The school’s Positive Behaviour for Learning(PBL)
Program has seen the students taught the four
school rules of Act Safely, Be Respectful,
Cooperate and Do Your Best. The students are
rewarded for meeting the school expectations
with a ‘Graham’, which is the mascot for the
program. The program has developed a more
positive attitude toward discipline and has seen a
common approach to teaching and enforcing
school expectations. The program is having a
positive impact on the school.
During 2015 the PBL program will move to
classroom expectations. Students, staff and
parents will develop a common set of
expectations centred round our core rules. The
development of these common expectations is
for common practice to become imbedded in the
daily routine for all students and staff.
Sue Kane
Student representative message As the 2014 school captains of Grahamstown
Public School, we have had the opportunity to be
part of so many events such as representing the
school, sporting events, fundraisers and so much
more.
We have had the opportunity to represent our
school on ANZAC Day. We were honoured to lay a
wreath and speak on behalf of all the brave
soldiers that fought for our country.
On the 14th of May we held a fundraiser, where
we sold handballs for $3. All the money raised
went to the Stewart House Foundation.
In August we had grandparents come in for
Grandparents’ Day. Grandparents’ Day is where
student’s grandparents come in and look at the
work their grandchildren have created
throughout the year, and we also had a sausage
sizzle and mini sports carnival.
On the 21st of August we held a cake stall to raise
money for the Year 6 farewell. On that day we
raised $714.
We held Nuf Nuf Day on the 16th of September.
Nuf Nuf Day is where year 5 and 6 have stalls and
activities for younger students to come and buy
things and have a go at the activities for 5c and
10c pieces.
On the 22nd of October students at our school
wore the bandanas they bought throughout the
previous 2 weeks for $4 and we raised $900 for
Canteen Cancer Council. We also came dressed in
our favourite team’s footy colours for a gold coin
donation and the money from that went to the
Mark Hughes Foundation.
This year, every Year 6 had the opportunity to
participate in 007 duties around the school. This
teaches them responsibility and leadership which
will help as they become older.
I’m sure the captains and prefects elected for
2015 will do a great job, so good luck and best
wishes to all of them. Thank you to students for
choosing us to be leaders and role models for
3
2014. We hope we have helped the next
generation of leaders.
Lilly Cashen and Lachlan Ruba.
Student information
It is a requirement that the reporting of information for all students be consistent with privacy and personal information policies.
In 2013 the expected enrolment for the
commencement of 2014 was 386. The
enrolment throughout 2014 has remained
close to the original expected population.
There will be a decrease for 2015 due to a
reduction in our zoned enrolment area.
Our student population is drawn from the
eastern side of Raymond Terrace with most
students living in close proximity to the
school.
Within the student population, 5% of
children have Language Backgrounds Other
Than English (LBOTE), 13% identify as
Aboriginal or Torres Strait Islander(ATSI) and
8% are from Australian Defence Force
families. The school’s student profile reflects
the community profile. In 2014 the school
was supported by Transition Equity Funding
and this funding will continue to support
Grahamstown School throughout 2015.
Student enrolment profile
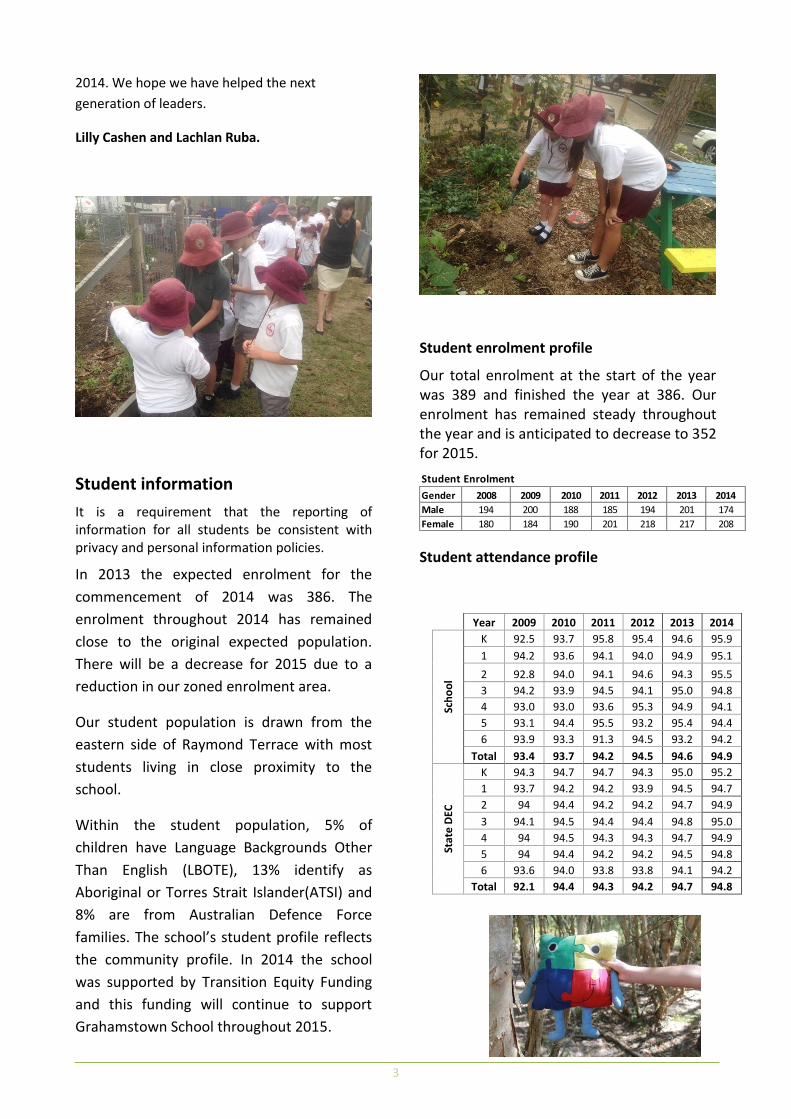
Our total enrolment at the start of the year was 389 and finished the year at 386. Our enrolment has remained steady throughout the year and is anticipated to decrease to 352 for 2015.
Student attendance profile
Gender 2008 2009 2010 2011 2012 2013 2014
Male 194 200 188 185 194 201 174
Female 180 184 190 201 218 217 208
Student Enrolment
Year 2009 2010 2011 2012 2013 2014
Sch
oo
l
K 92.5 93.7 95.8 95.4 94.6 95.9
1 94.2 93.6 94.1 94.0 94.9 95.1
2 92.8 94.0 94.1 94.6 94.3 95.5
3 94.2 93.9 94.5 94.1 95.0 94.8
4 93.0 93.0 93.6 95.3 94.9 94.1
5 93.1 94.4 95.5 93.2 95.4 94.4
6 93.9 93.3 91.3 94.5 93.2 94.2
Total 93.4 93.7 94.2 94.5 94.6 94.9
Stat
e D
EC
K 94.3 94.7 94.7 94.3 95.0 95.2
1 93.7 94.2 94.2 93.9 94.5 94.7
2 94 94.4 94.2 94.2 94.7 94.9
3 94.1 94.5 94.4 94.4 94.8 95.0
4 94 94.5 94.3 94.3 94.7 94.9
5 94 94.4 94.2 94.2 94.5 94.8
6 93.6 94.0 93.8 93.8 94.1 94.2
Total 92.1 94.4 94.3 94.2 94.7 94.8

4
Workforce information
The staff at Grahamstown Public School is varied in its experience, employment tenure and job description. All teaching staff are qualified for their teaching role and many take on additional responsibilities beyond classroom teacher. There are four executive staff members including three assistant principals and one non-teaching principal. The part-time allocation of Grahamstown’s staffing formula is used to support both students experiencing difficulty and gifted and talented students. The staffing component attached to the equity funding Grahamstown Public School receives has been used for support of staff in the writing program.
Our non-teaching staff comprise of four part-time School Learning Support Officers, two full-time office staff, two part-time office staff and a general assistant.
Workforce composition
Position Number
Principal 1
Deputy Principal(s) 0
Assistant Principal(s) 3
Head Teachers 0
Classroom Teacher(s) 12
Teacher of Reading Recovery 0.42
Learning and Support Teacher(s) 1.6
Teacher Librarian 0.8
Teacher of ESL 0
School Counsellor 1
School Administrative & Support Staff 4.852
Total 24.672
The Australian Education Regulation, 2014 requires schools to report on Aboriginal composition of their workforce.
Two Aboriginal teachers are employed on a
permanent basis at our school. One is a
proud member of the Wiradjuri people from
the Wambol River area and takes an active
role in Aboriginal education, including being a
member of the local Youyoong Aboriginal
Education Consultative Group as well as the
indigenous community. The other is a proud
member of the Wanarrua Nation.
Teacher qualifications
All teaching staff meet the professional requirements for teaching in NSW public schools.
Qualifications % of staff
Degree or Diploma 83
Postgraduate 17
Professional learning and teacher accreditation
During this year the focus for professional learning has been pedagogy.
Throughout 2014 Grahamstown Public School has been implementing a writing program where a target group of staff are given weekly support in the classroom from an instructional leader for the development of strategies to improve the teaching of literacy from a writing focus. The target group are then given additional professional learning on improved pedagogy in writing and the presentation of quality literature to improve writing quality.
This program will extend to an additional stage in 2015.
5
In addition to the writing project six staff have attended a session on quality pedagogy followed by a visit to a school where the style of explicit teaching is having a dramatic effect on the outcomes achieved by students. The style of explicit teaching will be further explored before trial implementation during 2015 at Grahamstown Public School.
Significant professional learning has been centred round the implementation of the new curriculum so staff are prepared through the development of a relevant scope and sequence and a raised awareness of the content of the new documents.
Seven staff members are in the process of maintaining their accreditation. This requires 100 hours of professional development over a five year period. Each of these staff members is current with their professional learning hours and is monitored against a set of national standards.
By 2018 all staff will be required to maintain accreditation and will be monitored using the Australian Teaching Standards guidelines.
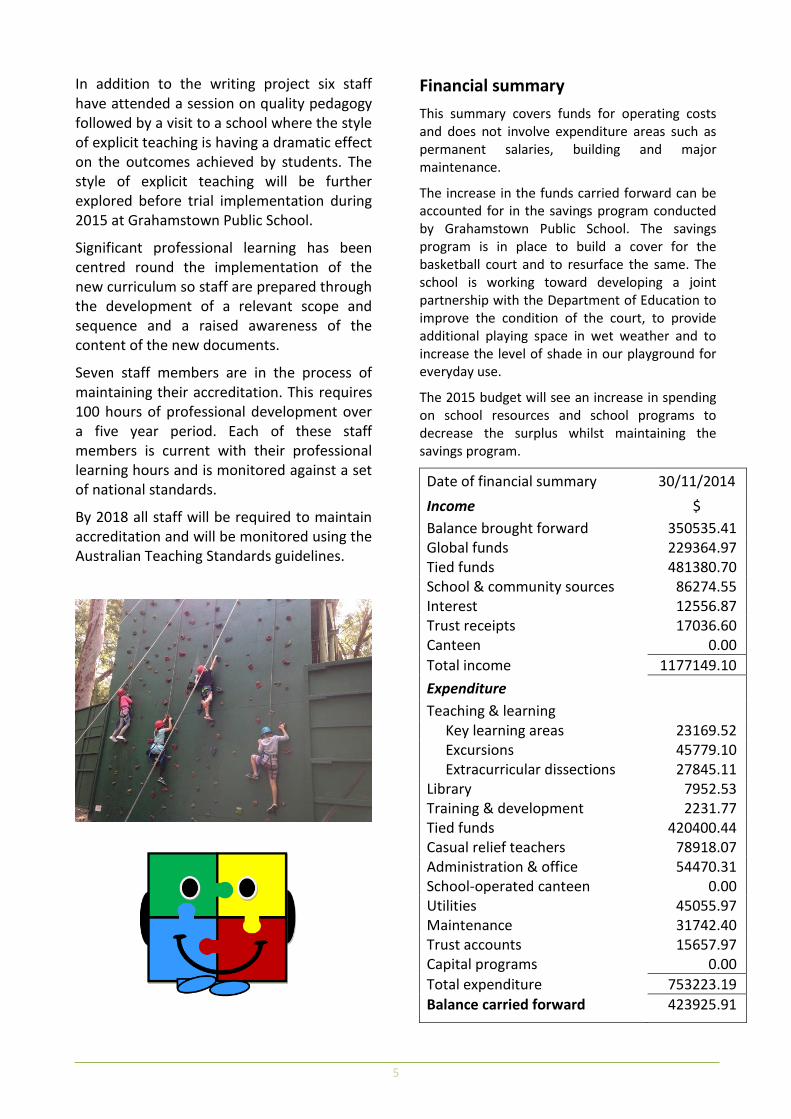
Financial summary
This summary covers funds for operating costs and does not involve expenditure areas such as permanent salaries, building and major maintenance.
The increase in the funds carried forward can be accounted for in the savings program conducted by Grahamstown Public School. The savings program is in place to build a cover for the basketball court and to resurface the same. The school is working toward developing a joint partnership with the Department of Education to improve the condition of the court, to provide additional playing space in wet weather and to increase the level of shade in our playground for everyday use.
The 2015 budget will see an increase in spending on school resources and school programs to decrease the surplus whilst maintaining the savings program.
Date of financial summary 30/11/2014
Income $
Balance brought forward 350535.41 Global funds 229364.97 Tied funds 481380.70 School & community sources 86274.55 Interest 12556.87 Trust receipts 17036.60 Canteen 0.00
Total income 1177149.10
Expenditure
Teaching & learning Key learning areas 23169.52 Excursions 45779.10 Extracurricular dissections 27845.11
Library 7952.53 Training & development 2231.77 Tied funds 420400.44 Casual relief teachers 78918.07 Administration & office 54470.31 School-operated canteen 0.00 Utilities 45055.97 Maintenance 31742.40 Trust accounts 15657.97 Capital programs 0.00
Total expenditure 753223.19
Balance carried forward 423925.91
6
A full copy of the school’s 2014 financial statement is tabled at the annual general meetings of the School Council and/or the parent body. Further details concerning the statement can be obtained by contacting the school.
School performance 2014
The results collected through internal assessment programs represented greater accuracy of the current achievement levels of the majority of students at Grahamstown Public School. Staff have worked exceptionally hard throughout 2014 to ensure improvement in skills in the area of literacy. The focus has targeted the students vocabulary use, their sentence structure and grammatical knowledge. There have been significant gains in the quality of students writing results throughout the year.
It has been recognised that a more detailed method of collating data is necessary to determine with greater accuracy exactly where our students lie on the literacy continuum. This will be developed and implemented during 2015.
Student achievement in numeracy, particularly in NAPLAN, has demonstrated the need for improved data collection of internal results. This data collection is needed for accurate tracking of student achievement and improvement and for determining student need.
Academic achievements
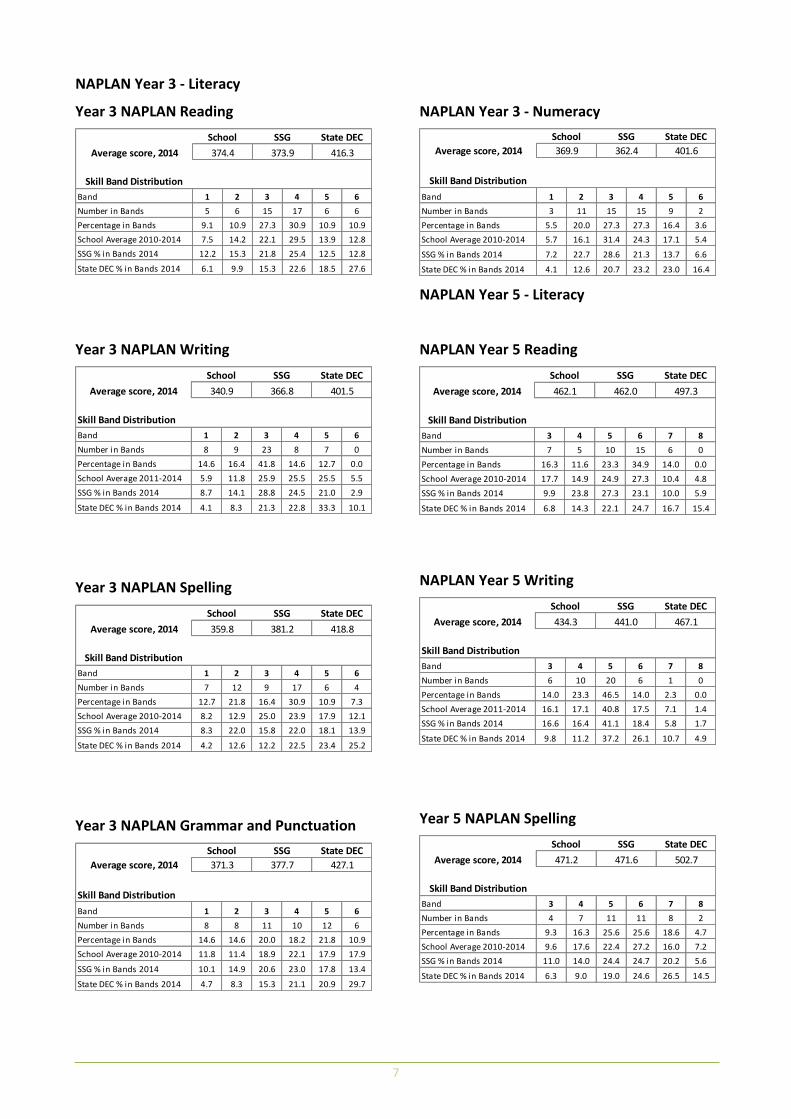
NAPLAN
In the National Assessment Program, the results across the Years 3, 5, 7 and 9 literacy and numeracy assessments are reported on a scale from Band 1 to Band 10.
The achievement scale represents increasing levels of skills and understandings demonstrated in these assessments.
Year 3: from Band 1 (lowest) to Band 6 (highest for Year 3)
Year 5: from Band 3 (lowest) to Band 8 (highest for Year 5)
Year 7: from Band 4 (lowest) to Band 9 (highest for Year 7)
Year 9: from Band 5 (lowest) to Band 10 (highest for Year 9)
The My School website provides detailed information and data for national literacy and numeracy testing (NAPLAN).
Click on the link http://www.myschool.edu.au and enter the school name in the Find a school and select GO to access the school data.
Alternatively:
7
NAPLAN Year 3 - Literacy
Year 3 NAPLAN Reading
Year 3 NAPLAN Writing
Year 3 NAPLAN Spelling
Year 3 NAPLAN Grammar and Punctuation
NAPLAN Year 3 - Numeracy
NAPLAN Year 5 - Literacy
NAPLAN Year 5 Reading
NAPLAN Year 5 Writing
Year 5 NAPLAN Spelling
1 2 3 4 5 6
5 6 15 17 6 6
9.1 10.9 27.3 30.9 10.9 10.9
7.5 14.2 22.1 29.5 13.9 12.8
12.2 15.3 21.8 25.4 12.5 12.8
6.1 9.9 15.3 22.6 18.5 27.6
Average score, 2014
Skill Band Distribution
Number in Bands
Percentage in Bands
School Average 2010-2014
SSG % in Bands 2014
State DEC % in Bands 2014
Band
416.3
State DEC
373.9
SSG
374.4
School
Skill Band Distribution
1 2 3 4 5 6
8 9 23 8 7 0
14.6 16.4 41.8 14.6 12.7 0.0
5.9 11.8 25.9 25.5 25.5 5.5
8.7 14.1 28.8 24.5 21.0 2.9
4.1 8.3 21.3 22.8 33.3 10.1
School Average 2011-2014
State DECSSG
366.8 401.5
Band
Number in Bands
Percentage in Bands
SSG % in Bands 2014
State DEC % in Bands 2014
School
Average score, 2014 340.9
1 2 3 4 5 6
7 12 9 17 6 4
12.7 21.8 16.4 30.9 10.9 7.3
8.2 12.9 25.0 23.9 17.9 12.1
8.3 22.0 15.8 22.0 18.1 13.9
4.2 12.6 12.2 22.5 23.4 25.2
Band
Number in Bands
Percentage in Bands
State DEC
Average score, 2014 359.8 381.2 418.8
School SSG
Skill Band Distribution
School Average 2010-2014
SSG % in Bands 2014
State DEC % in Bands 2014
Skill Band Distribution
1 2 3 4 5 6
8 8 11 10 12 6
14.6 14.6 20.0 18.2 21.8 10.9
11.8 11.4 18.9 22.1 17.9 17.9
10.1 14.9 20.6 23.0 17.8 13.4
4.7 8.3 15.3 21.1 20.9 29.7State DEC % in Bands 2014
SSG % in Bands 2014
Percentage in Bands
Number in Bands
Band
School Average 2010-2014
SSG State DEC
Average score, 2014 371.3 377.7 427.1
School
1 2 3 4 5 6
3 11 15 15 9 2
5.5 20.0 27.3 27.3 16.4 3.6
5.7 16.1 31.4 24.3 17.1 5.4
7.2 22.7 28.6 21.3 13.7 6.6
4.1 12.6 20.7 23.2 23.0 16.4
Skill Band Distribution
State DEC % in Bands 2014
SSG % in Bands 2014
School Average 2010-2014
Percentage in Bands
Number in Bands
Band
SSG
362.4
School
369.9Average score, 2014
State DEC
401.6
3 4 5 6 7 8
7 5 10 15 6 0
16.3 11.6 23.3 34.9 14.0 0.0
17.7 14.9 24.9 27.3 10.4 4.8
9.9 23.8 27.3 23.1 10.0 5.9
6.8 14.3 22.1 24.7 16.7 15.4
462.1Average score, 2014
State DECSSGSchool
497.3462.0
SSG % in Bands 2014
Skill Band Distribution
Band
Number in Bands
Percentage in Bands
State DEC % in Bands 2014
School Average 2010-2014
Skill Band Distribution
3 4 5 6 7 8
6 10 20 6 1 0
14.0 23.3 46.5 14.0 2.3 0.0
16.1 17.1 40.8 17.5 7.1 1.4
16.6 16.4 41.1 18.4 5.8 1.7
9.8 11.2 37.2 26.1 10.7 4.9
School Average 2011-2014
441.0 467.1Average score, 2014
Number in Bands
Percentage in Bands
SSG % in Bands 2014
State DEC % in Bands 2014
Band
School SSG State DEC
434.3
3 4 5 6 7 8
4 7 11 11 8 2
9.3 16.3 25.6 25.6 18.6 4.7
9.6 17.6 22.4 27.2 16.0 7.2
11.0 14.0 24.4 24.7 20.2 5.6
6.3 9.0 19.0 24.6 26.5 14.5
471.6
Percentage in Bands
School Average 2010-2014
School SSG State DEC
Average score, 2014 471.2 502.7
Skill Band Distribution
Band
SSG % in Bands 2014
State DEC % in Bands 2014
Number in Bands

8
Year 5 NAPLAN Grammar and Punctuation
NAPLAN Year 5 - Numeracy
Grahamstown Public School students in both Year 3 and 5 are predominantly achieving in the middle 3 bands. Throughout 2014 the literacy area was targeted with an endeavor to improve the results of students and increase the percentage of students gaining higher level bands in NAPLAN.
A greater emphasis on explicit teaching and assessment for learning was used to target the specific needs of individual students.
The aim of all staff at Grahamstown Public School is to increase the number of students achieving in the top bands but more importantly to increase student capacity to apply the knowledge gained through the explicit teaching process.
Other achievements Garden Club 2014
2014 was another busy and productive year for
the school garden club. The upgrade to the
school vegie patch has had positive influence felt
throughout the school. The garden was officially
opened earlier this year with all the people from
GPS and the community that assisted in making
the project a success attending the grand
opening. The new learning space has inspired a
range of initiatives at GPS including collecting
scrap from class fruit breaks to compost and feed
the chickens and more students are participating
in lunchtime garden activities. All the hard work
was rewarded when GPS received a Tidy Towns
Schools award for schools our size.
The garden club has continued to assist in the
maintenance of the school grounds with
weeding, pruning, mulching, raking and planting
being carried out throughout the year. The
garden club has revitalised the garden at the
school’s entrance giving the school an attractive
and welcoming appearance. Next year the garden
club plans to identify more areas to transform
and beautify.
Sadly we had to say farewell to one of our four
chickens who passed away. Specially selected
Year 5 students have performed admirably in
maintaining the health and lifestyle of our three
remaining chickens.
The end of 2014 saw the erection of a new black
security fence around GPS. It is hoped this will
deter trespassers from vandalising our garden. In
2015 we would like to incorporate student art
features to our garden areas.
Sport
This year our sports carnival, cross country and
swimming carnivals were won by Hastings and
Eldon achieved first place in the ball games
carnival. Students participated in a wide variety
of sports including; Rugby League, Oztag,
Basketball and Softball. We had particular success
in softball, advancing to the fourth round in the
PSSA competition.
We have had individual success this year as one
of our Year 6 girls was selected for the Hunter
Cricket team. Four of our students represented
our Zone at the Hunter Sports Carnival which is
the most students Grahamstown P.S. has ever
had there. One of our Year 4 boys achieved such
great results he progressed through to make the
Hunter Athletics Team for discus.
Several staff were involved as PSSA convenors or
officials at Regional carnivals. This tradition of
participation by both students and teachers will
continue in 2015 as Grahamstown P.S. believes in
Skill Band Distribution
3 4 5 6 7 8
6 7 5 10 12 3
14.0 16.3 11.6 23.3 27.9 7.0
13.6 16.8 27.2 19.2 16.4 6.8
11.7 18.8 23.5 21.5 15.5 9.0
7.1 12.5 18.4 20.8 20.2 21.0
14.0 16.3 11.6 23.3 27.9 7.0
SSG State DEC
504.7
School
471.7 467.9
Number in Bands
Percentage in Bands
School Average 2010-2014
SSG % in Bands 2014
State DEC % in Bands 2014
Band
Average score, 2014
3 4 5 6 7 8
2 14 12 12 3 0
4.7 32.6 27.9 27.9 7.0 0.0
10.6 20.7 26.8 27.6 9.8 4.5
11.1 22.6 29.3 23.4 9.3 4.2
6.4 15.7 23.5 27.8 13.5 13.0
456.5448.0
School State DEC
Skill Band Distribution
Average score, 2014
SSG
SSG % in Bands 2014
Number in Bands
Percentage in Bands
School Average 2010-2014
State DEC % in Bands 2014
Band
488.5

9
developing the skills and healthy lifestyles that
playing sport promotes.
Gifted and Talented Program This year, students from Kindergarten to Stage 3 have been provided with opportunities to participate and demonstrate their abilities in a variety of Gifted and Talented programs. The programs offered were designed to give students opportunities to be extended in an area of which they demonstrate a significant talent. Throughout the year different students were selected to participate in individual/group projects, problem solving, creative and critical thinking activities. Grahamstown participated in a number of activities provided by the University of Newcastle Aim High Program; these included the Year 5 Careers program, Year 6 Discovery Day, Stage 2 Dino Dig and Year 2 What do they do?
At the end of third term we took a team of 24 year 5 and 6 students to Maitland to compete in the Science and Engineering Challenge where they had to compete against other schools in a variety of challenges. At the conclusion of the day Grahamstown came in third position.
Seven students from Year 5 and 6 participated in Tournament of the Minds in the area of applied technology. The students won the regional final and competed at State level in Sydney.
This year 8 students from Year 5 and 6 represented the school debating team when they participated in the Premier’s Debating Challenge and finished second in their local region.
The Irrawang High School GATS program continued with 4 Year 6 students and 6 Year 5 students who were selected by a panel of high school teachers. They visited the high school on several occasions throughout the year working in different areas of the curriculum. In Term 1 4 Year 4 students participated in a bridge building task with all primary schools in the Lakeside Learning Community. At the conclusion of Term 3 Grahamstown participated in an Enrichment Afternoon at Irrawang High School to showcase our students work in enrichment throughout the year.
This year 3 individual students from Year 6 were selected to attend a Science and English and
CAPA GATS camp where they participated in organised activities over a 3 day period.
In the area of Creative and Performing Arts, Grahamstown participated in Starstruck with 16 students from Stage 3. This year we entered one artwork in the Operation Art Exhibition in Sydney, we also had two student artworks selected to be exhibited at Maitland Art Gallery as a part of the 2014 FACE exhibition. 24 students from year 4, 5 and 6 were selected to participate in a photography workshop conducted by the Moran Foundation. Students’ photos were entered in the primary division of the Moran Photography competition with 1 year 6 student selected as a finalist.
Selected Year 5 and 6 students participated in the Newcastle Permanent Maths Competition, with pleasing results including 2 Distinctions and 16 credits. Stage 3 also participated in the Maths Olympiad Competition with 1 student achieving in the top 30%.
This year Grahamstown entered the Newcastle Herald Competition with 10 year 6 students completing our submission which included six feature stories, one editorial, photos to accompany stories and a cartoon.
At the end of Term 4 an Enrichment Celebration day was organised to provide students in Kindergarten to Year 2 with an opportunity to engage in activities which recognised individual student’s strengths and talents.
At Grahamstown, extension activities were offered to the whole school through the Science Fair Competition and Talent Quest.
Reading Recovery
Reading Recovery is an early intervention
program designed for children who are clearly at
risk in Literacy learning after a year in a good
classroom program. Entry to the program is
based on being a child’s second year at school
and who are performing within the lowest
Literacy levels in Year 1.
Reading Recovery has been implemented at
Grahamstown Public School for eleven years and
will continue in 2015. The time allocation
accommodates four students per day, as the
teacher will be training.
10
In 2014 there were 13 children who participated
in the program during the year. Eight of the
students were girls and five were boys. Five
students were carry-overs from 2013. Seven
students were discontinued successfully from the
program, two students were referred for further
support and one was referred due to behaviour.
The remaining three students will be carry- overs
in 2015.
Most of the children who entered the program in
2014 had reasonable letter identification but
used letter names for identification. Word
knowledge, both written and read in text and in
isolation was a weakness along with Concepts
About Print and one to one matching.
Directionality across words and letters was poor.
Children who entered the program in 2014 in the
first intake were at text level 1, 2 and 3. The later
intakes of children entered on levels between 2
and 5.
The carry-over students who successfully
discontinued were on the program for between
12 and 21 weeks, while students who entered the
program in 2014 discontinued between 13 and 17
weeks.
A buddy system to assist students with
homework was used for year two students this
year. It was put in place to encourage and
support children with their reading, allowing
them to read to an older student at least twice a
week.
The Reading Recovery Program continues to
impact on the Literacy programs at Grahamstown
Public School with most staff familiar with
running record analysis and using Reading
Recovery levelled texts in Guided Reading. Early
Stage 1 and Stage 1 teachers are more aware of
explicitly teaching strategies to assist their
students in reading and writing. In Year 1, there
are 18 students who did not reach the school’s
benchmark level of instructional level 16 by the
end of the year. Not all at risk students were able
to access Reading Recovery during 2014.
Students who participated in Reading Recovery in
2012 completed the NAPLAN Test in 2014. Five of
the seven students who discontinued from the
program are still at Grahamstown Public in Year
3. Of these,one performed in Band 4, one in Band
3 and 0ne in Band 2 and two in Band 1 for
Reading. In the Writing results, one performed in
Band 3, one performed in Band 2 and three in
Band 1.
The future direction of Reading Recovery in
Grahamstown Public School will be to train a new
teacher, Kristy Webb, to continue the home-
reading program after children discontinue
successfully from the program and to support
those children in the classroom. These strategies
have assisted students to have more success
when they return to the classroom situation.
I appreciate the support the Principal, Sue Kane,
School Executive, my Support Teacher, Early
Stage 1 and Stage 1 teachers and staff members
have shown throughout this year. I would also
like to thank my Tutor, Maxine Foley, for her
guidance, expertise and encouragement and my
Reading Recovery colleagues for their friendship,
support and assistance throughout the year.
Reading Recovery Teacher
Susan Dellar.
Significant programs and initiatives –
Policy and equity funding
Socio-economic background Grahamstown Public School received $265000 in Equity Funding for 2014. Our school had a Family Occupation and Education Index (FOEI) of 132 which is higher than the state average. The higher than average index generated the funding received to support additional programs within our school.
Throughout 2014 the additional funding has been used to improve pedagogy in writing, the delivery of quality literature to improve writing and comprehension skills. The development of consistent practices in the delivery of literacy lessons was introduced to Stage 2 as were the WALT (We Are Learning To) and WILF (What Am I Looking For) components of pedagogy.
The funding targeted support in Stage 2 classrooms for staff to have intensive
11
professional learning. Two Instructional Leaders were employed to conduct the professional learning which took place on a weekly basis. Staff were given guidance to develop specific learning intentions for each lesson (WALT) and to present targeted writing skills during their quality literacy sessions.
Students became more engaged in their learning and more skilled in writing using correct sentence and grammatical structure.
The language of writing was also targeted so all staff and students use the same terminology. All grammatical components now have the correct terminology taught and students are encouraged to use this language in their learning.
Each stage has developed a code to use to prompt students to edit their work. This code is simplistic in its approach but has proven to be a successful prompt for all students to determine if their sentences contain the correct grammatical elements.
A significant increase in NAPLAN results was not recorded for 2014. However the program was in its initial phase.
School assessment data shows a significant increase in the number of students who can write using correct grammatical structures. An increasing number of students are able to include compound and complex sentences within their writing and the use of descriptive has dramatically improved throughout 2014.
The program will expand through 2015 to include Stage 1 students whilst Stage 2 will continue their development of common practice across all
classes. Writing Project
The Targeted Literacy Writing project was
implemented at the start of 2014 with the
purpose of enhancing student writing skills
across the school over a period of time. The
initial phase of the project was focused on
looking at current educational research to
identify skills, practices and support materials
that could be implemented in the classroom. The
project was designed to target two main groups
for professional learning in 2014 – Whole staff
and a team of 5 teachers from stage 2 and 3.
Whole staff: A series of workshops were held to
establish a common understanding and language
across the school of the new K-6 English syllabus,
identification and sharing of specific learning
intentions with students, the use of quality texts
in classrooms and the introduction of common
classroom practices to support the development
of literacy.
Writing team: Five teachers were provided with a
range of professional learning opportunities,
classroom support and mentoring to enhance
their literacy teaching and classroom practice
based on current research findings. Quality texts
were used as the catalyst for the explicit teaching
of skills, the development of uniform terminology
and a range of specific teaching strategies. In
class support targeted the teaching of identified
skills during literacy sessions and the provision of
additional planning time allowed teachers to
discuss their practices and identify future
directions and resources.
The project will continue in 2015 with support
being provided to a new team of teachers and
2014 participating teachers as well as the
provision of whole school professional learning
development opportunities.
Learning and Support The staffing component for equity funding has been utilized to support individuals experiencing difficulty with curriculum. In class support has been offered across all stages using the 0.6 equity additional staff, the Learning and Support Teachers (LaST) and a portion of the 0.6 part time allocation.
Support in classes has been offered for individuals experiencing difficulty with both literacy and numeracy tasks. The support staff have worked in conjunction with classroom teachers to give individuals greater access to curriculum at grade level.
The part time allocation (0.3) was used to support Gifted and Talented Students (GATS) at Grahamstown Public School. GATS information is included in another section of this report.
12
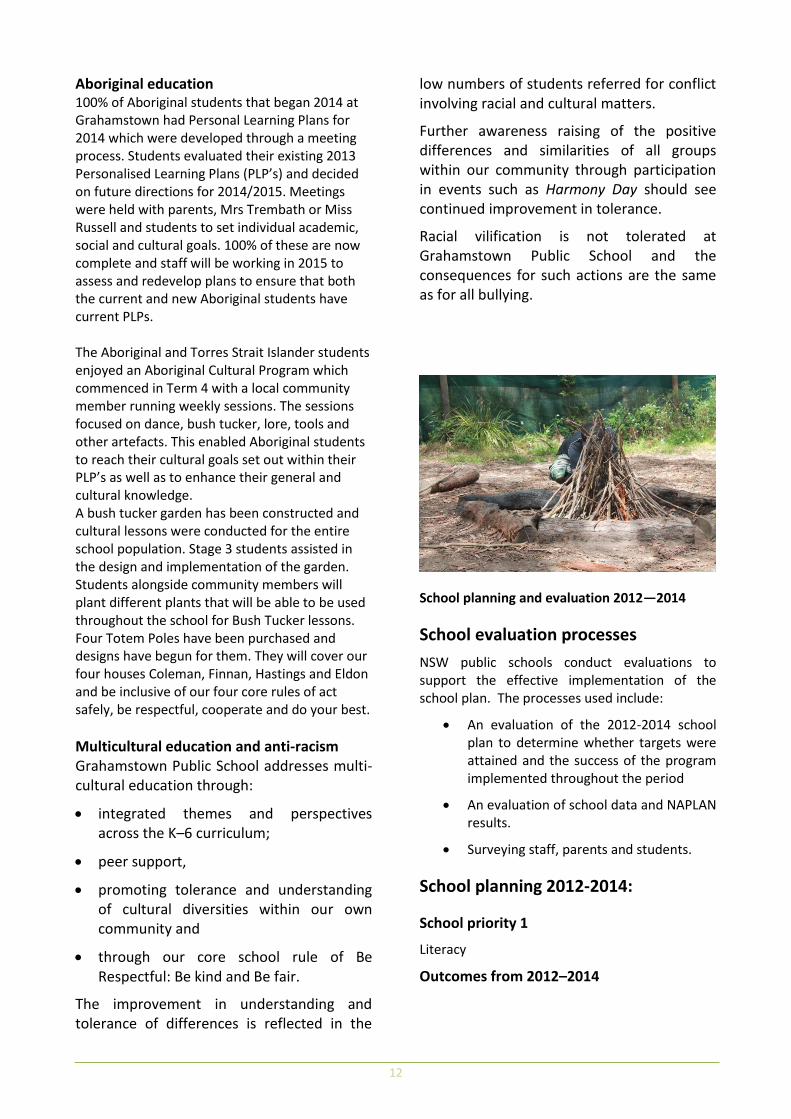
Aboriginal education 100% of Aboriginal students that began 2014 at Grahamstown had Personal Learning Plans for 2014 which were developed through a meeting process. Students evaluated their existing 2013 Personalised Learning Plans (PLP’s) and decided on future directions for 2014/2015. Meetings were held with parents, Mrs Trembath or Miss Russell and students to set individual academic, social and cultural goals. 100% of these are now complete and staff will be working in 2015 to assess and redevelop plans to ensure that both the current and new Aboriginal students have current PLPs. The Aboriginal and Torres Strait Islander students enjoyed an Aboriginal Cultural Program which commenced in Term 4 with a local community member running weekly sessions. The sessions focused on dance, bush tucker, lore, tools and other artefacts. This enabled Aboriginal students to reach their cultural goals set out within their PLP’s as well as to enhance their general and cultural knowledge. A bush tucker garden has been constructed and cultural lessons were conducted for the entire school population. Stage 3 students assisted in the design and implementation of the garden. Students alongside community members will plant different plants that will be able to be used throughout the school for Bush Tucker lessons. Four Totem Poles have been purchased and designs have begun for them. They will cover our four houses Coleman, Finnan, Hastings and Eldon and be inclusive of our four core rules of act safely, be respectful, cooperate and do your best.
Multicultural education and anti-racism Grahamstown Public School addresses multi-cultural education through:
integrated themes and perspectives across the K–6 curriculum;
peer support,
promoting tolerance and understanding of cultural diversities within our own community and
through our core school rule of Be Respectful: Be kind and Be fair.
The improvement in understanding and tolerance of differences is reflected in the
low numbers of students referred for conflict involving racial and cultural matters.
Further awareness raising of the positive differences and similarities of all groups within our community through participation in events such as Harmony Day should see continued improvement in tolerance.
Racial vilification is not tolerated at Grahamstown Public School and the consequences for such actions are the same as for all bullying.
School planning and evaluation 2012—2014
School evaluation processes
NSW public schools conduct evaluations to support the effective implementation of the school plan. The processes used include:
An evaluation of the 2012-2014 school plan to determine whether targets were attained and the success of the program implemented throughout the period
An evaluation of school data and NAPLAN results.
Surveying staff, parents and students.
School planning 2012-2014:
School priority 1
Literacy
Outcomes from 2012–2014

13
School based data reflecting students achieving stage appropriate outcomes for literacy.
Students to be extended to increase achievement levels and increase the percentage of students in the top bands for NAPLAN.
Decrease the gap between Aboriginal and non-Aboriginal students.
Explicit teaching will become a key component in every classroom.
Evidence of achievement of outcomes in 2014:
Students achieving benchmark for literacy in Kindergarten to Year 2 (K-2) was 69% and in Year 3 to Year 6 was 72%.
The number of students achieving proficiency in literacy has remained steady for Stage 3 students and improved by 2% for students in Year 5 from 2012.
The number of students achieving below expected outcome has reduced by 3% for Year 3 and 23% for Year 5 between 2012 and 2014.
There has been an increase of 5% of students in Year 3 and 3% of students in Year 5 achieving results in the top band for literacy.
The number of Aboriginal students achieving in the lowest band for literacy has decreased by 17% for Year 3 but increased by 13% for Year 5.There has been an increase of 10% of those achieving in the top band for Year 3 and an increase of 20% for students achieving the top two bands for Year 5.
Professional Learning for all staff has ensured the imbedding of explicit teaching in all classrooms.
Strategies to achieve these outcomes in 2014
Professional Learning for all staff on explicit teaching and imbedding learning intentions into planning.
Implementation of a writing project for Stage 2 classes to target explicit teaching, quality literature.
Development of common practice among staff.
Professional Learning targeting Speech Pathology strategies for (K-2) staff.
School priority 2
Numeracy
Outcomes from 2012–2014
School based data reflecting students achieving stage appropriate outcomes for numeracy.
Students to be extended to increase achievement levels and increase the percentage of students in the top bands for NAPLAN.
Decrease the gap between Aboriginal and non-Aboriginal students.
Explicit teaching will become a key component in every classroom.
Evidence of progress towards outcomes in 2014:
Students achieving benchmark for numeracy in Kindergarten to Year 2 (K-2) was 76% and in Year 3 to Year 6 73%.
The number of students achieving band 6 for data and measurement in Year 3 has increased by 5.5% from 2013 to 2014.
The number of students in Year 3 achieving band 5 for numbers, patterns and algebra has increased by 1.9%
The Year 3 cohort for numeracy shows an upward trend of 5.5 from 2013 -2014.
There has been a decrease of 5.1% of students achieving the lowest band for numeracy in the Year 5 cohort.
No Aboriginal students achieved the lowest band for numeracy in year 5 in 2014.
Strategies to achieve these outcomes in 2014:
Count Me In Too practices were imbedded into the teaching cycle for all classes.
Targeted support from Learning and Support Staff was offered to K-2 students who were not achieving outcomes at expected stage level.
14
NAPLAN data was analysed at the end of 2013 to determine the areas of greatest weakness and the explicit teaching strategies researched to improve achievement of outcomes in 2014.
Areas of weakness determined through assessment in school data and drill sessions developed to improve outcomes in these areas.
School priority 3
Curriculum and Assessment
Outcomes from 2012–2014
Teachers will be confident in using the new curriculum and imbedding outcomes into teaching practice.
Staff develop a relevant scope and sequence for the new curriculum.
Authentic assessment tasks will assist in developing differentiated teaching and learning programs.
Evidence of progress towards outcomes in 2014:
All staff exposed to Adobe Connect and online modules for mathematics and science syllabus documents ready for implementation in 2015.
All staff receiving ongoing professional development to imbed and deliver the new expectations from the English syllabus.
Supervision of the teaching and learning cycle incorporated the delivery of the new English curriculum.
Strategies to achieve these outcomes in 2014:
Online training and Adobe connect sessions used to develop deeper understanding of new syllabus documents.
One Staff Development Day was dedicated to the implementation of the science syllabus. Staff from Lakeside Local Management Group were given explicit instruction on the content and intent of the new document ready for implementation in 2015.
Units for Mathematics were trialled for implementation in 2015.
A scope and sequence for mathematics was developed ready for 2015 implementation.
Parent/caregiver, student, and teacher satisfaction
In 2014, the school sought the opinions of parents, students and teachers about the school.
Their responses are presented below.
Parents, staff and students were surveyed to determine what was considered the successes for Grahamstown Public School in 2014 and what elements needed improvement. Open ended questions were asked so respondents could openly appraise any aspect of school life.
In place of a survey being sent home parents were approached before and after school and at the school disco to complete the survey.
Most of the parent responses received aligned with the those of staff and students.
The registered successes were the Positive Behaviour for Learning (PBL) program, with 53% of responses acknowledging the value of the strategy, the extra curricula activities offered, the easily accessible staff and the friendly atmosphere at Grahamstown Public School.
Homework was an issue for several parents with 36% of respondents wanting change in the delivery and marking of homework. Parent expectation of notes being delivered was raised and email was raised as an alternate option. An explanation in the newsletter responded to the availability of notes, the publishing of dates for payment in the newsletter, on the school website and on Facebook. Emailing of notes will not be taken up as an option for receiving permission notes.
School uniform was also raised as an issue. Parents felt the uniform needed streamlining and modernising. This will be raised at P&C in 2015.
As second form of survey was conducted with parents, staff and students to indicate which programs are valued and worth continuation in the next three year plan.
All respondents believe the professional learning, home reading and bullying programs should

15
continue. All respondents believed the school resources funding program should continue also.
Eighty percent or more of respondents believed continuing high academic expectations, high uniform expectations, the development of a scope and sequence aligned with the new syllabus, improved homework delivery, new syllabus implementation, consistent school rules, ongoing communication development, the writing project, high expectation for school appearance, ongoing development of technology and the tracking of student development were important success and future direction for Grahamstown Public School.
All of these have been taken into consideration in the development of the 2015-17 school plan.
A further survey was conducted to determine the value of existing and future directions. The results confirmed that the majority of stakeholders (58% or above) believe that improved teacher supervision, improved student tracking, consistency in benchmarking, quality assessment for learning, ongoing professional learning, the writing project, the use and resourcing of technology, PBL, closing the gap for Aboriginal students and explicit teaching strategies were all worthwhile pursuits for future directions at our school.
Future Directions 2015-2017 School Plan
NSW DEC is implementing a new school planning process for 2015-17. The new plan will be published on the school’s website from the beginning of Term 2 2015.
Using the data from staff, student and parent surveys and the results from an intensive evaluation of the 2012-2014 school plan the following future directions were determined for the 2014-2017 school plan.
The first strategic direction is based on improving pedagogy and developing common practices across the school to assist all stakeholders in developing the best outcomes for students.
Strategic direction 1 is:
Literacy / Writing / Learning
Creating a collegial environment for the
implementation of imbedded common
practice and high performance of staff and
students. Developing a culture of
collaboration and evidence driven learning
programs, stemming from educational
leadership, learning engagement and quality
teaching.
The purpose of this direction is to improve student achievement through the provision of professional learning, imbedded common practice and valid assessment of, for and about learning while creating a culture of self-improvement for students and staff.
Strategic Direction 2 is:
Collaborative development of systems,
leadership, professional improvement
Embedding quality leadership and organisational
practices to support ongoing professional
development, leadership sustainability and
implementation of quality teaching practices.
The purpose of this direction is to empower the
school community for self-improvement and to
recognise and foster potential leadership by
building collegial and supportive organisational
and supervision practices where expectations are
common and high across the school.
Strategic direction 3 is:
Syllabus Implementation
Quality implementation of the new syllabus
documents to ensure depth of understanding of
terminology and the intent of each document.
The purpose of this direction is to develop a deep
understanding of the intent of each document.
This is vital for new curriculum to be imbedded
into teaching practice and for the successful
delivery of outcomes. The structuring of an
integrated whole school scope and sequence will
need development, implementation, review and
adjustment.
16
About this report
In preparing this report, the self-evaluation committee has gathered information from evaluations conducted during the year and analysed other information about the school's practices and student learning outcomes. The self-evaluation committee and school planning committee have determined targets for the school's future development.
Sue Kane: Principal
Leanne Russell: Assistant Principal
Kylie South: Assistant Principal
Alison White: Assistant Principal
Emily Trembath: Classroom Teacher
Sue Dellar: Reading Recovery Teacher
Melissa Blake: Gifted and Talented Coordinator
Andrew Mort: Garden Club Coordinator
Helen Doust: Professional Learning Coordinator
School contact information
Grahamstown Public School
Hastings Drive
Raymond Terrace
Ph: 49876510
Fax: 49876513
Email: [email protected]
Web: [email protected]
School Code: 4609
Parents can find more information about Annual School Reports, how to interpret information in the report and have the opportunity to provide feedback about the report at:
http://www.schools.nsw.edu.au/learning/emsad/
asr/index.php