Graham Currie - Monash University - Understanding the Wider Value of Honor Based Ticketing in Light...
30
Understanding the Wider Value of Honor Based Ticketing in Light Rail Professor Graham Currie James Reynolds PUBLIC TRANSPORT RESEARCH GROUP Institute of Transport Studies Monash University, Australia Light Rail 2016 – Transforming the urban transport landscape Pullman Melbourne on the Park 25 th February 2016
-
Upload
informa-australia -
Category
Business
-
view
453 -
download
0
Transcript of Graham Currie - Monash University - Understanding the Wider Value of Honor Based Ticketing in Light...

Understanding the Wider Value
of Honor Based Ticketing in
Light Rail
Professor Graham Currie
James Reynolds
PUBLIC TRANSPORT RESEARCH GROUP
Institute of Transport Studies
Monash University, Australia
Light Rail 2016 – Transforming the urban
transport landscape
Pullman Melbourne on the Park
25th February 2016

1 Introduction
2 Research Context
3 Model Development
4 Results
5 Discussion and Conclusions
Agenda
2

• Passengers must have valid ticket
• Random ticket inspections for enforcement
• Allows passengers to board and alight at any door
Melbourne, like most Light Rail systems, uses Honor
Based or Proof-of-Payment (POP) fare collection
3
All door boarding and alighting in Melbourne, Australia

This is often criticised in the media/community because
of high fare evasion rates
4
0%
5%
10%
15%
20%
25%
0% 20% 40% 60% 80%
Fa
re e
va
sio
n r
ide
rsh
ip s
ha
re -
wit
hin
m
od
e
Total lost revenue - share between modes
Lost Revenue
Tram
Train Bus
Source: ITS (Monash) analysis of the Fare Evasion and Valid Concession Percentage Survey - 2011
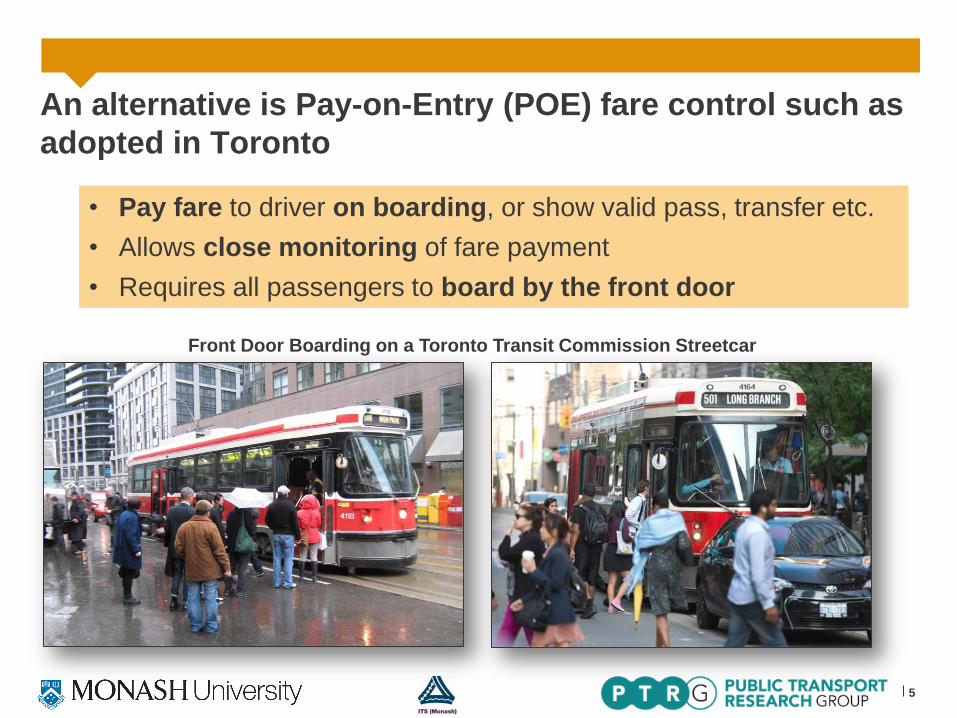
• Pay fare to driver on boarding, or show valid pass, transfer etc.
• Allows close monitoring of fare payment
• Requires all passengers to board by the front door
An alternative is Pay-on-Entry (POE) fare control such as
adopted in Toronto
5
Front Door Boarding on a Toronto Transit Commission Streetcar

The trade-offs between POE and POP on LRT have not
been fully explored
6
Pay-on-Entry (POE)
Pay driver
Longer boarding times
Lower fare evasion
Honor Based / Proof-of-Payment (POP)
Pre-purchase ticket
Shorter boarding times
Higher fare evasion versus
Fare Revenue Increases?
Operational Costs / Savings?
Capital Costs?
Fare Evasion Losses?
Operational Costs / Savings?
Capital Savings?
THIS RESEARCH:
• Develops a model of the Melbourne Tram Network to directly compare the overall financial impacts of
POE with POP, and
• Investigates how:
• Reduced fare evasion under POE fare control; compares to
• Costs due to slower boarding times compared to Honor Based/ POP system.
Currie G and Reynolds J (2016) ‘Evaluating Pay-on-Entry Versus Proof-of Payment Ticketing in Light Rail Transit’
Transportation Research Record - Transportation Research Board 95th Annual Meeting January 2016

1 Introduction
2 Research Context
3 Model Development
4 Results
5 Discussion and Conclusions
Agenda
7 7

Trams in Melbourne have open access, while trains and
buses have more control of fare payment
8
Melbourne Rail Network
• Barrier gates at central stations
• Roving ticket inspectors
Melbourne Bus Network
• Enter by front door only
• Validate smartcard in front of driver
• Some roving ticket inspectors
Melbourne Tram Network
• Enter by any door (open access)
• No interaction with driver
• Roving ticket inspectors

Melbourne’s trams use the “myki” smartcard system, with
passengers required to “touch on” after boarding
9
Touch On
myki Smartcard
Images source: www.ptv.vic.gov.au
Board
Ride
Touch Off
If travelling
wholly in Zone 2
Alight
*Except in the FREE TRAM ZONE in the city center

Fare Evasion Trends
10
14
% fa
re e
va
sio
n
20
% fa
re e
va
sio
n
“myki” smartcard
introduction period
Source: Public Transport Victoria
Victorian Official Fare Compliance
Series May 2015
Victorian Fare Compliance Rate
6%
The Age Newspaper:
October 3, 2011 The Age Newspaper: January 2, 2015

Would Melbourne Trams have been better off with POE
instead of the myki POP system?
11
The Age Newspaper: June 2010, October 2011 and June 2011

Melbourne trams vs Toronto streetcars
12
Melbourne Toronto
• Some of the largest streetcar systems in the world
Melbourne = 167 kms (104 miles) Toronto = 71 kms (44 miles)
• Different Fare Control Systems
Melbourne = POP Toronto = mostly POE
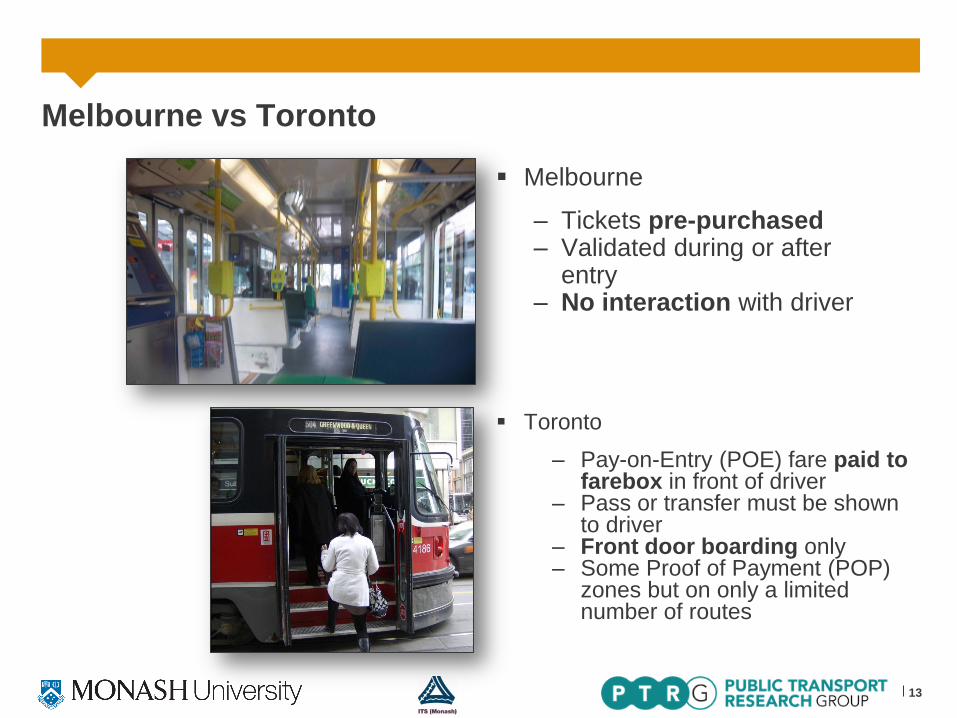
Melbourne vs Toronto
13
Melbourne
– Tickets pre-purchased – Validated during or after
entry – No interaction with driver
Toronto
– Pay-on-Entry (POE) fare paid to farebox in front of driver
– Pass or transfer must be shown to driver
– Front door boarding only – Some Proof of Payment (POP)
zones but on only a limited number of routes

• Melbourne and Toronto dwell time surveys
• Regression models developed including one with a factor for fare
control type
Previous Research - Currie, Delbosc and Reynolds (2012)
14
Dwell time = 3.7 + 0.9a + 0.7b + 13.4c – 6d + 3.4e + 9.8f
Where:
a = Number of boardings
b = Number of alightings
c = 1 if 4 doors, else 0
d = 1 if platform stop, else 0
e = 1 if steps, 0 otherwise,
f = 1 if pay-on-entry, 0 otherwise
Source: Currie, G., A. Delbosc, and J. Reynolds, Modeling Dwell Time for Streetcars in Melbourne, Australia, and
Toronto, Canada. Transportation Research Record: Journal of the Transportation Research Board, 2012. 2275: p. 22-29.
• Model implies that average dwell time for POE is 9.8 seconds higher
per stop than for POP

1 Introduction
2 Research Context
3 Model Development
4 Results
5 Discussion and Conclusions
Agenda
15 15

16
Model Structure - Outline
vs
Operational
Impacts
Ridership and
Fare Payment
Impacts
Annual
Revenue /
Cost Impacts
Capital Cost
Impacts
Discount Cash
Flow Analysis
Pay-On-Entry
(POE) fare
control
Proof-of-
Payment (POP)
fare control
• Compares POE fare control impacts with the
(existing) POP across 22 of the 26 tram
routes in Melbourne
• Determines operational, ridership and fare
payment impacts
• Calculates capital cost and
annual revenue / cost impacts
• Uses a Discount Cash Flow Analysis to
calculate a BCR of switching to POE

Overall model - Detail
Fewer Ticket
Validation
Machines
Longer Dwell
Times
Longer
Passenger
Journey Times
Decreased
Ridership
Longer
Vehicle
Journey Times
Increased
Vehicle
Requirements
Higher
Operational
hours & km
Increased
Operating
Costs
Increased
Capital Costs
Larger Vehicle
Fleet
Reduction in
Fare Evasion
Removal of
Inspection
Staff
Increased Fare
Payment
Decrease in
Fines Levied
Decreased
Revenue
Increased
Revenue
Decreased
Operating
Costs
Decreased
Capital Costs
Better
Financial
Performance
Worse
Financial
Performance
Less
Maintenance
vs
Pay-On-Entry
(POE) fare
control
Proof-of-
Payment (POP)
fare control
17

1 Introduction
2 Research Context
3 Model Development
4 Results
5 Discussion and Conclusions
Agenda
18 18

Impact of Conversion – Honor/POP vs POE
19
10%
Ridership
Decline
49
Additional
LRV’s
Needed
816
3
66
-280
-230
-180
-130
-80
-30
20
70
Reduced F
are
Evasio
n
Saved A
O
Costs
Saved
Valid
ato
r
Costs
Saved
Valid
ation
Machin
es
Savings Resulting from Pay the Driver Ticketing
Cost Savings
Ch
ang
e in
Co
sts
(M
)
Costs Resulting from Pay the Driver Ticketing
Cost Increases
-17 -9 -30 -276
-280
-230
-180
-130
-80
-30
20
70
Fare
Reduction L
ess R
iders
Low
er
FE
Fin
e R
evenue
Incre
ased T
ram
Opera
ting
Costs
Less T
ram
/LR
V V
ehic
les
Operating/ Annual Costs Capital Costs
Operating/ Annual Costs Capital Costs

Open access saves $29M p.a. operating costs & $210M
in Capital – increases ridership 10% and saves 49 LRVs
20
Melbourne – Open Access; Proof of
Payment Ticketing
Toronto – Pay the Driver Ticketing
Source: Currie, G and Reynolds J (2016) ‘Evaluating Pay-on-Entry vs Proof-of Payment Ticketing in Light Rail Transit’ Transportation Research Record
Journal of the Transportation Research Board - 95th Annual Meeting of the Transportation Research Board Washington DC January 2016
• +$29M p.a. in net Operating Costs
each year
• +$210M in net Capital Costs
• 10% less ridership due to delays
• 49 additional LRV’s needed (+14%
of fleet)

21
Aggregate Results Financial Analysis Annual Capital
POE Benefits ($AU)
• Reduced fare evasion losses
• Reduced staffing costs
• Reduced maintenance of validation machines
• Fewer ticket validation machines
8.1m
15.8m
3.1m
65.5m
POE Costs ($AU)
• Lower fare revenue
• Lower fine revenue
• Increase vehicle operation costs
• New vehicles
17.4m
9.2m
29.8m
276.0m
Total ($AU) Benefits – Costs -29.4m -210.5m
Discount Cash Flow Analysis BCR
• 30 years at 6% discount rate
0.44

22
Route Based Results
R² = 0.1851
0.3
0.35
0.4
0.45
0.5
0.55
0.6
0 5,000,000 10,000,000 15,000,000
BC
R
Annual Ridership
Benefit Cost Ratio vs Route Ridership
R² = 0.1202
0.3
0.35
0.4
0.45
0.5
0.55
0.6
5 6 7 8 9
BC
R
Stops per Route Kilometer
Benefit Cost Ratio vs Stops per Route Kilometer
• BCR of POE
goes down
as stops per
kilometre
goes up
• BCR of POE
goes up as
ridership
increases
• However R2 is < 0.2

23
Sensitivity Analysis
0.30
0.35
0.40
0.45
0.50
0.55
0.60
Dw
ell
tim
e
AO
an
nu
al cost
An
nu
al o
pe
rating
hou
rs
Cre
w c
ost p
er
ve
hic
le h
ou
r
Tic
ket
va
lida
tors
pe
r tr
am
Rid
ers
hip
ela
sticity
Cap
ita
l co
st
pe
r ve
hic
le
Fa
re e
va
sio
n r
ate
Ca
pita
l co
st
pe
r ticke
t va
lida
tor
Reve
nu
e f
rom
fin
es
Cost
per
veh
icle
km
An
nu
al o
pe
rating
km
s
Dis
co
un
t ra
te
Va
lida
tor
ma
inte
nan
ce s
taff
co
st
An
nu
al ri
ders
hip
Fa
re r
eve
nue
per
pa
ssen
ger
Benefit-
Cost
Raito
Most Sensitive to Dwell Time

1 Introduction
2 Research Context
3 Model Development
4 Results
5 Discussion and Conclusions
Agenda
24 24

25
Findings • Melbourne trams have worse financial performance under POE than
POP
• $AU27.0m annual benefits and $AU65.5m capital savings
• But $AU56.4 annual costs and $AU276.0m capital expense
• BCR of only 0.44
• Costs associated with longer stop dwell times far outweigh the
benefits of POE for reducing fare evasion and staffing costs
• Lower levels of ridership, increased fleet size and operating costs
are significant financial penalties of operating a POE fare system

Toronto – should stop using POE!...
26
Front Door Boarding on a Toronto Transit Commission Streetcar

... AND THEY HAVE
27

www.worldtransitresearch.info

29
ALSO:
NEW PTRG WEBSITE
PTRG.INFO

Join the ITS (Monash) LinkedIn group
to keep informed of our activities