Graduation from the category of least developed countries ...
60
fondation pour les études et recherches sur le développement international LA FERDI EST UNE FONDATION RECONNUE D’UTILITÉ PUBLIQUE. ELLE MET EN ŒUVRE AVEC L’IDDRI L’INITIATIVE POUR LE DÉVELOPPEMENT ET LA GOUVERNANCE MONDIALE (IDGM). ELLE COORDONNE LE LABEX IDGM+ QUI L’ASSOCIE AU CERDI ET À L’IDDRI. CETTE PUBLICATION A BÉNÉFICIÉ D’UNE AIDE DE L’ÉTAT FRANCAIS GÉRÉE PAR L’ANR AU TITRE DU PROGRAMME «INVESTISSEMENTS D’AVENIR» PORTANT LA RÉFÉRENCE «ANR-10-LABX-14-01». Revised version September 2018 Graduation from the category of least developed countries: Rationale, achievement and prospects* Alassane Drabo, Patric k Guillaumont Alassane DRABO is a Research Officer at FERDI. Patrick GUILLAUMONT is President of FERDI. Introduction: A short story of the LDCs graduation 1 The Least Developed Country (LDC) category was from the start meant to include low income countries facing structural handicaps to economic growth (in the 2011 CDP report economic growth has been replaced with “sustainable development”). Under various names, the structural handicaps considered for the identification of the LDCs have been deficient human resources and weak economic structure. Let us recall that the LDCs are identified by three complementary criteria for inclusion into the category (CDP and UNDESA 2008; CDP 2015): these criteria are presently the income level as measured by Gross National Income per capita (GNIpc), and two indicators of structural handicaps, the Human Asset Index (HAI) and the Economic Vulnerability Index (EVI). Poor countries simultaneously facing these two kinds of handicaps have been described as “caught in a trap”, and in need of special international attention and support measures (Guillaumont 2009a). In the long term, with the help of these measures, it should have been hoped that the countries identified as LDCs will progressively overcome their structural handicaps and exit from the category, leading the LDC category to shrink. * also chapter 7 in Out of the Trap (forthcoming), Guillamont, P. (ed.), Economica 1. This section and the following relies heavily on a previous paper of the authors (Drabo and Guillaumont 2016) D e v e l o p m e n t P o l i c i e s W o r k i n g P a p e r 208 December 2017
Transcript of Graduation from the category of least developed countries ...
fondation pour les études et recherches sur le développement international
LA F
ERD
I EST
UN
E FO
ND
ATI
ON
REC
ON
NU
E D
’UTI
LITÉ
PU
BLI
QU
E.
ELLE
MET
EN
ŒU
VR
E A
VEC
L’ID
DR
I L’IN
ITIA
TIV
E P
OU
R L
E D
ÉVEL
OP
PEM
ENT
ET L
A G
OU
VER
NA
NC
E M
ON
DIA
LE (
IDG
M).
ELLE
CO
OR
DO
NN
E LE
LA
BEX
IDG
M+
QU
I L’A
SSO
CIE
AU
CER
DI E
T À
L’ID
DR
I.
CET
TE P
UB
LIC
ATI
ON
A B
ÉNÉF
ICIÉ
D’U
NE
AID
E D
E L’
ÉTA
T FR
AN
CA
IS G
ÉRÉE
PA
R L
’AN
R A
U T
ITR
E D
U P
RO
GR
AM
ME
«IN
VES
TISS
EMEN
TS D
’AV
ENIR
»
PO
RTA
NT
LA R
ÉFÉR
ENC
E «A
NR
-10
-LA
BX
-14-
01»
.
Revised version September 2018
Graduation from the category of least developed countries: Rationale, achievement and prospects*Alassane Drabo, Patrick Guillaumont
Alassane DRABO is a Research Offi cer at FERDI.
Patrick GUILLAUMONT is President of FERDI.
Introduction: A short story of the LDCs graduation1
The Least Developed Country (LDC) category was from the start meant to include
low income countries facing structural handicaps to economic growth (in the 2011
CDP report economic growth has been replaced with “sustainable development”).
Under various names, the structural handicaps considered for the identifi cation of
the LDCs have been defi cient human resources and weak economic structure. Let us
recall that the LDCs are identifi ed by three complementary criteria for inclusion into
the category (CDP and UNDESA 2008; CDP 2015): these criteria are presently the income
level as measured by Gross National Income per capita (GNIpc), and two indicators
of structural handicaps, the Human Asset Index (HAI) and the Economic Vulnerability
Index (EVI). Poor countries simultaneously facing these two kinds of handicaps have
been described as “caught in a trap”, and in need of special international attention
and support measures (Guillaumont 2009a). In the long term, with the help of these
measures, it should have been hoped that the countries identifi ed as LDCs will
progressively overcome their structural handicaps and exit from the category, leading
the LDC category to shrink.
* also chapter 7 in Out of the Trap (forthcoming), Guillamont, P. (ed.), Economica1. This section and the following relies heavily on a previous paper of the authors (Drabo and Guillaumont 2016)
Development Polici e
s
Working Paper
208December
2017

“Sur quoi la fondera-t-il l’économie du monde qu’il veut gouverner? Sera-ce sur le caprice de chaque particulier? Quelle confusion! Sera-ce sur la justice? Il l’ignore.”
Pascal

Ferdi WP n°208 Drabo, A., and Guillaumont, P >> Graduation from the category of least developed countries … 1
1. Introduction: A short story of the LDCs graduation
When graduation rules were set up and what they are
The graduation from the list of LDCs, when an LDC no longer fulfills the conditions of membership,
was not considered during the first twenty years of the category. The possibility and conditions of
graduation were introduced only in 1991, a date since which the list of LDCs has undergone triennial
reviews. Three main precautions were taken before an LDC could be recommended for graduation:
(i) not only one, but two of the three criteria of inclusion should cease to be met; (ii) margins were
set up between inclusion and graduation thresholds for each criterion; (iii) a country is
recommended by the CDP for graduation only after having been found eligible at two successive
triennial reviews. Moreover since 20042 the country is graduated only three years after the
endorsement by the General Assembly of the CDP recommendation. An exception to the initial “two
criteria rule” was introduced in 20053: a country can be found eligible for graduation if its GNIpc is at
least twice as high as the ordinary income graduation threshold and deemed sustainable, making
income per capita the only one criterion for graduation in these cases. While such cases at the
introduction of the rule in 2005 were considered exceptional, they appeared later not to be so, as we
shall see below. In what follows we refer to these two alternative rules of graduation as the “two
criteria rule” and the “income-only criterion” or “income-only rule”.
The pace of graduation
The history of graduation of the least developed countries since 1991 can roughly be divided into
two periods.
From 1991 to the middle of the 2000 decade, only one country graduated from the category according
to the rule prevailing at the time, namely Botswana in December 1994. This modest outcome was
not only due to the economic trends in LDCs, but also and mainly to the precautionary graduation
conditions, as indicated above and shown below. The graduation process has also been impacted
by the resistance of some eligible countries since the end of the 1990s (CDP, 1997, 2000, 2003, 2006,
CDP and UNDESA 2008, Guillaumont 2009a).
From the mid-2000’s to 2018, four countries actually graduated from the group: Cape Verde in
December 2007, Maldives in January 2011 and Samoa in January 2014, all on the basis of their GNI
per capita and human asset index (HAI), and Equatorial Guinea in 2017, on the only basis of its high
GNI per capita4. For two other countries, graduation has already been decided by the General
2 United Nations General Assembly resolution A/RES/59/209
3 Report of the Committee for Development Policy on the seventh session (14-18 March 2005), Official Records of the Economic and Social Council, 2005, Supplement No. 33 (E/2005/33).
4 These three last developed countries had resisted against graduation and obtained some postponements (legitimated in the case of Maldives and Samoa by the occurrence of natural disasters through General Assembly resolutions A/RES/60/33 and A/RES/64/295 respectively).

Ferdi WP n°208 Drabo, A., and Guillaumont, P >> Graduation from the category of least developed countries … 2
Assembly, to be effective later: Vanuatu in 2020 (after obtaining a postponement because of huge
storm), and Angola in 2021. Seven other ones, including five SIDS, have been found at least twice
eligible for the graduation:
Tuvalu has been found eligible at the 2003 review, and again in 2006, 2009, 2012, was
recommended for graduation by the CDP only in 2012, a recommendation confirmed in
2015 and 2018, but without being endorsed by ECOSOC which posponed its consideration
three times in 2012, 2013 and 2015, deferring its endorsement decision for 2018;
Kiribati has been found eligible a first time in 2003, then in 2006, 2012, 2015 and 2018, but
recommended by the CDP for graduation only in 2018;
Bhutan, São Tomé and Principe, and Solomon Islands have been found eligible in 2015 and
2018 and recommended for graduation by CDP in 2018;
Nepal and Timor-Leste have been found eligible in 2015 and 2018 but recommendation for
graduation has been deferred to the 2021 review.
Most (9) of the (11) countries having met the graduation criteria during these last 15 years (and
recommended by the CDP) are SIDS, found eligible on the basis of their income per capita and
human capital levels. A majority of them have been reluctant to graduate, arguing for their
vulnerability (see Annex 4 the resistance to graduation over a quarter of century).
Finally three other countries have been found eligible a first time in 2018 (Bangladesh, Myanmar and
Lao PDR), so that they could be found so again in 2021, then meet the graduation criteria and be
recommended for graduation (as could be Nepal and Timor Leste).
Change in attitudes: the Istanbul goal and beyond
The increase in the number of graduations since mid-2000 is indeed due to the improvement in
economic trends in LDCs during the period (see chapter 1). Moreover since the beginning of the
2010s a change in the LDCs attitudes towards graduation has emerged, facilitated by the previous
adoption by the General Assembly of the principle of “smooth transition” in 2004 (A/RES/59/209)
reinforced by a General Assembly Resolution in 2012 (A/RES/67/221), which aimed at preventing
consequences of an abrupt exit from the category (see below).
This change of attitude has been highly evidenced at the UN LDC IV Conference in 2011 with the
adoption of the Istanbul Programme of Action (IPoA): this Programme underlines “the aim at
enabling half of the number of LDCs to meet the criteria for graduation by 2020” (United Nations, 2011,
§28)5. (see Box 1 on the meaning of this sentence). However, as it results from the (noted above)
decisions already taken, at the end of the decade in 2020, there will not be more than 9 to13 out of
5 what is not, as it was sometimes said, a goal of reduction by half of the number of LDCs.

Ferdi WP n°208 Drabo, A., and Guillaumont, P >> Graduation from the category of least developed countries … 3
the 48 countries being LDCs in Istanbul6 having met the graduation criteria7 (3 of which likely to have
graduated at that time: Samoa in 2014, Equatorial Guinea in 2017 and Vanuatu in 2020), what means
less than one fifth instead of one half in the IPoA goal.
Box 1: What is the real meaning of the IPoA goal of graduation?
In its paragraph 28 the IPoA states “the aim at enabling half of the number of LDCs to meet the criteria for graduation by 2020” (same wording in paragraph 1). It was clear enough that this goal did not mean a reduction by half of the number of LDCs, although the French translation of paragraph 1 refers to the “objectif qui consiste à reclasser la moitité des PMA “hors de leur catégorie”. Indeed the usual meaning of meeting the graduation criteria does not involve to have already left the category. But four meanings are still possible:
the country has already met a first time the graduation thresholds, what is also said “eligible a first time”;
the country has been “twice eligible for graduation” (at two successive triennial reviews), what is most often considered as meeting the (quantitative) graduation thresholds a second time;
the country has been “recommended by the CDP for graduation”, what may not be the case for some LDCs having twice met the graduation thresholds, after CDP examination of the situation of the country and according to the repeated principle that the criteria should not be applied mechanically;
the General Assembly of the UN has taken note of the recommendation of the CDP to graduate, what will result in a graduation three years later.
Here we use mainly the second meaning, often used by the CDP and precise if we are led to use the first or third one. The number of new LDCs having met the criteria according to the three first meanings between May 2011 (IPoA) and 2020 is respectively 12, 9 and 7.
Towards voluntary graduation?
The move towards an attitude more favorable to graduation is illustrated by the wish now expressed
by some LDCs to graduate as soon as possible. It may be simply understood as a wish to be soon
able to meet the present graduation criteria and so to be recommended for graduation. For instance
Myanmar, requested the UN “to review Myanmar as a potential candidate for graduation from the
LDC status hoping that we will start identifying the necessary steps to be undertaken” 8. This has
been interpreted by the CDP as a request to monitor the progress of Myanmar vis-à-vis the
graduation criteria (CDP 2015 Report, §61).
Another possibility would be for a present LDC to request a graduation even if the criteria are not
yet met. Is it conceivable? As far as a country may refuse to be included as an LDC when found eligible
6 They were 49 in 2012, after the inclusion of South Sudan
7 These LDCs are Samoa and Equatorial Guinea (already meeting the criteria in 2011), Vanuatu, Angola,Tuvalu and Kiribati, Bhutan, Sao Tome& Principe, and Solomon Islands (all founded twice eligible and recommended for graduation), while 2 countries founded twice eligible have not been recommended).
8 Letter of the President of Republic of Union of Myanmar to H.E. the SG of the UN, 8 August 2014

Ferdi WP n°208 Drabo, A., and Guillaumont, P >> Graduation from the category of least developed countries … 4
(as done from 2006 to 2015 by Zimbabwe), it seems difficult to argue that an LDC cannot leave the
category if it wants to do so. Why might it want? From such a “voluntary graduation” the country
might expect to receive the benefits from a good performance signal, worth more than the lost
benefits of LDC membership. But the signal would not be effective if the country does not really
meet the graduation criteria.
The following sections of this chapter should then enlighten why the path of graduation has been
so slow, constrained by the graduation rules (section 2), investigates the graduation prospects based
on various hypotheses and graduation rules (section 3), and analyses the impact of LDCs graduation,
relying on ex-ante and ex-post assessments (section 4). The last section concludes with comments
on graduation criteria.
2. Graduation constrained by the rules: Impact of the asymmetry between inclusion and
graduation criteria
As explained in the introduction, at the establishment of the graduation conditions in 1991, for
precautionary reasons, an asymmetry between inclusion and graduation criteria was set up by three
ways: (i), to be graduated, not only one, but two of the three criteria of inclusion should cease to be
met; (ii) margins were set up between inclusion and graduation thresholds for each criterion (iii) a
country can be recommended by the CDP for graduation only after having been found eligible at
two successive triennial reviews (while it can be recommended for inclusion as soon as it is found
eligible (CDP, 1991). These differences have impacted graduation and created an unequal treatment
of countries in similar situations9.
2.1. Impact of the rule of two criteria ceased to be met instead of one
At the first triennial review in 1991, it was decided that a country should exit the category if it has
exceeded the cut-off point for two out of the three graduation criteria instead of just ceasing to fulfill
the inclusion conditions. The application of this rule has first led to the reduction of the number of
LDCs eligible to graduation. As soon as in the 1991 review, 13 LDCs ceased to meet the inclusion
criteria among which only 5 ceased to meet at least two criteria (see Table 1). The choice of two
criteria to no longer be fulfilled instead of one divided the number of the “potential graduating
countries” by more than 2 during all triennial reviews (from 13 to 5 LDCs at the first triennial review
in 1991, from 33 to 12 in 2015, and from 31 to 14 in 2018). During the 2006, 2009 and 2012 reviews,
less than one third of LDCs not fulfilling inclusion conditions ceased to meet at least two inclusion
criteria.
Another effect of this asymmetry has been the avoidance of graduated countries falling back into
the category. Had countries be graduated when they cease to fill only one criterion, the list of LDCs
would have become unstable, with countries leaving and falling back into the group (since many
countries close to the thresholdss showed unstable performance). As for the income per capita
9The number of “discordant” countries, meeting neither inclusion nor graduation criteria, and its evolution are analysed in Caught in a trap (Guillaumont, 2009)

Ferdi WP n°208 Drabo, A., and Guillaumont, P >> Graduation from the category of least developed countries … 5
criterion, Yemen ceased meeting it in 1991, 1997, 2012 and 2015, but not at the other reviews.
Djibouti ceased filling the criterion from 1994 to 2018, except in 2000. Liberia would have been
eligible for graduation only in 1997 and 2000, and Afghanistan in 1997. With respect to the human
capital criterion, Madagascar, Laos and Solomon Islands at once would have been eligible to
graduation, then no longer and likely to fall back into the category, as it woud have been the case
for Haiti, Mozambique and Lesotho with respect to the EVI criterion.
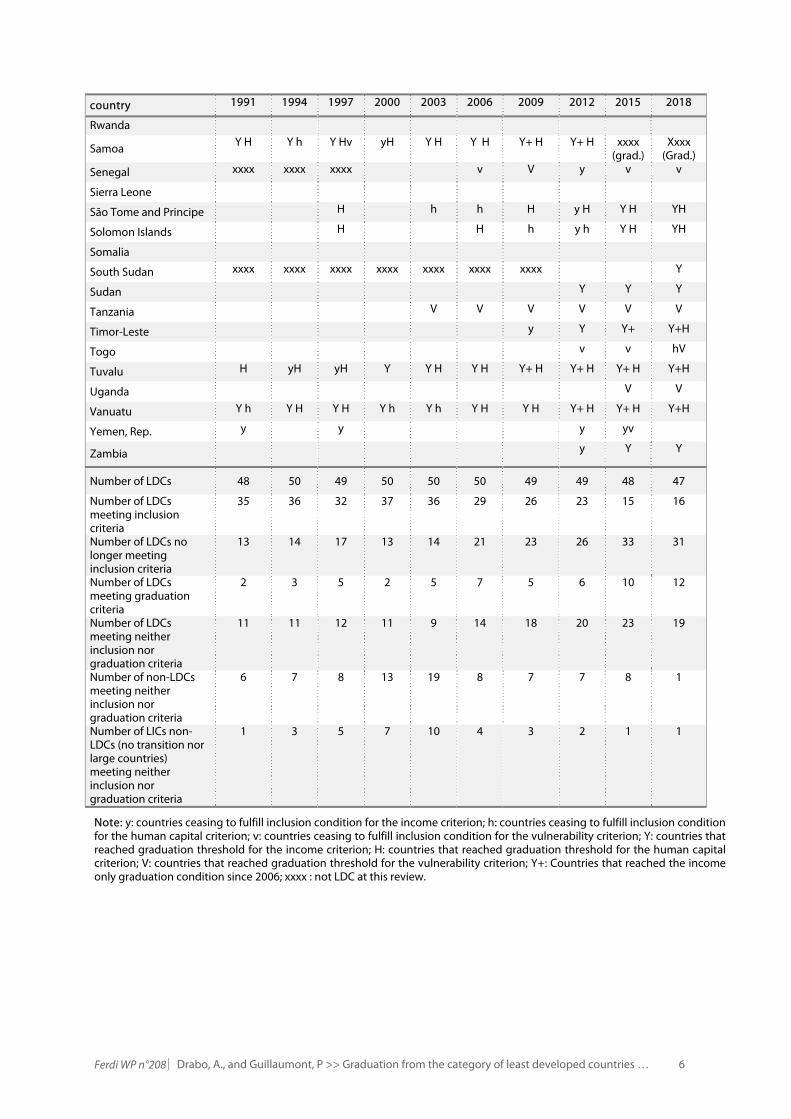
Table 1: Inclusion criteria no longer met and graduation criteria met by 52 countries bring or having been LDCs, at successive triennial reviews
country 1991 1994 1997 2000 2003 2006 2009 2012 2015 2018
Afghanistan
Y
v
v Angola xxxx
y Y Y+ Y+ Y+
Bangladesh
v V V V V v hV YHV Benin
V v
Bhutan
Y Y Y H YH Botswana Y H Y H xxxx (graduated)
Burkina Faso
Burundi
Cape Verde Yh Y H Y H Y H Y H Y H xxxx (graduated)
Cambodia
H yHv Central African Republic
v v v
Chad
Comoros
Y
Congo, Dem. Rep.
v V V Djibouti
Y y
y Y y Y Y Y
Equatorial Guinea
Y
Y+ Y+ Y+ Y+ xxxx
(Grad) Eritrea xxxx
V
Ethiopia
v V v V v
Gambia, The
h
Guinea
V V V V V
Guinea-Bissau
Haiti V V v
v V
Kiribati H H H h Y H Y H yH Y H Y+H 2YH
Lao PDR H H
h h yh YHv
Lesotho h H Hv h
h yh yh Yh Yh
Liberia
Y Y
Madagascar
h
V V v V
Malawi
Maldives h Yh YHV Y Hv Y Hv Y+ H Y+ H xxxx (grad.)
Mali
v
Mauritania
v
Y y
Mozambique v V v
v
Myanmar Hv yH YH h h H hV H y H v YHV
Nepal
V V V V H V HV
Niger
v
Ferdi WP n°208 Drabo, A., and Guillaumont, P >> Graduation from the category of least developed countries … 6
country 1991 1994 1997 2000 2003 2006 2009 2012 2015 2018
Rwanda
Samoa Y H Y h Y Hv yH Y H Y H Y+ H Y+ H xxxx
(grad.) Xxxx
(Grad.) Senegal xxxx xxxx xxxx
v V y v v
Sierra Leone
São Tome and Principe
H
h h H y H Y H YH
Solomon Islands
H
H h y h Y H YH
Somalia
South Sudan xxxx xxxx xxxx xxxx xxxx xxxx xxxx
Y
Sudan
Y Y Y
Tanzania
V V V V V V
Timor-Leste
y Y Y+ Y+H
Togo
v v hV
Tuvalu H yH yH Y Y H Y H Y+ H Y+ H Y+ H Y+H
Uganda
V V
Vanuatu Y h Y H Y H Y h Y h Y H Y H Y+ H Y+ H Y+H
Yemen, Rep. y
y
y yv
Zambia
y Y Y
Number of LDCs 48 50 49 50 50 50 49 49 48 47
Number of LDCs meeting inclusion criteria
35 36 32 37 36 29 26 23 15 16
Number of LDCs no longer meeting inclusion criteria
13 14 17 13 14 21 23 26 33 31
Number of LDCs meeting graduation criteria
2 3 5 2 5 7 5 6 10 12
Number of LDCs meeting neither inclusion nor graduation criteria
11 11 12 11 9 14 18 20 23 19
Number of non-LDCs meeting neither inclusion nor graduation criteria
6 7 8 13 19 8 7 7 8 1
Number of LICs non-LDCs (no transition nor large countries) meeting neither inclusion nor graduation criteria
1 3 5 7 10 4 3 2 1 1
Note: y: countries ceasing to fulfill inclusion condition for the income criterion; h: countries ceasing to fulfill inclusion condition for the human capital criterion; v: countries ceasing to fulfill inclusion condition for the vulnerability criterion; Y: countries that reached graduation threshold for the income criterion; H: countries that reached graduation threshold for the human capital criterion; V: countries that reached graduation threshold for the vulnerability criterion; Y+: Countries that reached the income only graduation condition since 2006; xxxx : not LDC at this review.

Ferdi WP n°208 Drabo, A., and Guillaumont, P >> Graduation from the category of least developed countries … 7
2.2. Impact of the margins between inclusion and graduation thresholds10
As indicated above, margins were set up between inclusion and graduation thresholds. To be
qualified for graduation for a given criterion, a country should perform better than the inclusion
threshold and reach the graduation one.The margins arbitrary chosen at the 1991 triennial review
were $ 100 for the GDP criterion, 5 and 3 points for APQLI and EDI respectively (see Table 2). These
margins were kept at the following two reviews (1994 and 1997). In 2000 the CDP chose a margin of
15% between the inclusion and graduation thresholds for all the three criteria. These
percencentages where modified in 2003 and since then the graduation threshold for income per
capita is 20% higher than the inclusion threshold, while for HAI it is 10% higher and for EVI 10% lower
than the inclusion ones.
Table 2: Inclusion and graduation thresholds through triennial reviews
Review year GDP / GNI per capita APQLI / HAI EDI / EVI
Inclusion ($)
Graduation ($)
Margins Inclusion ($)
Graduation ($)
Margins Inclusion ($)
Graduation ($)
Margins
1991 600 700 100 47 52 5 22 25 3
1994 699 799 100 47 52 5 26 29 3
1997 800 900 100 47 52 5 26 29 3
2000 900 1035 135 (15%) 59 68 9 (15%) 36 31 5 (15%)
2003 750 900 150 (20%) 55 61 6 (10%) 37 33 4 (10%)
2006 745 900 155 (20%) 58 64 6 (10%) 42 38 4 (10%)
2009 905 1086 181 (20%) 60 66 6 (10%) 42 38 4 (10%)
2012 992 1190 198 (20%) 60 66 6 (10%) 36 32 4 (10%)
2015 1035 1242 207 (20%) 60 66 6 (10%) 36 32 4 (10%)
2018 1025 1230 205 (20%) 60 66 6 (10%) 36 32 4 (10%)
These margins have of course reduced the number of countries eligible to graduation. Their impact
on the number of countries fulfilling the graduation conditions is not as high as that of the choice of
“two criteria instead of one”, but it is not negligible. The difference (due to margin) between the
number of countries that ceased to meet inclusion conditions and those that met graduation
threshold for at least one criterion ranged from 1 in 1994 to 11 in 2012. Moreover, keeping the two
criteria condition, if margins had not been set up between inclusion and graduation thresholds, 5
additional countries would have been eligible for graduation at the 2015 (4 at the 1994 review, 3 at
the 1991, 2009, 2012 and 2018 reviews, 2 at the 1997 and 2000 reviews, and 1 at the 2003 review), as
shown in Table 1.
The margins also prevented countries that graduated to fall back into the category. Indeed, within
countries that have ceased to meet inclusion conditions without reaching the graduation threshold
in any criterion, eight have fulfilled again inclusion conditions in the following reviews: Yemen,
10 This issue is analysed in more detail for the period 1991-2009 in Guillaumont 2009.

Ferdi WP n°208 Drabo, A., and Guillaumont, P >> Graduation from the category of least developed countries … 8
Madagascar, Djibouti, Haiti, Lesotho, Mozambique, Mauritania and Afghanistan. Without the
margins (and the rule of “two criteria to cease to be fulfilled”), these countries would have left the
LDC category, then fallen back into it11.
2.3. Impact of the need to be eligible at two successive triennial reviews
The CDP decided at the 1991 review that an LDC should be considered as eligible for graduation if it
reaches graduation thresholds not only for at least two out of the three criteria (income per capita,
APQLI/HAI and EDI/EVI), but also at least for three years (two consecutive triennial reviews). Due to
this condition, the graduation of some LDCs has been slown down and in some cases postponed
(when a country did not meet the eligibility conditions during two triennial reviews). First graduated,
Botswana left the category in 1994 instead of 1991 when it fulfilled graduation conditions for the
first time. Without the need to fulfill the graduation conditions for two consecutive triennial reviews,
Vanuatu could have left the category in 1994, Maldives, Samoa and Cape Verde in 1997, Samoa in
2003, Kiribati and Equatorial Guinea in 2006, Tuvalu and Angola in 2012, Bhutan, Sao Tome and
Principe, Solomon Islands, Timor-Leste and Nepal in 2015, and Bangladesh, Myanmar and Lao PDR
in 2018. Eighteen countries could have been recommended for graduation from the category
instead of four12.
Each of the three sources of the asymmetry between inclusion and graduation criteria has
contributed to reduce the number of countries meeting the graduation criteria, then to make the
group more stable. At the 2012 review, among the 49 LDCs under consideration, 26 were no longer
meeting the inclusion criteria, at the 2015 review the number was 33 out of the 48 LDCs and 31 out
of 47 in 2018. Within these 31 LDCs, 17 ceased to fulfill only one inclusion criterion, six did not reach
graduation threshold for any criterion and three met eligibility to graduation conditions for the first
time13. It means that without the present asymmetry the IPoA goal (enabling half of the number of
LDCs to meet the graduation criteria by 2020) would have already been reached, and even over-
reached.
11 However, this impact of margins should be nuanced since nine countries having met the graduation threshold stop fulfilling the inclusion conditions in the following reviews: Laos in 1994, Afghanistan, Solomon Islands, and Sao Tome and Principe in 1997, Equatorial Guinea, Eritrea and Liberia in 2000, and Madagascar and Senegal in 2009. Moreover, within countries that stop fulfilling two inclusion criteria, only Lesotho met inclusion conditions again, letting know that the choice of two criteria is more determinant in avoiding graduating countries falling back into the category than the margins. 12 without taking account Myanmar for which in 1997 the CDP did not recommend the graduation despite the fulfiment of the conditions (see Table 3) 13 See the bottom lines of Table 1 for more details.
Ferdi WP n°208 Drabo, A., and Guillaumont, P >> Graduation from the category of least developed countries … 9
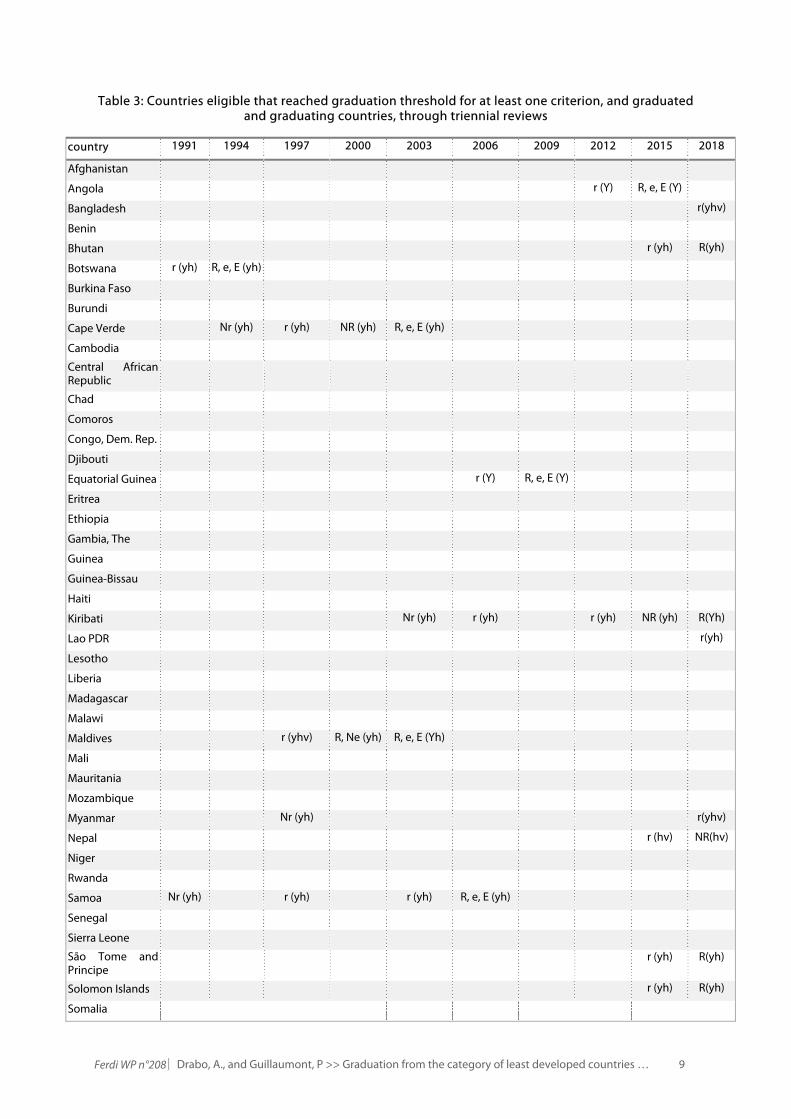
Table 3: Countries eligible that reached graduation threshold for at least one criterion, and graduated and graduating countries, through triennial reviews
country 1991 1994 1997 2000 2003 2006 2009 2012 2015 2018
Afghanistan
Angola
r (Y) R, e, E (Y)
Bangladesh
r(yhv)
Benin
Bhutan
r (yh) R(yh)
Botswana r (yh) R, e, E (yh)
Burkina Faso
Burundi
Cape Verde
Nr (yh) r (yh) NR (yh) R, e, E (yh)
Cambodia
Central African Republic
Chad
Comoros
Congo, Dem. Rep.
Djibouti
Equatorial Guinea
r (Y) R, e, E (Y)
Eritrea
Ethiopia
Gambia, The
Guinea
Guinea-Bissau
Haiti
Kiribati
Nr (yh) r (yh)
r (yh) NR (yh) R(Yh)
Lao PDR
r(yh)
Lesotho
Liberia
Madagascar
Malawi
Maldives
r (yhv) R, Ne (yh) R, e, E (Yh)
Mali
Mauritania
Mozambique
Myanmar
Nr (yh)
r(yhv)
Nepal
r (hv) NR(hv)
Niger
Rwanda
Samoa Nr (yh)
r (yh)
r (yh) R, e, E (yh)
Senegal
Sierra Leone
São Tome and Principe
r (yh) R(yh)
Solomon Islands
r (yh) R(yh)
Somalia

Ferdi WP n°208 Drabo, A., and Guillaumont, P >> Graduation from the category of least developed countries … 10
country 1991 1994 1997 2000 2003 2006 2009 2012 2015 2018
South Sudan
Sudan
Tanzania
Timor-Leste
r (Y) NR(Yh)
Togo
Tuvalu
Nr (yh) Nr (yh) Nr (yh) R (Yh) R, e (Yh) R(Yh)
Uganda
Vanuatu
r (yh) R, e, NE (yh)
r (yh) NR (yh) R, e, E (Yh)
Yemen, Rep.
Zambia
Note : r: Eligibility recognised by CDP; Nr: Eligibility not recognised by CDP; R: Graduation recommended by CDP; NR: Graduation not recommended by CDP; e: Graduation endorsed by ECOSOC; Ne: Graduation not endorsed by ECOSOC; E: Graduation agreed by GA (when it takes note of the CDP recommendation); NE: Graduation not yet agreed by GA; y: GDP / GNI per capita; h: Human Asset Index (HAI); v: Economic Vulnerability Index (EVI); Y: Income only criterion reached
Source: Author compilation
2.4. Impact of the change in the design of criteria
The design of the criteria indices is a last factor related to the rules of gradauation that may have also
impacted the path of graduation, without resulting from an asymmetry between inclusion and
graduation criteria. For instance Samoa which met graduation eligibility condition in 1997 did not
meet it in 2000 because its per capita GDP fell back below the graduation threshold due to the
stagnation of the GDP in real terms “while the lower threshold for graduation had risen relatively to
the upper threshold for identification by the World Bank as a low-income country” (see Guillaumont
2009, pp. 73). When in 2012 a new component (Low elevated coastal areas) has been added to EVI
at the expense of the population size component, it mechanically lowered the level of EVI in some
countries (small countries or countries without a large share of population living in low coastal areas),
but in that case without an immediate impact on eligibility. In 2015 when the threshold levels of EVI
and HAI have been taken at their absolute level of 2012, they become easier to reach, making three
countries eligible which would have not been so had the thresholds be designed at the quartile level
as before (Bhutan, Nepal, Solomon Islands, see below 3.2 and Annex 3).
2.5. To sum up: Relative impact of the various factors
After the 2018 review, there were 2 countries for which graduation was decided by the UN General
Assembly (Vanuatu and Angola), without being implemented.
This number would be 9 (by adding Nepal, São Tomé and Principe, Solomon Islands, Timor-Leste,
Bhutan, Kiribati and Tuvalu) if the graduation criteria had been mechanically applied by the CDP and
the ECOSOC.
It would have been 12 if meeting the criteria had not been required at 2 successives triennial reviews
(the 3 more countries being found eligible only for the first time are Bangladesh, Myanmar, and Lao
PDR).

Ferdi WP n°208 Drabo, A., and Guillaumont, P >> Graduation from the category of least developed countries … 11
It would have been 15 without the margins between inclusion and graduation thresholds (the 3
additional countries being Cambodia, Lesotho and Togo).
It would have been 25 without the condition of double criteria to be met for eligibility (adding ten
countries Comoros, Congo Democratic Republic, Djibouti, Guinea, Sudan, Tanzania, Uganda,
Zambia, Haiti and South Sudan).
And finally, it would have been 31 countries without the margins and the condition of double criteria
being applied simultaneously (with Benin, Central African Republic, Ethiopia, Mauritania, Senegal
and Niger as supplementary countries).
It means that only 16 LDCs would still be eligible for inclusion…
Box 2: The resulting composition of the category and its evolution
From the prévious analysis and the figures given in the bottom of the table 1, it is possible to show how the category membership has evolved since 1991 when graduation rules were designed. The upper part of Graph 1 represents the evolution of three groups of LDCs within the LDC category, from 1991 to 2018:
1) The total number of LDCs: rather stable, slightly decreasing during the last decade; 2) The number of LDCs not meeting the graduation criteria (at least a first time): significantly decreasing
from 48 in 2000 to 35 in 2018, what means that the number of LDCs meeting the graduation criteria (but not yet graduated) has been increasing;
3) The number of LDCs still meeting the inclusion criteria: after staying rather stable from 1991 to 2000 it has been sharply decreasing from 35 in 2000 to 16 in 2018 (it was still one half of the total number of LDCs in 2009, it is less than one third since 2015).
Since the decrease of 3) has been even stronger than that of 2), the number of number of LDCs meeting neither inclusion nor graduation criteria, named “discordant countries”, has been slightly growing (except in 2008), weakening the consistency of the category.
And the lower part of the Graph by comparison represents:
4) The number of other low income countries (OLICs), those which are not LDCs: after increasing from 10 in 1990 to 16 in 2000 has strongly decreased, to become only 2;
5) The number of OLICs not meeting the graduation criteria (had they been LDCs): as the total number of OLICs, still high in 2000, it has nearly disappeared in 2018;
6) The number of OLICs meeting the inclusion criteria, but not included, having refused: per se always very low and now reduced to 1(Zimbabwe)
The gap between 5) and 6) represents the OLICs meeting neither inclusion nor graduation criteria, and being as such in a position similar to that of the LDCs called above “discordant”, what was undermining the consistency of the category: Their number after reaching 12 countries in 2003 has now disappeared (only one). Thus only the discordant LDCs, the number of which reached in 2015 nearly half of the LDCs number, still weakens the consistency of the LDC category.

Ferdi WP n°208 Drabo, A., and Guillaumont, P >> Graduation from the category of least developed countries … 12
Graph 1.Inclusion and graduation: How the composition of the category has evolved
3. Trends and prospects of LDCs graduation: Back to the category rationale
In order to examine these prospects (as done previously in Drabo and Guillaumont, 2014), we make
the assumption that the graduation criteria remain unchanged: two criteria to no longer be met
(initial and general rule) or the income per capita only criterion (added in 2005), with a margin with
respect to the inclusion threshold. After recalling the prospects in 2020 at the end of the IPoA, we
consider the graduation longer-term prospects according to the two criteria rule, then according to
the income only criterion.
3.1. Graduation in the Istanbul timeframe
After Istanbul, while one country has been added to the list of LDCs (South Sudan, in 2012) only two
countries have been graduated (Samoa, in 2014, Equatorial Guinea, in 2017). For two other ones the
graduation has already been decided (by the GA), to be effective later: Vanuatu (in 2020), and Angola
(in 2021). Seven other ones, having been twice eligible, have already met the criteria: Tuvalu (in 2012,
then again in 2015, recommended for graduation by the CDP in 2012, what ECOSOC did not consider
for an endorsement in 2012, neither in 2015, deferring its decision to 2018), Kiribati (not being
recommended in 2015 by the CDP but recommended for graduation in 2018 at its third consecutive
fullfilment of the graduatiation condition), Bhutan, São Tomé and Principe and Solomon Islands (for
which graduation has been recommended by the CDP after their second fullfilment of the
graduation criteria in 2018), Nepal and Timor-Leste (for which the recommendation for graduation
by the CDP has been deferred despite having met the graduation criteria for the second consecutive
time). Three other countries have been found eligible a first time in 2018, likely to be again found so
in 2021 but could not “meet the criteria before 2020”: Bangladesh, Myanmar and Lao PDR. Thus at
the end of the decade, there could be 13 out of the 48 LDCs of the IPoA having met the graduation criteria
(3 of which likely to have graduated), what means around one fifth instead the IPoA goal of one half. Although graduation prospects are substantial, they significantly (and unavoidably) lag behind the
IPoA goal..

Ferdi WP n°208 Drabo, A., and Guillaumont, P >> Graduation from the category of least developed countries … 13
We remember that since 2004 the graduation is effective only three years after the General Assembly
has “taken note of” the recommendation of the CDP to graduate a country (a recommendation
proposed only after the CDP has found the country eligible at two successive triennial reviews, i.e.
meeting the criteria) . It follows that after the country has met the graduation criteria and been
recommended for graduation by the CDP, at least three more years are needed for the graduation
to be effective. Thus, according to the present rules, for a country to be actually graduated by 2020,
it should already have been found eligible a first time no later than in 2012, and a second time in
2015, then recommended for graduation. If the recommendation is rapidly endorsed by ECOSOC
and the General Assembly, it could be graduated at best in 2018. So that the number of countries on
the list of LDCs that was 48 at the time of the IPoA (49 in December 2012 after the decision of the
General Assembly to include South Sudan) will not be less than 46 (initial list + South Sudan – Samoa
– Equatorial Guinea – Vanuatu). However six other countries might have graduated one year later in
2021; it could be the case of Angola for which the graduation has been decided for 2021, Tuvalu and
Kiribati, two countries found eligible for a first time respectively in 2003 and 2012, and the three
other countries recommended for graduation by the CDP in 2018 (Bhutan, Sao Tome and Principe
and Solomon Islands) if the ECOSOC endorses the recommendation and the UNGA takes note of it
promptly. According to the present rules (and without new inclusion or “voluntary graduation) the
minimum number of countries staying on the list of LDCs in 2021 would be 40, a decrease by nine (less
than one fifth compared to 2011).
As for the three LDC found eligible for the first time at the 2018 review, if they would be so a second
time in 2021, they could be graduated at the earliest in 2024.
Graduation prospects should now be considered on a longer time horizon.

Ferdi WP n°208 Drabo, A., and Guillaumont, P >> Graduation from the category of least developed countries … 14
3.2. Graduation process and prospects according to the “two criteria” principle
Absolute versus relative thresholds: which impact?
According to the two criteria rule for graduation, a country is eligible for graduation if it reaches the
graduation threshold for at least two of the three criteria.
For per capita GNI a threshold by 20% above the absolute level used by the World Bank
For the GNI pc (measured according the World Bank Atlas method), the threshold retained is now
20% above the inclusion threshold, that is the threshold used by the World Bank to separate low
income and middle income countries (LICs and MICs). This inclusion threshold is an absolute level,
constant over time (a history of this criterion in Guillaumont 2009a).
For HAI and EVI the graduation threshold is by 10% respectively above and below the inclusion one.
HAI and EVI are composite indices, scaled, then assessed with respect to maximum and minimum
values of a reference group (values possibly bounded to limit the impact of outliers on the index).
Until 2012 the EVI and HAI inclusion thresholds were determined with respect to the quartile value
of a reference group, making the corresponding criteria clearly relative. In 2015 the thresholds values
have been maintained at their level of the 2012 review, with the aim at making the HAI and EVI
criteria “absolute”, as is the GNIpc criterion. It does so only to some extent (see Box 3).
Box 3: Have HAI and EVI become really “absolute”?
In 2015 a change has occurred in the way by which the HAI and EVI inclusion and graduation thresholds
are determined, with significant implications for graduation. From 1991 to 2015, and reversing the way by
which the three identification criteria were managed since 1971 (see details in Caught in a trap), there was
indeed an important difference between the per capita GNI criterion that was designed by an absolute
threshold in constant dollars and the EVI or HAI thresholds, designed by the quartile value of a reference
group, making EVI and HAI criteria “relative” whreas GNIpc criterion was an “absolute” one. In 2015 the
HAI and EVI thresholds have been maintained at their 2012 value, suggesting they are now absolute and
constant thresholds.
But EVI and HAI are composite indices averaging component indices that are by essence relative indices, a
given (constant) value of which has no intrinsic meaning (it is a relative value at a given point of time). If
any change occurs in the measurement of a component (new data, new design or new calculation
method), the meaning of the supposed absolute EVI or HAI threshold will change. In other words, the new
thresholds remain relative to way by which components have been measured and to how their maximum
and minimum values have been determined: They are absolute constant index values only ceteris paribus
i.e. if the measurement of each component remains strictly the same (and without updating of the previous
data on which they rely). .
Moreover one may wonder whether in a globalized world it is more meaningful to express the handicaps
faced by poor countries in absolute terms, rather than in relative ones. Competitiveness is a relative

Ferdi WP n°208 Drabo, A., and Guillaumont, P >> Graduation from the category of least developed countries … 15
concept, handicaps probably too.(see in Annex 3. how it could be taken into account with a new design of
the reference group )
This change in the definition of the EVI and HAI thresholds has an impact on graduation prospects.
As far as EVI and HAI are improving all over the developing countries, a fixed level of the thresholds
makes graduation easier (and inclusion more difficult). Indeed, had the previous determination of
the thresholds from the quartile value of a reference group been maintained at the size of the 2012
review, three countries (Bhutan, Nepal and Solomon Islands) out of the four ones found eligible for
the first time in 2015 on the basis of the two criteria rule (the fourth one being Sao Tome and
Principe) would have not been so14. It follows that without changing the measurement of the HAI
(and EVI) threshold, the number of the 48 IPoA LDCs likely to meet the graduation criteria by 2020
would not be 13 as assessed above, but seven, representing 1/7 instead of 1/5, lagging even more
behind the goal of one half (for a discussion of the way by which the issue raised by the reference
group could be managed, see Annex 3).
The position of these three countries with respect to criteria strongly differed. Bhutan was close to
the income-only criterion (and even closer in 2018). Sao Tome & Principe, as most of previous
graduating countries, has a middle level of income and a rather high level of HAI, but is still a
vulnerable small island. Nepal is atypical, being the first country still with a low level of income per
capita found eligible on the basis of the two structural handicap criteria, HAI and EVI. We come back
later to this special case.
To assess the progress towards graduation with regard to the two criteria rule, three kinds of
empirical exercises have been carried out. The first one aims at giving a global view on the evolution
of the positions of LDCs with regard to each of the three criteria GNI, HAI and EVI. The other one aims
at giving a country by country view on the evolution of the relative position with respect to the three
criteria and so for each country in order to evidence the trends towards eligibility to graduation. The
third one is to consider whether the evolution of the structural handicaps indicators evidence a
structural transformation deserving graduation.
How have relative positions been globally changing?
The first exercise, considering all LDCs, and successively for each criterion, consists of comparing the
position of the countries with respect to graduation thresholds at different review years. For a
relevant comparison the review years 2000 and 2018 have been chosen since the EVI criterion has
been introduced in 2000. However the composition of EVI (more than that of HAI) has changed
during this period, in particular at the 2006 and 2012 reviews (see Guillaumont 2009a and 2013). In
particular the definition of EVI changed in 2012 by a reduction by half of the weight given to the
small population size component and the addition of a new component reflecting the share of
population in low coastal areas. Moreover, as explained above, the design of the (inclusion and)
14 Their 2015 HAI level crossed over the 2012 graduation threshold, but would have not reached a graduation threshold located at 10% above the quartile value of a constant size reference group.

Ferdi WP n°208 Drabo, A., and Guillaumont, P >> Graduation from the category of least developed countries … 16
graduation thresholds has been changed in 2015. For these reasons, we also compared the evolution
from 2006 to 2012 of an EVI corresponding to the (unchanged) definition of the 2006 and 2009
reviews, i.e. using an EVI calculated in 2012 on the basis of the 2006-09 definition.
Graph 2 presents the results for EVI15, graph 2 for HAI. The red and thick dash lines represent the
graduation thresholds for both years, while the blue and thin dash lines represent the inclusion
thresholds.
On Graph 2, the progress towards EVI graduation threshold between 2000 and 2018 appears rather
weak. Among the countries that met the EVI graduation threshold in 2000, Eritrea, Madagascar, and
Bangladesh, only the last one met it in 2018, while seven other countries that did not fulfill this
criterion in 2000 do it in 2018: five ones do it clearly, Tanzania, Nepal, Haiti, Togo and Guinea, and
three other ones were very slightly over the threshold, and thanks to the new design of a fix
threshold, Myanmar, Uganda, Ethiopia, these ones being just on the borderline. On the other hand
a majority of LDCs have come closer to the graduation threshold, as shown by their position with
respect to the 45 degree line, and seven of them stay between the inclusion and the graduation
thresholds16.
With regard to the HAI criterion, the results obtained are shown on graph 3. Since the changes
brought in the composition of HAI (still named APQLI, Augmented Physical Quality of Life Index, in
2000) have been less significant than for EVI, the comparison from 2000 to 2018 is easier. A relative
improvement clearly appears for this indicator. A quite larger number of LDCs (12) reach the
graduation threshold in 2018 than in 2000 (0): Samoa (graduated in 2014), reaching it in 2000 was
joined in 2012 by Tuvalu, Kiribati, Vanuatu, Sao Tome and Principe, and Myanmar, plus (and on the
borderline) by three other ones in 2015, due to the change in the threshold definition, Nepal, Bhutan,
Cambodia, and four additional LDCs in 2018, Timor-Leste, Lao PDR, Bangladesh and Solomon Islands.
This improvement in the location of countries on the graph probably would have not been possible
without a real progress in their human assets. However until 2012 it may also have been enhanced
by the endogenous effect of the reduction in the reference group, or, less likely, by small changes
introduced in the measurement of the index components.
15 And the graph in Annex 1, where the black and thick horizontal line represents the graduation threshold of EVI for the year 2006 method applied to 2012
16 They were four in 2012, and would have been five in 2015, had the design of thresholds been unchanged. Do these results come from other changes in the definition of EVI, or from the structural change of countries? A partial answer is given in Graph in Annex 1, where the 2006 positions are compared to the 2012 ones, using for 2012 the same 2006-2009 definition of EVI. On this shorter period the picture seems better. All the four countries that met the graduation criteria in 2006 (Bangladesh, Tanzania, Guinea and Nepal) met it in 2012, while, Ethiopia met it in 2012 without having met it in 2006. On the other hand the whole distribution of countries on both sides of the 45 degree line appears more balanced than on Graph 116. Thus it seems from the analysis that the 2011-12 changes in the EVI have affected the positions of LDCs with regard to the EVI graduation threshold.

Ferdi WP n°208 Drabo, A., and Guillaumont, P >> Graduation from the category of least developed countries … 17
Graph 2: Positions of LDCs with regard to EVI 2018 and EVI 2000
Graph 3: Positions of LDCs with regard to graduation thresholds of HAI (APQLI) in 2000 and 2018
Note (for Graphs 2 and 3) : The 45 degree line has been drawn from the intersection of the graduation threshold lines. It does not go through the inclusion thresholds intersection since the margins between the graduation and the inclusion thresholds have changed.
AFGAGO
BDI
BEN
BFA
BGD
BTNCAF
COM
DJI
ERI
ETHGIN
GMB
GNB
GNQHTI
KHM
KIR
LAO
LBR
LSO
MDG MLI
MMR
MOZ
MRT
MWI
NER
NPL
RWA
SDN
SEN
SLBSLE
SOM
STP
TCD
TGO
TVU
TZA
UGA
VUT
YEMZMB
20
40
60
80
EV
I 201
8
20 40 60 80EVI 2000
AFGAGO
BDI
BEN
BFA
BGDBTN
CAF
COM
DJI
ERIETH
GIN
GMB
GNB
GNQ
HTI
KHM
KIR
LAO
LBR
LSO
MDG
MLI
MMR
MOZ MRT
MWI
NER
NPL
RWASDN
SEN
SLB
SLE
SOM
STP
TCD
TGO
TVU
TZA
UGA
VUT
YEM ZMB
02
04
06
08
01
00H
AI 2
018
0 20 40 60 80HAI 2000
Incl
usio
n 20
00
Gra
duat
ion
2000
Inclusion 2018
Graduation 2018
45 degree line
Incl
usio
n 20
00
Gra
duat
ion
2000
Inclusion 2018
45 degree line
Graduation 2018

Ferdi WP n°208 Drabo, A., and Guillaumont, P >> Graduation from the category of least developed countries … 18
With respect to the GNIpc criterion, the results as presented in Graph 4 show a global move towards
the graduation threshold between 2000 and 2018. 17 countries fulfilled the ordinary graduation
threshold in 2018 (14 in 2015 and 9 in 2012), compared to only four in 2000. Only one country
(Liberia) met the threshold in 2000 without meeting it in 201817.
As a result, during the last fifteen years the two-criteria based graduation eligibilities have resulted
from the levels of the per capita GNI and the human asset index (Maldives, Tuvalu, Samoa, Vanuatu,
Kiribati, Sao Tome and Principe, Solomon Islands, Bhutan, Bangladesh, Myanmar and Lao PDR),
except in one case from the levels of HAI and EVI (Nepal) .
Graph 4: Positions of LDCs with regard to log of GNIpc 2018 and log of GNIpc 2000 reviews.
The evolution observed in the relative position with respect to the HAI and EVI criteria should not be
taken as a measure of the real change in the level of human assets or of economic vulnerability (a
measure requiring setting up homogenous series of these two indices, as seen in chapter 1). It is an
evolution with regard to moving thresholds, and depending on the definition of the indicators
prevailing at each review. From the previous graphs, it is possible to identify which countries, are
closer to meet two criteria of graduation at the next review. It seems that there are only two or three,
Lesotho (which already meets the GNIpc criterioin and is close to the HAI threshold), Togo (already
meeting the EVI criterion and close to the HAI threshold), and possibly Cambodia (already meeting
the HAI criterion and not far from the GNIpc and EVI thresholds). Anyway the chance of those
countries to move forward in the graduation direction and cross the thresholds should also be
17 It is not relevant here to draw the 45-degree line, with the view to show an increase in the level of GNIpc, because the 2000 and 2018 values are expressed in current dollars.
AFG
AGO
BDI
BEN
BFA
BGD
BTN
CAF
COMDJI
ERI
ETH GIN
GMB
GNB
GNQ
HTI
KHM
KIR
LAO
LBR
LSO
MDG
MLI
MMR
MOZ
MRT
MWINER
NPLRWA
SDN
SEN
SLB
SLE
SOM
STP
TCD
TGO
TVU
TZA
UGA
VUT
YEM
ZMB
45
67
89
Log
GN
I per
cap
ita 2
018
revi
ew
4 5 6 7Log GNI per capita 2000 review
Incl
usio
n 20
00
Gra
duat
ion
2000
Inclusion 2018
Graduation 2018

Ferdi WP n°208 Drabo, A., and Guillaumont, P >> Graduation from the category of least developed countries … 19
assessed with regard to the trend they show in their relative position, without forgetting that since
2015 the absolute levels of the EVI and HAI thresholds remain unchanged.
Box 4: The EVI move away from and towards the graduation threshold: a Bangladesh puzzle
Due to its large size and diversification potential at the 2009 review of the list of the Least Developed
Countries Bangladesh had the LDC lowest level of EVI (23.2), putting it quite beyond (-39%) the graduation
criterion (set at 38) and more and more so since 2003, what could be seen as a progress towards graduation
through a declining structural economic vulnerability. But at the 2012 review its position suddenly changed:
With a sharp increase of EVI, estimated at 32.4 Bangladesh was no longer meeting the new graduation
threshold, set up at 32. But the lower level of the graduation threshold cannot explain this dramatic change
in the ranks. This change results from three factors the main of which is the revision in the definition of EVI
that occurred between 2009 and 2012. This can be evidenced by comparing the reviews indices and those
resulting from a calculation of the EVI according to the same method and data (FERDI calculations). Let us
consider the evolution from 2006 to 2012of the Bangladesh EVI.
Illustrated on a longer period, from the 2006 to the 2012 review: while the review EVI increased from 25.8 to
32.4 (+6.6), the unchanged EVI decreased from 23.5 to 19.1 (-4.4), on the basis of the 2006-09 review
definition, evidencing a structural progress. The change in the composition (or weighting) of the review EVI
contributed by 8.4, more (by 1.8) than the official increase (of 6.6). The change in the way by which some
components have been calculated also contributed to increase the EVI by 4.5 (in particular the index of
natural shock was calculated in 2006-09 from the homeless indicator and in 2012 from the broader indicator
of the share of population victim of natural disaster). Furthermore some updating of data when the
retrospective EVI were calculated had a small impact in the opposite direction (by -1.9).
Taken together these three factors (8.4 + 4.5 - 1.9 = 11) explain the gap between the increase by 6.6 of the
review EVI and the decrease by 4.4 of the EVI calculated on the basis of the 2006 definition, a decrease that
may reflect a structural economic change, a change which did occur in Bangladesh, although moderately
(calculations made at FERDI with Joël Cariolle).

Ferdi WP n°208 Drabo, A., and Guillaumont, P >> Graduation from the category of least developed countries … 20
Do graduation prospects relying on the two criteria rule reflect structural transformation?
The evolution of the criteria indicators does not measure structural change per se, as it can be done
with the retrospective EVI and HAI series, calculated at FERDI over a long period (1970-2014). It only
shows to what extent a country is becoming closer to the current graduation criteria. An important
issue is to know whether becoming closer to the EVI and HAI thresholds corresponds to a structural
transformation. To check this correspondence we need to use time series of the EVI and HAI indices
measured according the same method and the same data, as we did elsewhere (Cariolle, Goujon and
Guillaumont 2015).
Since a low level of human capital and a high economic vulnerability are considered to be the main
structural handicaps to development (it is the basic assumption on which the LDC category relies),
enhancing human capital and reducing vulnerability should be considered as the basis of a structural
change likely to transform the countries and allow them to move “out of the trap”.
3.3. Graduation prospects according to the income-only rule
According to the income only criterion rule introduced in 2005, a country can be eligible for
graduation when it reaches twice the ordinary income graduation threshold, i.e. when its income
per capita is at least 240% of the inclusion threshold (which is the low income threshold used by the
World Bank). Since Istanbul one LDC (Eq. Guinea) has been graduated on the basis of this rule, and
among LDCs not yet graduated, 4 countries have been meeting this criterion … At the 2015 review
Angola, found a second time eligible on the basis of the only income criterion, has been
recommended for graduation. The GA having decided an exceptional additional postponement of
2 years for Angola in its decision of January 2016, this country will not be graduated before 2021.
Kiribati, as seen above, eligible for the third time with regard to the two criteria ordinary rule, while
meeting the income-only criterion a second time, was recommended only in 2018. Timor-Leste
eligible for the second time with regard to income-only criterion was not recommended in 2018.
Tuvalu, recommended for graduation since 2012 has also met and still meet the income-only
criterion.
What are now the least developed countries likely to reach the income only criterion at the next
reviews before 2030? These prospects rely on hypotheses to be made on the growth prospects of
the countries. Results are summarized in Tables 4 and 5.
Ferdi WP n°208 Drabo, A., and Guillaumont, P >> Graduation from the category of least developed countries … 21
Assuming that each LDC is growing as in the previous fifteen years
We first suppose the LDCs maintain their rates of economic growth of the past fifteen years in the
future18. The results obtained are summarized in Table 4 upper part. They show that seven (7) LDCs
are likely to reach 2.4 times the level of the low income (LI) threshold in 202119.
Moving to the year of the next review following 2021, what is 2024, these countries would be joined
by Lao PDR, Sudan, and Zambia, in 2027 by Sao Tome and Principe and Solomon Islands, and finally
by Cambodia in 2030. It means that 13 present LDCs would have reached the income only criterion
in 2030, seven more than in 2020. If graduation was to be expected essentially on the basis of this
criterion and in the extrapolated growth hypothesis, the IPoA goal for 2020 would not be reached in
2030.
A variant of this analysis is to consider the situation in which the previous average (extrapolated)
growth rate of each LDC per annum is uniformly increased by 1%. This might be considered as an
optimistic result of the implementation of IPoA, uniform for all LDCs. Table 4 also presents the results
of this analysis. They are similar to the previous figure for 2018, but three (3) additional countries
would be likely to reach 2.4 times the LI threshold in 2030 (Bangladesh, Djibouti, Lesotho).
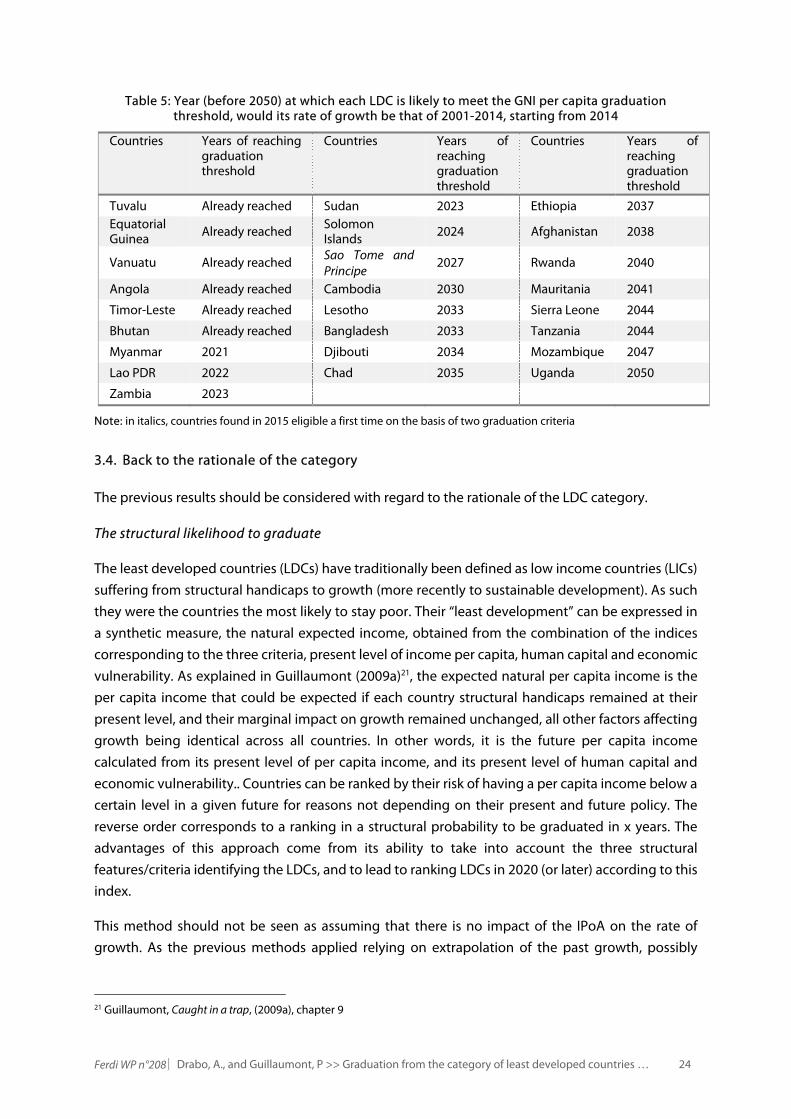
An alternative approach to this analysis is to assess in how many years each LDC is likely to reach the
threshold, according to the present level of income per capita and the estimated rate of growth.
Table 5 shows the results of this exercise. Based only on the income rule and on the above
assumptions, the number of LDCs not meeting this graduation criterion will decrease by half just
before 2050. Those countries having registered very low or even negative rates of growth during the
last decade will not be able to meet the income-only criterion during this century, unless their
economic growth is not boosted.
18 Also supposing the rate of growth of GNI similar to that of the Gross Domestic Product (GDP), we first estimate the rate of growth of the per capita GDP from 2001 to 2014 by ordinary least squares method and from data of the (on line) World Development Indicators. Using these growth rates, we then extrapolate the GNI per capita from the latest available GNI per capita.
19 Including (i) two ones the graduation of which should occur at the latest in 2021, because it has already be decided by the UNGA (Angola and Vanuatu), (ii) one country already reaching this threshold a second time in 2018 (Timor Leste), (iii) one country already close to the threshold and recommended for graduation on the basis of two criteria (Bhutan), (iv) two countries already reaching this threshold, recommended for graduation and (v) one country found eligible for graduation for the first time in 2018 (Myanmar)
Ferdi WP n°208 Drabo, A., and Guillaumont, P >> Graduation from the category of least developed countries … 22
Assuming IPoA fully effective: each LDC is growing at the 7% target rate
One of the objectives of the Istanbul Programme of Action is the achievement of “sustained, equitable
and inclusive economic growth in least developed countries, to at least at the level of 7 per cent per
annum,” (United Nations, 2011, p.6) What does 7% mean? In the context of this sentence it seems to
refer to the growth of the GDP. Of course a goal of 7% of GDP per capita would be very different since
LDCs still have high population growth rates.
To assess the consistency between the graduation goal (with respect to the only income criterion)
and the GDP growth, we first identified countries on track to reach the income graduation criterion
if their average GDP growth rate was 7 per cent per year, starting from the year 201420. We assume
that the LDCs keep their population growth rate of last fifteen years and calculate the per capita
growth rate as the difference between 7 and their population growth rate. We then extrapolate the
GNI per capita from the latest available GNI per capita (2014). It does not change the number (7) of
LDCs meeting the criterion in 2018, compared to the result from extrapolated growth. And still
compared to it, it will add only one country (Mauritania) to the list 17 countries reaching the
threshold in 2030.
Let us now suppose that the 7% target refers to the per capita GDP growth rate, which is a very high
rate indeed, reached during the 2000’s only by two oil exporters (Angola and Equatorial Guinea). The
result obtained is of course better, they are summarized in the fourth and last row of Table 1. Thirteen
(13) LDCs are likely to reach the income criterion threshold by 2021 and twenty-four (24) by 2030.
It should be noted that in all these simulations all the countries found eligible in 2018 on the basis
of the traditional two criteria rule also appear to meet the only income criterion between 2020 and
2030, except Nepal, indeed a special case.
20In a previous assessment of graduation prospects we started from 2011 (see Drabo and Guillaumont, 2014?)

Ferdi WP n°208 Drabo, A., and Guillaumont, P >> Graduation from the category of least developed countries … 23
Table 4: Countries likely to meet the income-only graduation threshold at the next five reviews if they keep last decade growth rate of GNI or grow at the 7% target of IPoA.
Review Years 2021 2024 2027 2030
List of countries likely to reach the income-only graduation threshold if their per capita growth rates remain those of 2001-2014
Angola Bhutan Kiribati Myanmar Timor-Leste Tuvalu Vanuatu (7 countries)
Idem as 2021+3 Lao PDR Sudan Zambia (10 countries)
Idem as 2024+2 Sao Tome and Principe Solomon Islands (12 countries)
Idem as 2027+1 Cambodia (13 countries)
List of countries likely to reach the income-only graduation threshold if their economic growth rates increase by 1%, compared to those of 2001-2014.
Idem as above +1 Lao PDR (8 countries)
Idem as above + 2 Sao Tome and Principe Solomon Islands (12 countries)
Idem as above+1 Djibouti (13 countries)
Idem as above+3 Bangladesh Djibouti Lesotho (16 countries)
List of countries likely to reach the income-only graduation threshold if their economic growth rates were 7%.
Idem as above -1+1 +Solomon Islands -Myanmar (8 countries)
Idem as 2021+5 Djibouti Lao PDR Sao Tome and Principe Sudan Zambia (13 countries)
Idem as 2024+2 Lesotho Myanmar (15 countries)
Idem as 2027+3 Bangladesh Mauritania Yemen, Rep. (18 countries)
List of countries likely to reach the income-only graduation threshold if their per capita economic growth rates were 7%.
Idem as above -1+6 -Myanmar +Djibouti +Lao PDR +Sao Tome and Principe +Solomon Islands +Sudan +Zambia (12 countries)
Idem as 2021+4 Lesotho Mauritania Myanmar Yemen, Rep. (16 countries)
Idem as 2024+2 Bangladesh Senegal (18 countries)
Idem as 2027+5 Benin Cambodia Chad South Sudan Tanzania (23 countries)
Note: in italics, countries found in 2015 eligible a first time on the basis of two graduation criteria
Ferdi WP n°208 Drabo, A., and Guillaumont, P >> Graduation from the category of least developed countries … 24
Table 5: Year (before 2050) at which each LDC is likely to meet the GNI per capita graduation threshold, would its rate of growth be that of 2001-2014, starting from 2014
Countries Years of reaching graduation threshold
Countries Years of reaching graduation threshold
Countries Years of reaching graduation threshold
Tuvalu Already reached Sudan 2023 Ethiopia 2037 Equatorial Guinea Already reached Solomon
Islands 2024 Afghanistan 2038
Vanuatu Already reached Sao Tome and Principe
2027 Rwanda 2040
Angola Already reached Cambodia 2030 Mauritania 2041
Timor-Leste Already reached Lesotho 2033 Sierra Leone 2044
Bhutan Already reached Bangladesh 2033 Tanzania 2044
Myanmar 2021 Djibouti 2034 Mozambique 2047
Lao PDR 2022 Chad 2035 Uganda 2050
Zambia 2023
Note: in italics, countries found in 2015 eligible a first time on the basis of two graduation criteria
3.4. Back to the rationale of the category
The previous results should be considered with regard to the rationale of the LDC category.
The structural likelihood to graduate
The least developed countries (LDCs) have traditionally been defined as low income countries (LICs)
suffering from structural handicaps to growth (more recently to sustainable development). As such
they were the countries the most likely to stay poor. Their “least development” can be expressed in
a synthetic measure, the natural expected income, obtained from the combination of the indices
corresponding to the three criteria, present level of income per capita, human capital and economic
vulnerability. As explained in Guillaumont (2009a)21, the expected natural per capita income is the
per capita income that could be expected if each country structural handicaps remained at their
present level, and their marginal impact on growth remained unchanged, all other factors affecting
growth being identical across all countries. In other words, it is the future per capita income
calculated from its present level of per capita income, and its present level of human capital and
economic vulnerability.. Countries can be ranked by their risk of having a per capita income below a
certain level in a given future for reasons not depending on their present and future policy. The
reverse order corresponds to a ranking in a structural probability to be graduated in x years. The
advantages of this approach come from its ability to take into account the three structural
features/criteria identifying the LDCs, and to lead to ranking LDCs in 2020 (or later) according to this
index.
This method should not be seen as assuming that there is no impact of the IPoA on the rate of
growth. As the previous methods applied relying on extrapolation of the past growth, possibly
21 Guillaumont, Caught in a trap, (2009a), chapter 9

Ferdi WP n°208 Drabo, A., and Guillaumont, P >> Graduation from the category of least developed countries … 25
increased by a given and uniform rate, it only supposes that its impact on growth is the same among
LDCs.
Box 5: Assuming each LDC growing at its expected structural or natural rate
Methodologically, as done in Guillaumont (2009a), economic growth is regressed on the logarithmic forms of
initial per capita income level (Yo), the economic vulnerability index (EVI) and the complement to 100 of the
human asset index (100-HAI) as followed22:
)100log()log()log()( HAIEVIYoYgrowth
The estimated coefficients obtained (assumed unchanged) are used for the projection of a virtual future
(“natural”) income from the latest value of the three variables (present income and handicaps assumed
unchanged).
New estimations of the impact of the structural handicaps (and convergence factor) on per capita income
growth have been run with same specification of the criteria variables as in Guillaumont (2009a), still over
1970-2010 in order to capture the factors at work before the adoption of the IPoA, but with GMM estimations
on a panel of five year periods23. The coefficients of the logarithmic form of initial GNI per Capita, 100-Human
Asset Index, and Economic Vulnerability Index are negative and significant, still consistent with the previous
findings of Guillaumont (2009a). The sample of 73 countries includes 29 LDCs.
This result underlines the important role played by (low) HAI and EVI as relative handicaps in economic
growth, and the existence of conditional economic convergence among developing countries (including
LDCs) when these variables are taken into account.
The growth of the per capita income to 2020 and 2030 has thus been simulated, starting from the level of the
criteria variables used at the 2012 review, except for EVI, recalculated according to the method of 2006-09,
more appropriate for this exercise24. The results are presented in Table 7.
The half of LDCs likely to reach the highest level of income at the end of the decade, when taking
into account their structural handicaps.
Let us first look at the ten countries the most likely to graduate: they include, after Equatorial Guinea,
already graduated, the presently two graduating countries (Angola and Vanuatu,), five other LDCs
already found at least twice eligible (Tuvalu and Kiribati and, since 2018 Bhutan, Sao Tome &
Principe, and Timor Leste,), then Djibouti and Sudan, close to the income-only criterion, three out of
seven not yet graduating being oil exporters. The half of the 48 LDCs, 24 LDCs, which are the most
likely to graduate for structural reasons include these ten previous countries, and 14 other ones of
22 The logarithmic specification is used to capture interaction between the two handicaps, as assumed by the identification through complementarity criteria (mutual reinforcement of handicaps).
23 The results obtained from the regression are the following with absolute t statistics in parentheses: growth(Y)= 0.328(3.93)-0.025(3.22)Yo-0.010(1.96)(log EVI)-0.032(3.80)(log 100-HAI)
24 The use of the 2006-09 definition instead of the 2012 one, is legitimate because the new component added (low coastal area population) is intended to reflect a risk for long term and sustainable development, but would weaken the relationship of EVI with growth, as estimated on the past and still relevant for the next two decades.
Ferdi WP n°208 Drabo, A., and Guillaumont, P >> Graduation from the category of least developed countries … 26
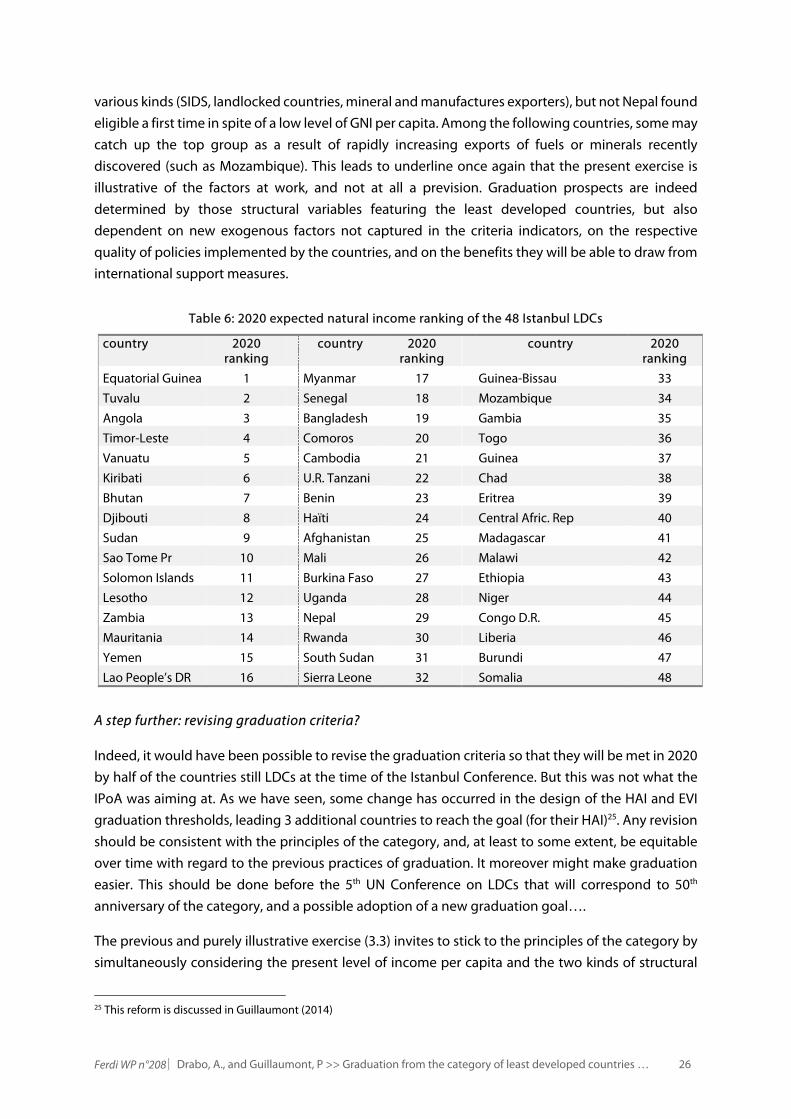
various kinds (SIDS, landlocked countries, mineral and manufactures exporters), but not Nepal found
eligible a first time in spite of a low level of GNI per capita. Among the following countries, some may
catch up the top group as a result of rapidly increasing exports of fuels or minerals recently
discovered (such as Mozambique). This leads to underline once again that the present exercise is
illustrative of the factors at work, and not at all a prevision. Graduation prospects are indeed
determined by those structural variables featuring the least developed countries, but also
dependent on new exogenous factors not captured in the criteria indicators, on the respective
quality of policies implemented by the countries, and on the benefits they will be able to draw from
international support measures.
Table 6: 2020 expected natural income ranking of the 48 Istanbul LDCs
country 2020 ranking
country 2020
ranking
country 2020
ranking
Equatorial Guinea 1 Myanmar 17 Guinea-Bissau 33
Tuvalu 2 Senegal 18 Mozambique 34
Angola 3 Bangladesh 19 Gambia 35
Timor-Leste 4 Comoros 20 Togo 36
Vanuatu 5 Cambodia 21 Guinea 37
Kiribati 6 U.R. Tanzani 22 Chad 38
Bhutan 7 Benin 23 Eritrea 39
Djibouti 8 Haïti 24 Central Afric. Rep 40
Sudan 9 Afghanistan 25 Madagascar 41
Sao Tome Pr 10 Mali 26 Malawi 42
Solomon Islands 11 Burkina Faso 27 Ethiopia 43
Lesotho 12 Uganda 28 Niger 44
Zambia 13 Nepal 29 Congo D.R. 45
Mauritania 14 Rwanda 30 Liberia 46
Yemen 15 South Sudan 31 Burundi 47
Lao People’s DR 16 Sierra Leone 32 Somalia 48
A step further: revising graduation criteria?
Indeed, it would have been possible to revise the graduation criteria so that they will be met in 2020
by half of the countries still LDCs at the time of the Istanbul Conference. But this was not what the
IPoA was aiming at. As we have seen, some change has occurred in the design of the HAI and EVI
graduation thresholds, leading 3 additional countries to reach the goal (for their HAI)25. Any revision
should be consistent with the principles of the category, and, at least to some extent, be equitable
over time with regard to the previous practices of graduation. It moreover might make graduation
easier. This should be done before the 5th UN Conference on LDCs that will correspond to 50th
anniversary of the category, and a possible adoption of a new graduation goal….
The previous and purely illustrative exercise (3.3) invites to stick to the principles of the category by
simultaneously considering the present level of income per capita and the two kinds of structural
25 This reform is discussed in Guillaumont (2014)

Ferdi WP n°208 Drabo, A., and Guillaumont, P >> Graduation from the category of least developed countries … 27
handicaps to growth. It would be difficult to use the expected natural income as an augmented
income-only criterion, with an appropriate threshold to be determined, because the LDCs
identification could not rely on an econometric estimation, always debatable. But another composite
index averaging the three indicators of low (log of) income per capita, low human capital and
economic vulnerability, as presented in Caught in a trap, and called here “Least Development Index”
(LDI) could easily be used, covering a larger number of countries than the LDCs group. It could also,
but not necessarily be used as an inclusion criterion as well. The Annex 5, simply illustrates what
could be the ranking of LDCs according to this LDI. It is measured as a quadratic average of the 3
indicators (data of the 2018 Review), so that their impact is not perfectly substitutable, thus reflecting
the initial complementarity of the three criteria.
The ranking of the LDCs according to this LDI, from 2018 Data, evidences both the consistency of the
category and that of the present process of graduation, meaning that it could be used as a rule of
identification in the future without generating inter-temporal inconsistency: among the 40 countries
with the highest “least development index” and a population < 100 millions (a 4Th criterion applied),
all are LDCs (except Zimbabwe, who refused, and Cote d’Ivoire); and all the other 9 LDCs (except
Djibouti) are graduating, recommended or simply eligible among the other ones. Referring to this
ranking for graduation would lead to reconsider only the case of Kiribati (recommended, in spite of
a high LDI, which would make it no longer eligible). Moreover Nepal found eligible, but not
recommended in 2018 would no longer be eligible, ranked 39th26
A minor revision, that also can be applied only to graduation, and still fitting the rationale of the
category, is easier to implement, and was already suggested by the CDP. The CDP agreed in 2005 to
consider simultaneously only the two structural handicaps (HAI and EVI) in such a way as to take into
account some degree of substitutability among the criteria and the possible combined impact of the
handicaps as captured by the HAI and EVI” (CDP, 2005)27. This additional information can become a
more formal graduation rule, relying on the combined level of (100-HAI) and EVI, we called “structural
handicap index” (SHI), in Caught in trap (Guillaumont, 2009). It is possible to determine graduation
thresholds by the same way it has been or is done for each of the two present HAI and EVI indices,
either by applying the quartile rule to a reference group of usual size, as done until 2012 (see in
Annex how this rule could be re-designed), or by keeping a fix threshold from the 2012 threshold
values, as done in 2015 and in 2018. The measurement the more consistent with what has been done
in 2012-2015-2018 would be to measure the SHI threshold for 2012 applying the quartile rule to the
reference group used at that time, then to keep this value as an “absolute value” for the SHI threshold
of 201828.
26 Djibouti, ranked 42d, could possibly be eligible, depending on the threshold retained
27Actually in 2006, before recommending Samoa for graduation, it noted “the average of the two indices, (100 –HAI) and EVI was “at a level similar to that of Cape Verde, whose graduation has been decided by the General Assembly”.
28 This seems preferable to measure the SHI threshold of 2015 by the average of the EVI and (100- ) HAI “absolute value” thresholds as designed in the 2012 and 2015 Reviews, with 32 for EVI and 34 for 100-HAI, the simple average of which is 33.

Ferdi WP n°208 Drabo, A., and Guillaumont, P >> Graduation from the category of least developed countries … 28
The SHI index can be calculated either as an arithmetic average, supposing a perfect substitutability
between the two handicaps impact, what is the simplest, or preferably as a quadratic average29,
giving higher impact to the stronger handicap and reflecting a limited substitutability between
handicaps impact. The quadratic average is more consistent with the usual design of the category
where each handicap criterion should be met for inclusion: the handicaps interaction is supposed to
make growth more difficult.
Consistent with the present graduation practice, there could be again a “two criteria rule” according
to which the new SHI criterion (replacing the two HAI and EVI criteria), and the GNIpc graduation
criterion are both to be met, supplemented, as presently, by an income-only criterion rule..
Let us apply the (quadratic) SHI criterion of graduation to the figures of the 2018 review and examine
whether the eligibility for graduation would have been modified:
Tuvalu and Kiribati (recommended for graduation) and Timor Leste (not recommended)
would have not met the SHI graduation criterion30, but were anyway eligible on the basis of
the income-only criterion
Bhutan, and Sao Tome & Principe would have still been eligible a second time to graduation
on the basis of the 2 criteria rule, whatever the measurement of the SHI threshold;
Solomon Islands would not have been so;
Nepal, would have met the SHI graduation criterion, but would have not been eligible to
graduation, being still a low-income country, while Bangladesh, Myanmar, and Lao PDR
would still have been eligible a first time on the basis of the two criteria rule. The special
case of Nepal, raising conceptual issues about graduation, is discussed in Box 4.31
Moreover applying this rule of two criteria (GNIpc and SHI) to inclusion would enhance the
consistency of the category, since the number of LDCs still meeting the two criteria would
significantly increase (from 16 to 25 or 2732), without any additional eligibility to inclusion.
29 Or a reverse geometric average, as done in Caught in a trap.
30 Tuvalu only if the SHI is calculated through a quadratic average, but it would have been eligible with an arithmetic average 31 Using this new rule would make even easier for Bangladesh (having the lowest SHI among LDCs) to implement the “atypical approach” suggested by Bhattacharya and Borgatti (2012) to become rapidly eligible by accelerating the improvement of its human capital.
32Depending on the precise threshold location

Ferdi WP n°208 Drabo, A., and Guillaumont, P >> Graduation from the category of least developed countries … 29
Box 6: The Nepalese exception, and its implications for the meaning of graduation: Measuring vulnerability matters
In all but one cases LDCs have been considered as eligible to graduation either for their income per capita and HAI, on the basis of two graduation criteria rule, or on the basis of the income-only criterion. The exception is the case of Nepal, found eligible in 2015, as crossing the graduation thresholds for HAI and EVI, although still being a low income country (with an income per capita 36.below the graduation threshold).
The Nepal exception appears as a paradox. If the rationale of the category is valid, a country having overcome its structural handicaps would no longer be locked into a low level trap. All other eligible countries had indeed become middle income countries. There may be two kinds of reasons for this Nepalese exception.
One would be that Nepal suffered from obstacles to economic growth that were not structural, but linked to a poor policy. It does not seem that the other countries found eligible to graduation did apply significantly better policies (as assessed by the World Bank CPIA, cf above chapter II). But Nepal evidences a rather poor ranking with regard to various indicators of socio-political vulnerability and state fragility (cf Guillaumont, 2017). Are the factors reflected by these indices not exogenous, independent on current economic policy, and a part of the structural vulnerability of Nepal?
Another and better reason for the Nepalese exception is that the structural obstacles to growth faced by Nepal are not fairly reflected in the HAI and EVI indicators, due to their scope or the way by which they are measured (see the paragraph “What the EVI does not tell us” in Guillaumont, 2017). Let us simply note four factors of underestimation of the genuine structural economic vulnerability of Nepal by the official EVI:
the measurement of export instability of goods and services does not take into account the instability of remittances, which are especially high in Nepal;
the measurement of the concentration of merchandise exportation only considers the concentration by product, and not the concentration by destination, that is very high in Nepal, due to its links with India: the 2 kinds of concentration reinforce the risk they raise;
the new EVI component LECZ introduced in 2012 leads to a biased treatment of the risk of flooding due to global warming: this risk results not only from the sea level rise, but also in a country such as Nepal (or Bhutan) from glacial lake outburst flood (so-called GLOF);
the period covered by the calculation of EVI in 2015 could not permit to take into account the vulnerability due to the occurrence of earthquakes in Nepal, as evidenced by the earthquake of April 2015, not yet fully taken into account in the EVI of 2018, due to statistical lags and the measurement of shocks on long periods.
Anyway the case of Nepal shows the need to supplement the mechanic application of the criteria indicators for graduation by an assessment of structural handicaps, what the vulnerability profile is expected to do.

Ferdi WP n°208 Drabo, A., and Guillaumont, P >> Graduation from the category of least developed countries … 30
4. Impact of graduation: Assessments and monitoring
The impact of graduation has two faces. It first can be seen as a reverse of the impact of LDC
membership, and be all the more negative that the impact of membership (examined all over this
book) is positive. But since graduation occurs in a context differing from that of the most LDCs, its
impact is not symmetrical to the average impact of membership: a country is graduating because it
is supposed to have overcome the structural handicaps which locked it into a trap. Thus the special
measures linked to membership may be less needed for it than for a current LDC. Furthermore the
graduation, by showing the country has reached a new development potential, may increase its
attractiveness.
In this section the impact of graduation is considered under two main headings. First the several
kinds of assessments conducted alongside the process of graduation are reviewed,. Second, drawing
on the lessons from the few cases of graduation observed (in four to five cases and on a rather short
period), some rough evidence of the actual impact is looked for.
4.1. How the expected effects of graduation have been examined
Before taking a recommendation of graduation, the CDP wanted to consider any useful information
about the expected effects of graduation. These effects have been examined through three main
steps.
Main steps: From “vulnerability profiles” to “ex ante assessments” and to monitoring
In 1999, when adopting the new EVI criterion in place of the former EDI (Economic Diversification
Index), the CDP recognized that the indicators used did not capture all the development
impediments. Therefore, it proposed to also consider a “vulnerability profile” to be prepared by
UNCTAD for LDCs found eligible to graduation for the first time. The vulnerability profile, looking at
the factors of vulnerability not necessarily well captured by the EVI, was expected to help the CDP to
make its judgement about graduation of an eligible country. Maldives was the first country to have
a “vulnerability profile”, prepared for the 2000 triennial review, where, fulfilling two graduation
criteria (HAI and GNIpc), it was recommended for graduation by the CDP. After the decision of
ECOSOC to defer the Maldives graduation, the CDP requested UNCTAD to prepare a new
vulnerability profile of Maldives for the 2003 triennial review. Since the 2003 triennial review, 13
other vulnerability profiles have been prepared: for Maldives and Cape Verde in 2003, Samoa in 2006,
Equatorial Guinea in 2009, Kiribati in 2009, 2015 and 2018, Tuvalu and Vanuatu in 2009 and 2012,
and Angola in 2015, Bhutan, Nepal, São Tomé and Principe, Solomon Islands and Timor-Leste in
2018.
In addition to the vulnerability profile, the year preceding the second triennial review after the first
eligibility to graduation, the UNDESA (CDP Secretariat) uses to prepare an ex-ante impact assessment

Ferdi WP n°208 Drabo, A., and Guillaumont, P >> Graduation from the category of least developed countries … 31
examining the likely economic and social consequences of graduation on the country that could
result from the loss of access to special support measures for LDCs33.
The vulnerability profile, as a graduation warning
UNCTAD has been preparing a vulnerability profile for all the 13 LDCs having met graduation criteria
for the first time, nine of which were SIDS (Maldives, Cape Verde, Samoa, Vanuatu, Kiribati,Tuvalu,
São Tomé and Principe, Solomon Islands, Timor-Leste) and the two other ones oil exporters
(Equatorial Guinea and Angola). These vulnerability profiles expose the historical and institutional
context of each country, provide an overview of the country with regard to each of the graduation
indicators (per capita GNI, HAI, and EVI), analyzes the overall vulnerability including those aspects
not covered by EVI, and highlights the impediments to development met by these countries, likely
to slow down their progress after they leave the category.
The vulnerability profiles, while recognizing that the countries had registered a steady and fast
progress in the level of income per capita, pushing them quite above the corresponding graduation
threshold34 and that, in the case of SIDS, their HAI was also above the graduation threshold, discussed
several times the relevance of some concepts and data used by the CDP in order to reassess the
performance of the graduating countries (eg use of GNI instead of GDP35, consideration of income
distribution and environmemental degradation36). Above all they underlined the importance of the
vulnerability factors existing in the graduating countries, reflected in a high level of EVI and other
aspects of vulnerability.
As for Maldives37, Cape Verde, Samoa, Vanuatu, Tuvalu, Kiribati, São Tome and Principe, Solomon
Islands and Timor-Leste the vulnerability profiles underlined that their EVI was far below the
graduation threshold (and even the inclusion one) and these countries are highly exposed to natural
disasters, to the handicaps of small population size, remoteness, and instability of agricultural
production... Maldives and Solomon Islands, they noted, are also affected by beach erosion, high
population density, deforestation, dumping of solid waste on beaches, leaching of toilet waste into
the groundwater…
33 Concerned countries are also invited to provide comments on the two documents and can make oral presentation at the expert group meeting prior to the triennial review and provide a written statement. Since 2009, assessment notes have been produced for ten countries: Tuvalu, Vanuatu, Kiribati, Equatorial Guinea, Angola, Bhutan, Nepal, São Tomé and Principe, Solomon Islands and Timor-Leste.
34 The incomes of graduating SIDS presented good improvement relatively to the graduation threshold ranging from 163% of the threshold in 1997 to 220% in 2003 for Maldives, 98.6% in 2000 to 161% in 2006 for Samoa, 104.6% in 1997 to 147% in 2003 for Cape Verde, Vanuatu 120% in 2003 to 213% in 2012, Tuvalu 141% in 2006 to 419% 2012, Kiribati from 96.5 in 2009 to 163% in 2012.
35. In Maldives, Samoa, Vanuatu, Kiribati and Cape Verde the GNI has generally been smaller than the GDP due to net payments abroad of investment income, but the gap has been decreasing. However, for Tuvalu and Kiribati the GNI exceeded the GDP.
36 Environmental degradation is not taken into account because of the scarcity of data. Moreover, income inequality is not used as indicator for the identification and graduation of LDCs because it can be considered as policy variable, and the human capital indicators (APQLI and HAI) indirectly reflect poverty and income distribution situations.
37 To be noted, Maldives in 1997 curiously reached the Economic Diversification Index (EDI) threshold, what has been in 2000 a good argument to replace the EDI by the EVI.
Ferdi WP n°208 Drabo, A., and Guillaumont, P >> Graduation from the category of least developed countries … 32
In the case of Bhutan, although EVI was at a lower level, the profile noted that its improvementwais
impeded by two out of its eight components: agricultural instability and small population. The
vulnerability profiles of Equatorial Guinea and Angola were different, since in the two countries
graduation was based on the income only criterion, due to natural resources availability (with a per
capita GNI 4 or 3 times the graduation threshold, while the threshold for HAI and EVI were not
reached. But they noted that Equatorial Guinea and Angola were vulnerable to oil price reduction,
remoteness and export concentration, and they still evidenced high levels of poverty. Nepal, as
noted above, presents a situation totally different from the other graduating countries, since its
eligibility for graduation in 2015 was based the HAI and EVI, while its GNI pc is still very low. So the
vulnerability profile, while recognizing that this country is less vulnerable compared to other LDCs,
made several references to the 2015 earthquakes, but underlined that its income is mainly
dependent on remittances from Nepalese living abroad (see other arguments in Box 6).
All the 13 countries were said to have difficulties to achieve structural transformation and thus to
sustain their progress. The vulnerability profiles argued that an immediate graduation would impact
negatively Maldives, Cape Verde and Samoa through international trade, development financing,
and technical and financial assistance38. To address these potential graduation consequences, the
vulnerability profile, for instance in the case of Maldives, also proposed special graduation treatment
based on: (1) let the country enjoy full market access for export for about 10 years; (2) gradual
phasing out of concessionary measures; (3) new modalities of differential treatment, even those not
granted by the virtue LDC status.
Finally the UNCTAD vulnerability profiles appear to have been mainly an advocacy to underline the
vulnerability of countries likely to be graduated on the basis of criteria other than their vulnerability,.
They have been a graduation warning rather than an assessment of the possible consequences of
their graduation. None of them clearly evidenced a high risk that, following the loss of benefits linked
to the LDC status, the graduated country would face a deterioration of its situation and possibly
come back eligible for inclusion on the LDC list39.
The CDP ex ante impact assessments40
The ex-ante impact assessment have been prepared by the CDP Secretariat to assess the likely
(future) consequences of graduation for a LDC, an issue not really addressed by the vulnerability
profiles. Development and trading partners provide an LDC with special or preferential treatments
38. Regarding international trade, their exit from the category was supposed to lead them to the loss of competitiveness vis-a-vis to LDCs and non-LDCs (mainly through loss of preferential access to market), the loss of the rules of origin, the loss of implementation delays regarding the WTO obligations for Maldives due to the limited institutional capacities and the slown down of the accession to WTO for Cape Verde and Samoa. For the development financing issue the graduating countries was fearing reduction in concessional financing due to the interpretation of graduation as signal of enhanced capacity of the country. The vulnerability profiles of these countries also antipated discalification from applying for trade related technical assistance under the Intagrated Framework and the loss of travel coverage for important global events impacting the government budget.
39 The main threat evidenced (for some SIDS) was the risk of a country to be flooded due to the sea-level rise or devastated by hurricanes
40 This paragraph relies heavily on the work of the CDP Secretariat, and in particular of Hiroshi Kawamura who prepared a note for this book, a part of which, explaining the methods and results of the ex-ante assessment for Equatorial Guinea, Kiribati, Tuvalu and Vanuatu(see CDP website).

Ferdi WP n°208 Drabo, A., and Guillaumont, P >> Graduation from the category of least developed countries … 33
in trade, official development assistance and other areas (see chapters 3 to 6). Once the country has
graduated from the category, the development and partners are no longer obliged to extend such
preferential treatments. The major objectives of the ex-ante assessment are, first, to see if and when
partners would introduce changes in their aid or trade policies towards the country after the
graduation and, second, to evaluate likely impacts of such changes. The distinctive feature of the
impact assessment, compared to the vulnerability profile, is its emphasis on examining potential
impacts of the discontinuation of the special (support) measures extended to an LDC. A specific task
is then to gather information through desk work and contacting development and trading partners
via questionnaires, and to collect information on the future behavior of the partners after the country
graduation: do they intend to postpone the end of special measures or to take other measures to
mitigate its effect?
In response to the request by the ECOSOC, the CDP Secretariat has so far undertaken ex ante impact
assessments on ten countries (namely, Equatorial Guinea (2009), Kiribati (2009, 2015, 2018), Tuvalu
(2009, 2012), Vanuatu (2009, 2012), Angola (2015), Bhutan (2018), Nepal (2018), São Tome and
Principe, Solomon Islands (2018) and Timor Leste (2018)) which were recommended to graduate
from the list of LDCs by the CDP from 2009 to 2018.
The ex ante assessments of the CDP do not use model-based quantitative methods. They rely on a
more descriptive methodology focused on each LDC special measure that a graduating country may
cease to benefit. This approach appeared to be more adapted to the issue examined and the data
availability as well. To qualitatively assess the importance of socio-economic implications of
probable changes in the special or preferential treatments, the first task was to identify the support
measures available to the country on the basis of its LDC status, and the second to quantitatively or
qualitatively examine their importance in country’s economic activities and social development. The
third one was to identify probable changes in special or preferential treatments to be made by
development and trade partners. This was done by asking the partners via a form of the
questionnaire and by reviewing rules and commitments made by them in regard to the graduation
of an LDC.
However this approach had its limitation, well summarized in CDP Secretariat documents, and
corresponding to the difficulty, underlined all over this book, to measure the impact of the LDC
status.” First some measures or treatments are not necessarily specific to LDCs, but are development
assistance/treatments for developing countries in general, which can nevertheless be affected by
graduation41... Second, there can be multiple or wide ranging impacts of a single support measure. For
example, trade preferences extended to LDCs’ exports to its developed countries’ market help the country
to increase the exportable, access to foreign exchange, employment and economic growth. Without a
macro-econometric or simulation model, total impacts at the economy-wide level of the loss of trade
41 “For example, whereas the European Union’s “Everything but arms” initiative and the UN financial support for LDCs to UN General Assembly are easily identified and specific to LDCs., at least some part of ODA given to an LDC by donor countries or multilateral institutions are not solely based on its LDC status, but are not identifiable (many donors send development assistance to LDCs not solely because of their LDC status, but because of donors’ own political, historical or humanitarian reasons)”.

Ferdi WP n°208 Drabo, A., and Guillaumont, P >> Graduation from the category of least developed countries … 34
preferences are not easily estimated. Other support measures, such as the special consideration given to
an LDC when becoming a member of the WTO, are not simply measurable.
Given these constraints and limitations, every effort has been made by the CDP Secretariat to collect latest
information from national, regional and international sources on socio-economic data on the LDCs
concerned and on trade, tariff rates and external aid data of their development and trade partners”
(Kawamura 2010).
The conclusion drawn from these ex ante assessments, as presented by Kawamura (2010), are still
valid, even once updated to take into account the results of more recent ones.
“ Graduation of Angola, Equatorial Guinea, Kiribati, Tuvalu and Vanuatu from the list of LDCs does not
appear to significantly influence development paths of these countries at least in the short- to medium-
terms, except a few areas, such as higher tariffs on copra and tuna exports to the EU and Japan, access to
the Least Developed Country Fund (LDCF) under the UNFCCC/GEF and expected higher contributions to
the UN peacekeeping operations. The limited impact of graduation on their development paths is largely
due to two factors; (i) trade liberalization at the global level since the 1980s has eroded preferences given
to LDCs, relative to non-LDCs as a result of reduced tariff differentials between the two groups of countries,
and: (ii) major bilateral donors and some multilateral institutions have their own aid policies and criteria
for aid allocations among recipient countries and LDC status is merely one of many factors that they
consider when offering aid.
The exercise of the ex-ante assessment has revealed not only the limited impact of graduation, but also
the complex web of arrangements for implementing various support measures for LDCs. For example, it
had to go around many ministries in donor countries to find out likely impact of graduation of the five
countries.... Because of this decentralized structure in regard to administrating and implementing
support measures for LDCs, it took rather longer time to receive a comprehensive reply from them on likely
changes that donor countries would introduce when a country becomes a non-LDC....
Second, various programmes and funds in the UN Secretariat and UN specialized agencies and
programmes have special clauses or fund allocations for LDCs to receive technical cooperation at
favourable terms or to attend assemblies and conferences under their auspices. But there is no centralized
unit in the UN to monitor how these special clauses and funds are utilized. It is difficult (if not impossible)
to see to what extent LDCs are aware of these and, more importantly, they fully use the funds for their
advantage.
Third, it is about the timing of conducting an ex-ante assessment. It is undertaken after an LDC is
considered to be eligible for graduation for the first time and, therefore, it takes at least 3 years for this
LDC to actually graduate. The CDP Secretariat has to ask donors a rather “hypothetical” question, i.e.
“what if a country graduates from the list of LDCs three (or longer) years from now?” In many cases,
because aid-policy frameworks or multilateral or regional trade agreements that are currently in place
are often to be expired or amended within 3 years, donors are unable to provide concrete answers to the
inquiries by the CDP Secretariat.” (See more details on CDP website).

Ferdi WP n°208 Drabo, A., and Guillaumont, P >> Graduation from the category of least developed countries … 35
In short, while the vulnerability profiles underlined that graduating countries were and remained
vulnerable, what was independent of their graduation, the ex ante impact assessments did not reach
clear conclusion about a possible negative impact of the graduation of the same countries.
CDP monitoring alongside smooth transition
Since some LDCs fulfilling graduation conditions are confronted to vulnerabilities that may hamper
their development, it was necessary to check that the graduation, if it is not well prepared, .due to
the loss of the benefits linked to the status, is not disrupting their development progress. To avoid
this situation the GA adopted the resolution 59/209 in December 2004 (the “smooth transition
strategy”) aiming at making graduation successful and effective. The resolution provided the process
to be followed by a country from the fulfilment of the graduation conditions to the total exit. It was
recalled and reinforced by the resolution 67/221 in December 2012. The need for a new resolution
had risen both from the fear and resistance of the countries recommended or found eligible for
graduation during the previous years and from the perspective of an acceleration of the number of
graduations, a goal of the IPoA. The smooth transition particulary stressed the need of monitoring
mechanisn of graduation and graduated countries from the list. The three years following the
decision of the GA to graduate an LDC, the country remains member of the group and benefit from
the advantages of the status. A transition strategy should be prepared during these three years with
development partners. These resolutions also highlighted the need to monitor the development
progress of graduated LDCs. These monitorings and assessments are mainly based on the level and
evolution of the three graduation criteria.
At the request of the ECOSOC resolutions 2008/12, 2011/20 and 2013/20 the CDP has been
monitoring since 2009 the development progress of graduating countries and has included the
findings in its annual report. During the last four triennial reviews (2009,2012, 2015, 2018), the CDP
presented the monitoring reports of five graduating LDCs: Maldives, Samoa, Equatorial Guinea,
Vanuatu and Angola.
The situation of Maldives as graduating LDC was presented in the 2009 review. The country
evidenced a good performance regarding the GNI per capita and the HAI score relatively to
other LDCs and developing countries. However, the EVI score that was relatively high,
deteriorated by the impact of the tsunami and its components.
Samoa was examined in 2009 to 2018 and had been found to have experienced improvement
in the three indicators (GNI, EVI and HAI). The country had overcome the consequences of the
tsunami even though its vulnerability level captured by the EVI score remained high.
A monitoring report of Equatorial Guinea was prepared for the 2012, 2015 and 2018 triennial
reviews. The situation of the country, which graduation was recommended only based on GNI
per capita, had been judged sustainable owing to its oil resources
Regarding the monitoring of Vanuatu graduation process, progress has been noted in the GNI
and HAI criteria on which the graduation recommendation of the country was based.

Ferdi WP n°208 Drabo, A., and Guillaumont, P >> Graduation from the category of least developed countries … 36
However, the country was hit by the Cyclone Pam on March 2015, devastating the country and
creating doubt in the relevance of maintaining Vanuatu graduation agenda.
The monitoring report of Angola was prepared for the first time in the 2018 triennial review.
It shows that while the per capita GNI remained stable and sustainable despite tdecreasing
oil production and prices, the HAI and EVI have been deteratioring.
Following their graduation the development progress of graduated countries has been monitored
since 2009 in line with smooth transition resolutions (59/209 and 67/221). The main objective is to
assess a possible deterioration in the development progress. The results of this second phase of
monitoring are summarized below when we consider what has happened after graduation in
graduated countries.
4.2. What has happened after graduation: a rough ex post assessment
Results of CDP ex post monitoring
The situation of three graduated countries has been examined by the CDP in its monitoring exercise:
Cape Verde (in 2009 and 2012), Maldives (in 2012, 2015 and 2018), Samoa (in 2015 and 2018) and
Equatorial Guinea (in 2018). According to the CDP none of these countries had shown a sign of
reversal of its progress, in spite of their remaining and specific vulnerability.
The reports on Cape Verde, graduated in 2007, argued that the country situation had been
largely improved in each of the three graduation criteria and the economic growth had been
robust, in spite of its remaining economic vulnerability: it noted that sustained efforts were
needed to move towards structural transformation and to upgrade the economy.
The reports on Maldives, graduated in 2011, noted that the country recorded progress since
its graduation in terms of GNI per capita and EVI; however, the HAI had experienced a slight
reduction due to a decline in the gross enrolment ratio in secondary schools and the EVI had
remained high; the termination of trade preferences had been well managed by the country
through market reorientation and had not affected exports of fish.
As for Samoa, graduated in 2014, the 2015 monitoring reported that the country had
registered progress since graduation and had almost completely recovered from the impact
of the Cyclone, improving its income level and maintaining its high HAI score, but remaining
vulnerable to economic and environmental shocks.
Regarding Equatorial Guinea which graduated in 2018, the country still faces serious
challenges due to low oil production and prices. The GNI per capita remains highly above the
graduation threshold but 27% below the last year level. The HAI is improving and the EVI
remains below graduation threshold.
Short term macro economic change in graduated countries: Comparison with other LDCs
It is difficult to draw general conclusions about the (ex post) impact of graduation since only four
LDCs have been graduated, then observed after their graduation, and on a relatively short period (at
least for the four countries considered by the CDP in its ex post monitoring). Moreover each of the
Ferdi WP n°208 Drabo, A., and Guillaumont, P >> Graduation from the category of least developed countries … 37
five countries that exited the LDC category (Botswana and these four countries) presents
characteristics different from the others, and they have been graduated at different periods,
corresponding to different international environments. For this reason the difference between
“before” and “after” (the graduation) should be itself compared to the difference over the same
period in the non graduated LDCs. The comparison covers a relatively short period, due the recent
dates of graduation 42. Five years of observation have been retained both for the period before and
the period after the graduation. This double difference approach is applied to the following
variables: the rate of growth of GDP, the trade to GDP ratio, the ODA to GDP ratio, the same ratio
extended to all official capital flows, and the debt to GDP ratio. Results are given below in the Table
7. They should be considered cautiously. The average evolution of the ratios in otherLDCs maynot
give a fair counterfactual of the exogenous and often specific factors likely to affect the performance
of countries after their graduation.
42 Although a longer period of observation is available for Botswana, the same length has been applied to it for the sake of comparison and because the longer the period observed after the graduation the stronger the possible weight of exogenous factors, independent of the graduation (HIV for instance in Botswana). For Samoa only two years have been taken into account after graduation.

Ferdi WP n°208 Drabo, A., and Guillaumont, P >> Graduation from the category of least developed countries … 38
Table 7: Relevant variables before and after graduation: 4 graduated countries compared with remaining LDCs
Country Botswana Cape Verde Maldives Samoa
Graduation year 1994 2007 2011 2014
Annual average per capita GDP
growth rate
five years before graduation (1) 3.41 7.70 5.93 -1.54
five years after graduation (2) 2.72 1.57 2.69 0.67
Difference for the graduated (3)=(2)-(1) -0.69 -6.13 -3.24 2.21
Remaining LDCs before graduation (4) -0.73 3.26 3.02 2.43
Remaining LDCs after graduation (5) 3.23 2.60 1.88 1.07
Difference for remaining LDCs (6)= (5)-(4) 3.96 -0.66 -1.14 -1.36
Double difference (7)= (3)-(6) -4.66 -5.48 -2.10 3.57
Average trade to GDP ratio
five years before graduation (1) 52.52 36.46 83.09 29.00
five years after graduation (2) 52.53 35.32 101.76 27.72
Difference for the graduated (3)=(2)-(1) 0.01 -1.14 18.68 -1.28
Remaining LDCs before graduation (4) 21.74 28.70 28.01 28.75
Remaining LDCs after graduation (5) 26.69 28.51 27.61 26.11
Difference for remaining LDCs (6)= (5)-(4) 4.95 -0.19 -0.40 -2.64
Double difference (7)= (3)-(6) -4.94 -0.95 19.08 1.36
Average ODA to GDP ratio
five years before graduation (1) 3.62 14.74 2.74 14.39
five years after graduation (2) 2.01 14.21 1.35 11.84
Difference for the graduated (3)=(2)-(1) -1.60 -0.53 -1.39 -2.55
Remaining LDCs before graduation (4) 22.23 14.79 15.31 12.12
Remaining LDCs after graduation (5) 18.54 14.31 12.99 13.28
Difference for remaining LDCs (6)= (5)-(4) -3.70 -0.48 -2.32 1.16
Double difference (7)= (3)-(6) 2.10 -0.05 0.93 -3.71
Average ODA and Other
Official capital inflows to GDP
ratio
five years before graduation (1) 3.69 14.81 3.45 14.51
five years after graduation (2) 1.69 16.03 0.65 11.92
Difference for the graduated (3)=(2)-(1) -2.00 1.23 -2.80 -2.59
The remaining LDCs before graduation (4) 22.35 15.06 15.27 12.26
The remaining LDCs after graduation (5) 18.59 14.49 13.07 13.33
Difference for the remaining LDCs (6)= (5)-(4) -3.77 -0.57 -2.20 1.07
Double difference (7)= (3)-(6) 1.76 1.79 -0.60 -3.66
Debt to GDP ratio
Five years before graduation 17.83 54.23 37.55
Three years before graduation 15.54 49.12 54.38 52.59
Just before graduation 15.96 38.35 39.45 56.2
Three years after graduation 12.92 53.62 32.22 57.48
Five years after graduation 11.11 71.06 27.45
For 2015 14.92 94.82 27.45 57.48
Source: authors calculation from various sources (OECD, United Nations)
Comparing the five year averages before and after graduation, the growth of GDP per capita has
increased after graduation for Samoa while it has decreased for Botswana, Cape Verde and Maldives
(for Samoa two year-period are used since it just graduated in early 2014). The decline in GDP growth
rates of Cape Verde, but not that of Maldives, might be due to the coincidence of the graduation

Ferdi WP n°208 Drabo, A., and Guillaumont, P >> Graduation from the category of least developed countries … 39
with global economic crisis in 2007,. When the difference is compared to the same difference during
the same period in remaining LDCs, only Samoa appears to have succeeded to keep its advance after
graduation, the three other countries showing a deterioration in their relative growth after
graduation. At the same time the double difference method applied in a so short period evidences
its limitation: growth rates are to be considered on long term period ( what is not possible in these
cases), even on long term growth the convergence process involves slowing down rates of growth,
and finally, as noted above, there may be specific exogenous factors acting in the caseof these few
countries.
The export of goods and services as a percentage of GDP, slightly decreased after graduation in Cape
Verde and Samoa, and remained constant in Botswana, while in Maldives it largely increased from
83% before to 102% after graduation. The fact that all the four countries had quite higher export
ratio than the average of the remaining LDCs should be kept in mind to interpret the results of the
double difference, negative for Botswana and Cape Verde, positive for Maldives and Samoa.
Let us now consider the ODA as percentage of GDP (as already done in chapter 3). It slightly
decreased in all the four countries after graduation. But it also decreased in other LDCs in the same
periods (except during the Samoa short period), so that the double difference gives positive results
for Botswana and Maldives, nil for Cape Verde (but negative for Samoa) Here again this method,
applied on a short periods and without taking into account other exogenous factors, with not really
conclusive. And on a longer term, a relative decline, if not too sharp, in the ODA to GDP ratio of
countries where the relative income per capita has increased is not a shortfall of graduation, And it
may be compensated by new sources of external finance. However when other official capital
inflows are added, the ratio comparison remains similar, except in Cape Verde where the ratio of
official capital inflows slightly increased after graduation.
The evolution of the debt to GDP ratio is consistent with these last findings. It shows decreasing
trends in Botswana and Maldives and increasing trends in Cape Verde and Samoa43. The Cape Verde
debt evolution is the most worrying. Its debt ratio, after decreasing from 54% five years before
graduation to 38% just before graduation, began after graduation to increase again, ( reaching more
than 70% five year after and about 95% in 2015 evidencing the use of non-concessional capital
inflows.
Graduated countries in longer perspective: have they achieved “structural transformation”?
For former LDCs, by definition, the most relevant structural transformation is the alleviation of the
structural handicaps that hamper their economic growth, so that growth becomes sustained, and
more broadly that development becomes sustainable. In that context the first indicators of strutural
transformation are given by the criteria of identification of LDCs. (see chapter 1). In this context, as
43 In Botswana, the debt level went from 17,8% of GDP five years before its graduation to 16% just before graduation and 11,1% five years after the graduation. But it went up last year and reach 14,9% in 2015, still a very moderate ratio. The government of Botswana willingness to reduce the debt level and rely on diamonds resources and the existence of the “Pula fund” are the main explanations. In Maldives, the debt level increased from 38% of GDP five years before graduation to 54 three years before graduation and kept decreasing since then reaching 39% just before graduation, 32% three years after and 27%five years after leaving the category. The Samoa post-graduation situation is to be analyzed with caution since it just leaves the LDC group in 2014 and we do not have enough time periods for assessment.

Ferdi WP n°208 Drabo, A., and Guillaumont, P >> Graduation from the category of least developed countries … 40
shown in Table 8, the results obtained by the last three graduated countries evidence a continous
progress, not only for the income per capita level, but also through their EVI and HAI position with
respect to the graduation threshold. A comparison with Botswana here is not relevant since the
evolution of this country can be observed on a quite longer period, featured by a rapid economic
growth in spite of a high vulnerability to HIV not linked to graduation.
To assess the evolution of graduated LDCs with regard to the LDC criteria, Table 8 shows the GDP (or
GNI) per capita and the gap with graduation threshold of EVI and HAI in the triennial reviews
following the graduation recommendation by CDP. It clearly appears that after the decision, all the
four countries kept improving the income level and the human capital relatively to graduation
threshold, criteria that allowed their graduation. However, they remain vulnerable since none of
them reached the graduation threshold many years after graduating from the category.
However the change in the levels of the three criteria-indcators may give a too narrow vision of the
structural transformation expected before and after the graduation,as it is underlined in the IPoA.
Let us then consider their graduation in a broader perspective.

Ferdi WP n°208 Drabo, A., and Guillaumont, P >> Graduation from the category of least developed countries … 41
Table 8: LDC criteria before and after graduation in the last three graduated countries
Cape
Verde
Year Maldives Year Samoa Year
GNI per capita When recommended for
graduation
1323 2003 1983 2003 1596 2006
first review after
graduation
1486 2006 2320 2006 2240 2009
Second review after
graduation
2180 2009 2940 2009 2880 2012
3010 2012 5473 2012 3319 2015
3595 2015 6645 2015
EVI absolute
gap with
graduation
threshold
When recommended for
graduation
22.54 2003 0.57 2003 26.65 2006
first review after
graduation
19.92 2006 12.51 2006 26.28 2009
Second review after
graduation
10.05 2009 20.18 2009 19.05 2012
3.17 2012 23.17 2012 11.9 2015
4.2 2015 17.5 2015
HAI absolute
gap with
graduation
threshold
When recommended for
graduation
11.02 2003 4.24 2003 26.41 2006
first review after
graduation
18.11 2006 17.94 2006 26.22 2009
Second review after
graduation
15.85 2009 21.53 2009 26.78 2012
20.78 2012 25.73 2012 28.4 2015
22.6 2015 25.3 2015
Source: drawn from various CDP reports
Regarding the origins of their graduation, Botswana graduation was one step in a long term
development strategy implemented with a prudent economic policy. Since the independence of the
country in 1966, policy makers adopted and implemented the National Development Plan (NDP)
later reinforced by in 1996 by the “Vision 2016 - Prosperity for All”. These plans provide the
development strategies and programme to be implemented in the short, middle and long term
guided by the principles of democracy, development, dignity, and discipline (IST-Africa, 2011). The
leadership of national policy makers allowed the improvement of trade competitiveness, a good
management and development of the mining sector, performance in monetary management, fiscal
sector, and unemployment reduction. The Dutch disease was avoided in Botswana thanks to good

Ferdi WP n°208 Drabo, A., and Guillaumont, P >> Graduation from the category of least developed countries … 42
exchange rate policies sustaining the trading sectors44. The country invested the resources
generated by mineral sector and other economic activities in growth promotion, human
development, infrastructure building. In spite of the huge HIV shock, this country seems to be now
far away from the LDCs features.
Cape Verde graduated from the category in 2007 taking advantage of external resources and tourism.
The graduation of Cape Verde was facilitated by capital inflows from various sources. These
resources help the country to address some of its impediments: institutions and infrastructures. The
long term national development strategies promoting economic transformation and poverty
reduction since 1990 focused on adequate environment to maximize the impacts of ODA and
remittances through state modernization in public financial and macroeconomic management
among others. These policies coupled with infrastructural development financed essentially by ODA
not only increased economic growth and employment, but also encouraged remittances and foreign
capital inflows, causing a debt issue. Moreover, the long term development vision operationalized
through Growth and Poverty Reduction Strategies (GPRS) puts the services sector at the core of the
development strategies. The competitiveness of the country’s tourist sector due to its integration
into global economy with the accession to WTO in 1999 led services sector to be the driver of
economic growth and development (70 per cent of GDP in 2007). The geographical location at the
crossroad of different continents and the large coastline provide to Cape Verde a natural advantage
for fisheries and tourism. This country seems to have moved out of the low income trap.
The graduation of Maldives has been possible thanks to the development of its world-class tourism
sector and a robust fisheries industry. Indeed, since the 1980’s the country has largely invested in
effective tourism infrastructures raising the contribution of tourism to more than two third of the
GDP in 2013. The government also encourage foreign private sector through incentives and
strategies. Regarding the fishing sector, the country implemented since the 1990 policies leading to
the modernization of this traditional leader of its economy. The effect of tourism and fishing on the
economy was reinforced by prudent macroeconomic policy, and effective investment in social
sectors. With respect to current indicators, Maldives seems to have overcome the traditional
impediments to growth, reaching a leel of income pc three times the low income threshold. But as
underlined the graduation process and here again, it is still a country highly vulnerable to climate
change.
Diversification of agricultural sector and tourism promotion are the main policies that partly allowed
the graduation of Samoa. Samoa’s economy is mainly based on agricultural production (cacao,
coconut, banana, fishand crayfish, among others) and processing as well as tourism and
remittances.To boost agricultural production, which is the sector employing the majority of
Samoans, the government implemented agricultural diversification strategies by encouraging the
combination of production for local consumption and commercial investment in high-value crops,
and encouraging their processing. By promoting the Samoan culture and traditions, by constructing
infrastructures and by encouraging foreign and domestic investments, the government of Samoa
44 As part of the diamonds revenue utilization Botswana has established a pooled fund called “the Pula fund” a type of sovereign fund that keep the country floating during difficult times and help avoid foreign debt and protect the next generation from indebtedness by sharing diamonds revenue with future generations
Ferdi WP n°208 Drabo, A., and Guillaumont, P >> Graduation from the category of least developed countries … 43
succeeded to develop the tourism sector and to place it as an important factor of the success of its
graduation. But, as Maldives, it is still vulnerable to climate change.
Is the next step of the development of these countries after graduation is to reach “industrial
economy” status? These countries have some common features regarding their development
opportunities, dominated by their small size. All of them successfully invested in human capital and
infrastructures with encouraging effects on the services sector.
Indeed, graduated countries evidence many differences. Even though tourism is a common
important resource for development of each of them, it is not to the same extent. It is the main source
of resource in Cape Verde and Maldives, but is largely dominated by mining in Botswana and by
agriculture in Samoa. But the contribution of the manufacturing sector to the GDP remains low in
these graduated countries and the diversification of the narrow economic base is a main challenge.
The heavy concentration on tourism of Cape Verde, Maldives and even Samoa (along with
agriculture in this country) exposes them to external shocks. These threecountries are thus highly
dependent on the economic prospects in developed countries, climatic shocks, as Botswana is
dependent on the fluctuation of commodity prices, especially diamonds, and the emergence of
artificial diamonds.
Then the structural transformation in these countries will rely on (or be reinforced by) their capacity
to adopt and implement appropriate policies to face exogenous shocks, external or natural, in
particular countracyclical policies, supported by international community.
The international support to smooth transition
There are several ways by which the international community can facilitate the transition out of the
LDC category.
First for the matters where a preference is given to LDCs in practice without any rule, the preferential
practice may be continued. It is roughly what has been observed above for ODA, a support all the
more easy that the graduated country is of small size, as the graduated countries have been.
Second some support measures of binary nature, explicitely limited to LDCs, may be officially
maintained some time after the graduation. Main present examples are: the 3 year postponement of
the end of EBA offered by EU after graduation; a similar kind of postponement of the access to the
UN CDF, GEF LDCF and to EIF. This way to maintain some benefits of the LDCstatus may be general
(valid for all graduated LDCs, as in the examples given just above) or taken on a case by case basis
(as it is for the preference given to LDC on a purely practical basis, ie without rules). Anyway
postponement can only be transitory, without what graduation would loose its meaning.
Moreover for all non-binary support measures, those which can be applied on a continuous basis,
such as the allocation of ODA, the use of the criteria of identification of the LDCs (income per capita,
HAI and EVI) is a consistent way to make the transition smoother (as we suggested in Guillaumont,
2009, 2013). In particular it allows to take into account the remaining vulnerability of most of the
graduated or graduating countries. This was explicitely recommended by the UN General Assembly
in its Resolution A/RES/67/221 adopted in December 2012. And significantly it has been
Ferdi WP n°208 Drabo, A., and Guillaumont, P >> Graduation from the category of least developed countries … 44
implemented by the EU which retained these three criteria among the four used in the allocation
model used for present EDF and DCI.
If this principle is extended for taking into account the vulnerability to climate change in the
allocation of aid and concessional resources for adaptatation, it will be a major contribution to the
graduation of small islands and other vulnerable LDCs. The countries vulnerable to climate change,
either graduated LDCs or not, require an appropriate kind of support.
5. Conclusion
The category of the LDCs had been created to help these countries to develop more quickly, so that
they will be once able to leave the category. Actually the graduation of the LDCs has been
successively forgotten, feared, and desired. During the first 20 years of the category, from 1971 to
1991, no rule had been set up for that purpose. During the following 20 years, the graduation has
been mainly considered by the countries concerned as a risk the occurrence of which was to be
postponed. In 2011 when the 4th UN conference on LDCs met in Istanbul, the graduation became a
goal for 2020, ambitious, although unreachable as it was designed in the IPoA.
The graduation of the LDCs has indeed been slow and recent. This had been the result of two main
factors, besides the resistance of the countries concerned. One has been the long-lasting growth lag
of LDCs, as evidenced in chapter I, reversed to some extent since the mid-1990s. The other and more
important one has been the strong asymmetry between the inclusion and graduation criteria. To
avoid any risk of reversibility, precautionary conditions had been set up before an LDC be
recommended for graduation by the CDP (criteria to be met not only at one, but at two successive
triennial reviews, margins set up between the inclusion and graduation thresholds of the criteria
indicators, and, a major asymmetry, two criteria to cease to be met, while three complementary
criteria were to be met for inclusion). Moreover an additional three year period was set up after the
graduation has been decided before it becomes effective. As a result, in 2018, 31 out of the 47 LDCs
were no longer meeting the inclusion criteria without being graduated (i.e. only 16 out of the 47
LDCs still met the inclusion criteria). Moreover, while the goal of the IPoA was that half of the 48 LDCs
will be able to meet the graduation criteria in 2020, they will be around one fifth: They will include 2
countries which are already graduated (Samoa, Equatorial Guinea), 2 countries the graduation of
which has already been decided (Vanuatu for 2020, and Angola for 2021), possibly 5 countries
already recommended for graduation by the CDP and waiting for the ECOSOC endorsement and the
General Assembly decision (Tuvalu, Kiribati, Bhutan, Sao Tome and Principe and Solomon Islands).
To be noted, most of the countries graduated, recommended for graduation, or likely to be so, from
2007 to 2020, are SIDS (9 out of 14), all still vulnerable countries..
This asymmetry between inclusion and graduation criteria has weakened the consistency of the
category and calls for an adaptation of the criteria both for graduation and inclusion. Several
proposals have been presented in the chapter, the simplest relying on an identification of the LDCs
from two instead of three criteria, with the EVI and HAI criteria merged in a structural handicaps index
(SHI). This index could be designed so that it would still reflect the interaction between the two kinds

Ferdi WP n°208 Drabo, A., and Guillaumont, P >> Graduation from the category of least developed countries … 45
of structural handicaps. Anyway it would allow each of them to be taken into account. A structural
handicaps index could be used both for inclusion and graduation or only for graduation.
The various studies conducted before or after the graduation and reviewed in this chapter do not
show a significant negative impact of graduation on the few graduated countries. They do not show
them being at risk to fall back in the category. They neither evidence a slowing down of the pace of
development having led them to graduation, in spite of a significant remaining vulnerability.
Should this appear as a paradox? All the previous chapters of this book tried to show the positive
impact that the LDC membership has or could have on the development of the member countries
through the broad set of special measures. It does not follow that the exit from the category would
have a symmetrical negative impact. Indeed the argument is not reversible. The impact of the special
support measures is probably all the higher that the country is “least” developed, in other words far
from graduation, then most in need of these measures. Moreover the smooth transition strategy has
led to dampen the change of status, by various means, including postponement of the end of some
special measures or access to new sources of finance. The international context, that have facilitated
the exit from the category, has probably also made easier the transition. It can of course change in
the future under the effect various exogenous shocks, in particular in the price of commodities.
Beyond this risk, the graduation, by, involving a mitigation of the structural handicaps featuring the
LDC category (in the case of the few graduated countries, diminishing poverty and human capital
improvement), also involves some structural transformation of the economy likely to make its
development sustainable.
The rather limited number of graduations in the period covered by the IPoA should still be an
incentive to implement and reinforce the support measures progressively adopted and agreed upon
in Istanbul. These measures are not only for the possibly graduating countries, but for all LDCs. The
major present issue is not the impact of being graduated from the list of the LDCs, it still is the impact
of being included into the list.

Ferdi WP n°208 Drabo, A., and Guillaumont, P >> Graduation from the category of least developed countries … 46
References
Bhattacharya D. and L. Borgatti, L. (2012) “An Atypical Approach to Graduation from the LDC Category: The Case of Bangladesh”, South Asia Economic Journal, 13(I)1-25
Cariolle, J., Goujon, M., and Guillaumont, P. (2015) "Has Structural Economic Vulnerability Decreased in Least Developed Countries? Lessons Drawn from Retrospective Indices", The Journal of Development Studies. DOI: 10.1080/00220388.2015.1098631
Cariolle, J. and Guillaumont, P. (2011). A retrospective Economic Vulnerability Index: 2010 update. FERDI Working Paper No I. 09
Committee for Development Policy (CDP) and United Nations Department of Economic and Social Affairs (UNDESA), (2008). Handbook on the Least Developed Country Category: Inclusion, Graduation and Special Support Measures, United Nations publication, Sales No. E.07.II.A.9.
Committee for Development Planning (CDP), (1997). Report on the thirty-first session, E/1997/35, Supplement No. 15, United Nations Department of Economic and Social Affairs (UNDESA), New York
Committee for Development Policy (CDP), (2000). Report on the second session, E/2000/33, Supplement No. 13, United Nations Department of Economic and Social Affairs (UNDESA), New York
Committee for Development Policy (CDP), (2003). Report on the fifth session, E/2003/33, Supplement No. 13, United Nations Department of Economic and Social Affairs (UNDESA), New York
Committee for Development Policy (CDP), (2005) Report on the seventh session, E/2005/33, Supplement No. 13, United Nations Economic and Social Affairs (UNDESA), New York"
Committee for Development Policy (CDP), (2006). Report on the eighth session, E/2006/33, Supplement No. 13, United Nations Department of Economic and Social Affairs (UNDESA), New York
Committee for Development Policy (CDP), (2009). Report on the eleventh session, E/2009/33, Supplement No. 13, United Nations Department of Economic and Social Affairs (UNDESA), New York
Committee for Development Policy (CDP), (2011). Report on the fourteenth session, E/2011/33, Supplement No. 13 United Nations Department of Economic and Social Affairs (UNDESA), New York
Committee for Development Policy (CDP), (2012). Report on the fourteenth session, E/2012/33, Supplement No. 13 United Nations Department of Economic and Social Affairs (UNDESA), New York
Committee for Development Policy (CDP), (2015). Report on the seventeenth session, E/2015/33, Supplement No. 13 United Nations Department of Economic and Social Affairs (UNDESA), New York
Drabo, A. and Guillaumont, P. (2014). "Assessing the Prospects of Accelerated Graduation of the Least Developed Countries". FERDI, working paper P72, January 2014
Guillaumont, P. (2009a). Caught in a trap: Identifying the least developed countries, Economica.
Guillaumont, P. (2009b). « An Economic Vulnerability Index : Its Design and Use for International Development Policy », Oxford Development Studies,37 (3), 193-228

Ferdi WP n°208 Drabo, A., and Guillaumont, P >> Graduation from the category of least developed countries … 47
Guillaumont, P. (2011). « The concept of structural economic vulnerability and its relevance for the identification of the Least Developed Countries and other purposes (nature, measurement and evolution) “ CDP Background Papers Series, ST/ESA/2011/CDP/12, and FERDI Policy Brief, B 19, March
Guillaumont, P. (2013).”Measuring Structural Vulnerability to Allocate Development Assistance and Adaptation Resources”, Ferdi Working Paper, 68, (revised), July
Guillaumont, P. (2014). "A necessary small revision to the EVI to make it more balanced and equitable" FERDI, Policy brief B98, July 2014
Guillaumont P. (2017). Vulnerability and Resilience: A Conceptual Framework applied to Three Asian Poor Countries— Bhutan, Maldives and Nepal, ADB South Asia Working Paper Series, No 53, October, Asian Development Bank, 76p.
Guillaumont, P. (ed.) (forthcoming), Out of the trap. Supporting the least developed countries, Economica.
Korachais K. (2011). Human Assets Index Computing retrospective series from 1970 to 2008. FERDI Working Paper, Development Indicators 10 July 2011.
United Nations (2011). Fourth United Nations Conference on the Least Developed Countries: Programme of Action for the Least Developed Countries for the Decade 2011-2020, Istanbul, Turkey, No A/CONF.219/3.
United Nations Conference on Trade and Development (2013), The Least Developed Countries Report 2013: Growth with employment for inclusive and sustainable development. United Nations, New York and Geneva.
United Nations General Assembly (2010). General Assembly resolution (A/RES/64/295) on Extension of the transition period preceding the graduation of Samoa from least developed country status.
United Nations General Assembly (2012). General Assembly resolution (A/C.2/67/L.51) on Smooth transition for countries graduating from the list of least developed countries.
United Nations General Assembly (2012). General Assembly resolution (A/C.2/67/L.53) on Groups of countries in special situations: follow-up to the Fourth United Nations Conference on the Least Developed Countries.
United Nations General Assembly (2012). General Assembly (A/67/92): Report of the ad hoc working group to further study and strengthen the smooth transition process for the countries graduating from the least developed country category

Ferdi WP n°208 Drabo, A., and Guillaumont, P >> Graduation from the category of least developed countries … 48
Annex 1: Positions of LDCs with regard to EVI 2012 and EVI 2006 both calculated
according to 2006 method
Annex 2: Some country evolutions with regard to the set of criteria
It is possible to present for each country on a graph its position with respect to the graduation and
inclusion thresholds over the last seven triennial reviews.45 For each country, and each criterion
indicator, we transform its value into the relative deviation with respect to the inclusion threshold as
follows:
100*( )Re it t
itt
absoluteX inclusionlativeX
inclusion
Where RelativeXit and absoluteXit are respectively the relative and absolute value of variable X (EVI,
HAI or per capita GNI country level value, inclusion and graduation thresholds) of LDC i at time t (2000, 2003, 2006, 2009, 2012, 2015 or 2018). Here “inclusion” represents the inclusion threshold of
the indicator considered. Since an increase in the index is an improvement for HAI and the reverse
for EVI46, the difference (100 – EVI) is instead used with regard to this criterion to make easier the
interpretation. Thus, all inclusion thresholds are represented on a horizontal line at zero on the
45 This exercise is close to, graphs set up at UNCTAD and recently updated (2013, forthcoming),. but slightly different from them since here all the indicator values are presented on the same graph, normalized with respect to the inclusion thresholds…and expressed in the same direction.
46 See footnote 1 above for the definition of HAI and EVI
AFG
AGO
BDI
BEN
BFA
BGD
BTN
CAF
COM
DJI
ERI
ETHGIN
GMB
GNB
GNQHTIKHM
KIR
LAO
LBR
LSO
MDGMLIMMR
MOZMRT
MWI
NER
NPL
RWA
SDN
SEN
SLB
SLE
SOMSTPTCD
TGO
TMP
TVU
TZA
UGA
VUT
YEM
ZAR
ZMB
20
40
60
80
100
EV
I 201
2 w
ith 2
009
me
thod
20 40 60 80 100EVI 2006
Incl
usio
n 20
00
Gra
duat
ion
2000
Inclusion 2012
Graduation 2012
45-degree line
Graduation
2012 with
2009 method

Ferdi WP n°208 Drabo, A., and Guillaumont, P >> Graduation from the category of least developed countries … 49
vertical scale: a country does not fulfill the inclusion criterion if its relative value is below this line. All
the graduation thresholds before 2003 are represented by a horizontal line scaled at 15 (since before
2003 the margin between the inclusion and graduation thresholds was 15% for all three criteria),
while from 2003 the horizontal line representing the graduation thresholds of EVI and HAI is 10, and
that of per capita GNI is 20 (according to the respective margins of 10% and 20% applied from this
time). The country meets the graduation criterion if its relative value is above the horizontal line
representing the graduation threshold. Similarly, the horizontal line scaled at 140 is the graduation
threshold applied with the income-only rule (according to which, countries reaching 2.4 times the
per capita GNI inclusion threshold may be considered as eligible for graduation). All the per capita
GNI above 140 are brought back to 140 to make the graph readable, meaning that above 140, the
graph does not indicate actual scores.
The evolution of EVI is indeed affected by the changes in the index definition: an example is given
by the Bangladesh where for 2012 we can observe seemingly an increase of vulnerability on its graph
as well as a decrease of the positive deviation of EVI from the graduation threshold clearly due to the
change in the EVI definition (see Box 3).
The detailed country results obtained from this exercise, here illustrated by only three graphs47, each
of which representing a pattern of trends towards graduation. Graphs are given here for:
Bhutan on graph 2.1 Annex 2: positive trend with regard to GNI per capita and HAI criteria
(similar trends found for Cambodia, Kiribati, Lesotho, Solomon Islands, Tuvalu, Vanuatu and
Yemen)
Benin on graph 2.2 Annex 2: positive trend with regard to GNI per capita and EVI-
Bangladesh on graph 2.3 Annex 2: positive trend with regard to EVI and HAI criteria (similar
trends found for Nepal)
A positive trend with respect to the three criteria is also found for Lao PDR, Sao Tome and Principe
and Senegal.
To be underlined, the shape and interpretation of these trends have been modified in 2015 with the
new design of the threshold values for EVI and HAI, since this design is intended to make the
thresholds no longer relative, but absolute. From 2012 to 2018 the evolution no longer represents a
change in the distance to a quartile value (depending from the distribution of the indicator values
within a reference group of countries), but in the distance to the value of the quartile in 2012
maintained constant.
Indeed the impact of these trends for the likelihood to graduate depends on the level already
reached. A positive trend gives a relevant indication of this likelihood if the country is already close
to the graduation threshold for the criterion considered. It then leads us to come back to the results
of the beginning of this section. Few LDCs are both close to two graduation thresholds and
evidencing positive trends towards them, in spite of the upward move of 2015 due to the change in
the design of the thresholds. There are still many LDCs which, even if they are close to one graduation
47other ones are available upon request

Ferdi WP n°208 Drabo, A., and Guillaumont, P >> Graduation from the category of least developed countries … 50
threshold, remain far from the two other ones (in particular countries rather close to the EVI one and
far from the HAI and the income ones).
Because GNIpc and HAI are more closely correlated than GNIpc and EVI, the association between the
income and HAI criteria has led the major number of eligibilities to graduation. Double graduation
criteria have mainly been met by countries benefitting of a relatively high level of human capital,
which in turn has supported their economic growth, exceptions being provided by three oil
exporters LDCs.
Graph 2.1: Relative evolution of Bhutan’s position with respect to the graduation and inclusion
thresholds over the six last triennial reviews
-100
-60
-20
20
60
100
140
2000 2003 2006 2009 2012 2015 2018year
inclusion threshold EVI
2000 graduation threshold HAIGNI graduation threshold GNI per capitaEVI and HAI graduation threshold
Bhutan

Ferdi WP n°208 Drabo, A., and Guillaumont, P >> Graduation from the category of least developed countries … 51
Graph 2.2: Relative evolution of Benin’s position with respect to the graduation and inclusion
thresholds over the six last triennial reviews
Graph 2.3: Relative evolution of Bangladesh’s position with respect to the graduation and inclusion
thresholds over the six last triennial reviews
-100
-60
-20
20
60
100
140
2000 2003 2006 2009 2012 2015 2018year
inclusion threshold EVI
2000 graduation threshold HAIGNI graduation threshold GNI per capitaEVI and HAI graduation threshold
Benin-1
00-6
0-2
020
60
100
140
2000 2003 2006 2009 2012 2015 2018year
inclusion threshold EVI
2000 graduation threshold HAIGNI graduation threshold GNI per capitaEVI and HAI graduation threshold
Bangladesh

Ferdi WP n°208 Drabo, A., and Guillaumont, P >> Graduation from the category of least developed countries … 52
Annex 3: The issue raised by the reference group and how it could have been addressed
Before 2015 the LDCs likelihood of meeting a relative graduation criterion depended on the size of the
reference group and on the location of the threshold set up to identify LDCs. The reference group had
traditionally included all LDCs and other LICs and the threshold for inclusion had traditionally been put
at the (better) quartile of the reference group. The higher the number of (low income) countries of the
reference group which were not LDCs (but had relatively good EVI or HAI indices), the lower was the
probability for an LDC to be in the better quartile.
More and more former non-LDC LICs have become MICs since 200048. As a consequence, the reference
group had been shrinking over time (from a maximum of 67 in 2000 to a minimum of 60 in 2009 and
2012)49, making the attainment of the graduation threshold easier. If there were no longer LICs non LDCs,
the reference group would have become the group of LDCs itself. Then, with around one quarter not
reaching the inclusion threshold, a proportion a little smaller (due to the margin between inclusion and
graduation thresholds), but still significant would have necessarily reached the graduation threshold
whatever the evolution of HAI and EVI for the whole set of countries. With graduation occurring, it would
correspond to a renewed set of LDCs, resulting in an endogenous process of graduation, whatever the
rate of improvement in the indicators on which HAI and EVI rely50.
Indeed it was not logical that, with the reduction of the number of non-LDC LICs, the reference group was
reduced to the only group of LDCs, designed as the poor countries suffering the most from structural
handicaps. The purpose of the category from its beginning was a differentiation between LDCs and other
developing countries. For this reason, at the 2012 review, where there were only three non LDC-LICs
(Zimbabwe, DPR Korea, Kenya), the CDP extended the design of the group. The reference group has then
included all the LDCs and “all other developing countries whose per capita income in any of the three
years used to determine average incomes (i.e. 2008-2010) was less than 20 per cent above the low-income
threshold determined by the Word Bank” (CDP, 2012). This extension led to the inclusion of nine additional
countries, without which the reference group (according to its previous definition) would have fallen to
51 (instead of 60 in 2009), and made the probability to attain the relative graduation criteria higher, as
explained above51.
Retaining in 2015 and in 2018 the same principle as in 2012 for the extension of the reference group would
have not avoided the reference group to shrink on52. The reference group could have been and still could
48 And more LDCs have become MICs as well
49 After been expanding from the 1991 first triennial review, where the number was only 58, to the year 2000. It was 65 for the 2003 and 2006 reviews (cf Guillaumont, 2009a, p 54), 60 in 2009..
50 More precisely for the countries in the better quartile of the distribution
51 The quartile rule applied to a reference group of 51 countries, would have led Bangladesh to meet the EVI graduation criterion and Solomon Islands to meet the HAI graduation criterion, but not to make them eligible since not meeting another graduation criterion. In 2015, still with the definition of the reference group prevailing until 2009, the reference group would have become even smaller (50) due to the graduation of Samoa..
52 since in 2015 six of the nine countries added in 2012 would have crossed the line located 20 per cent above the low-income threshold (India, Vietnam, Ghana, Nicaragua, PNG, Nigeria), reducing the group to no more than 54 countries

Ferdi WP n°208 Drabo, A., and Guillaumont, P >> Graduation from the category of least developed countries … 53
be revised by several simple ways, consistent with previous practice and rationale of relative criteria of
handicaps. The most pragmatic way would be to include in the reference group all LDCs and the number
of other developing countries, ranked by increasing order of income per capita, which are needed to reach
60 or 64, the approximate number of the reviews until 2012. Another and more logical way would be to
consider all LDCs plus other countries with a GNIpc lower than the income only criterion of graduation
(2.4 times the low income threshold used as inclusion criterion, what would have given 65 countries in
2015 and 63 in 2018). Whatever the choice, with the quartile rule applied to a reference group of 64 to 65,
the three countries Bhutan, Nepal, Solomon Islands would not have met the HAI graduation threshold in
2015 and 2018 and would not have been eligible.
Annex 4: The resistance to graduation from the LDC category over a quarter of century:
Its dampening during the last decade
The application of graduation rules have been influenced by the resistance of some LDCs fearing the loss of
the benefits linked to to the LDC status. Early after the adoption of graduation rules, the CDP did not
recommend the graduation of some countries fulfilling the criteria because of this fear and a lack of clear
assessment of the situation. This was the case for Samoa in 1991, Cape Verde in 1994 and Myanmar in 1997
for an “artificial” GDP expansion (due to increasing aid flows and real exchange rate appreciation), and Cape
Verde in 2000 because of the high vulnerability. Maldives was indeed recommended for graduation in 2000
by the CDP, but the ECOSOC requested the CDP to re-examine its recommendation to graduate Maldives at
the 2003 review: Maldives had sent letters of the to the President of the ECOSOCl in 1999, 2000, and 2001,
explaining that the level of human development has been overestimated and the vulnerability
underestimated. Vanuatu was recommended by the CDP for graduation in 1997, recommendation endorsed
by the ECOSOC, but not accepted by the GA because of the high vulnerability of this country, which had
expressed its opposition to the graduation through a letter to the president of the ECOSOC (requesting him
to defer the review by the Committee of the status of Vanuatu as a least developed country until the year
2000).
The history of graduations presented at the beginning of this document reflects the resistance to
graduation of the majority of countries concerned. Significant lags and posponments have been observed
in the case of Samoa, The Maldives, Equatorial Guinea, Vanuatu, between the finding that country was
meeting the criteria and the final decision. And the cases of Tuvalu and Kiribati, each by its own way, still
evidence resistance to graduation in spite of the new context of the IPoA. The vulnerability profile and the
ex-ante assessment were supposed to provide evidences guiding the choice at the different steps of the
graduation decision.(CDP, ECOSOC and GA), and possibly reduce the complains of graduating LDCs..
The adoption and implementation of smooth transition resolutions in 2004 and 2012, bringing
monitoring after endorsement of the graduation decision seems to have provided more confidence to
LDCs regarding their exit from the category.). It also amplified the focus of the development community
on the acceleration of graduation.

Ferdi WP n°208 Drabo, A., and Guillaumont, P >> Graduation from the category of least developed countries … 54
From 1991 to the middle of the 2000 decade, only one country graduated from the category according to
the rule prevailing at the time, namely Botswana in December 1994. From the adoption the smooth
transition resolutions, graduation accelerated: three countries exited the category: Cape Verde in 2007,
Maldives in 2011, Samoa in 2014, and Equatorial Guinea53 in 2017. The graduation has been decided for
other two LDCs: Vanuatu and Angola.
At the 2012 triennial review Tuvalu and Vanuatu were found eligible for the third consecutive time and
only then recommended for graduation from the list by the CDP. The ECOSOC has postponed three times
the consideration of the recommenendation for Tuvalu, in 2012, 2013 and 2015; at the 201review in 2015,
the CDP reiterated that Tuvalu was eligible to graduation, but has no longer recommended it. As for the
2012 recommendation to graduate Vanuatu’, it was endorsed by ECOSOC, but took some time to be taken
into consideration by the General Assembly. Vanuatu requested a postponement on the basis of climatic
circumstances, as was previously obtained by Maldives and Samoa, on the basis of a tsunami. A shorter
postponement by one year called “additional preparatory period on an exceptional basis” was in
December 2013 retained by the General Assembly, at the same time as for Equatorial Guinea to which an
“additional preparatory period of six months has also been given “on an exceptional basis”, without any
explicit reason. It then made Vanuatu graduation expected at the end of 2017 (and that of Equatorial
Guinea at the mid of 2017). But giving consideration to the huge damage for Vanuatu resulting from the
Cyclone Pam in March 2015, the General Assembly adopted in December 2015 a new Resolution
extending “the preparatory period preceding the graduation” of this country by an additional period of
three years, until 4 December 2020 (A/RES/70/78).
At the 2012 review, Angola and Kiribati were also found to meet the eligibility criteria for graduation for
the first time, and for a second time at the 2015 review. But only Angola has been recommended for
graduation (CDP , 2012, 2015), and the GA decided its graduation to be effective in 2021. Kiribati has
finally be recommended by the CDP for graduation for in 2018…with the wish of the creation of a
category of countries facing extreme vulnerability to climate change.
Finally the ex ante assessments and monitoring exercises, by bringing information and flexibility in the
process of graduation on a regular basis, may have both contributed to dampen the resistance to
graduate of the countries concerned…and to regulate the pace of actual graduation.
53 The graduation of Equatorial Guinea, recommended by the CDP in March 2009 and agreed by the Economic and Social Council in July 2009 (Resolution 2009/35), has been waiting the decision by the General Assembly for an unusually long time, being repeatedly considered as imminent: after having been agreed upon at the end of May 2013 (A/67/L.XX, compilation text agreed ad ref, based on A/67//L.31), the adoption of that resolution has itself be postponed to September 2013 at the request of concerned country, then the resolution has been adopted on 4th December 2013 (A/RES/68/18).

Ferdi WP n°208 Drabo, A., and Guillaumont, P >> Graduation from the category of least developed countries … 55
Annex 5: Ranking of LDCs, graduated LDCs and reference group according to the Least
Development Index (Quadratic average of 100-HAI, 100-normalised GNI and EVI)
country LDI rank country LDI rank
Somalia 1 Lesotho 34
Central African Republic 2 Timor-Leste 35
Gambia 3 Zambia 36
Sierra Leone 4 Côte D'Ivoire* 37
Chad 5 Solomon Islands 38
Burundi 6 Nepal 39
Liberia 7 Cambodia 40
South Sudan 8 Democratic People's Republic of Korea* 41
Niger 9 Nigeria* 42
Guinea-Bissau 10 Djibouti 43
Malawi 11 Pakistan* 44
Eritrea 12 Myanmar 45
Democratic Republic of the Congo 13 Ghana* 46
Burkina Faso 14 Kenya* 47
Mozambique 15 Angola 48
Guinea 16 Papua New Guinea* 49
Zimbabwe* 17 Cameroon* 50
Afghanistan 18 Sao Tome and Principe 51
Mali 19 Bangladesh 52
Madagascar 20 Vanuatu 53
Ethiopia 21 Lao People’s Democratic Republic 54
Comoros 22 Tuvalu 55
Uganda 23 Bhutan 56
Rwanda 24 India* 57
Haiti 25 Nicaragua* 58
Mauritania 26 Viet Nam* 59
Benin 27 Botswana** 60
Sudan 28 Maldives** 61
Kiribati 29 Cabo Verde** 62
Togo 30 Bolivia (Plurinational State of)* 63
Yemen 31 Samoa** 64
Senegal 32 Equatorial Guinea** 65
United Republic of Tanzania 33
Note: ** Graduated LDC, * Non-LDC


“Sur quoi la fondera-t-il l’économie du monde qu’il veut gouverner? Sera-ce sur le caprice de chaque particulier? Quelle confusion! Sera-ce sur la justice? Il l’ignore.”
Pascal

“Sur quoi la fondera-t-il l’économie du monde qu’il veut gouverner? Sera-ce sur le caprice de chaque particulier? Quelle confusion! Sera-ce sur la justice? Il l’ignore.”
Pascal
Created in 2003 , the Fondation pour les études et
recherches sur le développement international aims to promote a fuller understanding of international economic development and the factors that infl uence it.
Contact
[email protected]+33 (0)4 73 17 75 30