Gourmet Master Co. Ltd. and Subsidiaries · - 1 - INDEPENDENT ACCOUNTANTS’ REVIEW REPORT The...
51
Gourmet Master Co. Ltd. and Subsidiaries Consolidated Financial Statements for the Nine Months Ended September 30, 2013 and 2012 and Independent Accountants’ Review Report
Transcript of Gourmet Master Co. Ltd. and Subsidiaries · - 1 - INDEPENDENT ACCOUNTANTS’ REVIEW REPORT The...

Gourmet Master Co. Ltd. and Subsidiaries Consolidated Financial Statements for the Nine Months Ended September 30, 2013 and 2012 and Independent Accountants’ Review Report

- 1 -
INDEPENDENT ACCOUNTANTS’ REVIEW REPORT
The Board of Directors and Stockholders
Gourmet Master Co. Ltd.
We have reviewed the accompanying consolidated balance sheets of Gourmet Master Co. Ltd. (the “Company”)
and its subsidiaries (collectively referred to as the “Group”) as of September 30, 2013, December 31, 2012,
September 30, 2012 and January 1, 2012 and the related consolidated statements of comprehensive income for
the three months ended September 30, 2013 and 2012, nine months ended September 30, 2013 and 2012, and
changes in equity and cash flows for the nine months ended September 30, 2013 and 2012. These consolidated
financial statements are the responsibility of the Company’s management. Our responsibility is to issue a
report on these consolidated financial statements based on our reviews.
We conducted our reviews in accordance with Statement of Auditing Standards No. 36 “Engagements to
Review Financial Statements” issued by the Auditing Standards Committee of the Accounting Research and
Development Foundation of the Republic of China. A review consists principally of applying analytical
procedures to financial data and of making inquiries of persons responsible for financial and accounting matters.
It is substantially less in scope than an audit conducted in accordance with auditing standards generally accepted
in the Republic of China, the objective of which is the expression of an opinion regarding the consolidated
financial statements taken as a whole. Accordingly, we do not express such an opinion.
Based on our reviews, we are not aware of any material modifications that should be made to the consolidated
financial statements referred to above for them to be in conformity with the Regulations Governing the
Preparation of Financial Reports by Securities Issuers issued by the Financial Supervisory Commission of the
Republic of China, and International Financial Reporting Standard 1 “First-time Adoption of International
Financial Reporting Standards” and International Accounting Standard 34 “Interim Financial Reporting”
endorsed by the Financial Supervisory Commission of the Republic of China.
November 6, 2013
Notice to Readers
The accompanying consolidated financial statements are intended only to present the consolidated financial
position, financial performance and cash flows in accordance with accounting principles and practices
generally accepted in the Republic of China and not those of any other jurisdictions. The standards,
procedures and practices to review such consolidated financial statements are those generally applied in the
Republic of China.
For the convenience of readers, the independent accountants’ review report and the accompanying consolidated
financial statements have been translated into English from the original Chinese version prepared and used in
the Republic of China. If there is any conflict between the English version and the original Chinese version or
any difference in the interpretation of the two versions, the Chinese-language independent accountants’ review
report and consolidated financial statements shall prevail.

- 2 -
GOURMET MASTER CO. LTD. AND SUBSIDIARIES
CONSOLIDATED BALANCE SHEETS
(In Thousands of New Taiwan Dollars)
(Reviewed, Not Audited)
September 30, 2013 December 31, 2012 September 30, 2012 January 1, 2012 September 30, 2013 December 31, 2012 September 30, 2012 January 1, 2012
ASSETS Amount % Amount % Amount % Amount % LIABILITIES AND EQUITY Amount % Amount % Amount % Amount %
CURRENT ASSETS CURRENT LIABILITIES
Cash and cash equivalents (Notes 4 and 6) $ 2,550,379 29 $ 2,541,543 30 $ 3,120,999 37 $ 3,477,523 44 Notes payable $ 221 - $ 1,204 - $ - - $ 19 -
Financial assets at fair value through Trade payables (Note 14) 769,424 9 744,974 9 824,245 10 755,147 9 profit or loss - current (Note 4) 8,393 - 9,202 - 9,339 - 9,376 - Other payables (Note 15) 1,055,829 12 840,445 10 780,979 9 631,404 8
Debt investments with no active market - Current tax liabilities 103,012 1 138,071 1 123,747 2 164,227 2 current (Notes 4, 7 and 27) 214,105 3 742,261 9 344,257 4 665,979 8 Receipts in advance (Note 15) 638,609 7 516,498 6 608,806 7 450,085 6
Notes receivable 1,524 - 2,401 - 2,755 - 6,382 - Current portion of long-term borrowings 367 - 668 - 359 - 360 -
Trade receivables (Notes 4, 5 and 8) 289,113 3 228,083 3 278,128 3 186,853 2 Other current liabilities (Note 15) 12,278 - 16,303 - 15,202 - 14,416 - Other receivables 100,205 1 48,872 1 38,255 1 39,505 1
Current tax assets 21,469 - 6,400 - 1,675 - 133 - Total current liabilities 2,579,740 29 2,258,163 26 2,353,338 28 2,015,658 25
Inventories (Notes 4 and 9) 466,083 5 389,083 4 425,898 5 371,233 5 Prepayments (Note 13) 294,911 4 631,850 7 631,106 8 675,781 8 NONCURRENT LIABILITIES
Other current assets (Note 13) 12,071 - 12,721 - 15,098 - 11,374 - Long-term borrowings - - - - 408 - 681 -
Decommission, restoration and rehabilitation Total current assets 3,958,253 45 4,612,416 54 4,867,510 58 5,444,139 68 provisions (Note 4) 22,295 - 19,247 - 18,659 - 14,705 -
Guarantee deposits received (Note 15) 45,966 1 51,552 1 51,929 1 53,568 1
NONCURRENT ASSETS Other noncurrent liabilities (Note 15) - - 426 - 456 - 56 - Debt investment with no active market -
noncurrent (Notes 4, 7 and 27) 200 - 1,700 - 1,700 - 1,700 - Total noncurrent liabilities 68,261 1 71,225 1 71,452 1 69,010 1
Investments accounted for using equity method (Notes 4 and 10) 186,765 2 96,198 1 100,970 1 - - Total liabilities 2,648,001 30 2,329,388 27 2,424,790 29 2,084,668 26
Property, plant and equipment (Notes 4, 11
and 27) 3,888,737 44 3,397,262 40 3,052,381 36 2,198,689 28 EQUITY ATTRIBUTABLE TO OWNERS OF Trademarks (Notes 4 and 12) 2,205 - 2,032 - 1,476 - 1,439 - THE COMPANY (Note 16)
Computer software (Notes 4 and 12) 64,743 1 18,191 - 19,257 - 17,820 - Share capital 1,411,200 16 1,411,200 16 1,411,200 16 1,344,000 17
Goodwill 745 - 745 - 745 - 745 - Capital surplus Other intangible assets (Notes 4 and 12) 3,832 - 3,887 - 3,951 - 4,274 - Additional paid-in capital 2,681,126 31 2,681,126 31 2,681,126 32 2,748,326 34
Deferred tax assets (Notes 4 and 5) 51,977 1 46,511 1 62,513 1 45,029 1 Retained earnings
Prepaid equipment (Note 13) 153,647 2 - - - - - - Reserve 366,706 4 268,972 3 268,972 3 156,864 2 Refundable deposits (Note 13) 414,161 5 377,695 4 342,668 4 273,728 3 Special reserve 38,098 - - - - - - -
Other noncurrent assets (Note 13) 15,929 - 6,369 - 6,704 - 8,467 - Unappropriated earnings 1,395,981 16 1,755,003 21 1,588,865 19 1,424,569 18
Total retained earnings 1,800,785 20 2,023,975 24 1,857,837 22 1,581,433 20 Total noncurrent assets 4,782,941 55 3,950,590 46 3,592,365 42 2,551,891 32 Other equity 141,198 2 (7,369 ) - (3,197 ) - 127,893 2
Total equity attributable to owners of the Company 6,034,309 69 6,108,932 71 5,946,966 70 5,801,652 73
NON-CONTROLLING INTERESTS 58,884 1 124,686 2 88,119 1 109,710 1
Total equity 6,093,193 70 6,233,618 73 6,035,085 71 5,911,362 74
TOTAL $ 8,741,194 100 $ 8,563,006 100 $ 8,459,875 100 $ 7,996,030 100 TOTAL $ 8,741,194 100 $ 8,563,006 100 $ 8,459,875 100 $ 7,996,030 100
The accompanying notes are an integral part of the consolidated financial statements.
- 3 -
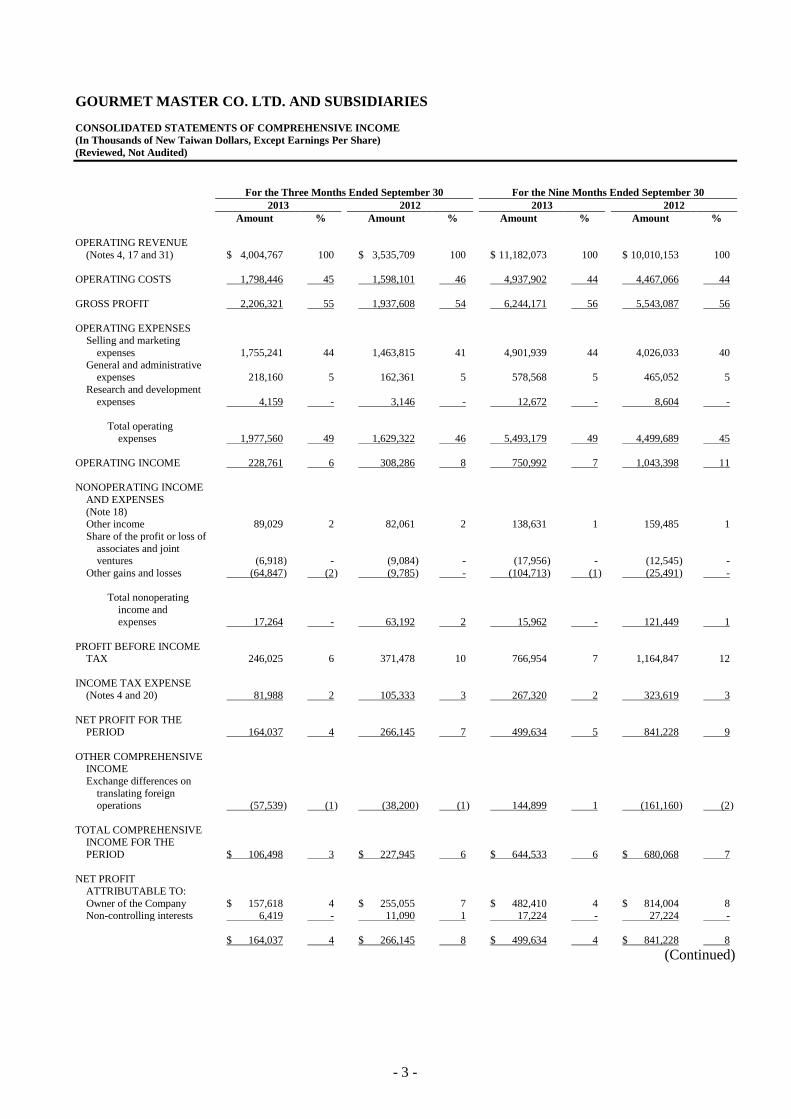
GOURMET MASTER CO. LTD. AND SUBSIDIARIES
CONSOLIDATED STATEMENTS OF COMPREHENSIVE INCOME
(In Thousands of New Taiwan Dollars, Except Earnings Per Share)
(Reviewed, Not Audited)
For the Three Months Ended September 30 For the Nine Months Ended September 30
2013 2012 2013 2012
Amount % Amount % Amount % Amount %
OPERATING REVENUE
(Notes 4, 17 and 31) $ 4,004,767 100 $ 3,535,709 100 $ 11,182,073 100 $ 10,010,153 100
OPERATING COSTS 1,798,446 45 1,598,101 46 4,937,902 44 4,467,066 44
GROSS PROFIT 2,206,321 55 1,937,608 54 6,244,171 56 5,543,087 56
OPERATING EXPENSES Selling and marketing
expenses 1,755,241 44 1,463,815 41 4,901,939 44 4,026,033 40
General and administrative
expenses 218,160 5 162,361 5 578,568 5 465,052 5
Research and development
expenses 4,159 - 3,146 - 12,672 - 8,604 -
Total operating
expenses 1,977,560 49 1,629,322 46 5,493,179 49 4,499,689 45
OPERATING INCOME 228,761 6 308,286 8 750,992 7 1,043,398 11
NONOPERATING INCOME
AND EXPENSES
(Note 18) Other income 89,029 2 82,061 2 138,631 1 159,485 1
Share of the profit or loss of
associates and joint ventures (6,918 ) - (9,084 ) - (17,956 ) - (12,545 ) -
Other gains and losses (64,847 ) (2 ) (9,785 ) - (104,713 ) (1 ) (25,491 ) -
Total nonoperating
income and expenses 17,264 - 63,192 2 15,962 - 121,449 1
PROFIT BEFORE INCOME TAX 246,025 6 371,478 10 766,954 7 1,164,847 12
INCOME TAX EXPENSE (Notes 4 and 20) 81,988 2 105,333 3 267,320 2 323,619 3
NET PROFIT FOR THE PERIOD 164,037 4 266,145 7 499,634 5 841,228 9
OTHER COMPREHENSIVE INCOME
Exchange differences on
translating foreign operations (57,539 ) (1 ) (38,200 ) (1 ) 144,899 1 (161,160 ) (2 )
TOTAL COMPREHENSIVE INCOME FOR THE
PERIOD $ 106,498 3 $ 227,945 6 $ 644,533 6 $ 680,068 7
NET PROFIT
ATTRIBUTABLE TO:
Owner of the Company $ 157,618 4 $ 255,055 7 $ 482,410 4 $ 814,004 8 Non-controlling interests 6,419 - 11,090 1 17,224 - 27,224 -
$ 164,037 4 $ 266,145 8 $ 499,634 4 $ 841,228 8
(Continued)

- 4 -
GOURMET MASTER CO. LTD. AND SUBSIDIARIES
CONSOLIDATED STATEMENTS OF COMPREHENSIVE INCOME
(In Thousands of New Taiwan Dollars, Except Earnings Per Share)
(Reviewed, Not Audited)
For the Three Months Ended September 30 For the Nine Months Ended September 30
2013 2012 2013 2012
Amount % Amount % Amount % Amount %
TOTAL COMPREHENSIVE
INCOME ATTRIBUTABLE TO:
Owner of the Company $ 101,554 3 $ 216,968 6 $ 630,977 6 $ 682,914 7
Non-controlling interests 4,944 - 10,977 - 13,556 - (2,846 ) -
$ 106,498 3 $ 227,945 6 $ 644,533 6 $ 680,068 7
EARNINGS PER SHARE
(Note 21)
Basic $1.12 $1.81 $3.42 $5.77
The accompanying notes are an integral part of the consolidated financial statements. (Concluded)

- 5 -
GOURMET MASTER CO. LTD. AND SUBSIDIARIES
CONSOLIDATED STATEMENTS OF CHANGES IN EQUITY
(In Thousands of New Taiwan Dollars)
(Reviewed, Not Audited)
Equity Attributable to the Owners of the Company
Exchange
Differences on
Retained Earnings Translating
Unappropriated Foreign Non-controlling
Share Capital Capital Surplus Reserve Special Reserve Earnings Operations Total Interests Total Equity
BALANCE AT JANUARY 1, 2012 $ 1,344,000 $ 2,748,326 $ 156,864 $ - $ 1,424,569 $ 127,893 $ 5,801,652 $ 109,710 $ 5,911,362
Appropriation of 2011 earning
Reserve - - 112,108 - (112,108) - - - -
Cash dividends distributed by the Company - - - - (537,600) - (537,600) - (537,600)
Cash dividends distributed by subsidiaries - - - - - - - (18,745) (18,745)
Issue of share dividends from capital surplus 67,200 (67,200) - - - - - - -
Net profit for the nine months ended September 30, 2012 - - - - 814,004 - 814,004 27,224 841,228
Other comprehensive income (loss) for the nine months ended
September 30, 2012, net of income tax - - - - - (131,090) (131,090) (30,070) (161,160)
Total comprehensive income for the nine months ended September 30,
2012 - - - - 814,004 (131,090) 682,914 (2,846) 680,068
BALANCE AT SEPTEMBER 30, 2012 $ 1,411,200 $ 2,681,126 $ 268,972 $ - $ 1,588,865 $ (3,197) $ 5,946,966 $ 88,119 $ 6,035,085
BALANCE AT JANUARY 1, 2013 $ 1,411,200 $ 2,681,126 $ 268,972 $ - $ 1,755,003 $ (7,369) $ 6,108,932 $ 124,686 $ 6,233,618
Appropriation of 2012 earnings
Reserve - - 97,734 - (97,734) - - - -
Special reserve - - - 38,098 (38,098) - - - -
Cash dividends distributed by the Company - - - - (705,600) - (705,600) - (705,600)
Cash dividends distributed by subsidiaries - - - - - - - (47,084) (47,084)
Net profit for the nine months ended September 30, 2013 - - - - 482,410 - 482,410 17,224 499,634
Other comprehensive income (loss) for the nine months ended
September 30, 2013, net of income tax - - - - - 148,567 148,567 (3,668) 144,899
Total comprehensive income for the nine months ended September 30,
2013 - - - - 482,410 148,567 630,977 13,556 644,533
Effect of deconsolidation of subsidiary - - - - - - - (32,274) (32,274)
BALANCE AT SEPTEMBER 30, 2013 $ 1,411,200 $ 2,681,126 $ 366,706 $ 38,098 $ 1,395,981 $ 141,198 $ 6,034,309 $ 58,884 $ 6,093,193
The accompanying notes are an integral part of the consolidated financial statements.

- 6 -
GOURMET MASTER CO. LTD. AND SUBSIDIARIES
CONSOLIDATED STATEMENTS OF CASH FLOWS
(In Thousands of New Taiwan Dollars)
(Reviewed, Not Audited)
For the Nine Months Ended
September 30
2013 2012
CASH FLOWS FROM OPERATING ACTIVITIES
Income before income tax $ 766,954 $ 1,164,847
Adjustments for:
Depreciation expenses 546,018 380,358
Amortization expenses 11,873 4,495
Interest expense 48 61
Interest income (17,555) (28,059)
Share of loss of associates and joint ventures 17,956 12,545
Loss on disposal of property, plant and equipment 57,567 1,526
Loss on disposal of intangible assets 278 179
Impairment loss recognized on non-financial assets - 7,817
Gain on deconsolidation of subsidiary (5,874) -
Changes in operating assets and liabilities
Decrease in notes receivable 877 3,627
Increase in trade receivables (61,160) (91,275)
(Increase) decrease in other receivables (48,307) 1,249
Increase in inventories (87,001) (62,442)
Decrease (increase) in prepayments 26,248 (52,857)
Decrease (increase) in other current assets 633 (3,724)
(Increase) decrease in other operating assets (9,560) 1,763
Decrease in notes payable (983) (19)
Increase in trade payables 25,430 69,098
Increase in other payables 170,327 122,361
Increase in provisions 3,048 3,954
Increase in receipts in advance 123,396 158,721
(Decrease) increase in other current liabilities (4,000) 787
(Decrease) increase in other operating liabilities (426) 400
Cash generated from operations 1,515,787 1,695,412
Interest paid (48) (61)
Income taxes paid (297,517) (388,943)
Net cash generated from operating activities 1,218,222 1,306,408
CASH FLOWS FROM INVESTING ACTIVITIES
Proceeds from debt investments with no active market 525,359 321,722
Acquisition of investment accounted for by equity method - (113,370)
Net cash outflow from deconsolidation of subsidiary (47,726) -
Payment for property, plant and equipment (1,019,422) (836,151)
Proceeds from property, plant and equipment 2,068 11,127
Increase in refundable deposits (89,589) (91,474)
Decrease in refundable deposits 60,071 14,774
Acquisition of intangible assets (57,929) (6,513)
(Continued)

- 7 -
GOURMET MASTER CO. LTD. AND SUBSIDIARIES
CONSOLIDATED STATEMENTS OF CASH FLOWS
(In Thousands of New Taiwan Dollars)
(Reviewed, Not Audited)
For the Nine Months Ended
September 30
2013 2012
Proceeds from intangible assets $ 63 $ -
Increase in prepaid equipment - (320,813)
Decrease in prepaid equipment 150,760 -
Interest received 14,522 28,059
Net cash used in investing activities (461,823) (992,639)
CASH FLOWS FROM FINANCING ACTIVITIES
Repayments of long-term borrowings (301) (274)
Increase in guarantee deposits received 3,182 2,130
Decrease in guarantee deposits received (9,470) (3,127)
Dividends paid to owners of the Company (705,600) (537,600)
Dividends paid to non-controlling interests (47,084) (18,745)
Net cash used in financing activities (759,273) (557,616)
EFFECT OF EXCHANGE RATE CHANGES ON THE BALANCE OF
CASH HELD IN FOREIGN CURRENCIES 11,710 (112,677)
NET INCREASE (DECREASE) IN CASH AND CASH
EQUIVALENTS 8,836 (356,524)
CASH AND CASH EQUIVALENTS AT THE BEGINNING OF
PERIOD 2,541,543 3,477,523
CASH AND CASH EQUIVALENTS AT THE END OF PERIOD $ 2,550,379 $ 3,120,999
The accompanying notes are an integral part of the consolidated financial statements. (Concluded)

- 8 -
GOURMET MASTER CO. LTD. AND SUBSIDIARIES
NOTES TO CONSOLIDATED FINANCIAL STATEMENTS
FOR THE NINE MONTHS ENDED SEPTEMBER 30, 2013 AND 2012
(In Thousands of New Taiwan Dollars, Unless Stated Otherwise)
(Reviewed, Not Audited)
1. GENERAL INFORMATION
a. Gourmet Master Co. Ltd. (the “Company”) was incorporated in the Cayman Islands in September 2008.
b. The Group mainly engages in the production and wholesale of bakery products, retail of beverages,
wholesale of bakery machinery, and the business of multiple shops and alliance shops.
The Company’s shares have been listed on the Taiwan Stock Exchange (“TSE”) since November 22, 2010.
The functional currency of the Company is Renminbi. For greater comparability and consistency of
financial reporting, the consolidated financial statements are presented in New Taiwan dollars since the
Company’s stocks are listed on the Taiwan Stock Exchange.
2. APPROVAL OF FINANCIAL STATEMENTS
The consolidated financial report was approved by the Board of Directors and authorized for issue on
November 6, 2013.
3. APPLICATION OF NEW AND REVISED STANDARDS, AMENDMENTS AND
INTERPRETATIONS
a. New and revised Standards, Amendments and Interpretations in issue but not yet effective
In addition to the disclosure in Note 3 to the consolidated financial statements as of March 31, 2013, the
Company and its entire controlled subsidiaries (the “Group”) have not applied the International
Financial Reporting Standards (IFRS), International Accounting Standards (IAS), International
Financial Reporting Interpretations (IFRIC), and Standing Interpretations (SIC) that have been issued
by the IASB.
As of the date that the consolidated financial statements were approved and authorized for issue, the
Financial Supervisory Commission (“FSC”) has not determined and not announced the effective dates
for the following new and revised standards, amendments and interpretations.
New, Revised Standards, Amendments and Interpretations
Effective Date
Announced by
IASB (Note)
Amendment to IAS 36 Impairment of Assets: Recoverable Amount
Disclosures for Non-financial Assets
January 1, 2014
Amendment to IAS 39 Novation of Derivatives and
Continuation of Hedge Accounting
January 1, 2014
IFRIC 21 Levies January 1, 2014
Note: Unless otherwise noted, the above new and revised Standards, Amendments and Interpretations
are effective for annual periods beginning on or after the respective effective dates.
- 9 -
b. Significant changes in accounting policy resulted from new and revised Standards, Amendments and
Interpretations in issue but not yet effective
The initial application of the above new and revised standards, amendments and interpretations had not
any material impact on the Group’s accounting policies.
c. Material impact on consolidated financial statements resulted from new and revised standards,
amendments and interpretations in issue but not yet effective
The initial application of the above new and revised standards, amendments and interpretations, had no
any material impact on the consolidated financial statements.
4. SUMMARY OF SIGNIFICANT ACCOUNTING POLICY
On May 14, 2009, the FSC announced the “Framework for the Adoption of IFRSs by the Companies in the
ROC.” In this framework, starting 2013, companies with shares listed on the Taiwan Stock Exchange or
traded on the Taiwan GreTai Securities Market or Emerging Stock Market should prepare their
consolidated financial statements in accordance with the Regulations Governing the Preparation of
Financial Reports by Securities Issuers and the International Financial Reporting Standards, International
Accounting Standards, and the Interpretations approved by the FSC. The date of transition to IFRSs was
January 1, 2012. Refer to Note 30 for the impact of IFRS conversion on the consolidated financial
statements.
Statement of Compliance
The consolidated financial statements have been prepared in accordance with the Regulations Governing
the Preparation of Financial Reports by Securities Issuers, IFRS 1 “First-time Adoption of International
Financial Reporting Standards” and IAS 34 “Interim Financial Reporting” as endorsed by the FSC.
Disclosure information included in interim financial reports is less than disclosures required in a full set of
annual financial reports.
Basis of Consolidation
The consolidated financial statements have been prepared on the same basis as the consolidated financial
statements as of March 31, 2013. Refer to the Note 4 to the consolidated financial statements as of March
31, 2013 for details expect for the following descriptions.
Change in the Group’s ownership interests in existing subsidiaries
When the Group loses control of a subsidiary, a gain or loss is recognized in profit or loss and is calculated
as the difference between (i) the aggregate of the fair value of the consideration received and any
investment retained in the former subsidiary at its fair value at the date when control is lost and (ii) the
assets (including any goodwill) and liabilities and any non-controlling interests of the former subsidiary at
their carrying amounts at the date when control is lost. If the Group loses control of a subsidiary, the
Group accounts for all amounts recognized in other comprehensive income in relation to that subsidiary on
the same basis as would be required if the Group had directly disposed of the related assets or liabilities (i.e.
reclassifies to profit or loss, or transfers directly to retained earnings if required in accordance with other
IFRSs).
The fair value of any investment retained in the former subsidiary at the date when control is lost is
regarded as the cost on initial recognition of an investment in an associate or a jointly controlled entity.

- 10 -
Subsidiary included in consolidated financial statements
The consolidated entities as of September 30, 2013, December 31, 2012, September 30, 2012 and January
1, 2012 were as follows:
% of Ownership
Investor Investee Main Businesses
September 30,
2013
December 31,
2012
September 30,
2012
January 1,
2012
Note
Gourmet Master Co.
Ltd.
85 Degree Co., Ltd. Investment 100% 100% 100% 100% -
Prime Scope Trading
Limited
Investment 100% 100% 100% 100% -
Perfect 85 Degrees C,
Inc.
Investment 100% 100% 100% 100% -
85 Degrees Café
International Pty Ltd.
Grocery and drink
retailing
51% 51% 51% 51% -
Lucky Bakery Limited Investment 100% 100% 100% 100% -
WinPin 85 Investments,
Inc.
Grocery and drink
retailing
100% 100% 100% - -
Perfect 85 Degrees
C, Inc.
Golden 85 Investments,
LLC
Grocery and drink
retailing
65% 65% 65% 65% -
85 Degree Co., Ltd. Comestibles Master Co.,
Ltd.
Grocery and drink
retailing
100% 100% 100% 100% -
Comestibles Master
Co.,
Mei Wei Master Co., Ltd. Grocery and drink
retailing
100% 100% 100% 100% -
Ltd. The Hot Pot Food and
Beverage Management
Co., Ltd.
Food and beverage sale;
grocery and drink
retailing
- 76% - - a
Mei Wei Master Co.,
Ltd.
Mei Wei Fu Xing Ltd. Grocery and drink
retailing
60% 60% 60% 60% -
Mei Wei San Min Ltd. Grocery and drink
retailing
- - 100% 60% -
The Hot Pot Food
and Beverage
Management Co.,
Ltd.
The Hot Pot Food and
Beverage Management
Limited
Investment - 90% - - a
Prime Scope Trading
Limited
Shanghai Gourmet
Master Food &
Beverage Ltd.
Grocery and drink
retailing
100% 100% 100% 100% -
He-Shia Food &
Beverage Ltd.
Grocery and drink
retailing
100% 100% 100% 100% -
Sheng-Pin (Hangzhou)
Food Ltd.
Manufacturing of baking
food and sale
100% 100% 100% 100% -
He-Shia (Nanjing) Food
& Beverage Ltd.
Grocery and drink
retailing
100% 100% 100% 100% -
Beijing 85 Food &
Beverage Ltd.
Grocery and drink
retailing
100% 100% 100% 100% -
Zhejiang 85 Food &
Beverage Ltd.
Grocery and drink
retailing
100% 100% 100% 100% -
Sheng-Pin (Beijing) Food
Ltd.
Manufacturing of baking
food and sale
100% 100% 100% 100% -
Fuzhou 85 Food &
Beverage Ltd.
Grocery and drink
retailing
100% 100% 100% 100% -
Sheng-Pin (Jiangsu) Food
Ltd.
Manufacturing of baking
food and sale
100% 100% 100% 100% -
Sheng-Pin (Xiamen)
Food Ltd.
Manufacturing of baking
food and sale
100% 100% 100% - -
Sheng-Pin (Qingdao)
Food Ltd.
Manufacturing of baking
food and sale
100% 100% 100% - -
Xiamen 85 Food &
Beverage Ltd.
Grocery and drink
retailing
100% 100% 100% - -
Shenyang 85 Food &
Beverage Ltd.
Grocery and drink
retailing
100% 100% 100% - -
Sheng-Pin (Shenyang)
Food Ltd.
Manufacturing of baking
food and sale
100% 100% 100% - -
85 Degree (Qingdao)
Food & Beverage
Management Ltd.
Grocery and drink
retailing
100% 100% - - -
85 Degree (Jiangsu) Food
Ltd.
Manufacturing of baking
food and sale
68% - - - -
(Continued)

- 11 -
% of Ownership
Investor Investee Main Businesses
September 30,
2013
December 31,
2012
September 30,
2012
January 1,
2012
Note
Shanghai Gourmet
Master Food &
Beverage Ltd.
Sheng-Pin (Shanghai)
Food Ltd.
Manufacturing of baking
food and sale
100% 100% 100% 100% -
Mai-Jai (Shanghai) Food
Ltd.
Manufacturing of baking
food and sale
100% 100% 100% 100% -
Shanghai Howco Jing
Way Food & Beverage
Ltd.
Grocery and drink
retailing
100% 100% 100% 100% -
Shenzheng 85 Food &
Beverage Ltd.
Grocery and drink
retailing
85% 85% 85% 85% -
Chengdu 85 Food &
Beverage Ltd.
Grocery and drink
retailing
100% 100% 100% 100% -
Sheng-Pin (Wuhan) Food
Ltd.
Manufacturing of baking
food and sale
100% 100% 100% - -
Wuhan Jing Way Food &
Beverage Ltd.
Grocery and drink
retailing
100% 100% 100% - -
Jianxi Jing Way Food &
Beverage Ltd.
Grocery and drink
retailing
100% 100% 100% - -
Jin Wei Industrial
(Shanghai) Ltd.
Grocery sale 100% 100% - - -
Guangzhou 85 Degree
Food & Beverage
Management Ltd.
Grocery and drink
retailing
100% 100% - - -
85 Degree (Jiangsu) Food
Ltd.
Manufacturing of baking
food and sale
32% - - - -
Mai-Jai (Chengdu) Food
Ltd.
Manufacturing of baking
food and sale
100% - - - -
Shenzheng 85 Food
& Beverage Ltd.
Sheng-Pin (Shenzheng)
Food & Beverage Ltd.
Manufacturing of baking
food and sale
100% 100% 100% 100% -
85 Degree (Qingdao)
Food & Beverage
Management Ltd.
Qingdao Jie Wei Food &
Beverage Management
Ltd.
Manufacturing of baking
food and sale
100% 100% - - -
(Concluded)
Starting August 2013, The Hot Pot Food and Beverage Management Co., Ltd. increased its share capital
and the Group did not participate in share issuance. Thus, the Group loss power to govern the financial
and operating policies of The Hot Pot Food and Beverage Management Co., Ltd. and its subsidiary The Hot
Pot Food and Beverage Management Limited for the loss of power to cast the majority of votes at meetings
of the Board of Directors; accordingly, The Hot Pot Food and Beverage Management Co., Ltd. is no longer
consolidated and is accounted for using the equity method. Please refer to Note 19.
Other Significant Accounting Policies
The same accounting policies have been followed in these consolidated financial statements as were applied
in the preparation of the consolidated financial statements for the three months ended March 31, 2013,
except for those described below. Refer to Note 4 to the consolidated financial statements as of March 31,
2013 for the details of summary of significant accounting policy.
5. CRITICAL ACCOUNTING JUDGMENTS AND KEY SOURCES OF ESTIMATION
UNCERTAINTY
In the application of the Group’s accounting policies, the management of the Group are required to make
judgments, estimates and assumptions about the carrying amounts of assets and liabilities that are not
readily apparent from other sources. The estimates and associated assumptions are based on historical
experience and other factors that are considered relevant. Actual results may differ from these estimates.
The estimates and underlying assumptions are reviewed on an ongoing basis. Revisions to accounting
estimates are recognized in the period in which the estimate is revised if the revision affects only that
period, or in the period of the revision and future periods if the revision affects both current and future
periods.

- 12 -
Critical Judgements in Applying Accounting Policies
The following are the critical judgments, apart from those involving estimations that the management of the
Group have made in the process of applying the Group’s accounting policies and that have the most
significant effect on the amounts recognized in the consolidated financial statements.
Key Sources of Estimation Uncertainty
The following are the key assumptions concerning the future, and other key sources of estimation
uncertainty at the end of the reporting period, that have a significant risk of causing a material adjustment to
the carrying amounts of assets and liabilities within the next financial year.
Income Taxes
As of September 30, 2013, December 31, 2012, September 30, 2012, and January 1, 2012, the carrying
amount of the deferred tax assets in relation to unused tax losses was $7,503 thousand, $12,523 thousand,
$22,725 thousand and $12,911 thousand, respectively. As of September 30, 2013, December 31, 2012,
September 30, 2012, and January 1, 2012, no deferred tax asset has been recognized on the tax loss of
$167,625 thousand, $87,092 thousand, $56,708 thousand and $36,048 thousand, respectively, due to the
unpredictability of future profit streams. The realizability of the deferred tax asset mainly depends on
whether sufficient future profits or taxable temporary differences will be available in the future. In cases
where the actual future profits generated are less than expected, a material reversal of deferred tax assets
may arise, which would be recognized in profit or loss for the period in which such reversal takes place.
Estimated Impairment of Trade Receivables
When there is objective evidence of impairment loss, the Group takes into consideration the estimation of
future cash flows. The amount of the impairment loss is measured as the difference between the asset’s
carrying amount and the present value of estimated future cash flows (excluding future credit losses that
have not been incurred) discounted at the financial asset’s original effective interest rate. Where the actual
future cash flows are less than expected, a material impairment loss may arise.
6. CASH AND CASH EQUIVALENTS
September 30,
2013
December 31,
2012
September 30,
2012
January 1,
2012
Cash on hand $ 372,947 $ 159,075 $ 180,462 $ 74,281
Checking accounts and demand
deposits 2,040,388 1,973,184 2,103,176 2,109,000
Cash equivalent
Time deposits with original
maturities less than three
months 137,044 409,284 837,361 1,294,242
$ 2,550,379 $ 2,541,543 $ 3,120,999 $ 3,477,523
Cash equivalents include time deposits that have a maturity of three months or less from the date of
acquisition, are readily convertible to a known amount of cash, and are subject to an insignificant risk of
change in value; these were held for the purpose of meeting short-term cash commitments.
Refer to Note 6 to the consolidated financial statements as of March 31, 2013 for other related information
on cash and cash equivalents.

- 13 -
7. DEBT INVESTMENTS WITH NO ACTIVE MARKET
September 30,
2013
December 31,
2012
September 30,
2012
January 1,
2012
Time deposits with original
maturity more than three months
$ 214,305 $ 738,959 $ 345,957 $ 666,907
Trust fund account - 5,002 - 772
$ 214,305 $ 743,961 $ 345,957 $ 667,679
Current $ 214,105 $ 742,261 $ 344,257 $ 665,979
Noncurrent 200 1,700 1,700 1,700
$ 214,305 $ 743,961 $ 345,957 $ 667,679
Refer to Note 27 for information relating to bond investments with no active market pledged as security.
Refer to Note 7 to the consolidated financial statements as of March 31, 2013 for other related information
on bond investments with no active market.
8. TRADE RECEIVABLES
September 30,
2013
December 31,
2012
September 30,
2012
January 1,
2012
Trade receivables $ 289,113 $ 228,083 $ 278,128 $ 186,853
Less: Allowance for doubtful
accounts - -
- -
$ 289,113 $ 228,083 $ 278,128 $ 186,853
For the trade receivables balances that were past due at the end of the reporting period, the Group did not
recognize an allowance for impairment loss, because there was not a significant change in credit quality and
the amounts were still considered recoverable. The Group did not hold any collateral or other credit
enhancements for these balances.
Age of receivables that are past due but not impaired was as follow:
September 30,
2013
December 31,
2012
September 30,
2012
January 1,
2012
In 90 days $ 8,020 $ 79 $ 1,557 $ 5,233
90 days to 180 days 20,264 8,287 11,408 13,425
181 days to 361 days 29,952 1,482 10,498 10,083
Over 361 days 1,411 4,845 5,711 5,814
$ 59,647 $ 14,693 $ 29,174 $ 34,555
Above analysis was based on the billing date.
On the above age of receivables that are past due but not impaired, the receivables of outlets in shopping
malls are collected by the mall first, which means the procedures for the billing of the Company is longer.
The experience shows that the receivables are collectable, so there was no impairment loss recognized.

- 14 -
Refer to Note 8 to the consolidated financial statements as of March 31, 2013 for other information related
to trade receivables.
9. INVENTORIES
September 30,
2013
December 31,
2012
September 30,
2012
January 1,
2012
Finished goods $ 28,879 $ 34,125
$ 65,734 $ 40,846
Work in process 3,776 4,046 10,336 21,648
Raw materials and supplies 359,901 315,182 304,305 201,841
Inventory in transit 73,527 35,730 45,523 106,898
$ 466,083 $ 389,083 $ 425,898 $ 371,233
The cost of inventories recognized as cost of goods sold in the three months and the nine months ended
September 30, 2013 included write-downs of $0 thousand and $0 thousand, respectively. The cost of
inventories recognized as cost of goods sold in the three months and nine months ended September 30,
2012 included write-downs of $8,537 thousand and $7,817 thousand, respectively.
10. INVESTMENTS ACCOUNTED FOR USING EQUITY METHOD
Investment accounted for using the equity method consisted of the following:
September 30,
2013
December 31,
2012
September 30,
2012
January 1,
2012
Investment in associates $ 104,476 $ - $ - $ -
Investment in jointly controlled
entities 82,289 96,198 100,970 -
$ 186,765 $ 96,198 $ 100,970 $ -
a. Investment in associates
September 30,
2013
December 31,
2012
September 30,
2012
January 1,
2012
Unlisted company
The Hot Pot Food and
Beverage Management Co.,
Ltd. $ 104,476 $ - $ - $ -
As the end of the reporting period, the proportion of ownership and voting rights in associates held by
the Group were as follows:
Name of Associate
September 30,
2013
December 31,
2012
September 30,
2012
January 1,
2012
The Hot Pot Food and
Beverage Management Co.,
Ltd. 42% - - -

- 15 -
The Group has no power to govern the financial and operating policies of The Hot Pot Food and
Beverage Management Co., Ltd. starting August 2013. This is because the Group loss power to cast
the majority of votes at meetings of the Board of Directors. As a result, The Hot Pot Food and
Beverage Management Co., Ltd. is no longer consolidated while accounted for using the equity method.
Please refer to Note 19.
Financial information of the Group’s associates was summarized as follows:
September 30,
2013
December 31,
2012
September 30,
2012
January 1,
2012
Total asset $ 269,888 $ - $ - $ -
Total liabilities (22,433) - - -
Net asset $ 247,455 $ - $ - $ -
The Group’s share of net assets
of associates $ 104,476 $ - $ - $ -
Three Months Ended
September 30
Nine Months Ended
September 30
2013 2012 2013 2012
Net revenue $ 22,090 $ - $ 55,775 $ -
Net loss $ (8,079) $ - $ (13,224) $ -
The Group’s share of profits of
associates $ (2,284) $ $ (2,284) $ -
The Group’s share of other
comprehensive loss of
associates $ (16) $ $ (16) $ -
b. Investment in jointly controlled entities:
September 30,
2013
December 31,
2012
September 30,
2012
January 1,
2012
Unlisted company
Profit Sky International Limited $ 82,289 $ 96,198 $ 100,970 $ -
As the end of the reporting period, the proportion of ownership and voting rights in jointly controlled
entities held by the Group were as follows:
Name of Jointly Controlled
Entities September 30,
2013
December 31,
2012
September 30,
2012
January 1,
2012
Profit Sky International Limited 50% 50% 50% -
For the nine months ended September 30, 2013 and 2012, the equity-method investees’ financial
statements, which had been used to determine the carrying amount of the Group’s investments share of
profit and other comprehensive income of associates, had not been reviewed. The Group believes that,
had Company’s financial statements been reviewed, any adjustments arising would have had no
material effect on the Group’s financial statements.

- 16 -
Refer to Note 10 to the consolidated financial statement as March 31, 2013 for other information related
to investment in jointly controlled entities.
11. PROPERTY, PLANT AND EQUIPMENT
September 30,
2013
December 31,
2012
September 30,
2012
January 1,
2012
Carrying amounts of each class
Land $ 419,043 $ 417,259 $ 418,350 $ 293,761
Buildings 609,240 381,229 386,493 52,404
Machinery and equipment 1,298,525 1,234,863 1,161,513 936,366
Leasehold improvements 940,391 894,493 799,002 673,772
Transportation equipment 26,246 27,124 28,574 29,027
Office equipment 206,436 206,524 206,355 51,629
Other equipment 43,901 71,474 49,754 161,730
Construction in process 344,955 164,296 2,340 -
$ 3,888,737 $ 3,397,262 $ 3,052,381 $ 2,198,689
Land Buildings
Machinery and
Equipment
Leasehold
Improvements
Transportation
Equipment
Office
Equipment
Other
Equipment
Construction
in Progress Total
Cost
January 1, 2012 $ 293,761 $ 70,700 $ 1,284,430 $ 966,125 $ 43,560 $ 89,905 $ 267,795 $ - $ 3,016,276
Additions 124,950 54,705 337,458 265,550 5,205 67,537 5,620 2,340 863,365
Reclassified - 289,086 52,870 3,079 1,817 194,111 (122,618 ) - 418,345
Disposal - - (28,076 ) (3,664 ) (2,321 ) (9,966 ) (1,389 ) - (45,416 )
Effect of foreign
currency exchange
difference (361 ) (2,166 ) (32,645 ) (3,106 ) (814 ) (3,258 ) (3,916 ) - (46,266 )
September 30, 2012 $ 418,350 $ 412,325 $ 1,614,037 $ 1,227,984 $ 47,447 $ 338,329 $ 145,492 $ 2,340 $ 4,206,304
January 1, 2013 $ 417,259 $ 414,094 $ 1,729,320 $ 1,391,242 $ 47,953 $ 354,068 $ 172,067 $ 164,296 $ 4,690,299
Additions - 147,943 223,548 354,462 6,371 56,160 15,856 280,007 1,084,347
Reclassified - 89,446 13,649 (32,812 ) 655 2,826 (15,856 ) (57,908 ) -
Disposal - - (12,047 ) (97,734 ) (3,805 ) (9,349 ) (9,588 ) - (132,523 )
Effect of
deconsolidation of
subsidiary - - (3,256 ) (21,584 ) - (979 ) (11,436 ) (44,420 ) (81,675 )
Effect of foreign
currency exchange
difference 1,784 12,855 50,421 41,962 883 11,408 825 2,980 123,118
September 30, 2013 $ 419,043 $ 664,338 $ 2,001,635 $ 1,635,536 $ 52,057 $ 414,134 $ 151,868 $ 344,955 $ 5,683,566
Accumulated
depreciation and
impairment
January 1, 2012 $ - $ 18,296 $ 348,064 $ 292,353 $ 14,533 $ 38,276 $ 106,065 $ - $ 817,587
Depreciation charge
for the period - 7,558 168,796 142,858 5,890 36,096 19,160 - 380,358
Reclassified - - (32,673 ) (3,481 ) 103 63,721 (27,670 ) - -
Disposal - - (23,565 ) (1,659 ) (1,415 ) (5,017 ) (1,107 ) - (32,763 )
Effect of foreign
currency exchange
difference - (22 ) (8,098 ) (1,089 ) (238 ) (1,102 ) (710 ) - (11,259 )
September 30, 2012 $ - $ 25,832 $ 452,524 $ 428,982 $ 18,873 $ 131,974 $ 95,738 $ - $ 1,153,923
January 1, 2013 $ - $ 32,865 $ 494,457 $ 496,749 $ 20,829 $ 147,544 $ 100,593 $ - $ 1,293,037
Depreciation charge
for the period - 21,904 219,130 219,874 6,627 59,605 18,878 - 546,018
Reclassified - - (1,494 ) 2,026 (740 ) 1,427 (1,219 ) - -
Disposal - - (21,556 ) (35,969 ) (1,238 ) (5,278 ) (8,847 ) - (72,888 )
Effect of
deconsolidation of
subsidiary - - (379 ) (1,277 ) - (111 ) (1,651 ) - (3,418 )
Effect of foreign
currency exchange
difference - 329 12,952 13,742 333 4,511 213 - 32,080
September 30, 2013 $ - $ 55,098 $ 703,110 $ 695,145 $ 25,811 $ 207,698 $ 107,967 $ - $ 1,794,829

- 17 -
The above items of property, plant and equipment were depreciated on a straight-line basis at the following
rates per annum:
Building
Main buildings 20 years
Power system engineering 10 years
Furnishing 6 years
Others 3 years
Machinery and equipment 1 to 10 years
Leasehold improvement 3 to 40 years
Transportation equipment 4 to 6 years
Office equipment 1 to 6 years
Other equipment 1 to 10 years
Refer to Note 27 for the carrying amount of property, plant and equipment that had been pledged by the
Group to secure borrowings/general banking facilities granted to the Group.
12. OTHER INTANGIBLE ASSETS
September 30,
2013
December 31,
2012
September 30,
2012
January 1,
2012
Carrying amounts of each class
Trademarks $ 2,205 $ 2,032 $ 1,476 $ 1,439
Software 64,743 18,191 19,257 17,820
Others 3,832 3,887 3,951 4,274
$ 70,780 $ 24,110 $ 24,684 $ 23,533
Trademarks Software Others Total
Cost
January 1, 2012 $ 1,439 $ 27,896 $ 5,288 $ 34,623
Additions 38 6,475 - 6,513
Disposal - (530) - (530)
Effect of foreign currency exchange
differences
(1) (886) (162) (1,049)
September 30, 2012 $ 1,476 $ 32,955 $ 5,126 $ 39,557
January 1, 2013 $ 2,032 $ 33,311 $ 5,126 $ 40,469
Additions 346 57,583 - 57,929
Disposal - (1,158) - (1,158)
Effect of deconsolidation of
subsidiary
(98) - - (98)
Effect of foreign currency exchange
differences
1 1,519 190 1,710
September 30, 2013 $ 2,281 $ 91,255 $ 5,316 $ 98,852
(Continued)

- 18 -
Trademarks Software Others Total
Amortization
January 1, 2012 $ - $ 10,076 $ 1,014 $ 11,090
Amortization charge for the period - 4,302 193 4,495
Disposal - (351) - (351)
Effect of foreign currency exchange
differences
- (329) (32) (361)
September 30, 2012 $ - $ 13,698 $ 1,175 $ 14,873
January 1, 2013 $ - $ 15,120 $ 1,239 $ 16,359
Amortization charge for the period 76 11,599 198 11,873
Disposal - (817) - (817)
Effect of foreign currency exchange
difference
- 610 47 657
September 30, 2013 $ 76 $ 26,512 $ 1,484 $ 28,072
(Concluded)
The above items of other intangible assets were amortized on a straight-line basis at the following rates per
annum:
Software 5 to 10 years
Others 1 to 5 years
13. OTHER ASSETS
September 30,
2013
December 31,
2012
September 30,
2012
January 1,
2012
Current
Prepaid equipment $ - $ 304,407 $ 402,952 $ 500,484
Prepaid rent 170,411 198,090 158,701 106,544
Prepayment 74,853 37,603 14,286 8,593
Offset against business tax payable 13,897 56,488 22,629 33,982
Other prepayments 35,750 35,262 32,538 26,178
Others 12,071 12,721 15,098 11,374
$ 306,982 $ 644,571 $ 646,204 $ 687,155
Noncurrent
Prepaid equipment $ 153,647 $ - $ - $ -
Refundable deposits 414,161 377,695 342,668 273,728
Others 15,929 6,369 6,704 8,467
$ 583,737 $ 384,064 $ 349,372 $ 282,195
a. Prepaid equipment is due to purchasing new equipment for factory.
b. Prepaid rent is due to store lease arrangement.
c. Refundable deposits are for rental of store and factories.
- 19 -
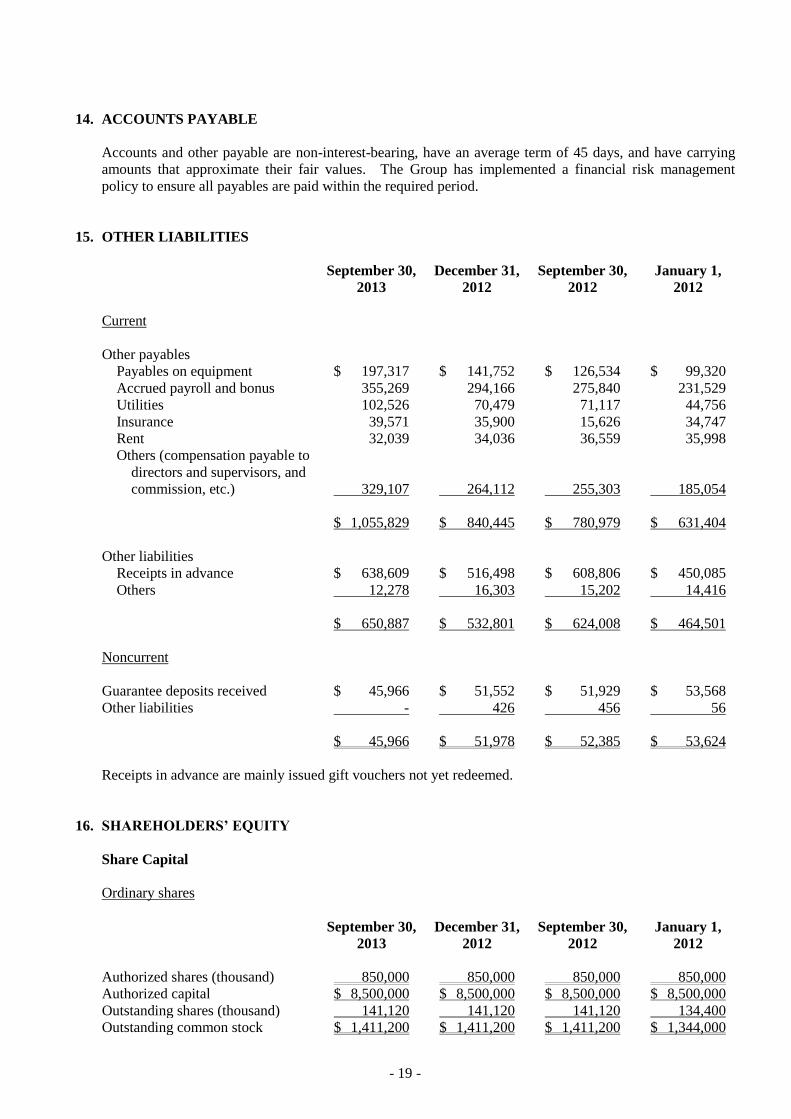
14. ACCOUNTS PAYABLE
Accounts and other payable are non-interest-bearing, have an average term of 45 days, and have carrying
amounts that approximate their fair values. The Group has implemented a financial risk management
policy to ensure all payables are paid within the required period.
15. OTHER LIABILITIES
September 30,
2013
December 31,
2012
September 30,
2012
January 1,
2012
Current
Other payables
Payables on equipment $ 197,317 $ 141,752 $ 126,534 $ 99,320
Accrued payroll and bonus 355,269 294,166 275,840 231,529
Utilities 102,526 70,479 71,117 44,756
Insurance 39,571 35,900 15,626 34,747
Rent 32,039 34,036 36,559 35,998
Others (compensation payable to
directors and supervisors, and
commission, etc.) 329,107 264,112 255,303 185,054
$ 1,055,829 $ 840,445 $ 780,979 $ 631,404
Other liabilities
Receipts in advance $ 638,609 $ 516,498 $ 608,806 $ 450,085
Others 12,278 16,303 15,202 14,416
$ 650,887 $ 532,801 $ 624,008 $ 464,501
Noncurrent
Guarantee deposits received $ 45,966 $ 51,552 $ 51,929 $ 53,568
Other liabilities - 426 456 56
$ 45,966 $ 51,978 $ 52,385 $ 53,624
Receipts in advance are mainly issued gift vouchers not yet redeemed.
16. SHAREHOLDERS’ EQUITY
Share Capital
Ordinary shares
September 30,
2013
December 31,
2012
September 30,
2012
January 1,
2012
Authorized shares (thousand) 850,000 850,000 850,000 850,000
Authorized capital $ 8,500,000 $ 8,500,000 $ 8,500,000 $ 8,500,000
Outstanding shares (thousand) 141,120 141,120 141,120 134,400
Outstanding common stock $ 1,411,200 $ 1,411,200 $ 1,411,200 $ 1,344,000

- 20 -
Capital Surplus
The premium from shares issued in excess of par (share premium from issuance of common shares and
treasury share transactions) may be used to offset a deficit; in addition, when the Company has no deficit,
such capital surplus may be distributed as cash dividends or transferred to capital (limited to a certain
percentage of the Company’s capital surplus and once a year).
The capital surplus from long-term investments, employee share options and share warrants may not be
used for any purpose.
Retained Earnings and Dividend Policy
The Company’s Articles of Incorporation provide that reserve should be set aside at 10% of annual net
income less any accumulated losses. In addition, a special reserve should be appropriated as needed.
The remainder of the income should be appropriated in the following order:
a. 3% or less as bonus to employees (including subsidiaries’ employees);
b. 1% or less as remuneration to directors and supervisors; and
c. The remainder of the earnings appropriated should not be less than 30% of the after-tax earnings. And
the cash dividends should not be less than 10% of the sum of cash dividends and stock dividends.
For the nine months ended September 30, 2013 and 2012, there were no accrual for bonus to employees and
the remuneration to directors and supervisors. Material differences between such estimated amounts and
the amounts proposed by the Board of Directors in the following year are adjusted for in the current year.
If the actual amounts subsequently resolved by the shareholders differ from the proposed amounts, the
differences are recorded in the year of shareholders’ resolution as a change in accounting estimate. If a
share bonus is resolved to be distributed to employees, the number of shares is determined by dividing the
amount of the share bonus by the fair value of the shares. The fair value of the shares refer to the closing
price (after considering the effect of cash and stock dividends) of the shares on the day immediately
preceding the shareholders’ meeting.
Based on a Rule No. 100116 issued by the Securities and Futures Bureau and Rule No. 0950000507 issued
by the FSC, certain amounts shall be transferred from unappropriated earnings to a special reserve before
any appropriation of earnings generated before January 1, 2012 shall be made. Any special reserve
appropriated may be reversed to the extent of the decrease in the net debit balance.
Under Rule No. 1010012865 issued by the FSC on April 6, 2012 and the directive titled “Questions and
Answers for Special Reserves Appropriated Following Adoption of IFRSs”, on the first-time adoption of
IFRSs, a company should appropriate and reverse a special reserve.
The appropriations of earnings for 2012 and 2011 were approved in the shareholders’ meeting held on June
11, 2013 and June 5, 2012, respectively. The appropriations and dividends per share were as follows:
Dividends Per Share
Appropriation of Earnings (Dollars)
2012 2011 2012 2011
Reserve $ 97,734 $ 112,108 $ - $ -
Special reserve 38,098 - - -
Cash dividends 705,600 537,600 5 4
- 21 -
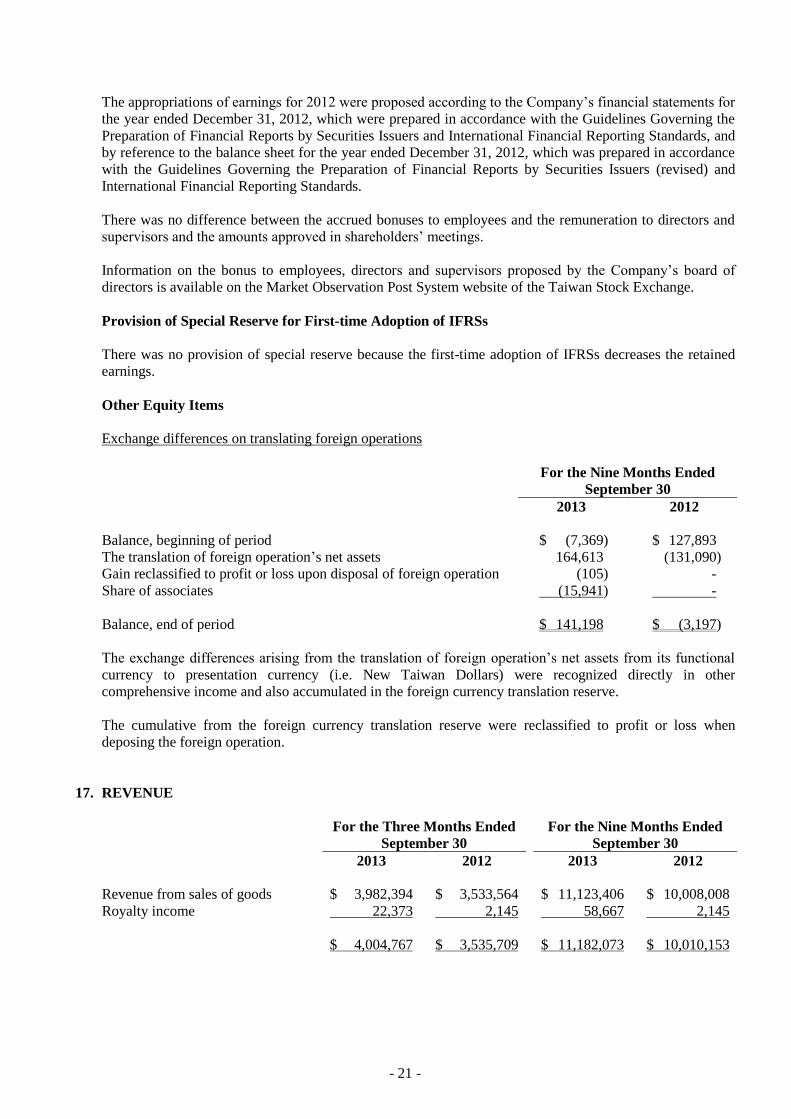
The appropriations of earnings for 2012 were proposed according to the Company’s financial statements for
the year ended December 31, 2012, which were prepared in accordance with the Guidelines Governing the
Preparation of Financial Reports by Securities Issuers and International Financial Reporting Standards, and
by reference to the balance sheet for the year ended December 31, 2012, which was prepared in accordance
with the Guidelines Governing the Preparation of Financial Reports by Securities Issuers (revised) and
International Financial Reporting Standards.
There was no difference between the accrued bonuses to employees and the remuneration to directors and
supervisors and the amounts approved in shareholders’ meetings.
Information on the bonus to employees, directors and supervisors proposed by the Company’s board of
directors is available on the Market Observation Post System website of the Taiwan Stock Exchange.
Provision of Special Reserve for First-time Adoption of IFRSs
There was no provision of special reserve because the first-time adoption of IFRSs decreases the retained
earnings.
Other Equity Items
Exchange differences on translating foreign operations
For the Nine Months Ended
September 30
2013 2012
Balance, beginning of period $ (7,369) $ 127,893
The translation of foreign operation’s net assets 164,613 (131,090)
Gain reclassified to profit or loss upon disposal of foreign operation (105) -
Share of associates (15,941) -
Balance, end of period $ 141,198 $ (3,197)
The exchange differences arising from the translation of foreign operation’s net assets from its functional
currency to presentation currency (i.e. New Taiwan Dollars) were recognized directly in other
comprehensive income and also accumulated in the foreign currency translation reserve.
The cumulative from the foreign currency translation reserve were reclassified to profit or loss when
deposing the foreign operation.
17. REVENUE
For the Three Months Ended
September 30
For the Nine Months Ended
September 30
2013 2012 2013 2012
Revenue from sales of goods $ 3,982,394 $ 3,533,564 $ 11,123,406 $ 10,008,008
Royalty income 22,373 2,145 58,667 2,145
$ 4,004,767 $ 3,535,709 $ 11,182,073 $ 10,010,153
- 22 -
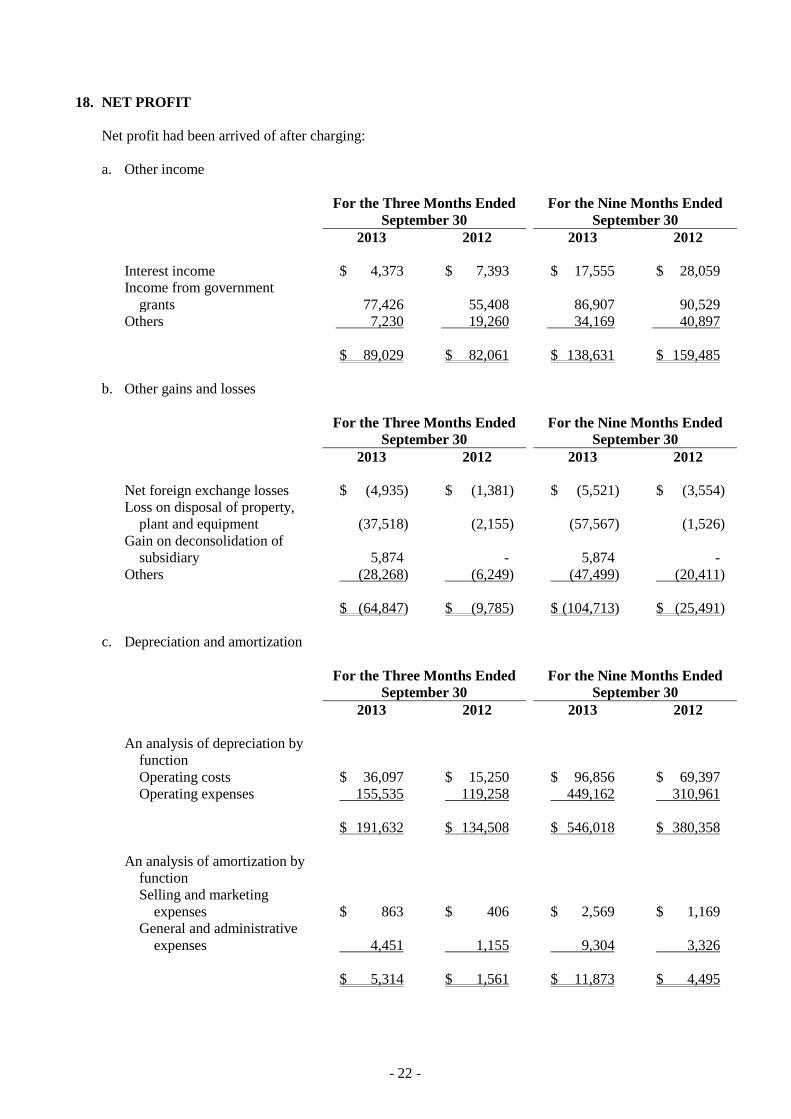
18. NET PROFIT
Net profit had been arrived of after charging:
a. Other income
For the Three Months Ended
September 30
For the Nine Months Ended
September 30
2013 2012 2013 2012
Interest income $ 4,373 $ 7,393 $ 17,555 $ 28,059
Income from government
grants
77,426 55,408 86,907 90,529
Others 7,230 19,260 34,169 40,897
$ 89,029 $ 82,061 $ 138,631 $ 159,485
b. Other gains and losses
For the Three Months Ended
September 30
For the Nine Months Ended
September 30
2013 2012 2013 2012
Net foreign exchange losses $ (4,935) $ (1,381) $ (5,521) $ (3,554)
Loss on disposal of property,
plant and equipment (37,518) (2,155) (57,567) (1,526)
Gain on deconsolidation of
subsidiary 5,874 - 5,874 -
Others (28,268) (6,249) (47,499) (20,411)
$ (64,847) $ (9,785) $ (104,713) $ (25,491)
c. Depreciation and amortization
For the Three Months Ended
September 30
For the Nine Months Ended
September 30
2013 2012 2013 2012
An analysis of depreciation by
function
Operating costs $ 36,097 $ 15,250 $ 96,856 $ 69,397
Operating expenses 155,535 119,258 449,162 310,961
$ 191,632 $ 134,508 $ 546,018 $ 380,358
An analysis of amortization by
function
Selling and marketing
expenses $ 863 $ 406 $ 2,569 $ 1,169
General and administrative
expenses 4,451 1,155 9,304 3,326
$ 5,314 $ 1,561 $ 11,873 $ 4,495
- 23 -
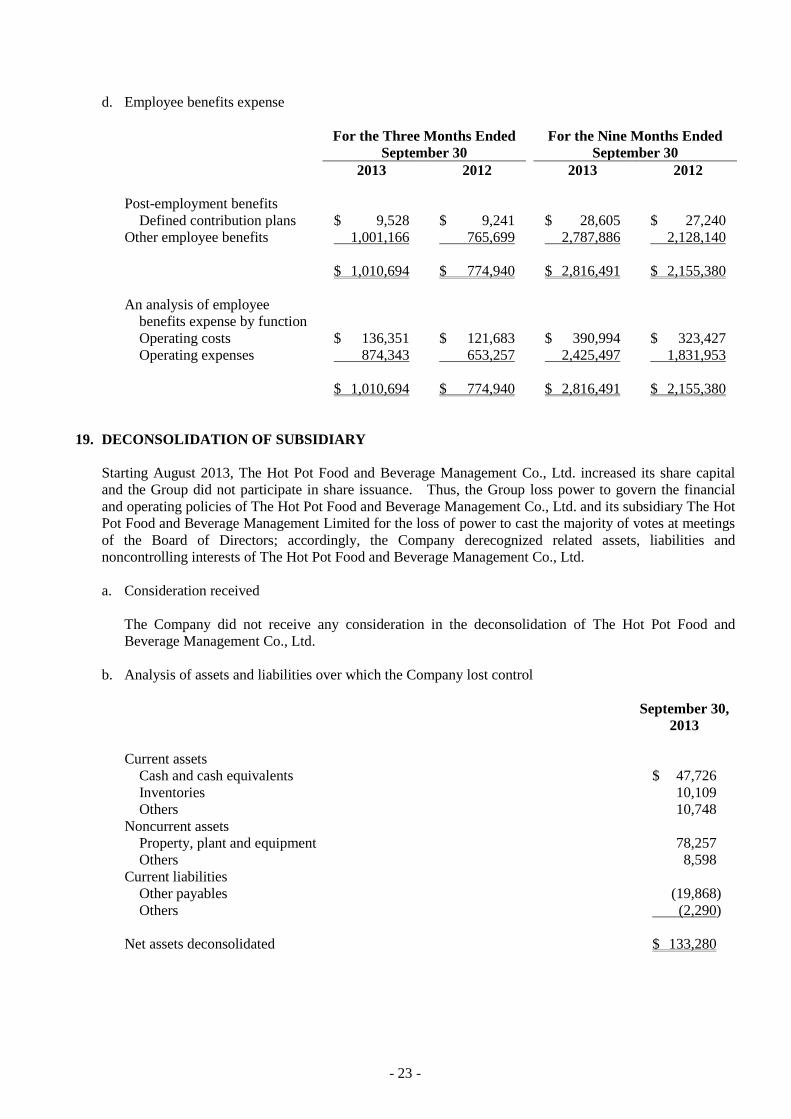
d. Employee benefits expense
For the Three Months Ended
September 30
For the Nine Months Ended
September 30
2013 2012 2013 2012
Post-employment benefits
Defined contribution plans $ 9,528 $ 9,241 $ 28,605 $ 27,240
Other employee benefits 1,001,166 765,699 2,787,886 2,128,140
$ 1,010,694 $ 774,940 $ 2,816,491 $ 2,155,380
An analysis of employee
benefits expense by function
Operating costs $ 136,351 $ 121,683 $ 390,994 $ 323,427
Operating expenses 874,343 653,257 2,425,497 1,831,953
$ 1,010,694 $ 774,940 $ 2,816,491 $ 2,155,380
19. DECONSOLIDATION OF SUBSIDIARY
Starting August 2013, The Hot Pot Food and Beverage Management Co., Ltd. increased its share capital
and the Group did not participate in share issuance. Thus, the Group loss power to govern the financial
and operating policies of The Hot Pot Food and Beverage Management Co., Ltd. and its subsidiary The Hot
Pot Food and Beverage Management Limited for the loss of power to cast the majority of votes at meetings
of the Board of Directors; accordingly, the Company derecognized related assets, liabilities and
noncontrolling interests of The Hot Pot Food and Beverage Management Co., Ltd.
a. Consideration received
The Company did not receive any consideration in the deconsolidation of The Hot Pot Food and
Beverage Management Co., Ltd.
b. Analysis of assets and liabilities over which the Company lost control
September 30,
2013
Current assets
Cash and cash equivalents $ 47,726
Inventories 10,109
Others 10,748
Noncurrent assets
Property, plant and equipment 78,257
Others 8,598
Current liabilities
Other payables (19,868)
Others (2,290)
Net assets deconsolidated $ 133,280

- 24 -
c. Gain on deconsolidation of subsidiary
Nine Months
Ended
September 30,
2013
Fair value of interest retained $ 106,775
Less: Carrying amount of interest retained
Net assets deconsolidated 133,280
Noncontrolling interests (32,274)
101,006
Add: Reclassified other equity to profit or loss 105
Gain on deconsolidation of subsidiary $ 5,874
Gain on deconsolidation of subsidiary was included in other gains and losses for the nine months ended
September 30, 2013.
d. Net cash outflow arising from deconsolidation of the subsidiary
Nine Months
Ended
September 30,
2013
The balance of cash and cash equivalents deconsolidated $ 47,726
20. INCOME TAX
a. Income tax recognized in profit or loss
The major components of tax expense were as follows:
For the Three Months Ended
September 30
For the Nine Months Ended
September 30
2013 2012 2013 2012
Current tax
In respect of the current
period $ 76,982 $ 93,719 $ 269,156 $ 338,565
In respect of prior periods (235) 2,241 3,506 3,721
76,747 95,960 272,662 342,286
Deferred tax
In respect of the current
period 5,241 9,373 (5,342) (18,667)
Income tax expense recognized
in profit or loss $ 81,988 $ 105,333 $ 267,320 $ 323,619

- 25 -
A reconciliation of accounting income and income tax expense used were as followed:
For the Nine Months Ended
September 30
2013 2012
Profit before income tax $ 766,954 $ 1,164,847
Income tax expense at the 25% statutory rate 191,739 291,212
Nondeductible expense in determining taxable income (7,555) (5,300)
Tax exempt income (12,304) -
Additional income tax on unappropriated earnings 32,379 33,574
Oversea earnings repatriate tax withholdings 8,373 -
Unrecognized temporary difference (3,156) 5,232
Unrecognized loss carryforward 56,356 19,414
Effect of tax rate in foreign countries (2,018) (24,234)
Adjustment for prior year’s tax 3,506 3,721
Income tax expense recognized in profit or loss $ 267,320 $ 323,619
The applicable tax rate used by the subsidiaries in ROC is 17%, while the applicable tax rate used by
subsidiaries in China is 25%. Tax rates used by other group entities operating in other jurisdictions are
based on the tax laws in those jurisdictions.
b. Except for the Company is tax-free, income tax returns through 2011 of Comestibles Master Co., Ltd.,
Mei Wei Master Co., Ltd. and Mei Wei Fu Xing had been examined and cleared by the Republic of
China (Taiwan)’s tax authorities. All other companies prepare their tax returns according to local law.
c. Comestibles Master Co., Ltd.’s profits on expansion projects had been approved by the Industrial
Development Bureau of the Ministry of Economic Affairs, ROC for exemption from income tax for
five years from December 31, 2011.
21. EARNINGS PER SHARE
For the Three Months Ended
September 30
For the Nine Months Ended
September 30
2013 2012 2013 2012
Basic earnings per share
From continuing operations $ 1.12 $ 1.81 $ 3.42 $ 5.77
The earnings and weighted average number of ordinary shares outstanding in the computation of earnings
per share were as follows:
Net profit for the period
For the Three Months Ended
September 30
For the Nine Months Ended
September 30
2013 2012 2013 2012
Earnings used in computation of
basic earnings per share $ 157,618 $ 255,055 $ 482,410 $ 814,004

- 26 -
Share (thousand)
For the Three Months Ended
September 30
For the Nine Months Ended
September 30
2013 2012 2013 2012
Weighted average number of
ordinary shares used in the
computation of diluted earnings
per share 141,120 141,120 141,120 141,120
22. NON-CASH TRANSACTIONS
For the nine months ended September 30, 2013 and 2012, the Group entered into the following non-cash
investing which were not reflected in the consolidated statement of cash flows:
a. The Group acquired $1,084,347 thousand of property, plant and equipment with an aggregate fair value,
other payables total decrease $64,925 thousand. Net cash used in acquiring property, plant and
equipment was $1,019,422 thousand in the nine months ended September 30, 2013. (Please refer to
Note 11)
b. The Group acquired $863,365 thousand of property, plant and equipment with an aggregate fair value,
other payables total decrease $27,214 thousand. Net cash used in acquiring property, plant and
equipment was $836,151 thousand in the nine months ended September 30, 2012. (Please refer to
Note 11)
23. OPERATING LEASE ARRANGEMENTS
The future minimum lease payments of non-cancellable operating lease commitments were as follows:
September 30,
2013
December 31,
2012
September 30,
2012
January 1,
2012
Not later than 1 year $ 1,576,269 $ 1,691,242 $ 1,504,590 $ 1,280,746
Later than 1 year and not later than
5 years 3,361,115
4,110,622
3,782,800
3,619,803
Later than 5 years 343,704 589,571 581,183 53,343
$ 5,281,088 $ 6,391,435 $ 5,868,573 $ 4,953,892
Refer to Note 21 to the consolidated financial statements as of March 31, 2013 for information on other
operating lease arrangements.
24. CAPITAL MANAGEMENT
Management followed the same objectives, policies and process for managing capital, and capital structures
of consolidated financial statements in these consolidated financial statements as were applied in the
preparation of the consolidated financial statements for the three months ended March 31, 2013. Refer to
Note 22 to the consolidated financial statements as of March 31, 2013 for details.

- 27 -
25. FINANCIAL INSTRUMENTS
a. Fair value of financial instruments
1) Fair value of financial instruments not carried at fair value
The management considers that the carrying amount of financial assets and financial liabilities
recognized in the condensed consolidated financial statements approximate their fair values.
2) Fair value measurements recognized in the consolidated balance sheets
The following table provides an analysis of financial instruments that are measured subsequent to
initial recognition at fair value, grouped into Levels 1 to 3 based on the degree to which the fair
value is observable:
Level 1 fair value measurements are those derived from quoted prices (unadjusted) in active
markets for identical assets or liabilities are as follows:
September 30,
2013
December 31,
2012
September 30,
2012
January 1,
2012
Financial assets at fair value
through profit or loss $ 8,393 $ 9,202 $ 9,339 $ 9,376
Level 2 fair value measurements are those derived from inputs other than quoted prices included
within Level 1 that are observable for the asset or liability, either directly or indirectly.
Level 3 fair value measurements are those derived from valuation techniques that include inputs
for the asset or liability that are not based on observable market data.
There were no transfers between Level 1 and 2 in the current and prior periods.
3) Valuation techniques and assumptions applied for the purposes of measuring fair value
The fair values of financial assets and financial liabilities were determined as follows:
The fair values of financial assets and financial liabilities with standard terms and conditions
and traded in active liquid markets are determined with reference to quoted market prices
(includes listed redeemable bonds, bills of exchange, corporate bonds and perpetual notes).
Where such prices were not available, valuation techniques were applied. The estimates and
assumptions used by the Group are consistent with those that market participants would use in
setting a price for the financial instrument.
The fair values of other financial assets and financial liabilities (excluding those described
above) are determined in accordance with generally accepted pricing models based on
discounted cash flow analysis.
b. Categories of financial instruments
September 30, 2013 December 31, 2012 September 30, 2012 January 1, 2012
Carrying
Amount Fair Value
Carrying
Amount Fair Value
Carrying
Amount Fair Value
Carrying
Amount Fair Value
Financial assets
Loans and receivables
(Note 1) $ 3,155,526 $ 3,155,526 $ 3,564,860 $ 3,564,860 $ 3,786,094 $ 3,786,094 $ 4,377,942 $ 4,377,942
Fair value through profit or
loss (FVTPL)
Designated as at FVTPL 8,393 13,605 9,202 14,346 9,339 14,136 9,376 12,571
Financial liabilities
Amortized cost (Note 2) 1,825,841 1,825,841 1,587,291 1,587,291 1,605,991 1,605,991 1,387,611 1,387,611

- 28 -
Note 1: The balances included loans and receivables measured at amortized cost, which comprise cash
and cash equivalents, debt investments with no active market, and trade and other receivables.
Note 2: The balances included financial liabilities measured at amortized cost, which notes payable,
trade and other payables, and long-term borrowings.
c. Financial risk management objectives and policies
The Group’s major financial instruments included equity and borrowings, trade receivables and trade
payables. The Group’s Corporate Treasury function provides services to the business, coordinates
access to domestic and international financial markets, monitors and manages the financial risks
relating to the operations of the Group through internal risk reports which analyze exposures by degree
and magnitude of risks. These risks include market risk, credit risk and liquidity risk.
The Corporation treasury function reported quarterly to the Group’s risk management committee, an
independent body that monitors risks and policies implemented to mitigate risk exposures.
1) Market risk
Foreign currency risk
The Company’s primary financial risk is foreign exchange risk. There is no change of financial
instrument market risk and exposure of management and measurement since prior period.
The Company’s monetary assets and liabilities on balance sheet date are detailed in Note 29.
Exchange rate risk
Several subsidiaries of the Company had foreign currency deposits, which exposed the Group to
foreign currency risk.
The carrying amounts of the Group’s foreign currency denominated monetary assets and monetary
liabilities (including those eliminated on consolidation) at the end of the reporting period were as
follows:
(In Thousands of U.S. Dollars)
September 30,
2013
December 31,
2012
September 30,
2012
January 1,
2012
Assets
USD $ 20,256 $ 10,703 $ 10,926 $ 14,810
Interest rate risk
The Group was exposed to interest rate risk because entities in the Group had time deposits and
borrowed fund at both fixed and floating interest rates.
The carrying amount of the Group’s financial assets and financial liabilities with exposure to
interest rates at the end of the reporting period were as follows:
September 30,
2013
December 31,
2012
September 30,
2012
January 1,
2012
Cash flow interest rate risk
Financial assets $ 214,305 $ 738,959 $ 345,957 $ 666,907
Financial liabilities 367 668 767 1,041

- 29 -
The sensitivity analysis about interest rate is on the basis of fix rate of fair value financial asset and
liability on financial report date. As the rate raise for one percentage, the cash inflow on nine
months ended September 30, 2013 is $2,139 thousand.
2) Credit risk
At the end of the reporting period, the Group’s maximum exposure to credit risk which will cause a
financial loss to the Group due to failure to discharge an obligation by the counterparties is arising
from the carrying amount of the respective recognized financial assets as stated in the condensed
balance sheet.
Most of the Group’s counterparties are franchisees traded for a long-term, and the Group monitors
trade receivables from franchisees continuously. So impairment loss recognized on trade
receivables was not significant. Trade receivables consisted of a large number of customers and
spread across diverse industries between geographical areas. Therefore the Group assessed that
the concentration of credit risk was limited.
The concentration of credit risk with counterparties was never more than 10 percent of
non-monetary assets.
Credit risk refers to the risk that counterparty will default on its contractual obligations resulting in
financial loss to the Group. Because most counterparties of excess liquidity are banks monitored
by regulators in the People’s Republic of China and Republic of China, the credit risk is limited.
3) Liquidity risk
The working capital of the Group is enough to afford the contract so there is no risk of liquidity.
26. TRANSACTIONS WITH RELATED PARTY
Balances and transactions between the Company and its subsidiaries, which were related parties of the
Company, have been eliminated on consolidation and are not disclosed in this note. Details of
transactions between the Group and other related parties are disclosed below.
a. Trading transactions
For the Three Months Ended
September 30
For the Nine Months Ended
September 30
2013 2012 2013 2012
Sale of goods
Joint ventures $ 2,532 $ 6,123 $ 8,454 $ 6,123
Purchase of goods
Related party $ 27,291 $ 32,301 $ 87,412 $ 104,376
Other income
Joint ventures $ 1,038 $ 2,152 $ 2,955 $ 2,168
There is no significant difference of sales between the relationship and customers. The purchase price
is 65% of the sale price, 30 days after monthly payment.

- 30 -
The following balances of trade receivables from related parties were outstanding at the end of the
reporting period:
September 30,
2013
December 31,
2012
September 30,
2012
January 1,
2012
Trade receivables
Joint ventures $ 942 $ 610 $ 1,375 $ -
Others receivables
Joint ventures $ 279 $ 2,319 $ 2,301 $ -
b. Compensation of key management personnel
The remuneration of directors and other members of key management personnel for the nine months
ended September 30, 2013 and 2012 were as follows:
For the Three Months Ended
September 30
For the Nine Months Ended
September 30
2013 2012 2013 2012
Short-term benefits $ 2,463 $ 8,642 $ 23,790 $ 24,096
The remuneration of directors and key executives was determined by the remuneration committee
having regard to the performance of individuals and market trends.
27. ASSETS PLEDGED AS COLLATERAL OR FOR SECURITY
The assets pledged or mortgaged as collaterals for bank borrowings were as follows:
September 30,
2013
December 31,
2012
September 30,
2012
January 1,
2012
Property, plant and equipment
Land $ 202,305 $ 202,305 $ 202,305 $ 202,305
Buildings 14,024 14,818 15,083 15,876
Transporation equipment 1,190 1,401 1,454 1,557
Bond investments with no active
market - current
Trust fund account - 5,002 - 772
Bond investments with no active
market - noncurrent
Restricted bank deposits - 1,700 1,700 1,700
$ 217,519 $ 225,226 $ 220,542 $ 222,210

- 31 -
28. SIGNIFICANT CONTINGENT LIABILITIES AND UNRECOGNIZED COMMITMENTS
In addition to those disclosed in other notes, significant commitments and contingencies of the Group as of
September 30, 2013, December 31, 2012, September 30, 2012 and January 1, 2012 were as follows:
Significant Commitments
a. As of September 30, 2013, December 31, 2012, September 30, 2012 and January 1, 2012, unused letters
of credit for purchases of raw materials and machinery and equipment amounted to approximately
US$2,000 thousand, US$2,000 thousand, US$2,000 thousand, US$1,894 thousand and €928 thousand,
respectively.
b. Unrecognized commitments are as follows:
September 30,
2013
December 31,
2012
September 30,
2012
January 1,
2012
Acquisition of property, plant
and equipment $ 89,828 $ 154,284 $ 152,645 $ 38,348
29. EXCHANGE RATE OF FINANCIAL ASSETS AND LIABILITIES DENOMINATED IN
FOREIGN CURRENCIES
The significant financial assets and liabilities denominated in foreign currencies were as follows:
September 30, 2013
Foreign
Currencies Exchange Rate
Carrying
Amount
Financial assets
Monetary items
USD $ 20,256 6.148
(USD:RMB)
$ 601,881
December 31, 2012
Foreign
Currencies Exchange Rate
Carrying
Amount
Financial assets
Monetary items
USD
$ 10,703
6.2855
(USD:RMB)
$ 315,594
September 30, 2012
Foreign
Currencies Exchange Rate
Carrying
Amount
Financial assets
Monetary items
USD
$ 10,926
6.341
(USD:RMB)
$ 322,853
- 32 -
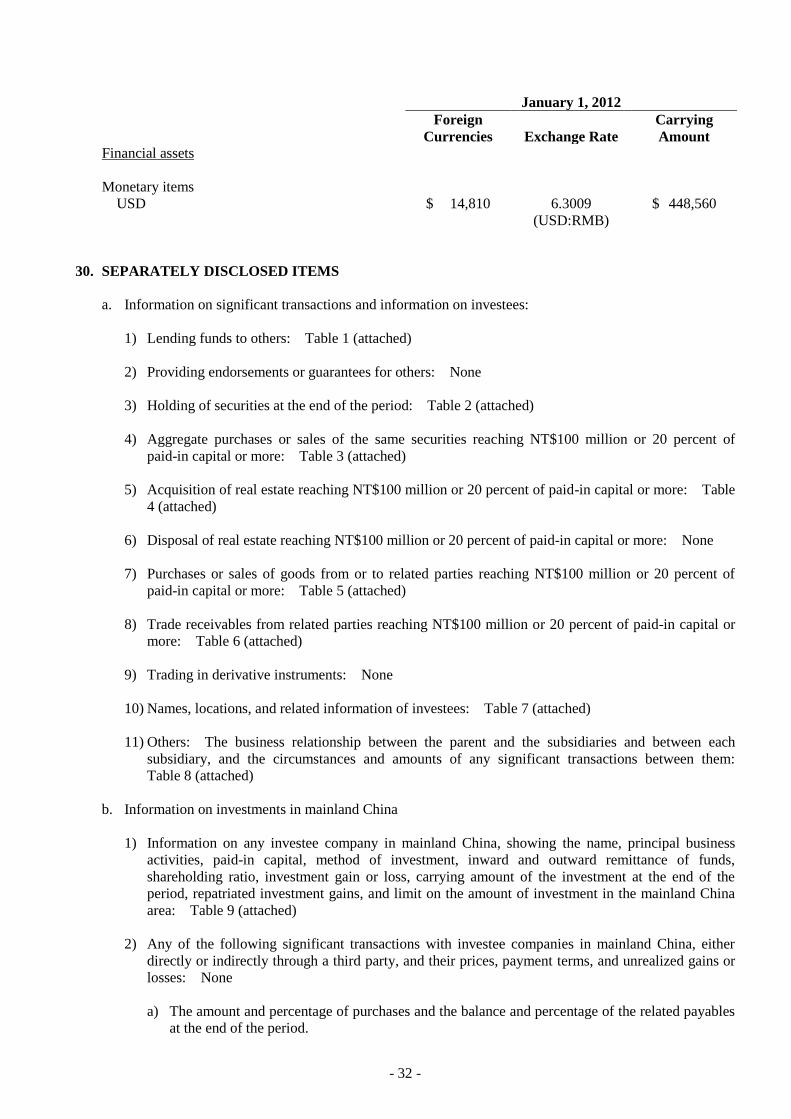
January 1, 2012
Foreign
Currencies Exchange Rate
Carrying
Amount
Financial assets
Monetary items
USD $ 14,810 6.3009
(USD:RMB)
$ 448,560
30. SEPARATELY DISCLOSED ITEMS
a. Information on significant transactions and information on investees:
1) Lending funds to others: Table 1 (attached)
2) Providing endorsements or guarantees for others: None
3) Holding of securities at the end of the period: Table 2 (attached)
4) Aggregate purchases or sales of the same securities reaching NT$100 million or 20 percent of
paid-in capital or more: Table 3 (attached)
5) Acquisition of real estate reaching NT$100 million or 20 percent of paid-in capital or more: Table
4 (attached)
6) Disposal of real estate reaching NT$100 million or 20 percent of paid-in capital or more: None
7) Purchases or sales of goods from or to related parties reaching NT$100 million or 20 percent of
paid-in capital or more: Table 5 (attached)
8) Trade receivables from related parties reaching NT$100 million or 20 percent of paid-in capital or
more: Table 6 (attached)
9) Trading in derivative instruments: None
10) Names, locations, and related information of investees: Table 7 (attached)
11) Others: The business relationship between the parent and the subsidiaries and between each
subsidiary, and the circumstances and amounts of any significant transactions between them:
Table 8 (attached)
b. Information on investments in mainland China
1) Information on any investee company in mainland China, showing the name, principal business
activities, paid-in capital, method of investment, inward and outward remittance of funds,
shareholding ratio, investment gain or loss, carrying amount of the investment at the end of the
period, repatriated investment gains, and limit on the amount of investment in the mainland China
area: Table 9 (attached)
2) Any of the following significant transactions with investee companies in mainland China, either
directly or indirectly through a third party, and their prices, payment terms, and unrealized gains or
losses: None
a) The amount and percentage of purchases and the balance and percentage of the related payables
at the end of the period.

- 33 -
b) The amount and percentage of sales and the balance and percentage of the related receivables at
the end of the period.
c) The amount of property transactions and the amount of the resultant gains or losses.
d) The balance of negotiable instrument endorsements or guarantees or pledges of collateral at the
end of the period and the purposes.
e) The highest balance, the end of period balance, the interest rate range, and total current period
interest with respect to financing of funds.
f) Other transactions that have a material effect on the profit or loss for the period or on the
financial position, such as the rendering or receiving of services.
31. SEGMENT INFORMATION
Information reported to the chief operating decision maker for the purposes of resource allocation and
assessment of segment performance focuses on the types of goods or services delivered or provided. The
Group’s principal geographical areas are China and Taiwan.
a. Revenue from major products and services
The following is an analysis of the Group’s revenue from continuing operations categorized by major
products and services:
For the Three Months Ended
September 30
For the Nine Months Ended
September 30
2013 2012 2013 2012
Beverages $ 1,089,380 $ 952,328 $ 3,144,890 $ 2,822,758
Cake 1,577,418 1,344,844 3,964,199 3,314,752
Bread 1,311,767 1,226,591 3,990,197 3,787,807
Others 26,202 11,946 82,787 84,836
$ 4,004,767 $ 3,535,709 $ 11,182,073 $ 10,010,153
b. Geographical information
The Group’s revenue from continuing operations from external customers by geographical location are
detailed below:
Revenue from External
Customers
For the Nine Months Ended
September 30
2013 2012
China $ 8,102,362 $ 6,922,229
Taiwan 2,413,930 2,556,193
USA 510,433 378,644
Others 155,348 153,087
$ 11,182,073 $ 10,010,153
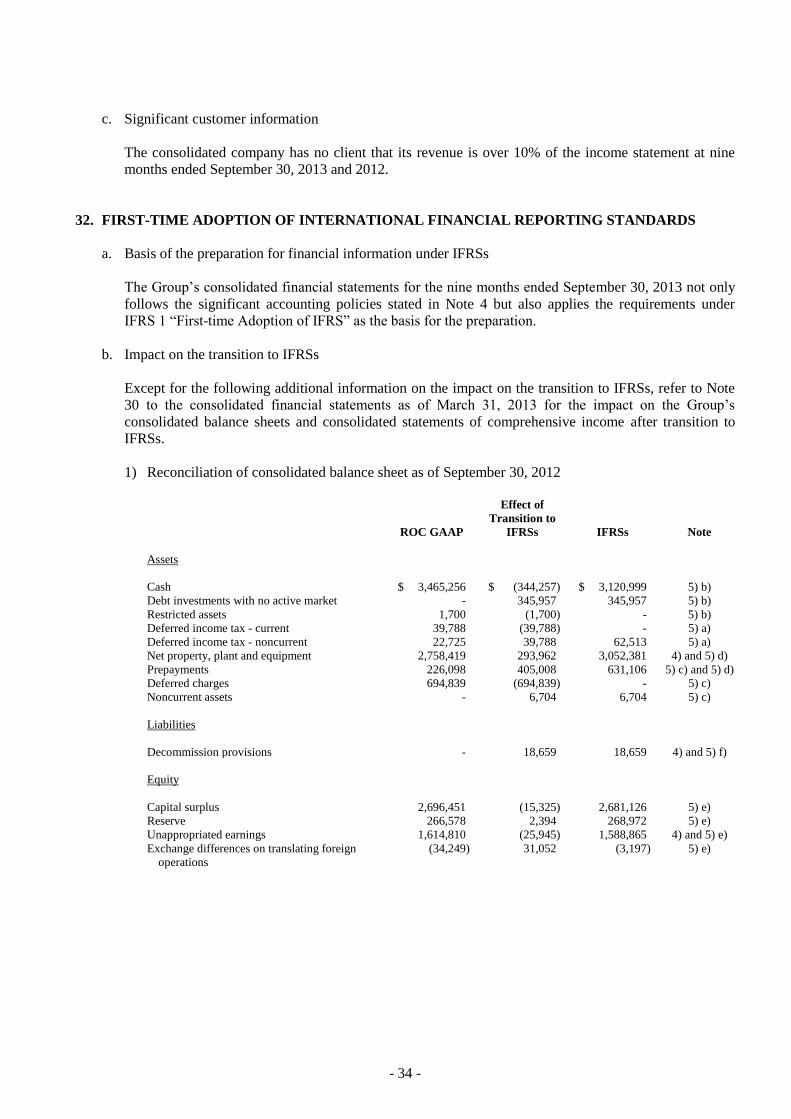
- 34 -
c. Significant customer information
The consolidated company has no client that its revenue is over 10% of the income statement at nine
months ended September 30, 2013 and 2012.
32. FIRST-TIME ADOPTION OF INTERNATIONAL FINANCIAL REPORTING STANDARDS
a. Basis of the preparation for financial information under IFRSs
The Group’s consolidated financial statements for the nine months ended September 30, 2013 not only
follows the significant accounting policies stated in Note 4 but also applies the requirements under
IFRS 1 “First-time Adoption of IFRS” as the basis for the preparation.
b. Impact on the transition to IFRSs
Except for the following additional information on the impact on the transition to IFRSs, refer to Note
30 to the consolidated financial statements as of March 31, 2013 for the impact on the Group’s
consolidated balance sheets and consolidated statements of comprehensive income after transition to
IFRSs.
1) Reconciliation of consolidated balance sheet as of September 30, 2012
ROC GAAP
Effect of
Transition to
IFRSs IFRSs Note
Assets
Cash $ 3,465,256 $ (344,257) $ 3,120,999 5) b)
Debt investments with no active market - 345,957 345,957 5) b)
Restricted assets 1,700 (1,700) - 5) b)
Deferred income tax - current 39,788 (39,788) - 5) a)
Deferred income tax - noncurrent 22,725 39,788 62,513 5) a)
Net property, plant and equipment 2,758,419 293,962 3,052,381 4) and 5) d)
Prepayments 226,098 405,008 631,106 5) c) and 5) d)
Deferred charges 694,839 (694,839) - 5) c)
Noncurrent assets - 6,704 6,704 5) c)
Liabilities
Decommission provisions - 18,659 18,659 4) and 5) f)
Equity
Capital surplus 2,696,451 (15,325) 2,681,126 5) e)
Reserve 266,578 2,394 268,972 5) e)
Unappropriated earnings 1,614,810 (25,945) 1,588,865 4) and 5) e)
Exchange differences on translating foreign
operations
(34,249) 31,052 (3,197) 5) e)

- 35 -
2) Reconciliation of consolidated statement of comprehensive income for the nine months ended
September 30, 2012
Effect of
Transition to
ROC GAAP IFRSs IFRSs Note
Operating revenue $ 9,945,093 $ 65,060 $ 10,010,153 5) e)
Operating cost (4,438,030) (29,036) (4,467,066) 5) e)
Operating expenses (4,468,400) (31,289) (4,499,689) 5) e) and 5) f)
Other income and expenses 120,713 736 121,449 5) e)
Income tax expense (321,425) (2,194) (323,619) 5) e)
Income for non-controlling interest, net of tax (27,047) (177) (27,224) 5) e)
Net income 810,904 3,100 814,004
Other comprehensive income
Exchange differences on translating foreign
operations
5,609
(136,699)
(131,090)
5) e)
Net comprehensive income $ 816,513 $ (133,599) $ 682,914
3) Reconciliation of consolidated statement of comprehensive income for the three months ended
September 30, 2012
Effect of
Transition to
ROC GAAP IFRSs IFRSs Note
Operating revenue $ 3,451,847 $ 83,862 $ 3,535,709 5) e)
Operating cost (1,560,698) (37,403) (1,598,101) 5) e)
Operating expenses (1,589,904) (39,418) (1,629,322) 5) e) and 5) f)
Other income and expenses 61,689 1,503 63,192 5) e)
Income tax expense (102,614) (2,719) (105,333) 5) e)
Income for non-controlling interest, net of tax (10,863) (227) (11,090) 5) e)
Net income 249,457 5,598 255,055
Other comprehensive income
Exchange differences on translating foreign
operations
1,926
(40,013)
(38,087)
5) e)
Net comprehensive income $ 251,383 $ (34,415) $ 216,968
4) Exemptions from IFRS 1
The exemptions adopted by the Group on January 1, 2012 were the same as those indicated in the
consolidated financial statements as of March 31, 2013. Refer to the Note 30 to the consolidated
financial statements as of March 31, 2013 for detail information.
5) Explanations of significant reconciling items in the transition to IFRSs
The significant differences between ROC GAAP and under IFRSs were as follows:
a) Deferred tax assets/liabilities
Under ROC GAAP, valuation allowances is provided to the extent, if any, that it is more likely
than not that deferred income tax assets will not be realized. In accordance with IAS No 12,
“Income Taxes,” deferred tax assets are only recognized to the extent that it is probable that
there will be sufficient taxable profits, and valuation allowance account is not used.
In addition, under ROC GAAP, a deferred tax asset and deferred tax liability are classified as
current or noncurrent in accordance with the classification of the related asset or liability.
However, if a deferred income tax asset does not relate to an asset in the financial statements, it
is classified as either current or noncurrent based on the expected length of time before it is
realized or settled. Under IFRSs, deferred tax asset are classified as noncurrent asset.

- 36 -
b) Classification of time deposit
Under ROC GAAP, the time deposit that can be terminated at any time without prejudice to the
principal is classified under cash. After transferring to IFRSs, the time deposit for short-term
cash commitments is classified under cash, and the rest of time deposit is transferred to bond
investments with not active market.
c) Classification of deferred charges
Under ROC GAAP, deferred charges are reclassified under assets. Under IFRSs, deferred
charges are reclassified as property, plant and equipment, and prepaid expenses according to
their nature.
d) Classification of prepayments for equipment
Under ROC GAAP, prepayments for equipment are classified under property, plant and
equipment. Under IFRSs, prepayments for equipment are classified as other prepayments, and
according to the expected realization of the assets, the prepayments are classified as current
assets or noncurrent assets.
e) Presentation currency
When the consolidated financial statements are translated from functional currency - RMB
dollar to presentation currency - N.T. dollar, except for the share capital that is translated to
NT$10 per share at the historical exchange rate, the other items of financial statements are
translated at the exchange rates on the balance sheet date. Exchange differences resulting from
translation to presentation currency are recognized in the cumulative translation adjustments.
Under IFRSs, exchange rates used for the translation to presentation currency are the same as
those used in the translation of different foreign functional currency. Assets and liabilities are
translated at the exchange rate on the balance sheet date. Equity items are translated at
historical exchange rates, and income and expense items are translated at the average exchange
rate for the period. The exchange differences resulting from translation of financial statements
are recognized in the cumulative translation adjustments.
f) Decommissioning liabilities of property, plant and equipment cost
Under IFRSs, decommissioning, restoration and similar liabilities should be recognized as
addition to the cost of related assets, and depreciated over the estimated useful life.

- 37 -
TABLE 1
GOURMET MASTER CO. LTD. AND SUBSIDIARIES
LENDING FUNDS TO OTHERS
SEPTEMBER 30, 2013
(In Thousands of New Taiwan Dollars, Unless Stated Otherwise)
No. Financing Company
Name Counter-party
Financial Statement
Account
Maximum
Balance for the
Period
Ending
Balance Balance Used
Interest Rate
%
Financing
Provided
(Note 3)
Transaction
Amounts
Reasons for
Short-term
Financing
Allowance for
Bad Debt
Collateral Financing
Limit for Each
Borrowing
Company
Financing
Company’s
Financing
Amount Limits
Item Value
1 Shanghai Gourmet Master
Food & Beverage Ltd.
Zhejiang 85 Food & Beverage
Ltd.
Other receivable - related
parties
$ 48,330
(RMB 10,000)
$ -
$ - 3.75 For short-term
financing
$ - Working capital
loan
$ - - $ - $ 603,431 $ 1,206,862
Shenzheng 85 Food &
Beverage Ltd.
Other receivable - related
parties
48,330
(RMB 10,000)
-
- 3.75 For short-term
financing
- Working capital
loan
- - - 603,431 1,206,862
Wuhan Jing Way Food &
Beverage Ltd.
Other receivable - related
parties
96,660
(RMB 20,000)
96,660
(RMB 20,000)
96,660
(RMB 20,000)
3.75 For short-term
financing
- Working capital
loan
- - - 603,431 1,206,862
Sheng-Pin (Shenzheng) Food
Ltd.
Other receivable - related
parties
72,495
(RMB 15,000)
72,495
(RMB 15,000)
48,330
(RMB 10,000)
3.75 For short-term
financing
- Working capital
loan
- - - 603,431 1,206,862
Sheng-Pin (Wuhan) Food Ltd. Other receivable - related
parties
57,996
(RMB 12,000)
57,996
(RMB 12,000)
57,996
(RMB 12,000)
3.75 For short-term
financing
- Working capital
loan
- - - 603,431 1,206,862
Sheng-Pin (Shanghai) Food
Ltd.
Other receivable - related
parties
96,660
(RMB 20,000)
96,660
(RMB 20,000)
96,660
(RMB 20,000)
3.75 For short-term
financing
- Working capital
loan
- - - 603,431 1,206,862
2 He-Shia Food & Beverage
Ltd.
Sheng-Pin (Xiamen) Food Ltd. Other receivable - related
parties
72,495
(RMB 15,000)
48,330
(RMB 10,000)
- 3.75 For short-term
financing
- Working capital
loan
- - - 603,431 1,206,862
Fuzhou 85 Food & Beverage
Ltd.
Other receivable - related
parties
96,660
(RMB 20,000)
24,165
(RMB 5,000)
- 3.75 For short-term
financing
- Working capital
loan
- - - 603,431 1,206,862
Beijing 85 Food & Beverage
Ltd.
Other receivable - related
parties
193,320
(RMB 40,000)
193,320
(RMB 40,000)
193,320
(RMB 40,000)
3.75 For short-term
financing
- Working capital
loan
- - - 603,431 1,206,862
Sheng-Pin (Beijing) Food Ltd. Other receivable - related
parties
72,495
(RMB 15,000)
72,495
(RMB 15,000)
72,495
(RMB 15,000)
3.75 For short-term
financing
- Working capital
loan
- - - 603,431 1,206,862
Sheng-Pin (Shanghai) Food
Ltd.
Other receivable - related
parties
96,660
(RMB 20,000)
96,660
(RMB 20,000)
- 3.75 For short-term
financing
- Working capital
loan
- - - 603,431 1,206,862
Zhejiang 85 Food & Beverage
Ltd.
Other receivable - related
parties
24,165
(RMB 5,000)
24,165
(RMB 5,000)
-
3.75 For short-term
financing
- Working capital
loan
- - - 603,431 1,206,862
Shenzheng 85 Food &
Beverage Ltd.
Other receivable - related
parties
48,330
(RMB 10,000)
48,330
(RMB 10,000)
- 3.75 For short-term
financing
- Working capital
loan
- - - 603,431 1,206,862
3 Comestibles Master Co.,
Ltd.
Perfect 85 Degrees C, Inc. Other receivable - related
parties
163,423
(US$ 5,500)
163,423
(US$ 5,500)
163,423
(US$ 5,500)
3.75 For short-term
financing
- Working capital
loan
- - - 603,431 1,206,862
WinPin 85 Investments Inc. Other receivable - related
parties
53,484
(US$ 1,800)
53,484
(US$ 1,800)
53,484
(US$ 1,800)
3.75 For short-term
financing
- Working capital
loan
- - - 603,431 1,206,862
Perfect 85 Degrees C, Inc. Other receivable - related
parties
53,484
(US$ 1,800)
53,484
(US$ 1,800)
53,484
(US$ 1,800)
3.75 For short-term
financing
- Working capital
loan
- - - 603,431 1,206,862
Note: According to Gourmet Master Co. Ltd. financing provided procedure the limit of amount is calculated as follow:
1. The total amount for lending for funding for a short-term period shall not exceed forty percent (40%) of the net worth of Gourmet Master Co. Ltd., which was reviewed by CPA. While subsidiaries whose voting shares are 100% owned directly or indirectly, by Gourmet Master Co. Ltd.
are not subject to the above restrictions.
$6,034,309 × 40% = $2,413,724 (in thousands).
2. The total amount for lending to a company for a short-term period shall not exceed twenty percent (20%) of the net worth of Gourmet Master Co. Ltd., and the amount shall not exceed the amount of transaction.
$6,034,309 × 20% = $1,206,862 (in thousands).
3. The total amount for lending to a company for funding for a short-term period shall not exceed $6,034,309 (in thousands) x 20% = $1,206,862 (in thousands) of the net worth of Gourmet Master Co. Ltd. The total amount for lending to a company for funding for a short-term period shall
not exceed $6,034,309 (in thousands) x 10% = $603,431 (in thousands) of the net worth of Gourmet Master Co. Ltd.
4. Transaction above is already written off in consolidated financial statements.

- 38 -
TABLE 2
GOURMET MASTER CO. LTD. AND SUBSIDIARIES
HOLDING OF SECURITIES AT THE END OF THE PERIOD
SEPTEMBER 30, 2013
(In Thousands of New Taiwan Dollars)
Holding Company Marketable Securities Type and
Issuer/Name
Security Issuer’s Relationship
with the Holding Company Financial Statement Account
September 30, 2013
Note Shares/Units Carrying Amount
Percentage of
Ownership
Market Value or
Net Asset Value
Unlisted stock
Gourmet Master Co. Ltd. 85 Degree Co., Ltd. Subsidiary Investments accounted for by the
equity method
12,899,078 $ 1,297,795 100 $ 1,297,795
Prime Scope Trading Limited Subsidiary Investments accounted for by the
equity method
46,742,963 4,018,360 100 4,018,360
Prefect 85 Degree C, Inc. Subsidiary Investments accounted for by the
equity method
4,301,000 256,937 100 256,937 Note
85 Degrees Café International Pty.
Ltd.
Subsidiary Investments accounted for by the
equity method
1,785,000 37,769 51 37,769 Note
Lucky Bakery Limited Subsidiary Investments accounted for by the
equity method
5,500,000 131,110 100 131,110
WinPin 85 Investments, Inc. Subsidiary Investments accounted for by the
equity method
5,300,000 147,993 100 147,993 Note
Mutual funds
85 Degrees Café International
Pty. Ltd.
Merrill Lynch 6-Year AUD
Australian Companies Dual High
Yield Accrual
NA Financial assets at FVTPL -
current
5,000 8,393 - 13,605
Unlisted company
Perfect 85 Degrees C, Inc. Golden 85 Investments, LLC Subsidiary Investments accounted for by the
equity method
- 51,217 65 51,217 Note
Lucky Bakery Limited Profit Sky International Limited Investee accounted for using
equity method
Investments accounted for by the
equity method
- 82,289 50 82,289 Note
Profit Sky International
Limited
Wincase Limited Investee accounted for using
equity method
Investments accounted for by the
equity method
- 80,551 100 80,551 Note
Worldinn Limited Investee accounted for using
equity method
Investments accounted for by the
equity method
- 80,469 100 80,469 Note
85 Degree Co., Ltd. Comestibles Master Co., Ltd. Subsidiary Investments accounted for by the
equity method
17,054,268 1,281,245 100 1,281,245
Comestibles Master Co., Ltd. Mei Wei Master Co., Ltd. Subsidiary Investments accounted for by the
equity method
2,060,600 7,183 100 7,183 Note
The Hot Pot Food and Beverage
Management Co., Ltd.
Investee accounted for using
equity method
Investments accounted for by the
equity method
11,400,000 104,476 42 104,476 Note
(Continued)

- 39 -
Holding Company Marketable Securities Type and
Issuer/Name
Security Issuer’s Relationship
with the Holding Company Financial Statement Account
September 30, 2013
Note Shares/Units Carrying Amount
Percentage of
Ownership
Market Value or
Net Asset Value
Mei Wei Master Co., Ltd. Mei Wei Fu Xing Ltd. Subsidiary Investments accounted for by the
equity method
- $ 2,330 60 $ 2,330 Note
Prime Scope Trading Limited Shanghai Gourmet Master Food &
Beverage Ltd.
Subsidiary Investments accounted for by the
equity method
- 1,328,412 100 1,328,412
He-Shia Food & Beverage Ltd. Subsidiary Investments accounted for by the
equity method
- 1,527,564 100 1,527,564
Sheng-Pin (Hangzhou) Food Ltd. Subsidiary Investments accounted for by the
equity method
- 117,234 100 117,234
He-Shia (Nanjing) Food & Beverage
Ltd.
Subsidiary Investments accounted for by the
equity method
- 416,289 100 416,289
Beijing 85 Food & Beverage Ltd. Subsidiary Other liability - (33,311) 100 (33,311)
Zhejiang 85 Food & Beverage Ltd. Subsidiary Investments accounted for by the
equity method
- 3,232 100 3,232 Note
Sheng-Pin (Beijing) Food Ltd. Subsidiary Investments accounted for by the
equity method
- 64,053 100 64,053
Fuzhou 85 Food & Beverage Ltd. Subsidiary Investments accounted for by the
equity method
- 63,775 100 63,775 Note
Sheng-Pin (Jiangsu) Food Ltd. Subsidiary Investments accounted for by the
equity method
- 114,356 100 114,356
Sheng-Pin (Xiamen) Food Ltd. Subsidiary Investments accounted for by the
equity method
- 5,305 100 5,305
Sheng-Pin (Qingdao) Food Ltd. Subsidiary Investments accounted for by the
equity method
- 48,298 100 48,298 Note
Xiamen 85 Food & Beverage Ltd. Subsidiary Investments accounted for by the
equity method
- 31,951 100 31,951 Note
Shenyang 85 Food & Beverage Ltd. Subsidiary Other liability - (2,474) 100 (2,474) Note
Sheng-Pin (Shenyang) Food Ltd. Subsidiary Investments accounted for by the
equity method
- 97,557 100 97,557
85 Degree (Qingdao) Food &
Beverage Management Ltd.
Subsidiary Investments accounted for by the
equity method
- 76,218 100 76,218 Note
85 Degree (Jiangsu) Food Ltd. Subsidiary Investments accounted for by the
equity method
- 227,503 68 227,503
Shanghai Gourmet Master
Food & Beverage Ltd.
Sheng-Pin (Shanghai) Food Ltd. Subsidiary Investments accounted for by the
equity method
- 85,202 100 85,202
Mai-Jai (Shanghai) Food Ltd. Subsidiary Investments accounted for by the
equity method
- 44,442 100 44,442 Note
Shanghai Howco Jing Way Food
&Beverage Ltd.
Subsidiary Investments accounted for by the
equity method
- 93,600 100 93,600 Note
Shenzheng 85 Food & Beverage Ltd. Subsidiary Other liability (37,039) 85 (37,039) Note
Chengdu 85 Food & Beverage Ltd. Subsidiary Investments accounted for by the
equity method
- 25,565 100 25,565 Note
Sheng-Pin (Wuhan) Food Ltd. Subsidiary Other liability (10,351) 100 (10,351)
Wuhan Jing Way Food & Beverage
Ltd.
Subsidiary Other liability (31,835) 100 (31,835) Note
(Continued)

- 40 -
Holding Company Marketable Securities Type and
Issuer/Name
Security Issuer’s Relationship
with the Holding Company Financial Statement Account
September 30, 2013
Note Shares/Units Carrying Amount
Percentage of
Ownership
Market Value or
Net Asset Value
Jianxi Jing Way Food & Beverage
Ltd.
Subsidiary Investments accounted for by the
equity method
- $ 23,676 100 $ 23,676 Note
Jin Wei Industrial (Shanghai) Ltd. Subsidiary Investments accounted for by the
equity method
- 38,096 100 38,096 Note
Guangzhou 85 Degree Food &
Beverage Management Ltd.
Subsidiary Investments accounted for by the
equity method
- 26,162 100 26,162 Note
Chengdu Maijia Food Co., Ltd. Subsidiary Other liability - (795) 100 (795)
85 Degree (Jiangsu) Food Ltd. Subsidiary Investments accounted for by the
equity method
- 73,831 32 73,831
Shenzheng 85 Food &
Beverage Ltd.
Sheng Pin (Shenzheng) Food &
Beverage Ltd.
Subsidiary Other liability (19,088) 100 (19,088) Note
85 Degree (Qingdao) Food &
Beverage Management Ltd.
Qingdao Jie Wei Food & Beverage
Management Ltd.
Subsidiary Investments accounted for by the
equity method
- 7,160 100 7,160 Note
Note: Carrying amount and market value was based on the net assets of investee, which was not audited, as of September 30, 2013.
(Concluded)
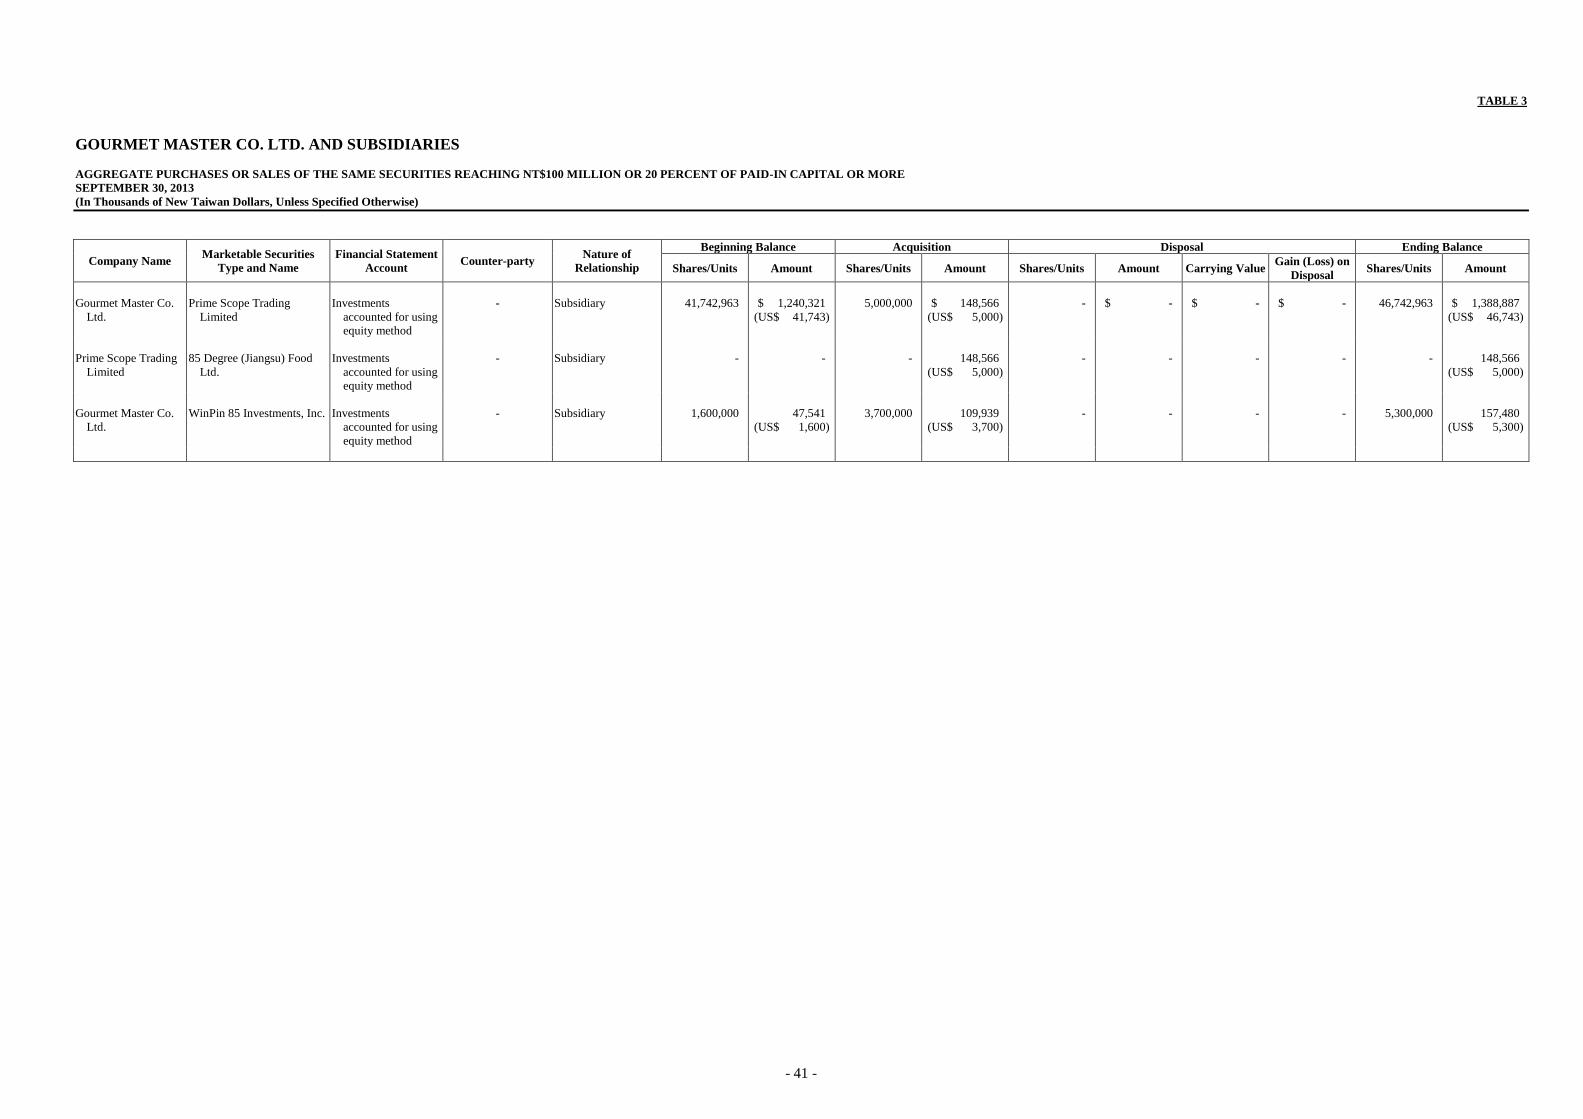
- 41 -
TABLE 3
GOURMET MASTER CO. LTD. AND SUBSIDIARIES
AGGREGATE PURCHASES OR SALES OF THE SAME SECURITIES REACHING NT$100 MILLION OR 20 PERCENT OF PAID-IN CAPITAL OR MORE
SEPTEMBER 30, 2013
(In Thousands of New Taiwan Dollars, Unless Specified Otherwise)
Company Name Marketable Securities
Type and Name
Financial Statement
Account Counter-party
Nature of
Relationship
Beginning Balance Acquisition Disposal Ending Balance
Shares/Units Amount Shares/Units Amount Shares/Units Amount Carrying Value Gain (Loss) on
Disposal Shares/Units Amount
Gourmet Master Co.
Ltd.
Prime Scope Trading
Limited
Investments
accounted for using
equity method
- Subsidiary 41,742,963 $ 1,240,321
(US$ 41,743)
5,000,000 $ 148,566
(US$ 5,000)
- $ - $ - $ - 46,742,963 $ 1,388,887
(US$ 46,743)
Prime Scope Trading
Limited
85 Degree (Jiangsu) Food
Ltd.
Investments
accounted for using
equity method
- Subsidiary - - - 148,566
(US$ 5,000)
- - - - - 148,566
(US$ 5,000)
Gourmet Master Co.
Ltd.
WinPin 85 Investments, Inc. Investments
accounted for using
equity method
- Subsidiary 1,600,000 47,541
(US$ 1,600)
3,700,000 109,939
(US$ 3,700)
- - - - 5,300,000 157,480
(US$ 5,300)

- 42 -
TABLE 4
GOURMET MASTER CO. LTD. AND SUBSIDIARIES
ACQUISITION OF REAL ESTATE REACHING NT$100 MILLION OR 20 PERCENT OF PAID-IN CAPITAL OR MORE
SEPTEMBER 30, 2013
(In Thousands of New Taiwan Dollars)
Company Name Property
Name
Transaction
Date
Transaction
Amount Payment Term
Counter
Party
Nature of
Relationship
Prior Transaction of Related Counter Party Price Reference
Price of
Acquisition Other Terms
Owner Relationship Transfer Date Amount
Chengdu Maijia Food Co., Ltd. Building May 31, 2013 $ 136,070
Totally paid ChengduYabo
Paper
Product Co.,
Ltd. etc.
- - - - $ - Price comparison
and authorized
by the Board of
Directors
Operating
purpose
None
Comestibles Master Co., Ltd. Building August 14, 2013 181,260
$106,633 has been
paid (classified
under
Construction in
process)
Highwealth
Construction
Corp.
- - - - - Price comparison
and negotiated
by the contracts
Operating
purpose
None

- 43 -
TABLE 5
GOURMET MASTER CO. LTD. AND SUBSIDIARIES
PURCHASES OR SALE OF GOODS FROM OR TO RELATED PARTIES REACHING NT$100 MILLION OR 20% OF THE PAID-IN CAPITAL OR MORE
SEPTEMBER 30, 2013
(In Thousands of New Taiwan Dollars)
Company Name Related Party Nature of
Relationship
Transaction Detail Non-arm’s Length Transaction Notes/Accounts Payable or Receivable
Note Purchases/
Sales Amount % to Total Payment Term Unit Price
Payment
Term Account Ending Balance % to Total
Sheng-Pin (Shanghai)
Food Ltd.
Shanghai Gourmet Master
Food & Beverage Ltd.
Parent company Sales $ 404,603 4 60 days Based on the Group’s
transfer pricing policy
- - $ - - Note
He-Shia (Shanghai) Food &
Beverage Ltd.
Affiliated company Sales 140,808 1 In advance Based on the Group’s
transfer pricing policy
- Receipts in advance (61,935) (10) Note
Jin Wei Industrial (Shanghai)
Food Ltd.
Affiliated company Sales 158,460 1 60 days Based on the Group’s
transfer pricing policy
- Accounts receivable 142,027 49 Note
Sheng-Pin (Jiangsu)
Food Ltd.
He-Shia (Nanjing) Food &
Beverage Ltd.
Affiliated company Sales 401,521 4 60 days Based on the Group’s
transfer pricing policy
- - - - Note
He-Shia (Shanghai) Food &
Beverage Ltd.
Affiliated company Sales 102,869 1 60 days Based on the Group’s
transfer pricing policy
- - - - Note
Sheng-Pin (Hangzhou)
Food Ltd.
Shanghai Gourmet Master
Food & Beverage Ltd.
Affiliated company Sales 231,116 2 60 days Based on the Group’s
transfer pricing policy
- Accounts receivable 128,132 44 Note
He-Shia Food & Beverage
Ltd.
Affiliated company Sales 242,932 2 In advance Based on the Group’s
transfer pricing policy
- Receipts in advance (130,984) (21) Note
Sheng-Pin (Beijing)
Food Ltd.
Beijing 85 Food & Beverage
Ltd.
Affiliated company Sales 206,787 2 60 days Based on the Group’s
transfer pricing policy
- Accounts receivable 115,514 40 Note
Sheng-Pin (Xiamen)
Food Ltd.
Fuzhou 85 Food & Beverage
Ltd.
Affiliated company Sales 133,323 1 60 days Based on the Group’s
transfer pricing policy
- - - - Note
Note: Transaction above is already written off in consolidated financial statements.

- 44 -
TABLE 6
GOURMET MASTER CO. LTD. AND SUBSIDIARIES
TRADE RECEIVABLES FROM RELATED PARTIES REACHING NT$100 MILLION OR 20 PERCENT OF PAID-IN-CAPITAL OR MORE
SEPTEMBER 30, 2013
(In Thousands of New Taiwan Dollars, Unless Stated Otherwise)
Company Name Related Party Nature of Relationships
Ending Balance
(Foreign
Currencies in
Thousands)
Turnover Ratio
Overdue Amounts
Received in
Subsequent
Period
Allowance for
Amount Action
Taken Bad
Debts
Amount Action Taken
Comestibles Master Co., Ltd. Perfect 85 Degrees C, Inc. Affiliated company $ 216,907 (Note) $ - - $ - $ -
Shanghai Gourmet Master Food & Beverage Ltd. Sheng-Pin (Hangzhou) Food Ltd. Affiliated company 128,132 3.28 - - - -
Chengdu Maijia Food Co., Ltd. Subsidiary 126,252 (Note) - - - -
He-Shia Food & Beverage Ltd. Shanghai Gourmet Master Food & Beverage Ltd. Affiliated company 230,853 (Note) - - - -
Sheng-Pin (Xiamen) Food Ltd. Affiliated company 115,683 (Note) - - - -
Beijing 85 Food & Beverage Ltd. Affiliated company 193,320 (Note) - - - -
Beijing 85 Food & Beverage Ltd. Sheng-Pin (Beijing) Food Ltd. Affiliated company 115,514 2.51 - - - -
Jin Wei Industrial (Shanghai) Ltd. Sheng-Pin (Shanghai) Food Ltd. Affiliated company 142,027 1.42 - - - -
Note: The ending balance is primarily consisted of other receivables, which is not applicable for the calculation of turnover ratio.

- 45 -
TABLE 7
GOURMET MASTER CO. LTD. AND SUBSIDIARIES
NAMES, LOCATIONS, AND RELATED INFORMATION OF INVESTEES
SEPTEMBER 30, 2013
(In Thousands of New Taiwan Dollars, Unless Specified Otherwise)
Investor Company Investee Company Location Main Businesses and Products
Investment Amount September 30, 2013 Net Income
(Loss) of the
Investee
Investment
Income (Loss)
Recognized
Note September 30,
2013
December 31,
2012 Shares
Percentage of
Ownership
Carrying
Amount
Gourmet Master Co. Ltd. 85 Degree Co., Ltd. Malaysia Investment $ 553,447 $ 553,447 12,899,078 100 $ 1,297,795 $ 213,732 $ 213,732
Prime Scope Trading
Limited
Hong Kong Investment 1,388,887
(US$ 46,743)
1,240,321
(US$ 41,743)
46,742,963 100 4,018,360 288,875 288,875 (Note 1)
Perfect 85 Degrees C, Inc. USA Investment 194,698
(US$ 6,553)
194,698
(US$ 6,553)
4,301,000 100 256,937 13,776 13,776 (Notes 1 and 2)
85 Degrees Café
International Pty. Ltd.
Australia Grocery and drink retailing 49,114
(AUD 1,785)
49,114
(AUD 1,785)
1,785,000 51 37,769 (3,539) (1,805) (Notes 1 and 2)
Lucky Bakery Limited Samoa Investment 163,423
(US$ 5,500)
163,423
(US$ 5,500)
5,500,000 100 131,110 (15,565) (15,565) (Note 1)
WinPin 85 Investments,
Inc.
USA Grocery and drink retailing 157,480
(US$ 5,300)
47,541
(US$ 1,600)
5,300,000 100 147,993 (2,310) (2,310) (Notes 1 and 2)
Perfect 85 Degrees C, Inc. Golden 85 Investments,
LLC
USA Grocery and drink retailing 58,577
(US$ 1,971)
58,577
(US$ 1,971)
- 65 51,217 70,196 (Note 3) (Notes 1 and 2)
Lucky Bakery Limited Profit Sky International
Limited
Hong Kong Grocery and drink retailing 114,390
(HK$ 30,000)
114,390
(HK$ 30,000)
- 50 82,289 (31,357) (Note 3) (Notes 1 and 2)
Profit Sky International
Limited
Wincase Limited Hong Kong Grocery and drink retailing 106,764
(HK$ 28,000)
106,764
(HK$ 28,000)
- 100 80,551 (10,311) (Note 3) (Notes 1 and 2)
Worldinn Limited Hong Kong Manufacturing of baking food and sale 114,390
(HK$ 30,000)
114,390
(HK$ 30,000)
- 100 80,469 (20,973) (Note 3) (Notes 1 and 2)
85 Degree Co., Ltd. Comestibles Master Co.,
Ltd.
Taichung City, Taiwan (R.O.C.) Grocery and drink retailing 553,447
553,447
17,054,268 100 1,281,245 217,424 (Note 3)
Comestibles Master Co., Mei Wei Master Co., Ltd. Taichung City, Taiwan (R.O.C.) Grocery and drink retailing 43,000 43,000 2,060,600 100 7,183 (363) (Note 3) (Note 2)
Ltd. The Hot Pot Food and
Beverage Management
Co., Ltd.
Taichung City, Taiwan (R.O.C.) Food and beverage; Grocery and drink retailing 114,000 114,000 11,400,000 42 104,476 (13,224) (Note 3) (Note 2)
Mei Wei Master Co., Ltd. Mei Wei Fu Xing Ltd. Taichung City, Taiwan (R.O.C.) Grocery and drink retailing 1,800 1,800 - 60 2,330 240 (Note 3) (Note 2)
Prime Scope Trading
Limited
Shanghai Gourmet Master
Food & Beverage Ltd.
Shanghai City Grocery and drink retailing 295,974
(US$ 9,961)
295,974
(US$ 9,961)
- 100 1,328,412 15,117 (Note 3) (Note 1)
He-Shia Food & Beverage
Ltd.
Shanghai City Grocery and drink retailing 72,928
(US$ 2,454)
72,928
(US$ 2,454)
- 100 1,527,564 219,165 (Note 3) (Note 1)
Sheng-Pin (Hangzhou)
Food Ltd.
Hangzhou City Manufacturing of baking food and sale 59,427
(US$ 2,000)
59,427
(US$ 2,000)
- 100 117,234 32,607 (Note 3) (Note 1)
He-Shia (Nanjing) Food
& Beverage Ltd.
Nanjing City Grocery and drink retailing 59,427
(US$ 2,000)
59,427
(US$ 2,000)
- 100 416,289 109,825 (Note 3) (Note 1)
Beijing 85 Food &
Beverage Ltd.
Beijing City Grocery and drink retailing 59,427
(US$ 2,000)
59,427
(US$ 2,000)
- 100 (33,311) (52,346) (Note 3) (Note 1)
Zhejiang 85 Food &
Beverage Ltd.
Hangzhou City Grocery and drink retailing 59,427
(US$ 2,000)
59,427
(US$ 2,000)
- 100 3,232 (16,494) (Note 3) (Notes 1 and 2)
Sheng-Pin (Beijing) Food
Ltd.
Beijing City Manufacturing of baking food and sale 118,853
(US$ 4,000)
118,853
(US$ 4,000)
- 100 64,053 (18,272) (Note 3) (Note 1)
Fuzhou 85 Food &
Beverage Ltd.
Fuzhou City Grocery and drink retailing 14,857
(US$ 500)
14,857
(US$ 500)
- 100 63,775 44,350 (Note 3) (Notes 1 and 2)
(Continued)

- 46 -
Investor Company Investee Company Location Main Businesses and Products
Investment Amount September 30, 2013 Net Income
(Loss) of the
Investee
Investment
Income (Loss)
Recognized
Note September 30,
2013
December 31,
2012 Shares
Percentage of
Ownership
Carrying
Amount
Sheng-Pin (Jiangsu) Food
Ltd.
Nanjing City Manufacturing of baking food and sale $ 133,710
(US$ 4,500)
$ 133,710
(US$ 4,500)
- 100 $ 114,356 $ 20,468 (Note 3) (Note 1)
Sheng-Pin (Xiamen) Food
Ltd.
Xiamen City Manufacturing of baking food and sale 59,427
(US$ 2,000)
59,427
(US$ 2,000)
- 100 5,305 (15,089) (Note 3) (Note 1)
Sheng-Pin (Qingdao)
Food Ltd.
Qingdao City Manufacturing of baking food and sale 74,283
(US$ 2,500)
74,283
(US$ 2,500)
- 100 48,298 (16,633) (Note 3) (Notes 1 and 2)
Xiamen 85 Food &
Beverage Ltd.
Xiamen City Grocery and drink retailing 29,713
(US$ 1,000)
29,713
(US$ 1,000)
- 100 31,951 1,433 (Note 3) (Notes 1 and 2)
Shenyang 85 Food &
Beverage Ltd.
Shenyang City Grocery and drink retailing 29,713
(US$ 1,000)
29,713
(US$ 1,000)
- 100 (2,474) (28,341) (Note 3) (Notes 1 and 2)
Sheng-Pin (Shenyang)
Food Ltd.
Shenyang City Manufacturing of baking food and sale 118,853
(US$ 4,000)
118,853
(US$ 4,000)
- 100 97,557 (17,851) (Note 3) (Note 1)
85 Degree (Qingdao)
Food & Beverage
Management Ltd.
Qingdao City Grocery and drink retailing 59,427
(US$ 2,000)
59,427
(US$ 2,000)
- 100 76,218 8,375 (Note 3) (Notes 1 and 2)
85 Degree (Jiangsu) Food
Ltd.
Kunshan City Manufacturing of baking food and sale 148,566
(US$ 5,000)
- - 68 227,503 4,095 (Note 3) (Note 1)
Shanghai Gourmet Master
Food & Beverage Ltd.
Sheng-Pin (Shanghai)
Food Ltd.
Shanghai City Manufacturing of baking food and sale 86,994
(RMB 18,000)
86,994
(RMB 18,000)
- 100 85,202 30,356 (Note 3) (Note 1)
Mai-Jai (Shanghai) Food
Ltd.
Shanghai City Manufacturing of baking food and sale 34,314
(RMB 7,100)
34,314
(RMB 7,100)
- 100 44,442 3,640 (Note 3) (Notes 1 and 2)
Shanghai Howco Jing
Way Food & Beverage
Ltd.
Shanghai City Grocery and drink retailing 72,495
(RMB 15,000)
72,495
(RMB 15,000)
- 100 93,600 (912) (Note 3) (Notes 1 and 2)
Shenzheng 85 Food &
Beverage Ltd.
Shenzheng City Grocery and drink retailing 54,897
(RMB 11,359)
54,897
(RMB 11,359)
- 85 (37,039) (25,442) (Note 3) (Notes 1 and 2)
Chengdu 85 Food &
Beverage Ltd.
Chengdu City Grocery and drink retailing 31,849
(RMB 6,590)
31,849
(RMB 6,590)
- 100 25,565 (7,711) (Note 3) (Notes 1 and 2)
Sheng-Pin (Wuhan) Food
Ltd.
Wuhan City Manufacturing of baking food and sale 28,998
(RMB 6,000)
28,998
(RMB 6,000)
- 100 (10,351) (21,514) (Note 3) (Note 1)
Wuhan Jing Way Food &
Beverage Ltd.
Wuhan City Grocery and drink retailing 28,998
(RMB 6,000)
28,998
(RMB 6,000)
- 100 (31,835) (34,148) (Note 3) (Notes 1 and 2)
Jianxi Jing Way Food &
Beverage Ltd.
Nanchang City Grocery and drink retailing 28,998
(RMB 6,000)
28,998
(RMB 6,000)
- 100 23,676 (5,882) (Note 3) (Notes 1 and 2)
Jin Wei Industrial
(Shanghai) Ltd.
Shanghai City Grocery sale 9,666
(RMB 2,000)
9,666
(RMB 2,000)
- 100 38,096 5,034 (Note 3) (Notes 1 and 2)
Guangzhou 85 Degree
Food & Beverage
Management Ltd.
Guangzhou City Grocery and drink retailing 28,998
(RMB 6,000)
28,998
(RMB 6,000)
- 100 26,162 (2,854) (Note 3) (Notes 1 and 2)
Chengdu Maijia Food Co.,
Ltd.
Chengdu City Manufacturing of baking food and sale 9,666
(RMB 2,000)
- - 100 (795) (10,405) (Note 3) (Note 1)
85 Degree (Jiangsu) Food
Ltd.
Kunshan City Manufacturing of baking food and sale 72,495
(RMB 15,000)
- - 32 73,831 4,095 (Note 3) (Note 1)
Shenzheng 85 Food &
Beverage Ltd.
Sheng-Pin (Shenzheng)
Food & Beverage Ltd.
Shenzheng City Manufacturing of baking food and sale 31,415
(RMB 6,500)
31,415
(RMB 6,500)
- 100 (19,088) (12,047) (Note 3) (Notes 1 and 2)
85 Degree (Qingdao)
Food & Beverage
Management Ltd.
Qingdao Jie Wei Food &
Beverage Management
Ltd.
Qingdao City Manufacturing of baking food and sale 7,250
(RMB 1,500)
7,250
(RMB 1,500)
- 100 7,160 609 (Note 3) (Notes 1 and 2)
Note 1: The exchange rate was US$1=NT$29.71; RMB1=NT$4.833; AUD1=NT$27.51; HK$1=NT$3.813 as of September 30, 2013.
Note 2: The carrying amount was based on the net assets of investee, which was not audited as of September 30, 2013.
Note 3: The share of profits/losses of the investee company is not reflected herein as such amount is already included in the share of profits/losses of the investor company.
(Concluded)
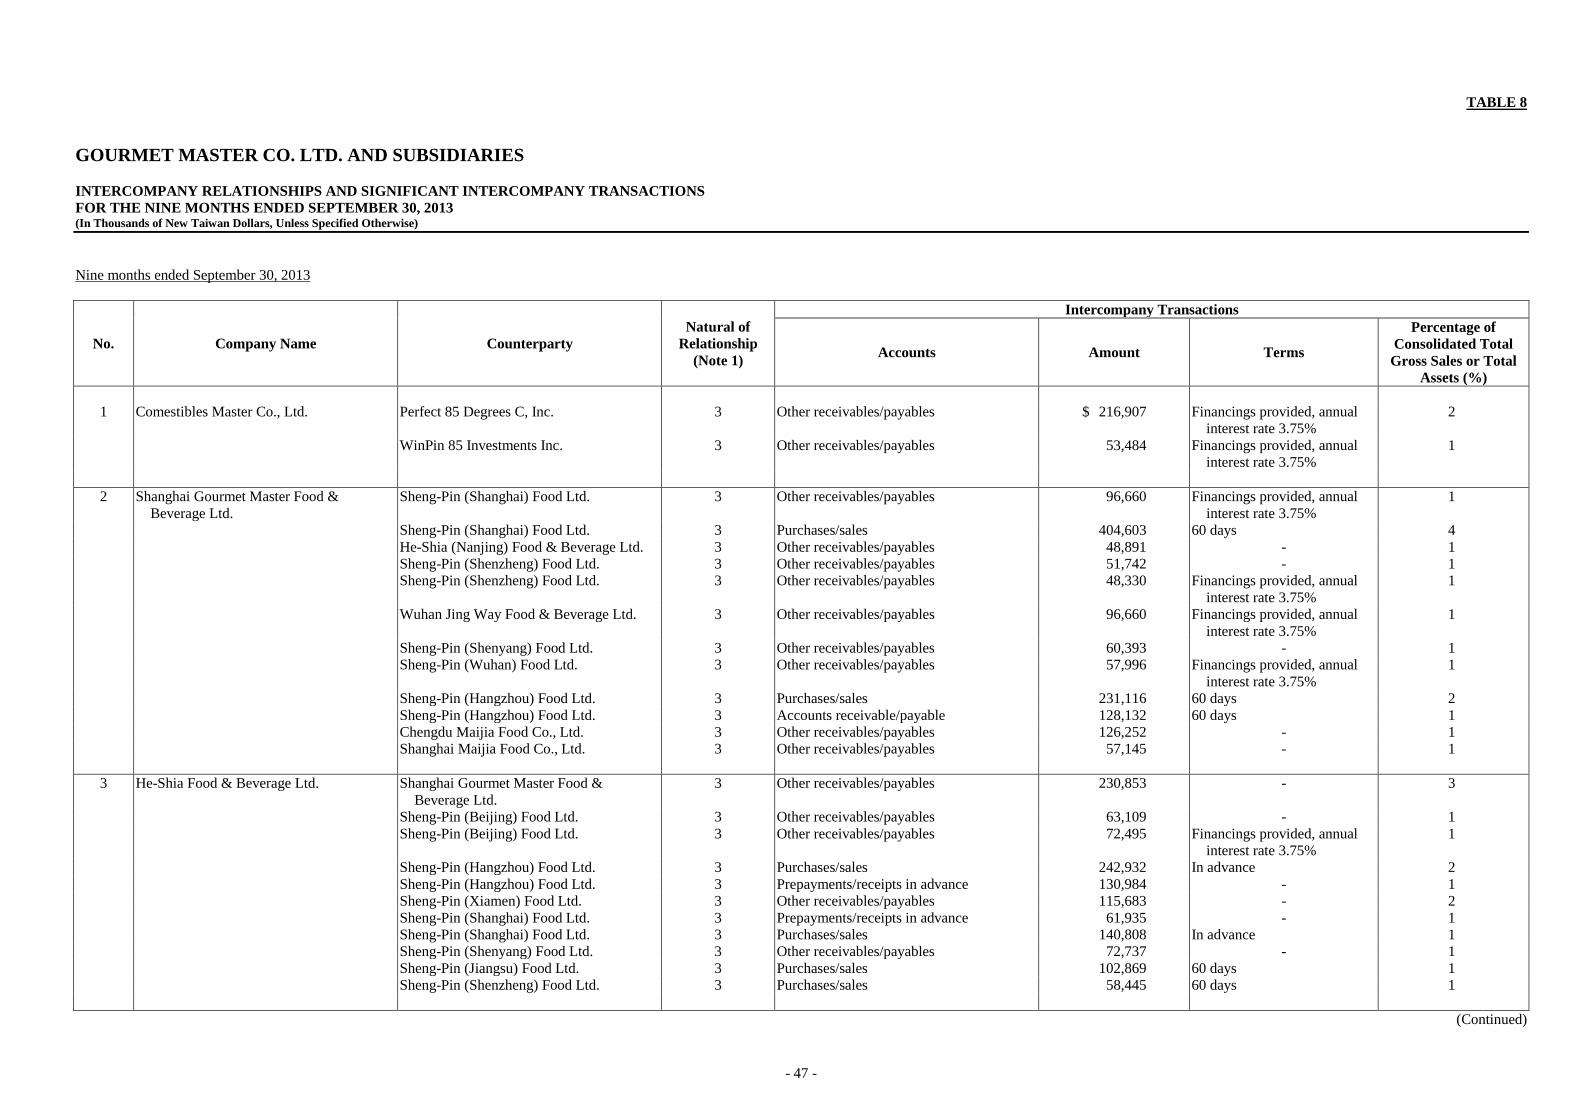
- 47 -
TABLE 8
GOURMET MASTER CO. LTD. AND SUBSIDIARIES
INTERCOMPANY RELATIONSHIPS AND SIGNIFICANT INTERCOMPANY TRANSACTIONS
FOR THE NINE MONTHS ENDED SEPTEMBER 30, 2013 (In Thousands of New Taiwan Dollars, Unless Specified Otherwise)
Nine months ended September 30, 2013
No. Company Name Counterparty
Natural of
Relationship
(Note 1)
Intercompany Transactions
Accounts Amount Terms
Percentage of
Consolidated Total
Gross Sales or Total
Assets (%)
1 Comestibles Master Co., Ltd. Perfect 85 Degrees C, Inc. 3 Other receivables/payables $ 216,907 Financings provided, annual
interest rate 3.75%
2
WinPin 85 Investments Inc. 3 Other receivables/payables 53,484 Financings provided, annual
interest rate 3.75%
1
2 Shanghai Gourmet Master Food &
Beverage Ltd.
Sheng-Pin (Shanghai) Food Ltd. 3 Other receivables/payables 96,660 Financings provided, annual
interest rate 3.75%
1
Sheng-Pin (Shanghai) Food Ltd. 3 Purchases/sales 404,603 60 days 4
He-Shia (Nanjing) Food & Beverage Ltd. 3 Other receivables/payables 48,891 - 1
Sheng-Pin (Shenzheng) Food Ltd. 3 Other receivables/payables 51,742 - 1
Sheng-Pin (Shenzheng) Food Ltd. 3 Other receivables/payables 48,330 Financings provided, annual
interest rate 3.75%
1
Wuhan Jing Way Food & Beverage Ltd. 3 Other receivables/payables 96,660 Financings provided, annual
interest rate 3.75%
1
Sheng-Pin (Shenyang) Food Ltd. 3 Other receivables/payables 60,393 - 1
Sheng-Pin (Wuhan) Food Ltd. 3 Other receivables/payables 57,996 Financings provided, annual
interest rate 3.75%
1
Sheng-Pin (Hangzhou) Food Ltd. 3 Purchases/sales 231,116 60 days 2
Sheng-Pin (Hangzhou) Food Ltd. 3 Accounts receivable/payable 128,132 60 days 1
Chengdu Maijia Food Co., Ltd. 3 Other receivables/payables 126,252 - 1
Shanghai Maijia Food Co., Ltd. 3 Other receivables/payables 57,145 - 1
3 He-Shia Food & Beverage Ltd. Shanghai Gourmet Master Food &
Beverage Ltd.
3 Other receivables/payables 230,853 - 3
Sheng-Pin (Beijing) Food Ltd. 3 Other receivables/payables 63,109 - 1
Sheng-Pin (Beijing) Food Ltd. 3 Other receivables/payables 72,495 Financings provided, annual
interest rate 3.75%
1
Sheng-Pin (Hangzhou) Food Ltd. 3 Purchases/sales 242,932 In advance 2
Sheng-Pin (Hangzhou) Food Ltd. 3 Prepayments/receipts in advance 130,984 - 1
Sheng-Pin (Xiamen) Food Ltd. 3 Other receivables/payables 115,683 - 2
Sheng-Pin (Shanghai) Food Ltd. 3 Prepayments/receipts in advance 61,935 - 1
Sheng-Pin (Shanghai) Food Ltd. 3 Purchases/sales 140,808 In advance 1
Sheng-Pin (Shenyang) Food Ltd. 3 Other receivables/payables 72,737 - 1
Sheng-Pin (Jiangsu) Food Ltd. 3 Purchases/sales 102,869 60 days 1
Sheng-Pin (Shenzheng) Food Ltd. 3 Purchases/sales 58,445 60 days 1
(Continued)

- 48 -
No. Company Name Counterparty
Natural of
Relationship
(Note 1)
Intercompany Transactions
Accounts Amount Terms
Percentage of
Consolidated Total
Gross Sales or Total
Assets (%)
Beijing 85 Food & Beverage Ltd. 3 Other receivables/payables $ 193,320 Financings provided, annual
interest rate 3.75%
2
Shenyang 85 Food & Beverage Ltd. 3 Other receivables/payables 54,328 - 1
4 Beijing 85 Food & Beverage Ltd. Sheng-Pin (Beijing) Food Ltd. 3 Purchases/sales 206,787 60 days 2
Sheng-Pin (Beijing) Food Ltd. 3 Accounts payable/receivable 115,514 60 days 1
5 He-Shia (Nanjing) Food & Beverage Ltd. Sheng-Pin (Jiangsu) Food Ltd. 3 Purchases/sales 401,521 60 days 4
Sheng-Pin (Hangzhou) Food Ltd. 3 Purchases/sales 53,999 60 days -
6 Jin Wei Industrial (Shanghai) Ltd. Sheng-Pin (Shanghai) Food Ltd. 3 Accounts payable/receivable 142,027 60 days 2
Sheng-Pin (Shanghai) Food Ltd. 3 Purchases/sales 158,460 60 days 1
7 85 Degree (Jiangsu) Food Ltd. Sheng-Pin (Jiangsu) Food Ltd. 3 Accounts payable/receivable 51,670 60 days 1
Sheng-Pin (Jiangsu) Food Ltd. 3 Purchases/sales 52,153 60 days -
8 Sheng-Pin (Wuhan) Food Ltd. Wuhan Jing Way Food & Beverage Ltd. 3 Purchases/sales 58,818 60 days 1
9 Zhejiang 85 Food & Beverage Ltd. Sheng-Pin (Hangzhou) Food Ltd. 3 Accounts payable/receivable 73,660 60 days 1
Sheng-Pin (Hangzhou) Food Ltd. 3 Purchases/sales 65,651 60 days 1
10 Fuzhou 85 Food & Beverage Ltd. Sheng-Pin (Xiamen) Food Ltd. 3 Purchases/sales 133,323 60 days 1
11 Sheng-Pin (Jiangsu) Food Ltd. Sheng-Pin (Shanghai) Food Ltd. 3 Purchases/sales 53,912 60 days -
12 Mai-Jai (Shanghai) Food Ltd. Sheng-Pin (Shanghai) Food Ltd. 3 Accounts receivable/payable 77,265 60 days 1
Sheng-Pin (Hangzhou) Food Ltd. 3 Accounts receivable/payable 58,170 60 days 1
Note 1: Intercompany relationships and significant intercompany transactions information should be noted in number column.
1 Number 0 represents parent company.
2 Number 1 to 12 represents subsidiaries.
Note 2: 1 Represents the transactions from parent company to subsidiary.
2 Represents the transactions from subsidiary to parent company.
3 Represents the transactions between subsidiaries.
Note 3: The asset accounts and liability accounts amounts are calculated as percentage of consolidated total assets. The income accounts amounts are calculated as percentage of consolidated total gross sales.
(Concluded)

- 49 -
TABLE 9
GOURMET MASTER CO. LTD. AND SUBSIDIARIES
INFORMATION ON INVESTMENT IN MAINLAND CHINA
FOR THE NINE MONTHS ENDED SEPTEMBER 30, 2013
(In Thousands of New Taiwan Dollars, Unless Specified Otherwise)
Investee Company Main Businesses and Products
Total Amount of
Paid-in Capital
(RMB in Thousands)
(Note)
Method of
Investment
Accumulated
Outflow of
Investment from
Taiwan as of
January 1, 2013
Investment Flows Accumulated
Outflow of
Investment from
Taiwan as of
September 30, 2013
Percentage of
Ownership
Investment Income
(Loss) Recognized
Carrying Amount
as of September 30,
2013
Accumulated inward
Remittance of
Earnings as of
September 30, 2013
Outflow Inflow
Prime Scope Trading Limited
Shanghai Gourmet Master Food &
Beverage Ltd.
Grocery and drink retailing $ 295,974
(US$ 9,961)
Direct investment $ - $ - $ - $ - 100 $ 15,117 $ 1,328,412 $ -
He-Shia Food & Beverage Ltd. Grocery and drink retailing 72,928
(US$ 2,454)
Direct investment - - - - 100 291,165 1,527,564 -
Sheng-Pin (Hangzhou) Food Ltd. Manufacturing of baking food and
sale
59,427
(US$ 2,000)
Direct investment - - - - 100 32,607 117,234 -
He-Shia (Nanjing) Food & Beverage
Ltd.
Grocery and drink retailing 59,427
(US$ 2,000)
Direct investment - - - - 100 109,825 416,289 -
Beijing 85 Food & Beverage Ltd. Grocery and drink retailing 59,427
(US$ 2,000)
Direct investment - - - - 100 (52,346) (33,311) -
Zhejiang 85 Food & Beverage Ltd. Grocery and drink retailing 59,427
(US$ 2,000)
Direct investment - - - - 100 (16,494) 3,232 -
Sheng-Pin (Beijing) Food Ltd. Manufacturing of baking food and
sale
118,853
(US$ 4,000)
Direct investment - - - - 100 (18,272) 64,053 -
Fuzhou 85 Food & Beverage Ltd. Grocery and drink retailing 14,857
(US$ 500)
Direct investment - - - - 100 44,350 63,775 -
Sheng-Pin (Jiangsu) Food Ltd. Manufacturing of baking food and
sale
133,710
(US$ 4,500)
Direct investment - - - - 100 20,468 114,356 -
Sheng-Pin (Xiamen) Food Ltd. Manufacturing of baking food and
sale
59,427
(US$ 2,000)
Direct investment - - - - 100 (15,089) 5,305 -
Sheng-Pin (Qingdao) Food Ltd. Manufacturing of baking food and
sale
74,283
(US$ 2,500)
Direct investment - - - - 100 (16,633) 48,298 -
Xiamen 85 Food & Beverage Ltd. Grocery and drink retailing 29,713
(US$ 1,000)
Direct investment - - - - 100 1,433 31,951 -
Shenyang 85 Food & Beverage Ltd. Grocery and drink retailing 29,713
(US$ 1,000)
Direct investment - - - - 100 (28,341) (2,474) -
Sheng-Pin (Shenyang) Food Ltd. Manufacturing of baking food and
sale
118,853
(US$ 4,000)
Direct investment - - - - 100 (17,851) 97,557 -
85 Degree (Qingdao) Food &
Beverage Management Ltd.
Grocery and drink retailing 59,427
(US$ 2,000)
Direct investment - - - - 100 8,375 76,218 -
85 Degree (Jiangsu) Food Ltd. Manufacturing of baking food and
sale
148,566
(US$ 5,000)
Direct investment - - - - 68 2,766 227,503 -
Shanghai Gourmet Master Food &
Beverage Ltd.
Sheng-Pin (Shanghai) Food Ltd. Manufacturing of baking food and
sale
86,994
(RMB 18,000)
Direct investment - - - - 100 30,356 85,202 -
Mai-Jai (Shanghai) Food Ltd. Manufacturing of baking food and
sale
34,314
(RMB 7,100)
Direct investment - - - - 100 3,442 44,442 -
Shanghai Howco Jing Way Food &
Beverage Ltd.
Grocery and drink retailing 72,495
(RMB 15,000)
Direct investment - - - - 100 (912) 93,600 -
Shenzheng 85 Food & Beverage
Ltd.
Grocery and drink retailing 54,897
(RMB 11,359)
Direct investment - - - - 85 (21,626) (37,039) -
Chengdu 85 Food & Beverage Ltd. Grocery and drink retailing 31,849
(RMB 6,590)
Direct investment - - - - 100 (7,711) 25,565 -
Sheng-Pin (Wuhan) Food Ltd. Manufacturing of baking food and
sale
28,998
(RMB 6,000)
Direct investment - - - - 100 (21,514) (10,351) -
(Continued)

- 50 -
Investee Company Main Businesses and Products
Total Amount of
Paid-in Capital
(RMB in Thousands)
(Note)
Method of
Investment
Accumulated
Outflow of
Investment from
Taiwan as of
January 1, 2013
Investment Flows Accumulated
Outflow of
Investment from
Taiwan as of
September 30, 2013
Percentage of
Ownership
Investment Income
(Loss) Recognized
Carrying Amount
as of September 30,
2013
Accumulated inward
Remittance of
Earnings as of
September 30, 2013
Outflow Inflow
Wuhan Jing Way Food & Beverage
Ltd.
Grocery and drink retailing $ 28,998
(RMB 6,000)
Direct investment $ - $ - $ - $ - 100 $ (34,148) $ (31,835) $ -
Jianxi Jing Way Food & Beverage
Ltd.
Grocery and drink retailing 28,998
(RMB 6,000)
Direct investment - - - - 100 (5,882) 23,676 -
Jin Wei Industrial (Shanghai) Ltd. Grocery sale 9,666
(RMB 2,000)
Direct investment - - - - 100 5,034 38,096 -
Guangzhou 85 Degree Food &
Beverage Management Ltd.
Grocery and drink retailing 28,998
(RMB 6,000)
Direct investment - - - - 100 (2,854) 26,162 -
Chengdu Maijia Food Co., Ltd. Manufacturing of baking food and
sale
9,666
(RMB 2,000)
Direct investment - - - - 100 (10,405) (795) -
85 Degree (Jiangsu) Food Ltd. Manufacturing of baking food and
sale
72,495
(RMB 15,000)
Direct investment - - - - 32 1,329 73,831 -
Shenzheng 85 Food & Beverage Ltd.
Sheng-Pin (Shenzheng) Food &
Beverage Ltd.
Manufacturing of baking food and
sale
31,415
(RMB 6,500)
Direct investment - - - - 100 (12,047) (19,088) -
85 Degree (Qingdao) Food &
Beverage Management Ltd.
Qingdao Jie Wei Food & Beverage
Management Ltd.
Grocery and drink retailing 7,250
(RMB 1,500)
Direct investment - - - - 100 609 7,160 -
Accumulated Investment in Mainland
China as of September 30, 2013
Investment Amount Authorized by the
Investment Commission, MOEA Upper Limit on Investment
NA NA NA
Note: The exchange rate was US$1=NT$29.71, RMB1= NT$4.833 as of September 30, 2013.
(Concluded)