Good Golly Miss Moly! Dan Parnell Florida Industrial Pretreatment Association Winter Workshop...
26
Good Golly Miss Moly! Dan Parnell Florida Industrial Pretreatment Association Winter Workshop February 16, 2007
-
Upload
brent-rodger-mckenzie -
Category
Documents
-
view
214 -
download
1
Transcript of Good Golly Miss Moly! Dan Parnell Florida Industrial Pretreatment Association Winter Workshop...

Good Golly Miss Moly!
Dan ParnellFlorida Industrial Pretreatment Association
Winter WorkshopFebruary 16, 2007
Overview
In the BeginningMoly RisingFinding MolyFree Moly!Moly Free is the Way to Be

Up in Smoke
Until 2002 – 5 regional Water Reclamations Facilities (WRF) sent sludge to central incineration facility.Incineration Issues:
• Air emissions• Ashes to the landfill• Power consumption

Biosolids FacilityCommissioned in late 2002
Produces 39 tons of biosolid pellets/day
Gravity Belt Gravity Belt ThickeningThickening
DigestersDigesters
CentrifugeCentrifuge
Polymer
Polymer
Methane
Methane
Nutrient Nutrient Enhancement
Enhancement

Problem
JEA Average Monthly Pellet Molybdenum Levels 1/04 - 7/04
0102030405060708090
Jan '04
Feb '04
Mar '04
Apr '04
May '04
Jun '04
Jul '04
Co
nc
. (m
g/k
g)
Limit 75 mg/kg
Moly Rising 40 CFR 503
40 CFR 503

Problem
Moly >75mg/Kg means:
Can not be land applied
Disposal Costs – averaging $2000/day for hauling/tipping fees
Loss of a $40 million dollar investment
IP Coordinator beginning to sweat
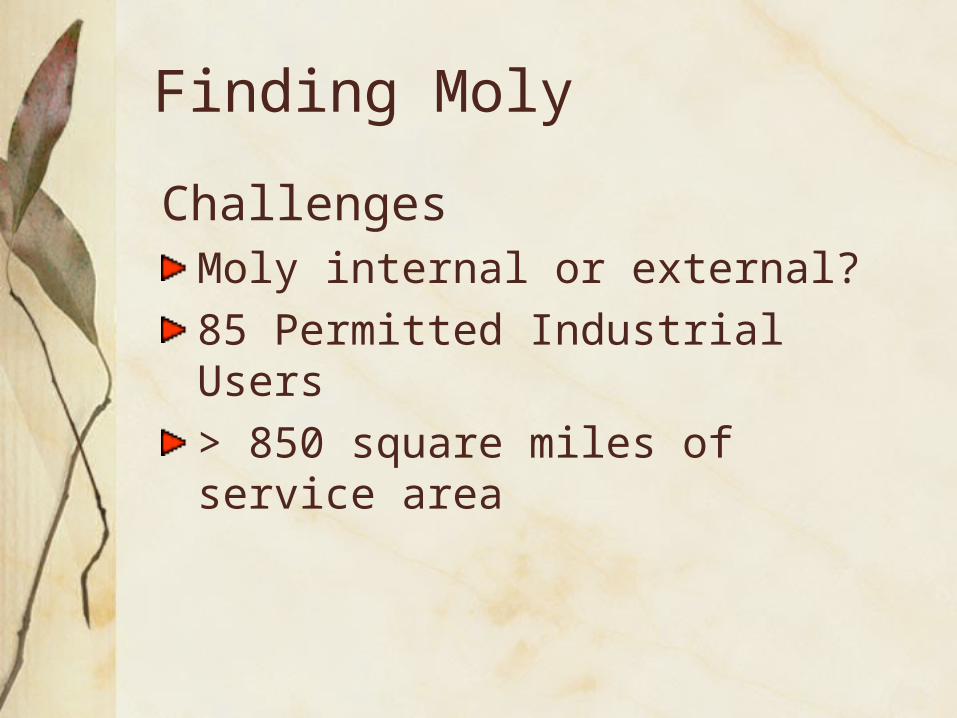
Finding Moly
ChallengesMoly internal or external? 85 Permitted Industrial Users> 850 square miles of service area

Finding Moly
Collecting Data5 Regional Water Reclamation Facilities
Inf/eff dataRaw sludge/pellets
Industrial effluent85 industrial users (IU) Where to begin?
Merck Index/web search

Finding Moly
Internal or External Source?Mass balance on Moly in raw sludge vs.
pellets. Results:Moly (in da raw sludge) = Moly (in da pellets)
External Source confirmed. Responsibility:
INDUSTRIAL PRETREATMENTINDUSTRIAL PRETREATMENT
IP Coordinator sweating a lot.
Finding Moly
Moly
(lb
/day)
Perc
ent
WRFCount
4.2 2.8 1.9Cum % 82.5 91.0 95.3 98.1 100.0
17.5 1.8 0.9 0.6 0.4Percent 82.5 8.5
SouthwestMandarinDistrict 2Arlington EastBuckman
20
15
10
5
0
100
80
60
40
20
0
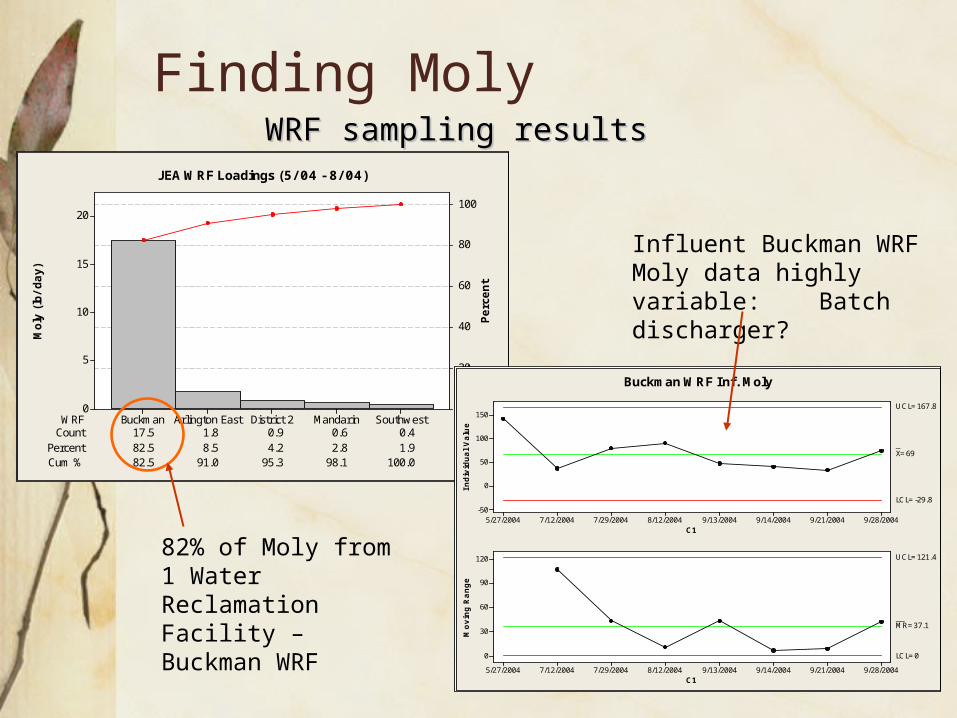
JEA WRF Loadings (5/ 04 - 8/ 04)
C1
Indiv
idual V
alu
e
9/28/20049/21/20049/14/20049/13/20048/12/20047/29/20047/12/20045/27/2004
150
100
50
0
-50
_X=69
UCL=167.8
LCL=-29.8
C1
Movin
g R
ange
9/28/20049/21/20049/14/20049/13/20048/12/20047/29/20047/12/20045/27/2004
120
90
60
30
0
__MR=37.1
UCL=121.4
LCL=0
Buckman WRF Inf. Moly
82% of Moly from 1 Water Reclamation Facility – Buckman WRF
Influent Buckman WRF Moly data highly variable: Batch discharger?
WRF sampling resultsWRF sampling results
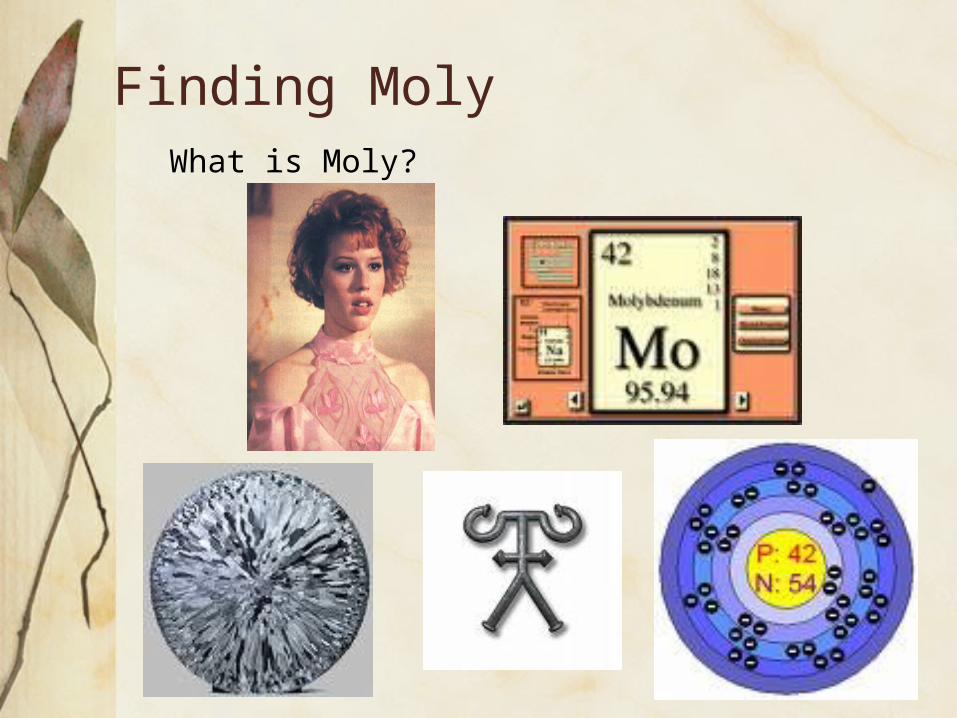
Finding MolyWhat is Moly?

Finding Moly
Research Results:Moly used in
Cooling tower chemical treatmentPetroleum lubricantsCatalyst for reactionsCorrosion inhibitor

Finding MolyCooling towers are
widespread in commercial, industrial, and institutional
applicationsIndustrial Uses of Moly: Cooling Towers (CT)
How do you quantify Moly loadings from CTs?
Data from CT chemical treatment vendors
estimated 12.5 lb/day of Moly
Ask the vendors that maintain them!

Finding Moly
Average Monthly Moly Levels in Pellets1/03 - 7/04
0
20
40
60
80
100
Co
nc.
(m
g/K
g)
winter
summer
winter
summer
Industrial Sources: Cooling Towers
JEAJEA

Finding MolyCooling Towers – are they the culprit? Lets do a little mass balance to find out!
Sample Date Inf Eff % removal
5/27/2004 144 53 0.637/29/2004 79.6 46.9 0.418/12/2004 91 48 0.479/13/2004 48 26 0.469/14/2004 42 28 0.339/21/2004 34 28 0.189/28/2004 76 34 0.55
0.43Average
Buckman WRF Moly Data
Average Moly removal rate at Buckman WRF: 43%
Estimated CT Moly loading: 12.5 lb/day.
12.5 lb/day * .43 = 5.4 lb/day in da pellets from CTs
It only takes 5.5 lb/day to reach the ceiling concentration limit!
Average WRF Inf. Loading: 21lb/day
12.5 = 21
Finding Moly
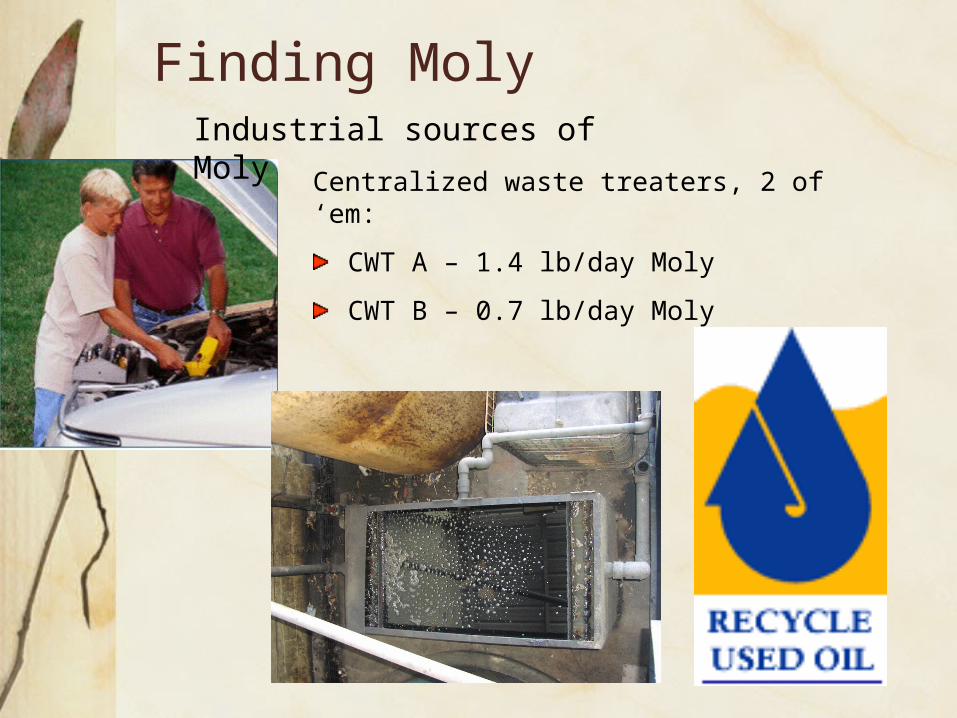
Centralized waste treaters, 2 of ‘em:
CWT A – 1.4 lb/day Moly
CWT B – 0.7 lb/day Moly
Industrial sources of Moly
Finding Moly
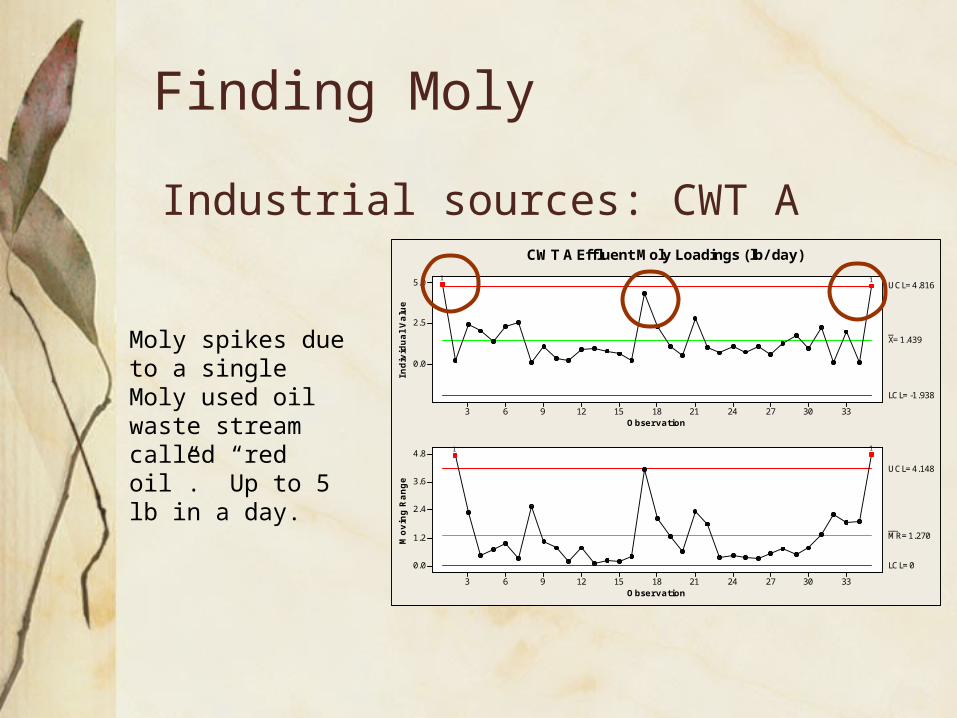
Industrial sources: CWT A
Observation
Indiv
idual V
alu
e3330272421181512963
5.0
2.5
0.0
_X=1.439
UCL=4.816
LCL=-1.938
Observation
Movin
g R
ange
3330272421181512963
4.8
3.6
2.4
1.2
0.0
__MR=1.270
UCL=4.148
LCL=0
11
11
CWT A Effluent Moly Loadings (lb/ day)
Moly spikes due to a single Moly used oil waste stream called “red oil”. Up to 5 lb in a day.

Finding Moly
Organic chemical manufacturer, 3 of ‘em, but only one used it as a catalyst:
• 4.5 lbs/day - consistent loading
Brewery - This Molys for you!Used in can rinse as a corrosion inhibitor: • 0.27 lb/day – consistent loading
Other Industrial sources of Moly

Finding MolyM
oly
lb/day
Perc
ent
Count7.3 3.7 1.4
Cum % 64.4 87.6 94.9 98.6 100.0
12.50 4.50 1.41 0.72 0.27Percent 64.4 23.2
20
15
10
5
0
100
80
60
40
20
0
Industrial Moly Sources
Total estimated industrial Moly loadings: 19 lb/day.
Actual daily average WRF Moly loading: 21 lb/day
19 lb/day ~ 21 lb/day
64% of Moly from CTs
Total estimated industrial loadings
More Fun w/ Mass Balances!

Free Moly! Local limit vs. Pollution Prevention
Long process
Affects everyone
Costly to re-engineer or pretreat for industries
Facilities w/ CTs to sample & report for compliance
Admin burden on IP to monitor CTs
There was an Moly free alternative
Substitution: >50% reduction in Moly
Minimal impact on customers
Minimal effort to implement
• Moly not an active ingredient in CTs• Moly used as a tracer
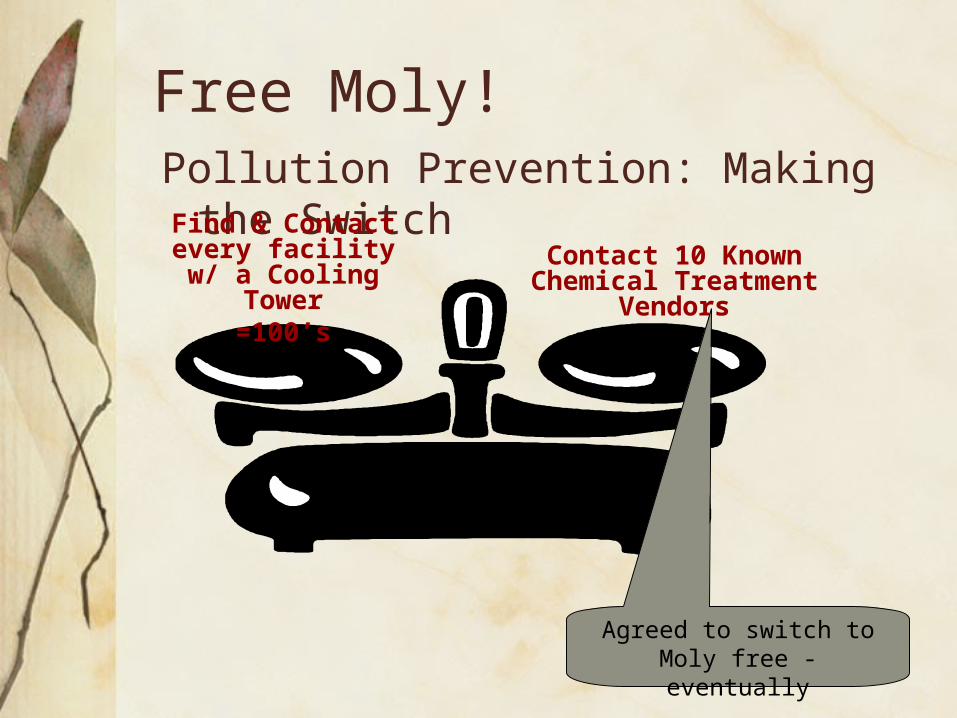
Free Moly!Pollution Prevention: Making the
Switch Find & Contact every facility w/ a
Cooling Tower=100’s
Contact 10 Known Chemical Treatment
Vendors
Agreed to switch to Moly free - eventually

Moly Free is the Way to Be!
Industry voluntary efforts: • IUs went CT Moly free
immediately• CWT dropped Moly laden “red oil”• Brewery switched to Moly free
can rinse
Fostering a collaborative relationship really paid off!!
Moly Free is the Way to Be!
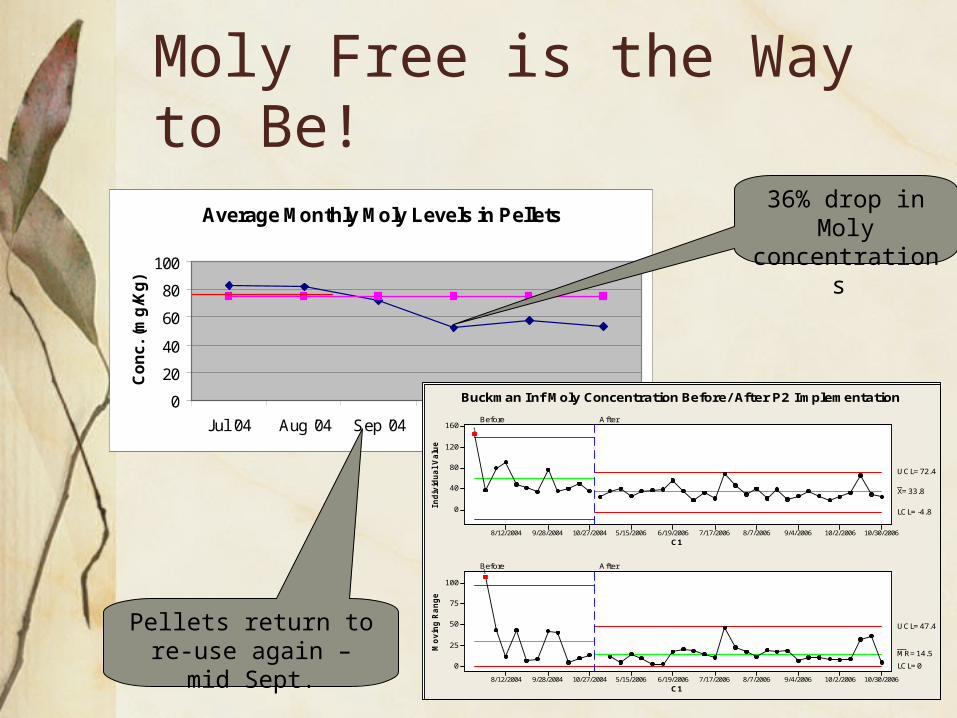
Average Monthly Moly Levels in Pellets
0
20
40
60
80
100
Jul '04 Aug '04 Sep '04 Oct '04 Nov '04 Dec '04
Co
nc.
(m
g/K
g) Limit - 75mg/Kg
C1
Indiv
idual Valu
e
10/30/200610/2/20069/4/20068/7/20067/17/20066/19/20065/15/200610/27/20049/28/20048/12/2004
160
120
80
40
0
_X=33.8
UCL=72.4
LCL=-4.8
Before After
C1
Movin
g R
ange
10/30/200610/2/20069/4/20068/7/20067/17/20066/19/20065/15/200610/27/20049/28/20048/12/2004
100
75
50
25
0
__MR=14.5
UCL=47.4
LCL=0
Before After
1
1
Buckman Inf Moly Concentration Before/ After P2 Implementation
36% drop in Moly concentrations
Pellets return to re-use again – mid Sept.
Moly Free is the Way to Be!Current Status:• Best Management Practice for
Cooling Tower established.
• Local Limit eventually established.
• IP Coordinator still sweating.
Did not negatively impact customers
With Moly out of CTs – plenty to allocate
to the few industries that need it
But not as much and not over Moly!

Moly Free is the Way to Be!Conclusions
Returning biosolid pellets to marketable status was achieved through:Conducting data driven root cause analysis.Developing a simple yet effective P2 program.Implementing the program through collaboration w/ chemical vendors & industries.

Questions?