Glucose-Stimulated Insulin Secretion Fundamentally ...€¦ · Glucose-stimulated insulin secretion...
14
Glucose-Stimulated Insulin Secretion Fundamentally Requires H 2 O 2 Signaling by NADPH Oxidase 4 Lydie Plecitá-Hlavatá, 1 Martin Jab urek, 1 Blanka Holendová, 1 Jan Tauber, 1 Vojt ech Pavluch, 1 Zuzana Berková, 2 Monika Cahová, 2 Katrin Schröder, 3 Ralf P. Brandes, 3 Detlef Siemen, 4 and Petr Je zek 1 Diabetes 2020;69:1341–1354 | https://doi.org/10.2337/db19-1130 NADPH facilitates glucose-stimulated insulin secretion (GSIS) in pancreatic islets (PIs) of b-cells through an as yet unknown mechanism. We found NADPH oxidase iso- form 4 (NOX4) to be the main producer of cytosolic H 2 O 2 , which is essential for GSIS; an increase in ATP alone was insufficient for GSIS. The fast GSIS phase was absent from PIs from NOX4-null, b-cell–specific knockout mice (NOX4bKO) (though not from NOX2 knockout mice) and from NOX4-silenced or catalase-overexpressing INS-1E cells. Lentiviral NOX4 overexpression or H 2 O 2 rescued GSIS in PIs from NOX4bKO mice. NOX4 silencing sup- pressed Ca 21 oscillations, and the patch-clamped K ATP channel opened more frequently when glucose was high. Mitochondrial H 2 O 2 , decreasing upon GSIS, provided al- ternative redox signaling when 2-oxo-isocaproate or fatty acid oxidation formed superoxides through electron- transfer flavoprotein:Q-oxidoreductase. Unlike GSIS, such insulin secretion was blocked with mitochondrial antiox- idant SkQ1. Both NOX4 knockout and NOX4bKO mice exhibited impaired glucose tolerance and peripheral in- sulin resistance. Thus, the redox signaling previously sug- gested to cause b-cells to self-check hypothetically induces insulin resistance when it is absent. In conclusion, increases in ATP and H 2 O 2 constitute an essential signal that switches on insulin exocytosis for glucose and branched-chain oxoacids as secretagogues (it does so partially for fatty acids). Redox signaling could be impaired by cytosolic antioxidants; hence, those targeting mito- chondria should be preferred for clinical applications to treat (pre)diabetes at any stage. Insulin, which is released from pancreatic b-cells, controls the blood glucose level in healthy individuals, and insulin release is impaired in those with diabetes (1–4). An understanding of the pathophysiology of the insulin release mechanism is indispensable for clinical innovation. The consensus mechanism of glucose sensing in pancreatic b-cells involves the elevation of ATP synthesis by mitochon- dria upon increased glucose metabolism enabled by the human GLUT1– or rodent GLUT2–mediated glucose uptake and fast glycolysis, which generates pyruvate, leading to ATP production by oxidative phosphorylation (OXPHOS) (1). The increased ATP-to-ADP ratio in the subplasmalem- mal cytosol in b-cells should cause the K ATP channel to close (4–8), depolarizing the plasma membrane and acti- vating voltage-gated L-type Ca 21 (Ca L ) channels. The resulting Ca 21 entry stimulates Ca 21 -dependent exocyto- sis of the insulin-containing secretory granules (8). Glucose-stimulated insulin secretion (GSIS) is facilitated by an increase in cytosolic NADPH (4,9–12), as various redox shuttles affecting metabolism generate cytosolic NADPH upon glucose intake, at the expense of NADH in the mito- chondrial matrix (4,9–12). Also, the first enzyme of the pentose phosphate pathway, glucose-6-phosphate dehydro- genase (G6PDH), might contribute to the NADPH surplus upon GSIS (13–15). The resulting NADPH may be supplied to NADPH oxidase (NOX) isoforms 1 (NOX1) and 2 (NOX2) (16,17), but only if they are properly assembled. Neverthe- less, the only constitutively expressed and assembled isoform is NOX4, and it is the only one that produces H 2 O 2 directly (18,19). Inhibition of an unidentified NOX isoform was reported to attenuate GSIS when an antisense p47 PHOX oligonucleotide (20), the nonspecific NOX (plus complex I) inhibitor diphenyleneiodonium (DPI) (21,22), or an inhibitor of two isoforms (23) was used. Hence, if any NOX isoform participates in GSIS, it must be definitively recognized. 1 Department of Mitochondrial Physiology, No. 75, Institute of Physiology of the Czech Academy of Sciences, Prague, Czech Republic 2 Institute of Clinical and Experimental Medicine, Prague, Czech Republic 3 Institut für Kardiovaskuläre Physiologie, Goethe-Universität, Frankfurt, Germany 4 Klinik für Neurologie, Universität Magdeburg, Magdeburg, Germany Corresponding author: Petr Je zek, [email protected] Received 12 November 2019 and accepted 30 March 2020 This article contains supplementary material online at https://doi.org/10.2337/ db20-4567/suppl.12053772. © 2020 by the American Diabetes Association. Readers may use this article as long as the work is properly cited, the use is educational and not for profit, and the work is not altered. More information is available at https://www.diabetesjournals .org/content/license. Diabetes Volume 69, July 2020 1341 METABOLISM
Transcript of Glucose-Stimulated Insulin Secretion Fundamentally ...€¦ · Glucose-stimulated insulin secretion...
Glucose-Stimulated Insulin Secretion FundamentallyRequires H2O2 Signaling by NADPH Oxidase 4Lydie Plecitá-Hlavatá,1 Martin Jab�urek,1 Blanka Holendová,1 Jan Tauber,1 Vojt�ech Pavluch,1
Zuzana Berková,2 Monika Cahová,2 Katrin Schröder,3 Ralf P. Brandes,3 Detlef Siemen,4 and Petr Je�zek1
Diabetes 2020;69:1341–1354 | https://doi.org/10.2337/db19-1130
NADPH facilitates glucose-stimulated insulin secretion(GSIS) in pancreatic islets (PIs) of b-cells through an asyet unknown mechanism. We found NADPH oxidase iso-form 4 (NOX4) to be the main producer of cytosolic H2O2,which is essential for GSIS; an increase in ATP alone wasinsufficient for GSIS. The fast GSIS phase was absentfrom PIs from NOX4-null, b-cell–specific knockout mice(NOX4bKO) (though not from NOX2 knockout mice) andfrom NOX4-silenced or catalase-overexpressing INS-1Ecells. Lentiviral NOX4 overexpression or H2O2 rescuedGSIS in PIs from NOX4bKO mice. NOX4 silencing sup-pressed Ca21 oscillations, and the patch-clamped KATP
channel opened more frequently when glucose was high.Mitochondrial H2O2, decreasing upon GSIS, provided al-ternative redox signaling when 2-oxo-isocaproate or fattyacid oxidation formed superoxides through electron-transfer flavoprotein:Q-oxidoreductase. Unlike GSIS, suchinsulin secretion was blocked with mitochondrial antiox-idant SkQ1. Both NOX4 knockout and NOX4bKO miceexhibited impaired glucose tolerance and peripheral in-sulin resistance. Thus, the redox signaling previously sug-gested to cause b-cells to self-check hypotheticallyinduces insulin resistance when it is absent. In conclusion,increases in ATP and H2O2 constitute an essential signalthat switches on insulin exocytosis for glucose andbranched-chain oxoacids as secretagogues (it does sopartially for fatty acids). Redox signaling could be impairedby cytosolic antioxidants; hence, those targeting mito-chondria should be preferred for clinical applications totreat (pre)diabetes at any stage.
Insulin, which is released from pancreatic b-cells, controlsthe blood glucose level in healthy individuals, and insulinrelease is impaired in those with diabetes (1–4). An
understanding of the pathophysiology of the insulin releasemechanism is indispensable for clinical innovation. Theconsensus mechanism of glucose sensing in pancreaticb-cells involves the elevation of ATP synthesis by mitochon-dria upon increased glucose metabolism enabled by thehuman GLUT1– or rodent GLUT2–mediated glucose uptakeand fast glycolysis, which generates pyruvate, leading to ATPproduction by oxidative phosphorylation (OXPHOS) (1).
The increased ATP-to-ADP ratio in the subplasmalem-mal cytosol in b-cells should cause the KATP channel toclose (4–8), depolarizing the plasma membrane and acti-vating voltage-gated L-type Ca21 (CaL) channels. Theresulting Ca21 entry stimulates Ca21-dependent exocyto-sis of the insulin-containing secretory granules (8).
Glucose-stimulated insulin secretion (GSIS) is facilitatedby an increase in cytosolic NADPH (4,9–12), as various redoxshuttles affecting metabolism generate cytosolic NADPHupon glucose intake, at the expense of NADH in the mito-chondrial matrix (4,9–12). Also, the first enzyme of thepentose phosphate pathway, glucose-6-phosphate dehydro-genase (G6PDH), might contribute to the NADPH surplusupon GSIS (13–15). The resulting NADPH may be suppliedto NADPH oxidase (NOX) isoforms 1 (NOX1) and 2 (NOX2)(16,17), but only if they are properly assembled. Neverthe-less, the only constitutively expressed and assembled isoformis NOX4, and it is the only one that produces H2O2 directly(18,19). Inhibition of an unidentified NOX isoform wasreported to attenuate GSIS when an antisense p47PHOX
oligonucleotide (20), the nonspecific NOX (plus complex I)inhibitor diphenyleneiodonium (DPI) (21,22), or an inhibitorof two isoforms (23) was used. Hence, if any NOX isoformparticipates in GSIS, it must be definitively recognized.
1Department of Mitochondrial Physiology, No. 75, Institute of Physiology of theCzech Academy of Sciences, Prague, Czech Republic2Institute of Clinical and Experimental Medicine, Prague, Czech Republic3Institut für Kardiovaskuläre Physiologie, Goethe-Universität, Frankfurt, Germany4Klinik für Neurologie, Universität Magdeburg, Magdeburg, Germany
Corresponding author: Petr Je�zek, [email protected]
Received 12 November 2019 and accepted 30 March 2020
This article contains supplementary material online at https://doi.org/10.2337/db20-4567/suppl.12053772.
© 2020 by the American Diabetes Association. Readers may use this article aslong as the work is properly cited, the use is educational and not for profit, and thework is not altered. More information is available at https://www.diabetesjournals.org/content/license.
Diabetes Volume 69, July 2020 1341
METABOLISM
Only reactive oxygen species (ROS) of mitochondrialorigin, such as ROS resulting from the addition of mono-oleoyl-glycerol (23), have been suggested to modulate in-sulin secretion (24). An effect of antioxidants has beenreported, with glutathione being decreased by diethylma-leate in INS-1(823/13) cells and acting as an unspecified linkbetweenGSIS and externalH2O2 (25). However, it has neverbeen considered that elevated ATP is insufficient for GSIS,nor that any redox signaling may be essential for GSIS.Thus, the elevation of the ATP-to-ADP ratio was thought toclose KATP channels without any additional requirement forparallel redox signaling. A rather weak antioxidant defenseand low redox buffer capacity, but high thioredoxin andperoxiredoxin content (26), provide an ideal, delicate ROShomeostasis in b-cells, although this homeostasis might bedisturbed by a relatively weak insult and may spread withinthe cytosol (2,27).
This work revisited a mechanism of GSIS, and thisarticle describes a novel mechanism of NOX4-mediatedredox stimulation of insulin secretion, which, togetherwith increased ATP, is essential for GSIS. Moreover, theabsence of this redox signaling affects insulin sensitivity inperipheral tissues.
RESEARCH DESIGN AND METHODS
Tests on MiceExperiments were approved by the committee of the In-stitute of Molecular Genetics (Prague, Czech Republic) andcomplied with the 2010/63/EU directive (U.S. NationalInstitutes of Health publication no. 85-23, revised in 1996)and the guidelines laid out in Animal Research: Reportingof In Vivo Experiments.
NOX4-null (knockout) (NOX4KO) mice were gener-ated through targeted deletion of the translation initi-ation site and exons 1 and 2 of the gene (ResearchResource Identifiers [RRID]: Mouse Genome Informatics[MGI]:4838554) (28,29). Control (“backcrossed”) micewere obtained by intercrossing NOX4-null progenywith C57BL/6 mice for 10 generations. NOX2-null(knockout) (NOX2KO) mice were from The Jackson Lab-oratory (Bar Harbor, ME) (B6.129S-Cybbtm1Din/J,RRID:IMSR_JAX:002365).
The b-cell–specific NOX4KO (NOX4bKO) mouse wascreated by crossing NOX4Flox/Flox mice with B6.Cg-Tg(Ins2-Cre)25Mgn/J mice (RRID:IMSR_JAX:003573) (30,31). Tailgenotyping selected congenic NOX4Flox1/1Cre1/1 (B6.Cg-Nox4,tm1Ams.Tg[Ins2-cre]25Mgn) mice (NOX4bKO).NOX4 deletion, specifically in mouse b-cells, was verified(Supplementary Fig. 3A and B). At least 64% of b-cellsexhibited the b-knockout alleles (;80% of the b-cell frac-tion of pancreatic islet [PI] cells). Peripheral insulin re-sistance was evaluated as described by Alán et al. (32).
An intraperitoneal (i.p.) glucose tolerance test anda parallel insulin assay were performed after the i.p. in-jection of glucose (1 mg/g body weight;;111mmol glucoseper mouse) into mice deprived of food overnight. Blood
was taken from a blood vessel in the ocular plexus. Testswere also performed with 2-oxoisocaproate (OIC) (1 mg/gbody weight; ;153 mmol OIC per mouse). Blood glucosewas determined with a glucometer (Roche, Basel, Switzer-land); insulin was determined with an ELISA kit (Mercodia,Uppsala, Sweden). Samples were taken at two or three timepoints for both insulin and glucose estimates from eachmouse. Mean data from 10–27 mice (sex is specified in thevarious figure legends) enabled the construction of timedependencies.
Pancreatic Islet Isolation and PerifusionTwo male and two female mice with each genotype wereanesthetized. The pancreases were digested with collage-nase, and the PIs were isolated subsequently on a Ficollgradient (33). The yield was 100–200 islets per mouse.
Dynamic insulin release fromPIs was determined by usingperifusion. Approximately 100 islets were placed in a columnwith a flow adaptor (1 3 7 cm Econo-Column; Bio-Rad,Hercules, CA) attached, and the islets were immobilized withBio-Gel P4 (Bio-Rad). PIs were washed for 60 min in a con-tinuous flow of glucose-free Krebs-Ringer HEPES (KRH)buffer (135 mmol/L NaCl, 3.6 mmol/L KCl, 10 mmol/LHEPES, 0.5mmol/LMgCl2, 1.5 mmol/L CaCl2, 0.5 NaH2PO4,0.1% BSA [pH 7.4]). Insulin secretion was stimulated withKRH buffer containing stimulatory compounds. The perfus-ate was collected at rates of 0.5 6 0.1 mL/min. Insulin wasdetected with an Insulin Mouse ELISA High Sensitive kit(BioVendor, Brno, Czech Republic). Islets were lysed, andtheir DNA content was quantified by using a PicoGreen Assay(Thermo Fisher Scientific, Eugene, OR).
NOX4 Overexpression by Using Lentiviral ParticlesPIs were seeded on laminin-covered 96-well plates (Bio-Lamina, Stockholm, Sweden). NOX4 was overexpressed inPIs isolated from control (NOX4Flox/Flox) and NOX4bKOmiceby using 72-h lentiviral transduction with LentiORF particles(OriGene, Rockville, MD) that contain pLenti-C-mGFP asa control, or pLenti-mouse NOX4-C-mGFP for NOX4 over-expression. Insulin release was assayed after 6 min.
Cell Cultivation and TransfectionRat insulinoma INS-1E cells (C0018009; AddexBio, SanDiego, CA) (31) were routinely cultivated with 11 mmol/Lglucose in RPMI 1640 medium supplemented with10 mmol/L HEPES, 1 mmol/L pyruvate, 5% (v/v) FCS,50 mmol/L mercaptoethanol, 50 IU/mL penicillin, and50 mg/mL streptomycin. The 1- and 15-h incubationswere also performed with 3 mmol/L glucose (34).
Cells were transfected twice in 24 h with Oligofect-amine (Thermo Fisher Scientific) with two predesignedAmbion siRNAs against rat NOX4 (exons 14 and 10;Thermo Fisher Scientific) in a serum- and antibiotic-freemedium. Their 59 to 39 sequences were CCGUUUGCAUCGAUACUAATTandCAUUAUCUCAGUAAUCAAUTT.Also, differentpairs of predesigned Ambion siRNAs against rat SUR1 (Abcc8),G6PDH, and branched-chain a-ketoacid dehydrogenase
1342 H2O2 Is Essential for Insulin Secretion Diabetes Volume 69, July 2020
(BCKDH) complex E1a (Thermo Fisher Scientific) were used.The pZeoSV2(1) vector encoding human catalase (donated byC. Glorieux, Université Catholique de Louvain, Belgium) wasalso used for transfection (2.5 mL lipofectamine/mg DNA;Thermo Fisher Scientific).
Insulin Release from CellsOne day before 48-h transfections, cells were seeded (0.2 3106 cells/well) in 12-well plates coated with poly-L-lysine.Insulin was assayed in KRH (with or without 2 mmol/Lglutamine) by using a Rat Insulin ELISA Kit (U-E type;Shibayagi Co., Shibukawa, Japan) after a 5-min preincubationphase before glucose (25 mmol/L) was added.
Cell Auxiliary AssaysH2O2 monitoring with TCS-SP2 or TCS-SP8 confocalmicroscopes (Leica) used an overexpressed H2O2-selectivefluorescent protein, either HyPer-C (35) or heat shockprotein–fluorescence resonance energy transfer (HSP-FRET) (36). A sample chamber (37°C) was supplied with5% CO2. INS-1E cells were transfected with an X-tremeGeneDNA reagent (Roche), and the coexpression of NOX4siRNAs was facilitated by using Lipofectamine 2000 ina serum-free and antibiotic-free medium for 24 h. AnATP Bioluminescence Assay kit HS II (Roche) was usedto quantify ATP.
Monitoring of Cell K1 and Ca21 InfluxA FluxOR Potassium Ion Channel Assay (Thermo FisherScientific) was used to assay Tl1 influx rates. INS-1E cellswere preloaded with a “stimulus buffer” containing Tl1.The emission of FluxOR was monitored at 525 nm on anRF5301 spectrofluorometer (Shimadzu). Fluorescent Ca21
in the cell cytosol was monitored with Fura-2.
Cell Patch Clamp RecordingPatch pipettesmade of borosilicate glass (Harvard Apparatus,Kent, U.K.), with a resistance of 15–20 mol/LV, were filledwith an isotonic solution (150 mmol/L KCl, 10 mmol/LHEPES, 1.2 mmol/L CaCl2 [pH 7.2]). Cells were incubatedin a solution without glucose (134 mmol/L NaCl, 6 mmol/LKCl, 10 mmol/L HEPES, 1.2 mmol/L MgCl2, 1.2 mmol/LCaCl2 [pH 7.2]) for 2 h. Single-channel currents with noglucose (130 mmol/L KCl, 20 mmol/L HEPES, 10 mmol/LEGTA, 4 mmol/L MgCl2, 2.4 mmol/L CaCl2 [pH 7.15]) wererecorded in the cell-attached mode with an EPC-7 amplifier(HEKA Electronics, Lambrecht, Germany); these currentswere low-pass filtered at a corner frequency of 0.5 kHz andsampled at a frequency of 2.5 kHz by using Clampexsoftware version 9.2. Analyses were done in Clampfitsoftware version 9.2 (Axon Instruments, Foster City, CA).
Statistical AnalysisBiological (N) and experimental (n) replicates are listed.ANOVA (t test) used the Tukey and Holm-Sidak tests (forP values, see the Supplementary Material) on the prevalidateddata (normality test). Calculations were performed in Sigma-Stat software version 3.1 (Systat Software, San Jose, CA).
Data and Resource AvailabilityData are available from the corresponding author uponrequest.
RESULTS
GSIS Suppression in NOX4-Silenced INS-1E CellsTo evaluate the effects of NOX4-produced H2O2, twoNOX4 siRNAs were validated (Supplementary Fig. 1A);these siRNAs were always tested in combination in INS-1E cells. When stimulated with 25 mmol/L glucose,a linear, steady release of insulin (2.9 6 0.8 ng $min21 $ 1026 cells [N 5 10]) was observed in non-transgenic (ntg) cells (scrambled siRNA), whereas rateswere 4% 6 3% without glucose (positive and negativeglucose differences represent the rate of GSIS). InNOX4-silenced cells, GSIS rates were 16% 6 12%(N 5 10) (Fig. 1A and B); they were 30% 6 20% afterpreincubation with 3 mmol/L glucose for 15 h (N 5 5)(Fig. 1B). NOX activity (evaluated with the nitrobluetetrazolium assay; Fig. 1C) and the amount of NOX4 inprotein (Fig. 1D) were predominantly reduced in si-lenced cells. GSIS rates (N 5 3) were inhibited to10% 6 8% with stigmatellin (which blocks mitochon-drial respiration and hence ATP synthesis), to 8% 6 5%with DPI (which nonspecifically inhibits NOX), and to38% 6 20% with 6-aminonicotin-amide (which blocksthe pentose phosphate pathway).
Transfections with SUR1 siRNAs, disassembling KATP
(37), decreased GSIS rates to 20% 6 1% (N 5 3) (Fig. 1Aand Supplementary Fig. 1B). Silencing G6PDH (Supple-mentary Fig. 2C), thereby diminishing NADPH, reducedGSIS by ;50% (N 5 3) (Fig. 1E). Catalase overexpression(Fig. 1F and Supplementary Fig. 1F) and the NOX4-selectiveinhibitor GKT-137831 (Fig. 1G) almost completely blockedGSIS (N5 3). Besides the ntg cells’ and NOX4-silenced cells’equal responses to KCl, the ability of NOX4-silenced cellsto release insulin was demonstrated by using glibenclamideto close KATP channels, which restored insulin secretion(N 5 3) (Fig. 1G).
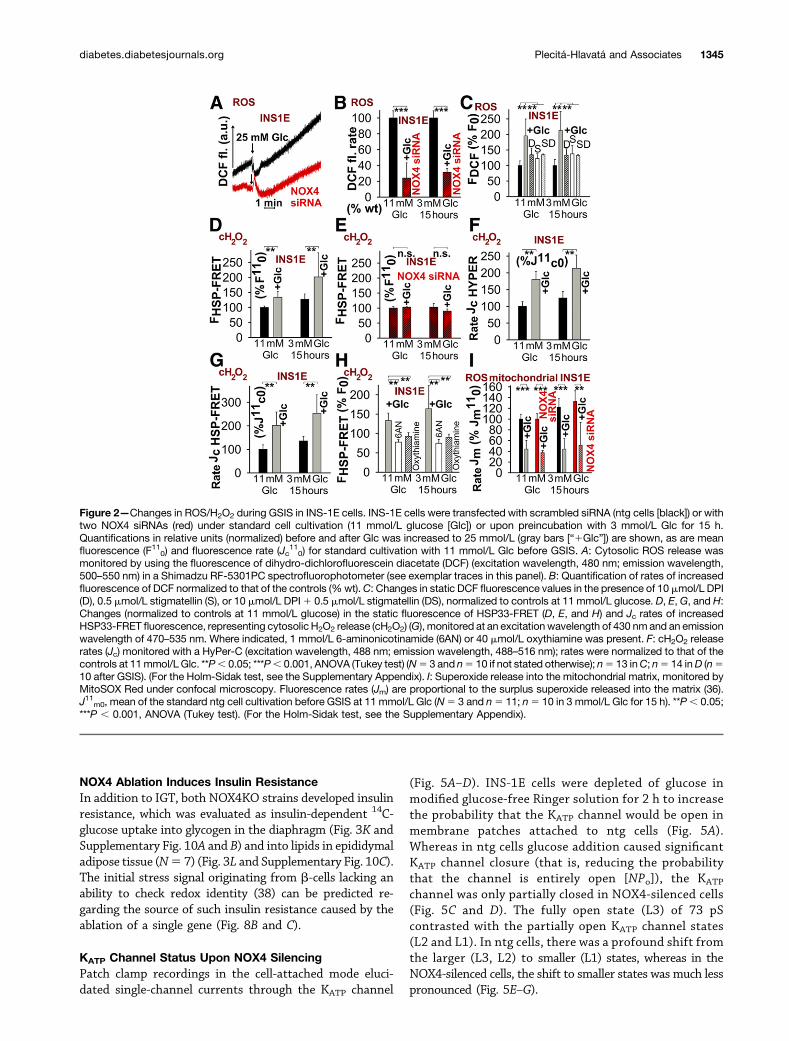
Next we demonstrated that NOX4 predominantly par-ticipates in accelerated cytosolic ROS/H2O2 release uponGSIS. Rates and levels of ROS release in the cytosol weresignificantly less elevated in NOX4-silenced INS-1E cells(Fig. 2A–H). Independent of NOX4 absence, mitochondrialROS declined (Fig. 2I), whereas cytosolic ATP was elevated(Fig. 1H).
NOX4 Is Essential for the Initial GSIS Phase In VivoTo confirm that NOX4 is essential for GSIS in vivo,NOX4KO mice (Fig. 3A) and NOX4bKO mice (Fig. 3B)were studied. (For genotype verification and RIP-Cre effects(30,31), see Supplementary Figs. 3 and 4.) Mice (12 weeksold) were starved overnight, blood was collected from theocular plexus, and then an i.p. glucose tolerance test wasperformed using that blood, while also assaying for secretedinsulin. Samples from two or three time points for eachmouse (Supplementary Fig. 5) allowed for constructions of
diabetes.diabetesjournals.org Plecitá-Hlavatá and Associates 1343

average time dependencies. In both NOX4KO mice (N 534 time courses) and NOX4bKO mice (N 5 37 timecourses), the initial fast phase of insulin release into theblood circulation was abolished; this was not the case inage-matched controls: the “backcrossed”mice (N5 19 timecourses) (Fig. 3A) and NOX4Flox/Flox mice (N 5 30 timecourses) (Fig. 3B), respectively. Concomitant glycemia wasreduced more slowly in knockout mice, manifesting im-paired glucose tolerance (IGT) (Fig. 3C, D, K, and L andSupplementary Figs. 6 and 7). Substantial insulin wasreleased upon stimulation with glibenclamide without glu-cose in both knockout mouse strains (four time courseseach, accompanied by glycemia, which was probably ele-vated because of stress; Fig. 3E–H) and upon glucosestimulation in NOX2KO mice (N 5 3 time courses; N 55 time courses for backcrossed controls) (Fig. 3I and J).
Perifusion of PIs (the typically predominant b-cell pop-ulation; Supplementary Fig. 8) isolated from knockout micereflected profoundly diminished GSIS in its first fast phase(N5 5) (Fig. 4A–D), sensitive to GKT-137831 (N5 3) (Fig.4D). However, significant responses to glibenclamide (N 53) were found when it was added alone (Fig. 4E and F) andwith glucose (Fig. 4C andD). Glucose-induced release of ROSin cytosol was attenuated in NOX4-deficient PIs (N5 3) (Fig.4I–K). Insulin release was not suppressed when induced byfatty acids with 5mmol/L glucose (N5 2) (Fig. 4G andH andSupplementary Fig. 9), because the majority of fatty acid–stimulated insulin secretion (FASIS) is dependent on GPR40and independent from KATP (2,4,27) (Fig. 6G).
To investigate the possibility of restoring GSIS, mouseNOX4 was overexpressed in PIs by using lentiviral trans-duction (N 5 3) (Fig. 4L). This overexpression rescuedGSIS at the 6th minute in NOX4bKO PIs, whereas in thecontrol cells (NOX4Flox/Flox PIs), it increased GSIS by 1.4-fold (Fig. 4L). GSIS could also be rescued in PIs fromknockout mice by perifusing with H2O2 for 10 min (Fig.4M and N). In conclusion, our data show NOX4-mediatedH2O2 release to be an essential comediator of GSIS, inparallel with ATP (Fig. 4O), and thus both must be elevatedfor GSIS to occur (Fig. 8A).
Figure 1—GSIS suppression in INS-1E cells upon NOX4 silencing.A, E, F, and G: Typical time courses of insulin release in INS-1E cellsafter glucose (Glc) was added to a final concentration of 25 mmol/L;without glucose (quantified in B); without glucose but with 1 mmol/Lglibenclamide (G, green); with 30 mmol/L KCl (G, gray); or afterpreincubation with the NOX4-selective inhibitor GKT-137831(15 mmol/L) before the addition of glucose (G, magenta). B: Timecourses were quantified for standard cultivation (11mmol/L Glc;N510 time courses) and for preincubation with 3 mmol/L Glc for 15 h(N 5 5 time courses). Also tested were SUR1-silenced INS-1E cells
(A, purple), G6PDH-silenced INS-1E cells (E, blue), and cells withoverexpressed catalase (F, dark red). B: **P, 0.05 (ANOVA, Tukeytest) for 2nd vs. 3rd bar; ***P , 0.001 (ANOVA, Tukey test) for allcombinations except for 2nd vs. 3rd bar. (For the Holm-Sidak test,see the Supplementary Appendix). C: NOX4 enzyme activityassayed by a nitroblue tetrazolium reduction (19) in ntg cells (blackbars) and NOX4-silenced INS-1E cells (red dashed bars) normal-ized to the mean NOX4 activity in control ntg cells and in “scram-bled” cells, respectively, cultivated in 11 mmol/L Glc (N 53). D:Western blot illustrating the reduction of NOX4 protein. NOX4-silenced cells (“si NOX4”) were transfected with two NOX4 siRNAs(see RESEARCH DESIGN ANDMETHODS) by using Oligofectamine. The bargraph indicates the estimated percentage of NOX4 silencing fromthe normalized integral density, quantified by using ImageJ soft-ware. H: Total glucose-induced ATP increase (N5 3) (color codingas above).
1344 H2O2 Is Essential for Insulin Secretion Diabetes Volume 69, July 2020
NOX4 Ablation Induces Insulin ResistanceIn addition to IGT, both NOX4KO strains developed insulinresistance, which was evaluated as insulin-dependent 14C-glucose uptake into glycogen in the diaphragm (Fig. 3K andSupplementary Fig. 10A and B) and into lipids in epididymaladipose tissue (N5 7) (Fig. 3L and Supplementary Fig. 10C).The initial stress signal originating from b-cells lacking anability to check redox identity (38) can be predicted re-garding the source of such insulin resistance caused by theablation of a single gene (Fig. 8B and C).
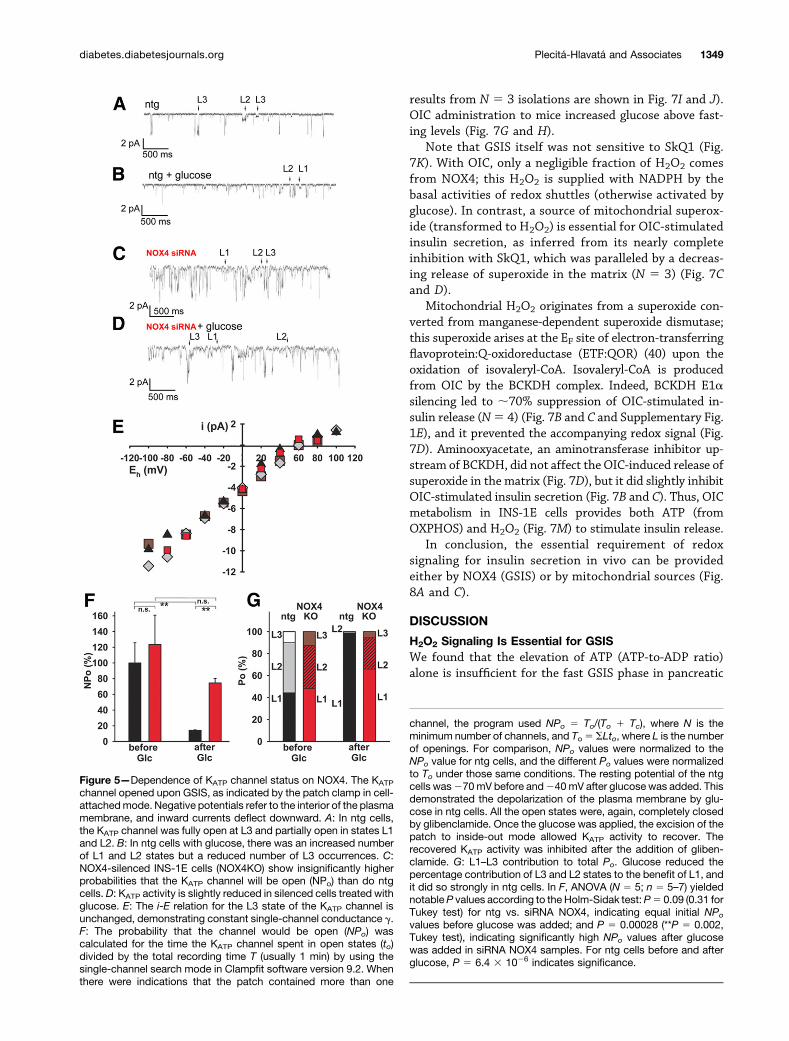
KATP Channel Status Upon NOX4 SilencingPatch clamp recordings in the cell-attached mode eluci-dated single-channel currents through the KATP channel
(Fig. 5A–D). INS-1E cells were depleted of glucose inmodified glucose-free Ringer solution for 2 h to increasethe probability that the KATP channel would be open inmembrane patches attached to ntg cells (Fig. 5A).Whereas in ntg cells glucose addition caused significantKATP channel closure (that is, reducing the probabilitythat the channel is entirely open [NPo]), the KATP
channel was only partially closed in NOX4-silenced cells(Fig. 5C and D). The fully open state (L3) of 73 pScontrasted with the partially open KATP channel states(L2 and L1). In ntg cells, there was a profound shift fromthe larger (L3, L2) to smaller (L1) states, whereas in theNOX4-silenced cells, the shift to smaller states was much lesspronounced (Fig. 5E–G).
Figure 2—Changes in ROS/H2O2 during GSIS in INS-1E cells. INS-1E cells were transfected with scrambled siRNA (ntg cells [black]) or withtwo NOX4 siRNAs (red) under standard cell cultivation (11 mmol/L glucose [Glc]) or upon preincubation with 3 mmol/L Glc for 15 h.Quantifications in relative units (normalized) before and after Glc was increased to 25 mmol/L (gray bars [“1Glc”]) are shown, as are meanfluorescence (F110) and fluorescence rate (Jc
110) for standard cultivation with 11 mmol/L Glc before GSIS. A: Cytosolic ROS release was
monitored by using the fluorescence of dihydro-dichlorofluorescein diacetate (DCF) (excitation wavelength, 480 nm; emission wavelength,500–550 nm) in a Shimadzu RF-5301PC spectrofluorophotometer (see exemplar traces in this panel). B: Quantification of rates of increasedfluorescence of DCF normalized to that of the controls (%wt).C: Changes in static DCF fluorescence values in the presence of 10 mmol/L DPI(D), 0.5 mmol/L stigmatellin (S), or 10 mmol/L DPI1 0.5 mmol/L stigmatellin (DS), normalized to controls at 11 mmol/L glucose. D, E, G, and H:Changes (normalized to controls at 11 mmol/L glucose) in the static fluorescence of HSP33-FRET (D, E, and H) and Jc rates of increasedHSP33-FRET fluorescence, representing cytosolic H2O2 release (cH2O2) (G), monitored at an excitation wavelength of 430 nm and an emissionwavelength of 470–535 nm. Where indicated, 1 mmol/L 6-aminonicotinamide (6AN) or 40 mmol/L oxythiamine was present. F: cH2O2 releaserates (Jc) monitored with a HyPer-C (excitation wavelength, 488 nm; emission wavelength, 488–516 nm); rates were normalized to that of thecontrols at 11mmol/L Glc. **P, 0.05; ***P, 0.001, ANOVA (Tukey test) (N5 3 and n5 10 if not stated otherwise); n5 13 inC; n5 14 inD (n510 after GSIS). (For the Holm-Sidak test, see the Supplementary Appendix). I: Superoxide release into the mitochondrial matrix, monitored byMitoSOX Red under confocal microscopy. Fluorescence rates (Jm) are proportional to the surplus superoxide released into the matrix (36).J11m0, mean of the standard ntg cell cultivation before GSIS at 11 mmol/L Glc (N5 3 and n5 11; n5 10 in 3 mmol/L Glc for 15 h). **P, 0.05;***P , 0.001, ANOVA (Tukey test). (For the Holm-Sidak test, see the Supplementary Appendix).
diabetes.diabetesjournals.org Plecitá-Hlavatá and Associates 1345
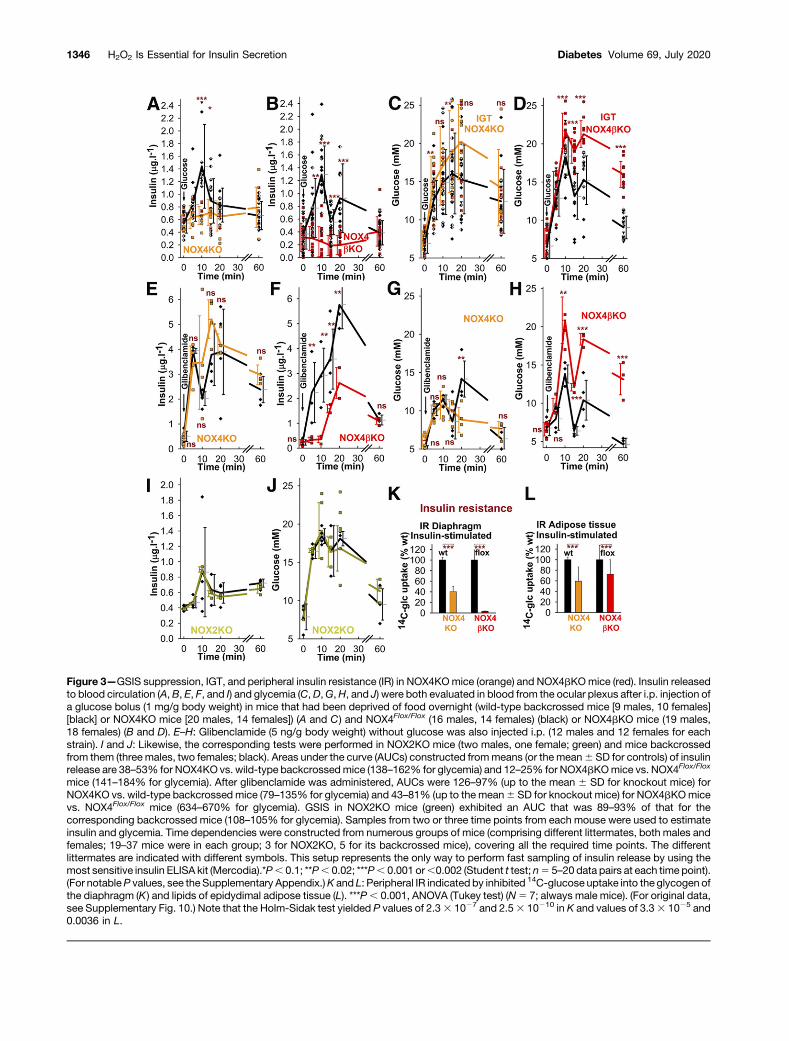
Figure 3—GSIS suppression, IGT, and peripheral insulin resistance (IR) in NOX4KOmice (orange) and NOX4bKOmice (red). Insulin releasedto blood circulation (A, B, E, F, and I) and glycemia (C,D,G,H, and J) were both evaluated in blood from the ocular plexus after i.p. injection ofa glucose bolus (1 mg/g body weight) in mice that had been deprived of food overnight (wild-type backcrossed mice [9 males, 10 females][black] or NOX4KO mice [20 males, 14 females]) (A and C) and NOX4Flox/Flox (16 males, 14 females) (black) or NOX4bKO mice (19 males,18 females) (B and D). E–H: Glibenclamide (5 ng/g body weight) without glucose was also injected i.p. (12 males and 12 females for eachstrain). I and J: Likewise, the corresponding tests were performed in NOX2KO mice (two males, one female; green) and mice backcrossedfrom them (three males, two females; black). Areas under the curve (AUCs) constructed frommeans (or the mean6 SD for controls) of insulinrelease are 38–53% for NOX4KO vs. wild-type backcrossedmice (138–162% for glycemia) and 12–25% for NOX4bKOmice vs. NOX4Flox/Flox
mice (141–184% for glycemia). After glibenclamide was administered, AUCs were 126–97% (up to the mean 6 SD for knockout mice) forNOX4KO vs. wild-type backcrossed mice (79–135% for glycemia) and 43–81% (up to the mean6 SD for knockout mice) for NOX4bKOmicevs. NOX4Flox/Flox mice (634–670% for glycemia). GSIS in NOX2KO mice (green) exhibited an AUC that was 89–93% of that for thecorresponding backcrossed mice (108–105% for glycemia). Samples from two or three time points from each mouse were used to estimateinsulin and glycemia. Time dependencies were constructed from numerous groups of mice (comprising different littermates, both males andfemales; 19–37 mice were in each group; 3 for NOX2KO, 5 for its backcrossed mice), covering all the required time points. The differentlittermates are indicated with different symbols. This setup represents the only way to perform fast sampling of insulin release by using themost sensitive insulin ELISA kit (Mercodia).*P, 0.1; **P, 0.02; ***P, 0.001 or,0.002 (Student t test; n5 5–20 data pairs at each time point).(For notableP values, see the Supplementary Appendix.)K and L: Peripheral IR indicated by inhibited 14C-glucose uptake into the glycogen ofthe diaphragm (K) and lipids of epidydimal adipose tissue (L). ***P, 0.001, ANOVA (Tukey test) (N5 7; always male mice). (For original data,see Supplementary Fig. 10.) Note that the Holm-Sidak test yielded P values of 2.33 1027 and 2.53 10210 in K and values of 3.33 1025 and0.0036 in L.
1346 H2O2 Is Essential for Insulin Secretion Diabetes Volume 69, July 2020
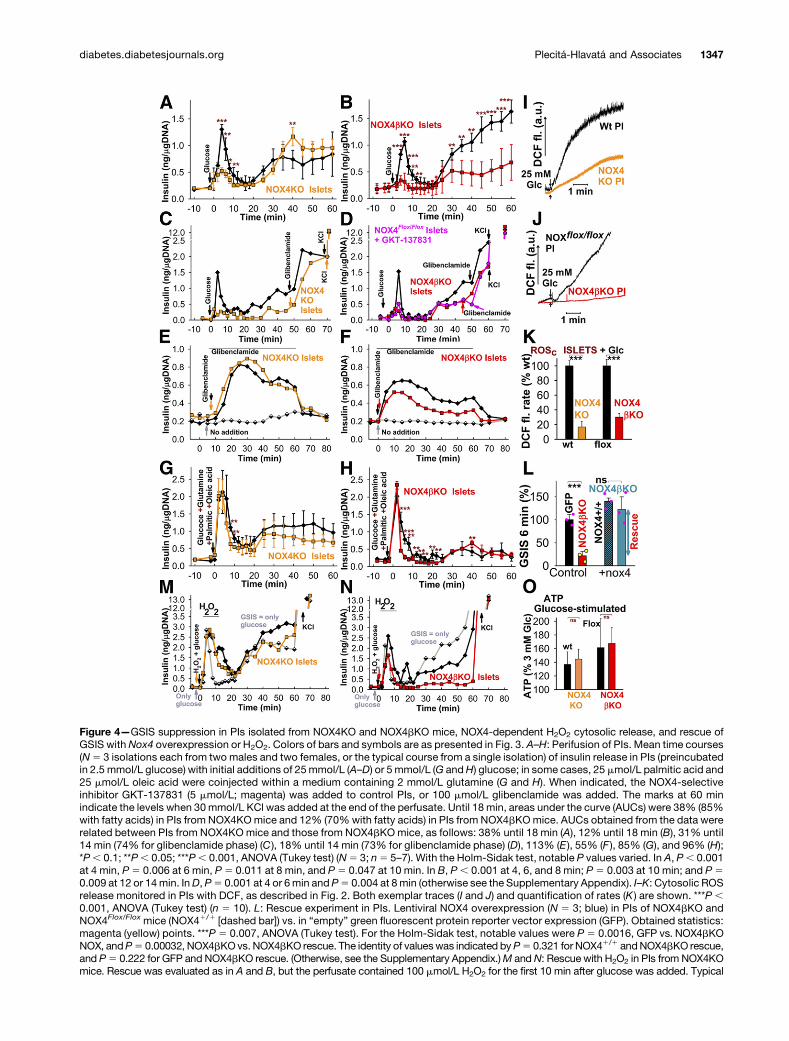
Figure 4—GSIS suppression in PIs isolated from NOX4KO and NOX4bKO mice, NOX4-dependent H2O2 cytosolic release, and rescue ofGSIS with Nox4 overexpression or H2O2. Colors of bars and symbols are as presented in Fig. 3. A–H: Perifusion of PIs. Mean time courses(N5 3 isolations each from two males and two females, or the typical course from a single isolation) of insulin release in PIs (preincubatedin 2.5 mmol/L glucose) with initial additions of 25mmol/L (A–D) or 5 mmol/L (G andH) glucose; in some cases, 25 mmol/L palmitic acid and25 mmol/L oleic acid were coinjected within a medium containing 2 mmol/L glutamine (G and H). When indicated, the NOX4-selectiveinhibitor GKT-137831 (5 mmol/L; magenta) was added to control PIs, or 100 mmol/L glibenclamide was added. The marks at 60 minindicate the levels when 30mmol/L KCl was added at the end of the perfusate. Until 18 min, areas under the curve (AUCs) were 38% (85%with fatty acids) in PIs from NOX4KOmice and 12% (70%with fatty acids) in PIs from NOX4bKOmice. AUCs obtained from the data wererelated between PIs from NOX4KO mice and those from NOX4bKOmice, as follows: 38% until 18 min (A), 12% until 18 min (B), 31% until14 min (74% for glibenclamide phase) (C ), 18% until 14 min (73% for glibenclamide phase) (D), 113% (E ), 55% (F ), 85% (G), and 96% (H);*P, 0.1; **P, 0.05; ***P, 0.001, ANOVA (Tukey test) (N5 3; n5 5–7). With the Holm-Sidak test, notable P values varied. In A, P, 0.001at 4 min, P5 0.006 at 6 min, P5 0.011 at 8 min, and P5 0.047 at 10 min. In B, P, 0.001 at 4, 6, and 8 min; P5 0.003 at 10 min; and P50.009 at 12 or 14min. InD, P5 0.001 at 4 or 6min and P5 0.004 at 8min (otherwise see the Supplementary Appendix). I–K: Cytosolic ROSrelease monitored in PIs with DCF, as described in Fig. 2. Both exemplar traces (I and J) and quantification of rates (K ) are shown. ***P ,0.001, ANOVA (Tukey test) (n 5 10). L: Rescue experiment in PIs. Lentiviral NOX4 overexpression (N 5 3; blue) in PIs of NOX4bKO andNOX4Flox/Flox mice (NOX41/1 [dashed bar]) vs. in “empty” green fluorescent protein reporter vector expression (GFP). Obtained statistics:magenta (yellow) points. ***P 5 0.007, ANOVA (Tukey test). For the Holm-Sidak test, notable values were P 5 0.0016, GFP vs. NOX4bKONOX, andP5 0.00032, NOX4bKOvs. NOX4bKO rescue. The identity of valueswas indicated byP5 0.321 for NOX41/1 andNOX4bKO rescue,and P5 0.222 for GFP and NOX4bKO rescue. (Otherwise, see the Supplementary Appendix.)M and N: Rescue with H2O2 in PIs from NOX4KOmice. Rescue was evaluated as in A and B, but the perfusate contained 100 mmol/L H2O2 for the first 10 min after glucose was added. Typical
diabetes.diabetesjournals.org Plecitá-Hlavatá and Associates 1347
The holding potential was 0 mV at similar K1 concen-trations on both sides of the membrane. Hence, the KATP
current was driven by a resting potential of 260 mV,resulting in inward currents (downward deflections). Itwas possible to inhibit all three KATP open states (L1–L3)with glibenclamide. The single-channel conductance of thefully open state (L3) did not change by adding glucose orsilencing NOX4 (Fig. 5G). The fully open state (L3) inthe ntg cells started to close immediately after the addi-tion of glucose. This closure was completed during the 3rdminute of continuous recording. The NOX4-silenced cellsexhibited an increased probability of each KATP state beingopen (Po), even without glucose. With glucose, the fullyopen state (L3) remained open similar to L2 and L1 in the3rd minute.
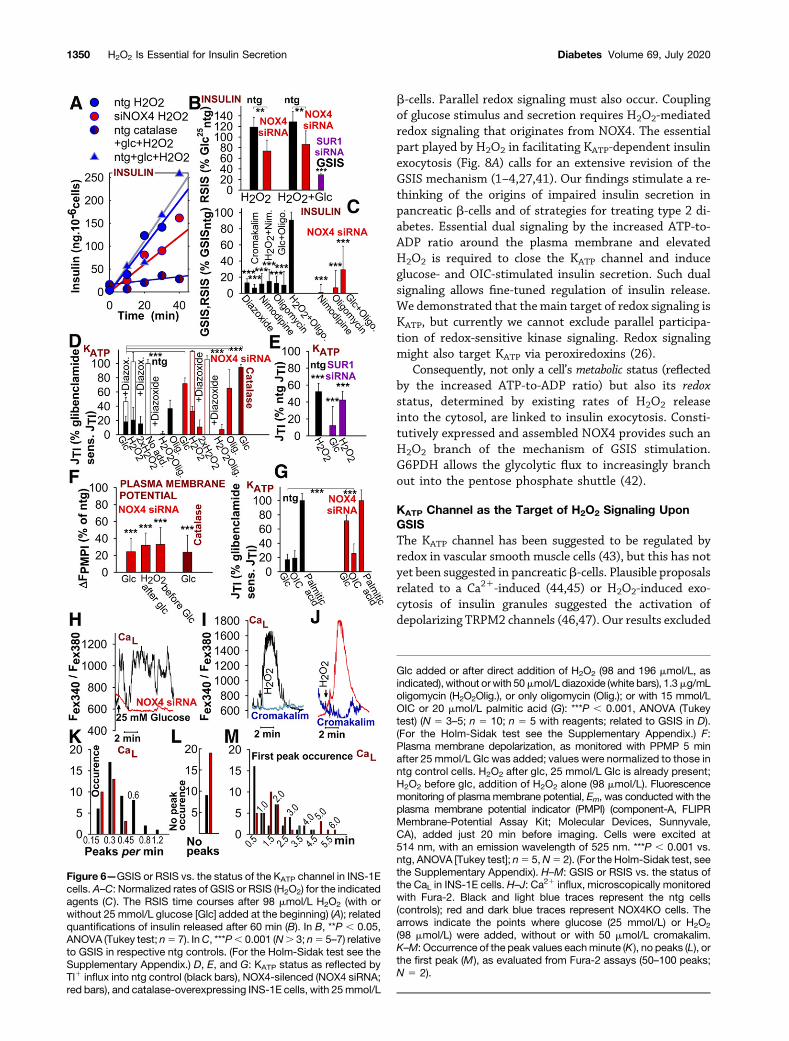
Cromakalim or diazoxide, which open KATP channels,were ineffective in redox (H2O2)-stimulated insulinsecretion (RSIS) (N 5 11) (Fig. 6A and B); these vaso-dilators decreased the insulin release (GSIS) rate to 6% 65% and 13% 6 5%, respectively (Fig. 6C). Diazoxideneither activated nor inhibited residual GSIS at silencedNOX4.
Probing KATP activity, defined as the rate of glibenclamide-sensitive Tl1 influx (Tl1 being a surrogate for K1) intontg-INS-1E cells, we found that the Tl1 influx wasinhibited to ;20%, indicating a characteristic closureof the KATP channel with 25 mmol/L glucose (N54) (Fig.6D and G). Predominant KATP participation was verifiedby the rate acceleration that manifested upon appli-cation of the KATP channel openers cromakalim anddiazoxide, and inhibition of that acceleration by gliben-clamide (to 10% 6 13%). However, NOX4-silenced orcatalase-overexpressing INS-1E cells did not respond toglucose and still exhibited 70–95% of the maximumrates of glibenclamide-sensitive Tl1 influx.
A requirement for both NOX4-produced H2O2 anda higher ATP-to-ADP ratio (OXPHOS) was also sug-gested by the effects of oligomycin, which left ;50%of the KATP channel open in control cells but up to 95%of it open in NOX4-silenced cells (Fig. 6D), with a con-comitant blockage of GSIS (Fig. 6C). The SUR1-silencedINS-1E cells exhibited largely suppressed Tl1 influxrates (N5 3) (Fig. 6E), a result of the incorrect assemblyof the remaining Kir6.2, which lacks the SUR1 partner(34). This result is consistent with inhibited GSIS (Fig.1A and Fig. 6B).
Next, fluorescence monitoring with a plasmamembranepotential indicator demonstrated a profound reduction ofdepolarization in the plasma membrane of ntg cells afterthe addition of glucose but not in NOX4-silenced orcatalase-overexpressing INS-1E cells (N 5 2) (Fig. 6F).
Calcium Channel Status Upon NOX4 SilencingNimodipine, inhibiting the CaL channel, decreased the rateof GSIS to 12% 6 11% (Fig. 6C). In ntg-INS-1E cells,oscillations of nimodipine-sensitive Ca21 influx reflectedthe opening of the CaL channel after glucose was set to25 mmol/L (N5 5) (Fig. 6H–M). In NOX4-silenced INS-1Ecells, the rates of nimodipine-sensitive Ca21 influx fell to19% 6 3%, and the cells exhibited fewer Ca21 oscillations(Fig. 6K and L). The first oscillation peaked (after a delay)after glucose was added (Fig. 6M). Typically, cromakalimprevented Ca21 influx in controls and blocked the remain-ing Ca21 oscillations in NOX4-silenced INS-1E cells (Fig.6H–J). Hence, the KATP channel was indeed affected by theNOX4 deficiency, whereas the CaL channel was affectedonly indirectly. Rates of oligomycin-sensitive Ca21 influxremained at 22% without the addition of glucose.
Sole H2O2 StimulationInsulin secretion rates after a single external H2O2 boluswere blocked in catalase-overexpressing cells (Fig. 6A).Independent of glucose, the effect of exogenous H2O2
was only partially blocked by NOX4 siRNA (Fig. 6A andB); it was fully blocked by nimodipine (Fig. 6C). Conse-quently, the H2O2 doses used do not directly stimulate theKATP-independent exocytosis of insulin granules. RSISdepolarized the plasma membrane (39) (Fig. 6F). At90 mmol/L H2O2, rates of RSIS reached 120% of GSISrates after 60 min; these RSIS rates were not significantlypotentiated by glucose (Fig. 6B). Responses to 40–100 mmol/L H2O2 led to KATP channel closure, indepen-dent of the presence of NOX4 (Fig. 6D); this explains the“H2O2 rescue” observed in PIs (Fig. 4M and N). This KATP
channel closure was overcome by diazoxide (Fig. 6D) andcromakalim.
Also, the Ca21 influx into ntg-INS-1E cells at 90 mmol/LH2O2 reached 115% of the fluxes responding to glucosealone. There were concomitant H2O2-induced, cromakalim-blocked Ca21 oscillations in both ntg and NOX4-silencedINS-1E cells, reflecting the opening of the CaL channel (Fig.6H–J).
2-OxoacidMetabolism Supplies ATP andMitochondrialH2O2 to Stimulate Insulin SecretionWhen stimulated by OIC, a well-described distinct secre-tagogue, the secretion of insulin was highly inhibited bythe mitochondrial matrix–targeted antioxidant SkQ1 inntg cells, but it was preserved in NOX4-silenced INS-1Ecells (N5 3) (Fig. 6G and Fig. 7A–C and L) and in NOX4KOmice (N 5 35 time courses); it was, however, partiallyabolished in NOX4bKO mice (N 5 35 time courses) (Fig.7E and F). The same pattern was found in PIs (typical
runs are shown (N5 3). Gray traces represent only glucose, without H2O2.M andN: AUCs of H2O2 rescue in PIs fromNOX4KO (NOX4bKO)micevs. H2O2 plus glucose or only glucose in wild-type backcrossed (NOX4Flox/Flox) mice were 107% or 157% until 10 min (M) and 66% or 90% until10 min (N). O: Glucose-induced increase in total ATP in PIs. Values were normalized to the initial levels at 3 mmol/L glucose.
1348 H2O2 Is Essential for Insulin Secretion Diabetes Volume 69, July 2020
results from N 5 3 isolations are shown in Fig. 7I and J).OIC administration to mice increased glucose above fast-ing levels (Fig. 7G and H).
Note that GSIS itself was not sensitive to SkQ1 (Fig.7K). With OIC, only a negligible fraction of H2O2 comesfrom NOX4; this H2O2 is supplied with NADPH by thebasal activities of redox shuttles (otherwise activated byglucose). In contrast, a source of mitochondrial superox-ide (transformed to H2O2) is essential for OIC-stimulatedinsulin secretion, as inferred from its nearly completeinhibition with SkQ1, which was paralleled by a decreas-ing release of superoxide in the matrix (N 5 3) (Fig. 7Cand D).
Mitochondrial H2O2 originates from a superoxide con-verted from manganese-dependent superoxide dismutase;this superoxide arises at the EF site of electron-transferringflavoprotein:Q-oxidoreductase (ETF:QOR) (40) upon theoxidation of isovaleryl-CoA. Isovaleryl-CoA is producedfrom OIC by the BCKDH complex. Indeed, BCKDH E1asilencing led to ;70% suppression of OIC-stimulated in-sulin release (N5 4) (Fig. 7B and C and Supplementary Fig.1E), and it prevented the accompanying redox signal (Fig.7D). Aminooxyacetate, an aminotransferase inhibitor up-stream of BCKDH, did not affect the OIC-induced release ofsuperoxide in the matrix (Fig. 7D), but it did slightly inhibitOIC-stimulated insulin secretion (Fig. 7B and C). Thus, OICmetabolism in INS-1E cells provides both ATP (fromOXPHOS) and H2O2 (Fig. 7M) to stimulate insulin release.
In conclusion, the essential requirement of redoxsignaling for insulin secretion in vivo can be providedeither by NOX4 (GSIS) or by mitochondrial sources (Fig.8A and C).
DISCUSSION
H2O2 Signaling Is Essential for GSISWe found that the elevation of ATP (ATP-to-ADP ratio)alone is insufficient for the fast GSIS phase in pancreatic
Figure 5—Dependence of KATP channel status on NOX4. The KATP
channel opened upon GSIS, as indicated by the patch clamp in cell-attachedmode. Negative potentials refer to the interior of the plasmamembrane, and inward currents deflect downward. A: In ntg cells,the KATP channel was fully open at L3 and partially open in states L1and L2. B: In ntg cells with glucose, there was an increased numberof L1 and L2 states but a reduced number of L3 occurrences. C:NOX4-silenced INS-1E cells (NOX4KO) show insignificantly higherprobabilities that the KATP channel will be open (NPo) than do ntgcells. D: KATP activity is slightly reduced in silenced cells treated withglucose. E: The i-E relation for the L3 state of the KATP channel isunchanged, demonstrating constant single-channel conductance g.F: The probability that the channel would be open (NPo) wascalculated for the time the KATP channel spent in open states (to)divided by the total recording time T (usually 1 min) by using thesingle-channel search mode in Clampfit software version 9.2. Whenthere were indications that the patch contained more than one
channel, the program used NPo 5 To/(To 1 Tc), where N is theminimum number of channels, and To 5 SLto, where L is the numberof openings. For comparison, NPo values were normalized to theNPo value for ntg cells, and the different Po values were normalizedto To under those same conditions. The resting potential of the ntgcells was270mV before and240mV after glucose was added. Thisdemonstrated the depolarization of the plasma membrane by glu-cose in ntg cells. All the open states were, again, completely closedby glibenclamide. Once the glucose was applied, the excision of thepatch to inside-out mode allowed KATP activity to recover. Therecovered KATP activity was inhibited after the addition of gliben-clamide. G: L1–L3 contribution to total Po. Glucose reduced thepercentage contribution of L3 and L2 states to the benefit of L1, andit did so strongly in ntg cells. In F, ANOVA (N 5 5; n 5 5–7) yieldednotableP values according to the Holm-Sidak test:P5 0.09 (0.31 forTukey test) for ntg vs. siRNA NOX4, indicating equal initial NPo
values before glucose was added; and P 5 0.00028 (**P 5 0.002,Tukey test), indicating significantly high NPo values after glucosewas added in siRNA NOX4 samples. For ntg cells before and afterglucose, P 5 6.4 3 1026 indicates significance.
diabetes.diabetesjournals.org Plecitá-Hlavatá and Associates 1349
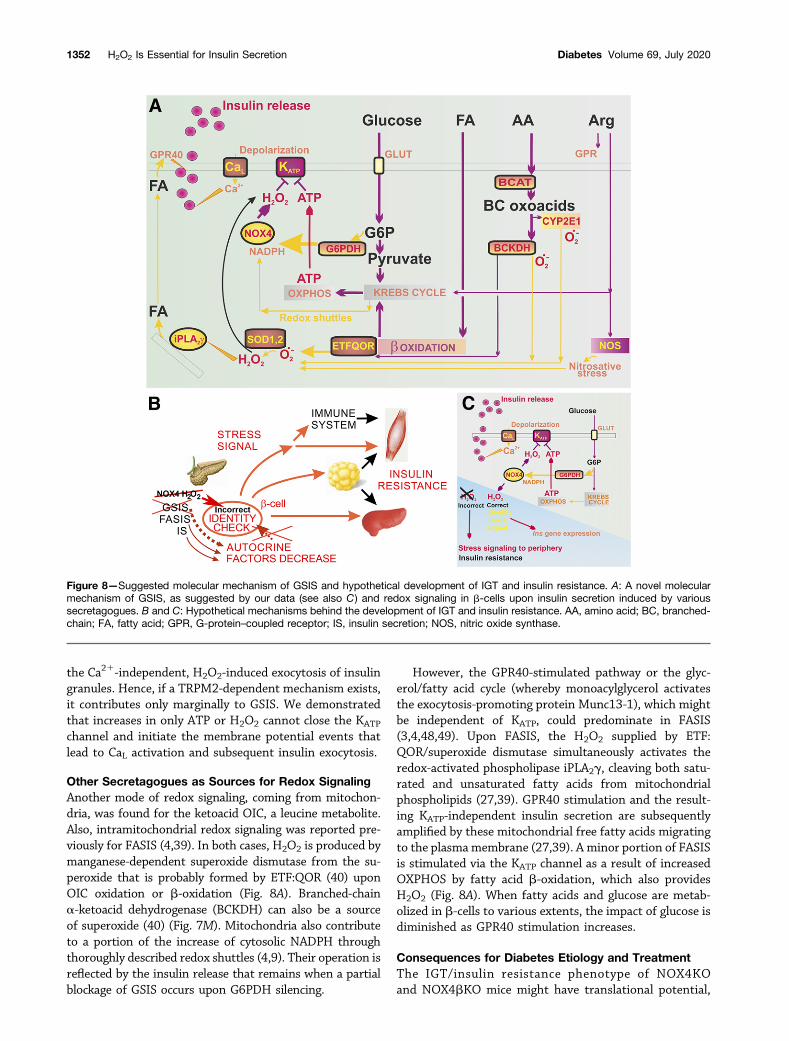
b-cells. Parallel redox signaling must also occur. Couplingof glucose stimulus and secretion requires H2O2-mediatedredox signaling that originates from NOX4. The essentialpart played by H2O2 in facilitating KATP-dependent insulinexocytosis (Fig. 8A) calls for an extensive revision of theGSIS mechanism (1–4,27,41). Our findings stimulate a re-thinking of the origins of impaired insulin secretion inpancreatic b-cells and of strategies for treating type 2 di-abetes. Essential dual signaling by the increased ATP-to-ADP ratio around the plasma membrane and elevatedH2O2 is required to close the KATP channel and induceglucose- and OIC-stimulated insulin secretion. Such dualsignaling allows fine-tuned regulation of insulin release.We demonstrated that themain target of redox signaling isKATP, but currently we cannot exclude parallel participa-tion of redox-sensitive kinase signaling. Redox signalingmight also target KATP via peroxiredoxins (26).
Consequently, not only a cell’s metabolic status (reflectedby the increased ATP-to-ADP ratio) but also its redoxstatus, determined by existing rates of H2O2 releaseinto the cytosol, are linked to insulin exocytosis. Consti-tutively expressed and assembled NOX4 provides such anH2O2 branch of the mechanism of GSIS stimulation.G6PDH allows the glycolytic flux to increasingly branchout into the pentose phosphate shuttle (42).
KATP Channel as the Target of H2O2 Signaling UponGSISThe KATP channel has been suggested to be regulated byredox in vascular smooth muscle cells (43), but this has notyet been suggested in pancreatic b-cells. Plausible proposalsrelated to a Ca21-induced (44,45) or H2O2-induced exo-cytosis of insulin granules suggested the activation ofdepolarizing TRPM2 channels (46,47). Our results excluded
Figure 6—GSIS or RSIS vs. the status of the KATP channel in INS-1Ecells. A–C: Normalized rates of GSIS or RSIS (H2O2) for the indicatedagents (C). The RSIS time courses after 98 mmol/L H2O2 (with orwithout 25 mmol/L glucose [Glc] added at the beginning) (A); relatedquantifications of insulin released after 60 min (B). In B, **P , 0.05,ANOVA (Tukey test; n5 7). InC, ***P, 0.001 (N. 3; n5 5–7) relativeto GSIS in respective ntg controls. (For the Holm-Sidak test see theSupplementary Appendix.) D, E, and G: KATP status as reflected byTl1 influx into ntg control (black bars), NOX4-silenced (NOX4 siRNA;red bars), and catalase-overexpressing INS-1E cells, with 25mmol/L
Glc added or after direct addition of H2O2 (98 and 196 mmol/L, asindicated), without orwith 50mmol/L diazoxide (white bars), 1.3mg/mLoligomycin (H2O2Olig.), or only oligomycin (Olig.); or with 15 mmol/LOIC or 20 mmol/L palmitic acid (G): ***P , 0.001, ANOVA (Tukeytest) (N 5 3–5; n 5 10; n 5 5 with reagents; related to GSIS in D).(For the Holm-Sidak test see the Supplementary Appendix.) F:Plasma membrane depolarization, as monitored with PPMP 5 minafter 25 mmol/L Glc was added; values were normalized to those inntg control cells. H2O2 after glc, 25 mmol/L Glc is already present;H2O2 before glc, addition of H2O2 alone (98 mmol/L). Fluorescencemonitoring of plasma membrane potential, Em, was conducted with theplasma membrane potential indicator (PMPI) (component-A, FLIPRMembrane-Potential Assay Kit; Molecular Devices, Sunnyvale,CA), added just 20 min before imaging. Cells were excited at514 nm, with an emission wavelength of 525 nm. ***P , 0.001 vs.ntg, ANOVA [Tukey test]; n5 5,N5 2). (For the Holm-Sidak test, seethe Supplementary Appendix). H–M: GSIS or RSIS vs. the status ofthe CaL in INS-1E cells. H–J: Ca21 influx, microscopically monitoredwith Fura-2. Black and light blue traces represent the ntg cells(controls); red and dark blue traces represent NOX4KO cells. Thearrows indicate the points where glucose (25 mmol/L) or H2O2
(98 mmol/L) were added, without or with 50 mmol/L cromakalim.K–M: Occurrence of the peak values eachminute (K), no peaks (L), orthe first peak (M), as evaluated from Fura-2 assays (50–100 peaks;N 5 2).
1350 H2O2 Is Essential for Insulin Secretion Diabetes Volume 69, July 2020
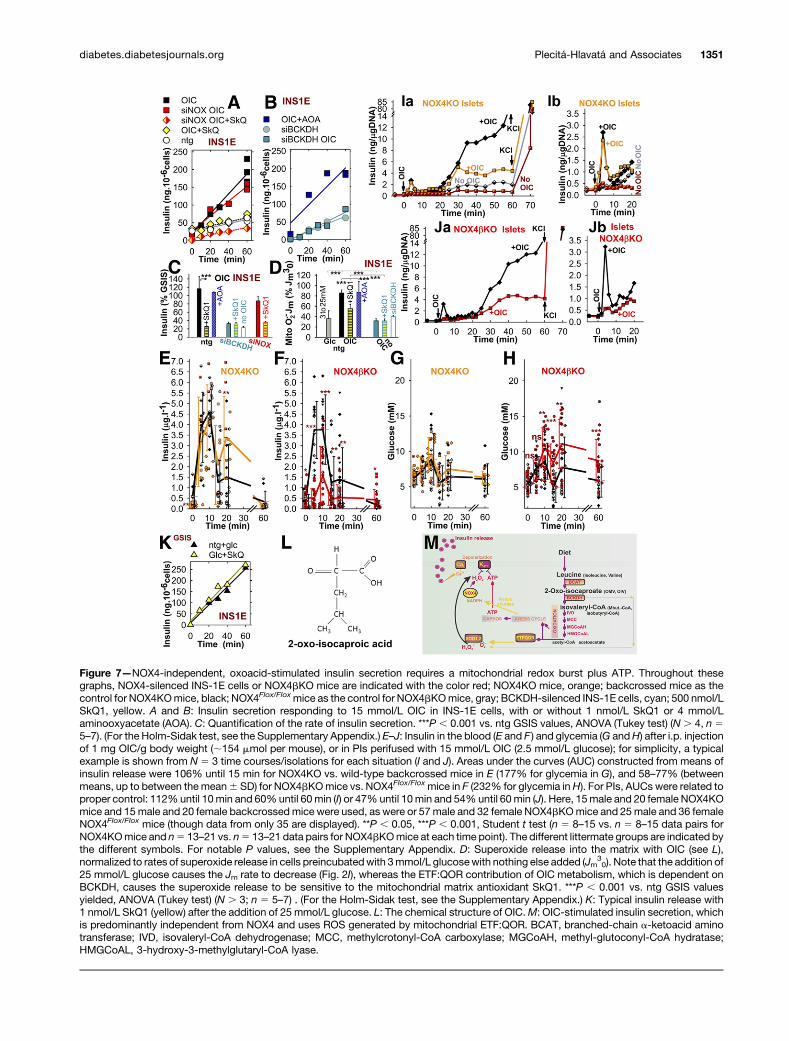
Figure 7—NOX4-independent, oxoacid-stimulated insulin secretion requires a mitochondrial redox burst plus ATP. Throughout thesegraphs, NOX4-silenced INS-1E cells or NOX4bKO mice are indicated with the color red; NOX4KO mice, orange; backcrossed mice as thecontrol for NOX4KOmice, black; NOX4Flox/Floxmice as the control for NOX4bKOmice, gray; BCKDH-silenced INS-1E cells, cyan; 500 nmol/LSkQ1, yellow. A and B: Insulin secretion responding to 15 mmol/L OIC in INS-1E cells, with or without 1 nmol/L SkQ1 or 4 mmol/Laminooxyacetate (AOA). C: Quantification of the rate of insulin secretion. ***P , 0.001 vs. ntg GSIS values, ANOVA (Tukey test) (N. 4, n 55–7). (For the Holm-Sidak test, see the Supplementary Appendix.) E–J: Insulin in the blood (E and F ) and glycemia (G andH) after i.p. injectionof 1 mg OIC/g body weight (;154 mmol per mouse), or in PIs perifused with 15 mmol/L OIC (2.5 mmol/L glucose); for simplicity, a typicalexample is shown from N 5 3 time courses/isolations for each situation (I and J). Areas under the curves (AUC) constructed from means ofinsulin release were 106% until 15 min for NOX4KO vs. wild-type backcrossed mice in E (177% for glycemia in G), and 58–77% (betweenmeans, up to between the mean6 SD) for NOX4bKOmice vs. NOX4Flox/Floxmice in F (232% for glycemia inH). For PIs, AUCs were related toproper control: 112%until 10min and 60%until 60min (I) or 47%until 10min and 54%until 60min (J). Here, 15male and 20 female NOX4KOmice and 15male and 20 female backcrossedmice were used, as were or 57 male and 32 female NOX4bKOmice and 25male and 36 femaleNOX4Flox/Flox mice (though data from only 35 are displayed). **P , 0.05, ***P , 0.001, Student t test (n 5 8–15 vs. n 5 8–15 data pairs forNOX4KOmice and n5 13–21 vs. n5 13–21 data pairs for NOX4bKOmice at each time point). The different littermate groups are indicated bythe different symbols. For notable P values, see the Supplementary Appendix. D: Superoxide release into the matrix with OIC (see L),normalized to rates of superoxide release in cells preincubatedwith 3mmol/L glucosewith nothing else added (Jm
30). Note that the addition of
25 mmol/L glucose causes the Jm rate to decrease (Fig. 2I), whereas the ETF:QOR contribution of OIC metabolism, which is dependent onBCKDH, causes the superoxide release to be sensitive to the mitochondrial matrix antioxidant SkQ1. ***P , 0.001 vs. ntg GSIS valuesyielded, ANOVA (Tukey test) (N . 3; n 5 5–7) . (For the Holm-Sidak test, see the Supplementary Appendix.) K: Typical insulin release with1 nmol/L SkQ1 (yellow) after the addition of 25 mmol/L glucose. L: The chemical structure of OIC.M: OIC-stimulated insulin secretion, whichis predominantly independent from NOX4 and uses ROS generated by mitochondrial ETF:QOR. BCAT, branched-chain a-ketoacid aminotransferase; IVD, isovaleryl-CoA dehydrogenase; MCC, methylcrotonyl-CoA carboxylase; MGCoAH, methyl-glutoconyl-CoA hydratase;HMGCoAL, 3-hydroxy-3-methylglutaryl-CoA lyase.
diabetes.diabetesjournals.org Plecitá-Hlavatá and Associates 1351
the Ca21-independent, H2O2-induced exocytosis of insulingranules. Hence, if a TRPM2-dependent mechanism exists,it contributes only marginally to GSIS. We demonstratedthat increases in only ATP or H2O2 cannot close the KATP
channel and initiate the membrane potential events thatlead to CaL activation and subsequent insulin exocytosis.
Other Secretagogues as Sources for Redox SignalingAnother mode of redox signaling, coming from mitochon-dria, was found for the ketoacid OIC, a leucine metabolite.Also, intramitochondrial redox signaling was reported pre-viously for FASIS (4,39). In both cases, H2O2 is produced bymanganese-dependent superoxide dismutase from the su-peroxide that is probably formed by ETF:QOR (40) uponOIC oxidation or b-oxidation (Fig. 8A). Branched-chaina-ketoacid dehydrogenase (BCKDH) can also be a sourceof superoxide (40) (Fig. 7M). Mitochondria also contributeto a portion of the increase of cytosolic NADPH throughthoroughly described redox shuttles (4,9). Their operation isreflected by the insulin release that remains when a partialblockage of GSIS occurs upon G6PDH silencing.
However, the GPR40-stimulated pathway or the glyc-erol/fatty acid cycle (whereby monoacylglycerol activatesthe exocytosis-promoting protein Munc13-1), which mightbe independent of KATP, could predominate in FASIS(3,4,48,49). Upon FASIS, the H2O2 supplied by ETF:QOR/superoxide dismutase simultaneously activates theredox-activated phospholipase iPLA2g, cleaving both satu-rated and unsaturated fatty acids from mitochondrialphospholipids (27,39). GPR40 stimulation and the result-ing KATP-independent insulin secretion are subsequentlyamplified by these mitochondrial free fatty acids migratingto the plasmamembrane (27,39). A minor portion of FASISis stimulated via the KATP channel as a result of increasedOXPHOS by fatty acid b-oxidation, which also providesH2O2 (Fig. 8A). When fatty acids and glucose are metab-olized in b-cells to various extents, the impact of glucose isdiminished as GPR40 stimulation increases.
Consequences for Diabetes Etiology and TreatmentThe IGT/insulin resistance phenotype of NOX4KOand NOX4bKO mice might have translational potential,
Figure 8—Suggested molecular mechanism of GSIS and hypothetical development of IGT and insulin resistance. A: A novel molecularmechanism of GSIS, as suggested by our data (see also C) and redox signaling in b-cells upon insulin secretion induced by varioussecretagogues. B and C: Hypothetical mechanisms behind the development of IGT and insulin resistance. AA, amino acid; BC, branched-chain; FA, fatty acid; GPR, G-protein–coupled receptor; IS, insulin secretion; NOS, nitric oxide synthase.
1352 H2O2 Is Essential for Insulin Secretion Diabetes Volume 69, July 2020
as these two strains may represent models of early(pre)diabetes. Even though the human growth hormoneminigene (transferred from RIP-Cre mice) (30,31)amplifies the insufficiency of GSIS in NOX4bKO mice(more profoundly on a systemic level) (SupplementaryFig. 4), the extensive inhibition is caused by a lack ofNOX4 activity.
Surprisingly, ablation of just a single gene generates theonset of insulin resistance. We can speculate that pancre-atic b-cells must emit an as yet unknown stress signal,either directly or via the immune system (Fig. 8B and C),thereby inducing peripheral insulin resistance (Fig. 3K andL). We hypothesize that such a putative stress signal isinduced by the insufficient identity checking or autocrineself-maintenance of b-cells in NOX4bKO or NOX4KOmice. b-Cell identity checking can be mediated by thesame redox signaling that acts upon KATP-dependent in-sulin exocytosis (38). However, Swisa et al. (38) did notknow the source of such redox signaling. Here, we suggestthat its source is H2O2 produced by NOX4 upon GSIS. Thismay hypothetically contribute to the “correct” b-cellidentity-checking signal, which also primarily maintainssufficient insulin gene expression (38). For NOX4KO mice,diet over time stimulates insulin release via FASIS and OICor other secretagogues; hence, these secretagogues mightbe sufficient. However, because the GSIS/NOX4-mediatedredox signaling is impaired, such mice lack the “correct”NOX4-induced b-cell identity-checking signal. We speculatethat the lack of this signal evokes an as yet unknown stresssignal for the periphery (Fig. 8B and C).
Because antioxidant defense is diminished in pancre-atic b-cells, the NOX4-produced H2O2 during GSISin vivo, which can be repeated, could be gradually trans-formed into oxidative stress, reflecting high b-cell vul-nerability. This could potentially contribute to diabetes(50). In light of our findings, cytosol-targeted antioxi-dant therapy, which should inevitably suppress GSIS,seems to be irrelevant in the early stages of diabetes.Tuning down the essential release of H2O2 during GSISwould amplify symptoms of prediabetes instead of pre-venting them. In contrast, we predict that mitochondria-targeted antioxidants would not harm physiological redoxsignaling (except that of oxoacids) and might avoid thepremature oxidative stress in the matrix at the prediabetesstage. Also, the described repeating H2O2 burst upon GSISmight add to the oxidative stress resulting from the attackof macrophages recruited to the pancreas.
Acknowledgments. The authors thank Keith D. Garlid (Portland StateUniversity, Portland, OR) for providing fruitful discussion; Mark A. Magnuson(Vanderbilt University), C. Glorieux, and J.B. Verrax (Université Catholique deLouvain, Belgium) for donating plasmids; Dr. Radislav Sedlá�cek and Dr. InkenBeck for providing the GMO mice facility (IMG and Czech Centre for Pheno-genomics, Biocev, Prague, Czech Republic) for housing our mice; and allcolleagues from the Institute of Physiology, Prague, such as Jitka �Spa�ckováfor providing help designing the siRNA, Pavla Pr�uchová for help with islet
perifusion, Hana Engstová for analyzing images, and Jan Kr�ušek for mon-itoring calcium. The authors also thank Tomáš �Spa�cek and Lenka Josková forproviding excellent technical assistance with cell cultivation, Jana Vaicováwith insulin assays, and Ludmila �Sime�cková with mice experiments.Funding. The project was supported by the Grantová Agentura �Ceské Repub-liky (grant 16-06700S to L.P.-H. and grants 20-00408S and 17-01813S to P.J.)and by the Czech government’s support (RV0:679885623) to the Institute ofPhysiology, Prague, Czech Republic.Duality of Interest. No potential conflicts of interest relevant to this articlewere reported.Author Contributions. L.P.-H., M.J., B.H., J.T., V.P., and D.S. performedthe investigations. L.P.-H., M.J., B.H., Z.B., M.C., and D.S. developed themethodology. L.P.-J., B.H., K.S., and R.P.B. provided resources. L.P.-H., B.H.,and P.J. validated the data and handled project administration. L.P.-H. andP.J. conceptualized and supervised the study and acquired funding. P.J. formallyanalyzed and curated the data, wrote the first draft of the manuscript,reviewed and edited the manuscript, and provided visualizations. P.J. isthe guarantor of this work and, as such, had full access to all the data in thestudy and takes responsibility for the integrity of the data and the accuracy ofthe data analysis.
References1. Ashcroft FM, Rorsman P. Diabetes mellitus and the b cell: the last ten years.Cell 2012;148:1160–11712. Je�zek P, Jab�urek M, Plecitá-Hlavatá L. Contribution of oxidative stress andimpaired biogenesis of pancreatic b-cells to type 2 diabetes. Antioxid Redox Signal2019;31:722–7513. Rutter GA, Pullen TJ, Hodson DJ, Martinez-Sanchez A. Pancreatic b-cellidentity, glucose sensing and the control of insulin secretion. Biochem J 2015;466:203–2184. Prentki M, Matschinsky FM, Madiraju SR. Metabolic signaling in fuel-inducedinsulin secretion. Cell Metab 2013;18:162–1855. Bennett K, James C, Hussain K. Pancreatic b-cell KATP channels: hypo-glycaemia and hyperglycaemia. Rev Endocr Metab Disord 2010;11:157–1636. Szollosi A, Nenquin M, Henquin JC. Pharmacological stimulation and in-hibition of insulin secretion in mouse islets lacking ATP-sensitive K1 channels. BrJ Pharmacol 2010;159:669–6777. Soty M, Visa M, Soriano S, Carmona Mdel C, Nadal Á, Novials A. Involvementof ATP-sensitive potassium (K(ATP)) channels in the loss of beta-cell functioninduced by human islet amyloid polypeptide. J Biol Chem 2011;286:40857–408668. Drews G, Krippeit-Drews P, Düfer M. Electrophysiology of islet cells. Adv ExpMed Biol 2010;654:115–1639. Jitrapakdee S, Wutthisathapornchai A, Wallace JC, MacDonald MJ. Regu-lation of insulin secretion: role of mitochondrial signalling. Diabetologia 2010;53:1019–103210. Joseph JW, Jensen MV, Ilkayeva O, et al. The mitochondrial citrate/isocitratecarrier plays a regulatory role in glucose-stimulated insulin secretion. J Biol Chem2006;281:35624–3563211. Odegaard ML, Joseph JW, Jensen MV, et al. The mitochondrial 2-oxoglutaratecarrier is part of a metabolic pathway that mediates glucose- and glutamine-stimulated insulin secretion. J Biol Chem 2010;285:16530–1653712. Ronnebaum SM, Ilkayeva O, Burgess SC, et al. A pyruvate cycling pathwayinvolving cytosolic NADP-dependent isocitrate dehydrogenase regulates glucose-stimulated insulin secretion. J Biol Chem 2006;281:30593–3060213. Stanton RC. Glucose-6-phosphate dehydrogenase, NADPH, and cell survival.IUBMB Life 2012;64:362–36914. Zhao G, Zhao Y, Wang X, Xu Y. Knockdown of glucose-6-phosphate de-hydrogenase (G6PD) following cerebral ischemic reperfusion: the pros and cons.Neurochem Int 2012;61:146–15515. Schuit F, De Vos A, Farfari S, et al. Metabolic fate of glucose in purified isletcells: glucose-regulated anaplerosis in beta cells. J Biol Chem 1997;272:18572–18579
diabetes.diabetesjournals.org Plecitá-Hlavatá and Associates 1353
16. Graciano MFR, Santos LRB, Curi R, Carpinelli AR. NAD(P)H oxidase partic-ipates in the palmitate-induced superoxide production and insulin secretion by ratpancreatic islets. J Cell Physiol 2011;226:1110–111717. Newsholme P, Morgan D, Rebelato E, et al. Insights into the critical role ofNADPH oxidase(s) in the normal and dysregulated pancreatic beta cell. Dia-betologia 2009;52:2489–249818. Bedard K, Krause K-H. The NOX family of ROS-generating NADPH oxidases:physiology and pathophysiology. Physiol Rev 2007;87:245–31319. Serrander L, Cartier L, Bedard K, et al. NOX4 activity is determined bymRNA levels and reveals a unique pattern of ROS generation. Biochem J 2007;406:105–11420. Morgan D, Rebelato E, Abdulkader F, et al. Association of NAD(P)H oxidasewith glucose-induced insulin secretion by pancreatic b-cells. Endocrinology 2009;150:2197–220121. Imoto H, Sasaki N, Iwase M, et al. Impaired insulin secretion by dipheny-leneiodium associated with perturbation of cytosolic Ca21 dynamics in pancreaticbeta-cells. Endocrinology 2008;149:5391–540022. Syed I, Kyathanahalli CN, Kowluru A. Phagocyte-like NADPH oxidase gen-erates ROS in INS 832/13 cells and rat islets: role of protein prenylation. Am JPhysiol Regul Integr Comp Physiol 2011;300:R756–R76223. Saadeh M, Ferrante TC, Kane A, Shirihai O, Corkey BE, Deeney JT. Reactiveoxygen species stimulate insulin secretion in rat pancreatic islets: studies usingmono-oleoyl-glycerol. PLoS One 2012;7:e3020024. Leloup C, Tourrel-Cuzin C, Magnan C, et al. Mitochondrial reactive oxygenspecies are obligatory signals for glucose-induced insulin secretion. Diabetes2009;58:673–68125. Pi J, Bai Y, Zhang Q, et al. Reactive oxygen species as a signal in glucose-stimulated insulin secretion. Diabetes 2007;56:1783–179126. Je�zek P, Holendová B, Plecitá-Hlavatá L. Redox signaling from mitochondria:signal propagation and its targets. Biomolecules 2020;10:9327. Je�zek P, Jab�urek M, Holendová B, Plecitá-Hlavatá L. Fatty acid-stimulatedinsulin secretion vs. lipotoxicity. Molecules 2018;23:148328. Zhang M, Brewer AC, Schröder K, et al. NADPH oxidase-4 mediates pro-tection against chronic load-induced stress in mouse hearts by enhancing an-giogenesis. Proc Natl Acad Sci U S A 2010;107:18121–1812629. Schröder K, Zhang M, Benkhoff S, et al. Nox4 is a protective reactive oxygenspecies generating vascular NADPH oxidase. Circ Res 2012;110:1217–122530. Lee JY, Ristow M, Lin X, White MF, Magnuson MA, Hennighausen L. RIP-Crerevisited, evidence for impairments of pancreatic beta-cell function. J Biol Chem2006;281:2649–265331. Fex M, Wierup N, Nitert MD, Ristow M, Mulder H. Rat insulin promoter 2-Crerecombinase mice bred onto a pure C57BL/6J background exhibit unalteredglucose tolerance. J Endocrinol 2007;194:551–55532. Alán L, Olejár T, Cahová M, et al. Delta cell hyperplasia in adult Goto-Kakizaki(GK/MolTac) diabetic rats. J Diabetes Res 2015;2015:38539533. Li D-S, Yuan Y-H, Tu H-J, Liang Q-L, Dai L-J. A protocol for islet isolation frommouse pancreas. Nat Protoc 2009;4:1649–165234. Merglen A, Theander S, Rubi B, Chaffard G, Wollheim CB, Maechler P.Glucose sensitivity and metabolism-secretion coupling studied during two-year
continuous culture in INS-1E insulinoma cells. Endocrinology 2004;145:667–67835. Belousov VV, Fradkov AF, Lukyanov KA, et al. Genetically encoded fluorescentindicator for intracellular hydrogen peroxide. Nat Methods 2006;3:281–28636. Guzy RD, Hoyos B, Robin E, et al. Mitochondrial complex III is required forhypoxia-induced ROS production and cellular oxygen sensing. Cell Metab 2005;1:401–40837. Bryan J, Vila-Carriles WH, Zhao G, Babenko AP, Aguilar-Bryan L. Towardlinking structure with function in ATP-sensitive K1 channels. Diabetes 2004;53(Suppl. 3):S104–S11238. Swisa A, Glaser B, Dor Y. Metabolic stress and compromised identity ofpancreatic beta cells. Front Genet 2017;8:2139. Je�zek J, Dlasková A, Zelenka J, Jab�urek M, Je�zek PH. H2O2-activated mi-tochondrial phospholipase iPLA2g prevents lipotoxic oxidative stress in synergy withUCP2, amplifies signaling via G-protein-coupled receptor GPR40, and regulatesinsulin secretion in pancreatic b-cells. Antioxid Redox Signal 2015;23:958–97240. Brand MD. Mitochondrial generation of superoxide and hydrogen peroxide asthe source of mitochondrial redox signaling. Free Radic Biol Med 2016;100:14–3141. Maechler P. Mitochondrial function and insulin secretion. Mol Cell Endocrinol2013;379:12–1842. Goehring I, Sauter NS, Catchpole G, et al. Identification of an intracellularmetabolic signature impairing beta cell function in the rat beta cell line INS-1E andhuman islets. Diabetologia 2011;54:2584–259443. Yasui S, Mawatari K, Morizumi R, et al. Hydrogen peroxide inhibits insulin-induced ATP-sensitive potassium channel activation independent of insulin sig-naling pathway in cultured vascular smooth muscle cells. J Med Invest 2012;59:36–4444. MacDonald PE. Signal integration at the level of ion channel and exocytoticfunction in pancreatic b-cells. Am J Physiol Endocrinol Metab 2011;301:E1065–E106945. Llanos P, Contreras-Ferrat A, Barrientos G, Valencia M, Mears D, Hidalgo C.Glucose-dependent insulin secretion in pancreatic b-cell islets from male ratsrequires Ca21 release via ROS-stimulated ryanodine receptors. PLoS One 2015;10:e012923846. Grupe M, Myers G, Penner R, Fleig A. Activation of store-operated I(CRAC) byhydrogen peroxide. Cell Calcium 2010;48:1–947. Kashio M, Tominaga M. Redox signal-mediated enhancement of the tem-perature sensitivity of transient receptor potential melastatin 2 (TRPM2) elevatesglucose-induced insulin secretion from pancreatic islets. J Biol Chem 2015;290:12435–1244248. Gehrmann W, Elsner M, Lenzen S. Role of metabolically generated reactiveoxygen species for lipotoxicity in pancreatic b-cells. Diabetes Obes Metab 2010;12(Suppl. 2):149–15849. Graciano MFR, Valle MMR, Kowluru A, Curi R, Carpinelli AR. Regulation ofinsulin secretion and reactive oxygen species production by free fatty acids inpancreatic islets. Islets 2011;3:213–22350. Lacraz G, Figeac F, Movassat J, et al. Diabetic b-cells can achieve self-protection against oxidative stress through an adaptive up-regulation of theirantioxidant defenses. PLoS One 2009;4:e6500
1354 H2O2 Is Essential for Insulin Secretion Diabetes Volume 69, July 2020