Reduced insulin secretion correlates with decreased ... · GSIS: Glucose-stimulated ......
29
Reduced insulin secretion correlates with decreased expression of exocytotic genes in pancreatic islets from patients with type 2 diabetes. Andersson, Sofia A; Olsson, Anders H; Esguerra, Jonathan L S; Heimann, Emilia; Ladenvall, Claes; Edlund, Anna; Salehi, S Albert; Taneera, Jalal; Degerman, Eva; Groop, Leif; Ling, Charlotte; Eliasson, Lena Published in: Molecular and Cellular Endocrinology DOI: 10.1016/j.mce.2012.08.009 Published: 2012-01-01 Link to publication Citation for published version (APA): Andersson, S. A., Olsson, A. H., Esguerra, J. L. S., Heimann, E., Ladenvall, C., Edlund, A., ... Eliasson, L. (2012). Reduced insulin secretion correlates with decreased expression of exocytotic genes in pancreatic islets from patients with type 2 diabetes. Molecular and Cellular Endocrinology, 364(1-2), 36-45. DOI: 10.1016/j.mce.2012.08.009 General rights Copyright and moral rights for the publications made accessible in the public portal are retained by the authors and/or other copyright owners and it is a condition of accessing publications that users recognise and abide by the legal requirements associated with these rights. • Users may download and print one copy of any publication from the public portal for the purpose of private study or research. • You may not further distribute the material or use it for any profit-making activity or commercial gain • You may freely distribute the URL identifying the publication in the public portal
Transcript of Reduced insulin secretion correlates with decreased ... · GSIS: Glucose-stimulated ......

LUND UNIVERSITY
PO Box 117221 00 Lund+46 46-222 00 00
Reduced insulin secretion correlates with decreased expression of exocytotic genes inpancreatic islets from patients with type 2 diabetes.
Andersson, Sofia A; Olsson, Anders H; Esguerra, Jonathan L S; Heimann, Emilia; Ladenvall,Claes; Edlund, Anna; Salehi, S Albert; Taneera, Jalal; Degerman, Eva; Groop, Leif; Ling,Charlotte; Eliasson, LenaPublished in:Molecular and Cellular Endocrinology
DOI:10.1016/j.mce.2012.08.009
Published: 2012-01-01
Link to publication
Citation for published version (APA):Andersson, S. A., Olsson, A. H., Esguerra, J. L. S., Heimann, E., Ladenvall, C., Edlund, A., ... Eliasson, L.(2012). Reduced insulin secretion correlates with decreased expression of exocytotic genes in pancreatic isletsfrom patients with type 2 diabetes. Molecular and Cellular Endocrinology, 364(1-2), 36-45. DOI:10.1016/j.mce.2012.08.009
General rightsCopyright and moral rights for the publications made accessible in the public portal are retained by the authorsand/or other copyright owners and it is a condition of accessing publications that users recognise and abide by thelegal requirements associated with these rights.
• Users may download and print one copy of any publication from the public portal for the purpose of privatestudy or research. • You may not further distribute the material or use it for any profit-making activity or commercial gain • You may freely distribute the URL identifying the publication in the public portal

Take down policyIf you believe that this document breaches copyright please contact us providing details, and we will removeaccess to the work immediately and investigate your claim.
Download date: 16. Jun. 2018

Title: Reduced insulin secretion correlates with decreased expression of exocytotic genes in
pancreatic islets from patients with type 2 diabetes
Sofia A Andersson1, Anders H Olsson
2, Jonathan LS Esguerra
1, Emilia Heimann
5, Claes
Ladenvall3, Anna Edlund
1, Albert Salehi
4, Jalal Taneera
3, Eva Degerman
5, Leif Groop
3,
Charlotte Ling2 and Lena Eliasson
1*
1Islet Cell Exocytosis,
2 Epigenetics and Diabetes,
3 Diabetes and Endocrinology and
4Islet Cell
Physiology, Lund University Diabetes Centre, Department of Clinical Sciences Malmö, Lund
University, Malmö, Sweden 5Department of Experimental Medical Sciences, Biomedical Center,
Lund University, Lund, Sweden.
*Address for correspondence: Lena Eliasson, Islet Cell Exocytosis, Lund University Diabetes
Centre, CRC 91-11, SUS Malmö entrance 72, 205 02 Malmö, Sweden, phone: +46 40 391153,
fax +46 40 391222, email: [email protected]
Running title: Exocytotic genes in type 2 diabetic human islets
Word count (abstract/main text): 148/5471
Abbreviations:
T2D: Type 2 diabetes
GSIS: Glucose-stimulated insulin secretion
SNP: Polymorphism
DGI: Diabetes Genetic Initiative
BIS: Basal insulin secretion

2
1. Introduction
2. Materials and methods
2.1. Human pancreatic islets
2.2 Animal model
2.3. Glucose-stimulated insulin secretion in human islets
2.4. Gene expression in human pancreatic islet
2.5. Quantitative RT-PCR
2.6. Immunocytochemistry
2.7. Western Blot analysis
2.8. siRNA transfection and insulin secretion assay on INS1-832/13 cells
2.9. Study Population
2.10. Genotyping
2.11. Statistical analyses
3. Results
3.1. Decreased expression of genes involved in exocytosis in human islets from T2D
donors
3.2. Correlation between expression of genes involved in exocytosis to GSIS and
HbA1c
3.3. Silencing of exocytotic genes reduce insulin secretion
3.4. Polymorphisms in the RIMS1 gene is associated with impaired insulin secretion
4. Discussion
Acknowledgement
References
Tables
Figure Legends
3
Abstract
Reduced insulin release has been linked to defect exocytosis in β-cells. However, whether
expression of genes suggested to be involved in the exocytotic process (exocytotic genes) is
altered in pancreatic islets from patients with type 2 diabetes (T2D), and correlate to insulin
secretion, needs to be further investigated.
Analysing expression levels of 23 exocytotic genes using microarray revealed reduced
expression of five genes in human T2D islets (χ2=13.25; p<0.001). Gene expression of STX1A,
SYT4, SYT7, SYT11, SYT13, SNAP25 and STXBP1 correlated negatively to in vivo measurements
of HbA1c levels and positively to glucose stimulated insulin secretion (GSIS) in vitro in human
islets. STX1A, SYT4 and SYT 11 protein levels correspondingly decreased in human T2D islets.
Moreover, silencing of SYT4 and SYT13 reduced GSIS in INS1-832/13 cells. Our data support
that reduced expression of exocytotic genes contributes to impaired insulin secretion, and
suggest decreased expression of these genes as part of T2D pathogenesis.
Keywords: type 2 diabetes, islet, beta-cell, exocytosis, STX1A, SYT4, SYT7, SYT11, SYT13,
SNAP25, STXBP1, GWAS, microarray, PCR, expression

4
1. Introduction
Type 2 diabetes (T2D) is characterized by increased blood glucose levels, due to both reduced
insulin secretion from the pancreatic β-cell, and impaired insulin action at the target cells.
Several studies have shown that impaired insulin secretion occurs already before the onset of
T2D (Del Prato and Tiengo, 2001,Gerich, 2002,Hosker, Rudenski, Burnett et al., 1989)
signifying that processes involved in insulin secretion are crucial in the development of the
disease.
Insulin release is biphasic with a first rapid phase followed by a second slower phase. Patients
with T2D characteristically display reduced or complete absence of the first phase (Del Prato and
Tiengo, 2001,Gerich, 2002,Hosker et al., 1989), which is suggestive of impaired priming and/or
fusion of the insulin-containing granules with the plasma membrane (Barg, Eliasson, Renstrom
et al., 2002). Priming and fusion are processes involved in the cascade of events that precedes
Ca2+
-dependent exocytosis and the release of insulin (Eliasson, Abdulkader, Braun et al., 2008).
During the priming process the SNARE complex assemble to prepare the granules for Ca2+
-
dependent fusion. In short, the plasma membrane associated proteins syntaxin 1A (Stx1A) and
synaptosomal-protein of 25kD (Snap25) interact with vesicle-associated membrane protein
(Vamp2), which gives rise to a tertiary SNARE complex that promotes fusion by pulling the
vesicle membrane in close contact with the plasma membrane upon Ca2+
influx (Gerber and
Sudhof, 2002).
The importance of the SNARE complex for insulin secretion in β-cells has been stated in several
studies (reviews e.g. (Eliasson et al., 2008,Leung, Kwan, Ng et al., 2007,Wang and Thurmond,
2009)). Stx1A proteins are arranged in clusters along the plasma membrane in close association
with the insulin granules and the number of clusters are reduced in the GK-rat (Ohara-Imaizumi,
Nishiwaki, Nakamichi et al., 2004). In accordance, the diabetic GK-rat has reduced levels of
stx1A (Gaisano, Ostenson, Sheu et al., 2002). Inhibition of Stx1 in mice upon addition of an
antibody reduces Ca2+
-dependent insulin secretion (Martin, Moya, Gutierrez et al., 1995) and
decreases the exocytotic response by 90%, an effect that is strongly associated with inhibition of
the Ca2+
current (Vikman, Ma, Hockerman et al., 2006).
The Ca2+
-sensing element in regulated exocytosis is proposed to be aided by some isoforms in
the family of synaptotagmins (Syts;(Pang and Sudhof, 2010)), namely Syt1-3, 5-7 and 9-10.
These isoforms display Ca2+
-dependent phospholipid binding to the C2A-domain, whereas the
other members do not. The family of synaptotagmins is comprised of at least16 members out of
which Syt1-6 and 9-13 has previously been shown to be expressed in brain tissue (Pang and
Sudhof, 2010,Sudhof, 2002) where Syt5, Syt9 and Syt13 have also been detected in primary β-
cells (Grise, Taib, Monterrat et al., 2007,Iezzi, Kouri, Fukuda et al., 2004,Parton, McMillen,
Shen et al., 2006) and Syt4 transcript has been shown to be expressed in clonal β-cell lines as
well as in islet cells (Gao, Reavey-Cantwell, Young et al., 2000,Gut, Kiraly, Fukuda et al.,

5
2001). Syt7, 8, 14 and 15 are mainly expressed in heart, kidney, and pancreas (Gauthier and
Wollheim, 2008). The effect of Syt7 has previously been studied in Syt7 knockout mice, which
display impaired glucose tolerance and lowered basal- and glucose-induced insulin levels
(Gustavsson, Lao, Maximov et al., 2008).
Apart from Stx1A, Snap25, Vamp2 and the Syts, successful β-cell exocytosis involve several
proteins such as Rim1, Rim2, Stxbp (or Munc-18) and Unc-13 (or Munc-13) (Gandini, Sandoval,
Gonzalez-Ramirez et al., 2011,Kwan, Xie, Sheu et al., 2006,Yasuda, Shibasaki, Minami et al.,
2010,Zhang, Efanov, Yang et al., 2000). Most of the published work on exocytotic proteins and
insulin secretion has investigated the functional role of these proteins in rodents and less has
been performed in human islets or in genetic studies. One previous study performed on islets
from 8 donors demonstrated that expression of STX1A, SNAP25, VAMP2 and STXBP is down-
regulated in donors with T2D compared to non-diabetic controls (Ostenson, Gaisano, Sheu et al.,
2006). Transcripts of STX7, SYT5 and SYT1 in islets from a donor with T2D and expression of
Syt13 in Wistar rats have been demonstrated to be up-regulated by palmitate (Ghanaat-Pour and
Sjoholm, 2009,Ghanaat-Pour and Sjoholm, 2011).
T2D is a complex disease most likely comprised of both environmental and genetic factors
where in the case of heritability, effects seem to be more pronounced on insulin secretion in the
pancreatic β-cells than on insulin action in the target tissue. (Lehtovirta, Kaprio, Forsblom et al.,
2000). Interestingly, many of the identified polymorphisms associated with T2D are related to β-
cell function (Koeck, Olsson, Nitert et al., 2011,Lyssenko, Lupi, Marchetti et al., 2007,Olsson,
Ronn, Ladenvall et al., 2011,Rosengren, Jokubka, Tojjar et al., 2010) e.g. two studies link SNPs
in STX1A to T2D (Tsunoda, Sanke, Nakagawa et al., 2001,Romeo, Sentinelli, Cavallo et al.,
2008). Genome-Wide Association Studies (GWAS) offer the possibility to explore single
nucleotide polymorphisms (SNPs) in the genome that may be of importance in T2D (Saxena,
Voight, Lyssenko et al., 2007). The GWAS Diabetes Genetics Initiative (DGI) provides
information of SNP associations with 18 quantitative traits, including measures of insulin and
glucose levels during an oral glucose tolerance test (OGTT).
Taken together, previous reports suggest that defects in the exocytotic machinery may contribute
to the pathogenesis of T2D. For this reason, we have chosen to closer evaluate the expression
levels of 23 selected genes associated with the exocytotic process in pancreatic islets from
human donors with or without T2D. We propose that mRNA expression of exocytotic genes is
altered in islets from T2D donors, and furthermore that exocytotic gene expression correlates
with insulin secretion in human islets. In addition, we aim to examine if there are SNPs in or near
exocytotic genes that correlate to phenotypes associated with impaired insulin secretion, and/or
with gene expression itself.

6
2. Materials and methods
2.1. Human pancreatic islets
Human pancreatic islets from 55 non-diabetic and 9 T2D deceased donors were used for
microarray analysis, qPCR and glucose stimulated insulin secretion (Table 1). Additional islets
from 4 non-diabetic and 4 T2D donors were used for measurements of protein levels. All human
islets were obtained through collaboration between the Human Tissue Laboratory at Lund
University Diabetes Centre and the Nordic Network for Clinical Islet Transplantation headed by
Prof. Olle Korsgren at Uppsala University, Sweden. The donors had given their consent before
death, or consent was given by her/his relatives upon admission to Intensive Care Unit (ICU,) to
donate organs and the protocols were approved by the local ethics committees. Islets were
prepared by collagenase digestion and density gradient purification. After isolation, islets were
cultured1-7 days, free floating in CMRL 1066 culture medium (ICN Biomedicals, Costa Mesa,
CA, USA) containing human serum and 5.56 mM glucose and supplemented with 10 mmol/l
HEPES, 2 mmol/l 1-glutamine, 50 μg/ml gentamicin, 0.25 μg/ml Fungizone (GIBCO, BRL,
Gaithersburg, MD, USA), 20 μg/ml ciprofloxacin (Bayer Healthcare, Leverkusen, Germany),
and 10 mmol/l nicotinamide at 37°C (5% CO2) prior to RNA and DNA preparation. The
preparation of islets can be contaminated by exocrine tissue and is often therefore not 100%
pure. However, the islet purity was similar for non-diabetic and T2D donors (68±18% vs
58±19%, p=0.15) using dithizone staining. We further used gene expression of endocrine
(somatostatin and glucagon) and exocrine (pancreatic lipase, α2A amylase, and chymotrypsin 2)
markers to determine islet purity, and again there was no difference in purity between non-
diabetic and T2D donors (72 vs 68%, p=0.29) (Olsson, Yang, Hall et al., 2011). It was controlled
that days in culture was not affecting the expression of the investigated genes. Insulin secretion
measurements were performed on hand-picked islets, which obviously increased the purity.
2.2 Animal Model
The Sprague Dawley rat was purchased from Charles River Laboratories (Germany) and kept
under standardized conditions in the animal house facilities. The experimental procedure has
been approved by the Committee of ethical animal research in Malmö and Lund (permission
number: M249-11). Rat brain was used as control tissue in the western blot analysis.
2.3. Glucose-stimulated insulin secretion in human islets
Islets were hand-picked under a stereomicroscope at room temperature and preincubated for 30
min at 37°C in Krebs Ringer bicarbonate (KRB) buffer (pH 7.4) containing (in mM) 120 NaCl,
25NaHCO3, 4.7 KCl, 1.2 MgSO4, 2.5 CaCl2, 1.2 KH2PO, 10 HEPES supplemented with 1 mg/ml

7
albumin, N-2 hydroxyethylpiperazine-N'-2-ethanesulfonic acid (10 mM) and 1 mM glucose.
Each incubation vial contained 12 size-matched islets in 1.0 ml KRB buffer solution and was
treated with 95% O2-5% CO2 to obtain constant pH and oxygenation. After preincubation, the
buffer was changed to a KRB buffer containing either 1 mM (basal secretion; BIS) or 16.7 mM
glucose (stimulated secretion; GSIS). The islets were then incubated for 1h at 37°C in a
metabolic shaker (30 cycles per min). Immediately after incubation an aliquot of the medium
was removed for analysis of insulin using a radioimmunoassay kit (Euro-Diagnostica, Malmö,
Sweden). For each individual, measurements were performed in 6-8 vials per condition.
2.4. Gene expression in human pancreatic islets
Total RNA was isolated with the AllPrep DNA/RNA Mini Kit (Qiagen GmbH, Hilden,
Germany). RNA quality and concentration was measured using an Agilent 2100 bioanalyzer and
Nanodrop ND-1000 equipment, respectively.
The microarrays were performed following the Affymetrix standard protocol. Briefly, 200 ng of
total RNA was processed following the GeneChip® Expression 3’-Amplification Reagents One-
cycle cDNA synthesis kit instructions (Affymetrix Inc, Santa Clara, CA, US to produce double-
stranded cDNA. This was used as a template to generate biotin-targeted cRNA following
manufacturer’s specifications. 15 μg of the biotin labeled cRNA was fragmented to strands
between 35 and 200 bases in length, 10 μg of which was hybridized onto the GeneChip® Human
Gene 1.0 ST whole transcript based assay overnight in the GeneChip® Hybridization oven 6400
using standard procedures. The arrays were washed and stained in a GeneChip® Fluidics Station
450. Scanning was carried out with the GeneChip® Scanner 3000 and image analysis was
performed using GeneChip® Operating Software. The array data was summarized and
normalized with Robust Multi-array Analysis (RMA) method using the software “Expression
Console” (Affymetrix). In the present study, we studied the expression of 23 selected exocytotic
genes using data from the microarray. The genes were selected based on their previously known
function in exocytosis in pancreatic islets (Eliasson et al., 2008,Gauthier and Wollheim, 2008).
2.5. Quantitative RT-PCR
Quantitative real time PCR (qRT-PCR) was performed for selected genes in order to technically
validate the results obtained in the microarray study. Total RNA was isolated with the AllPrep
DNA/RNA Mini Kit (Qiagen GmbH, Hilden, Germany). RNA quality and concentration was
measured using an Agilent 2100 bioanalyzer and Nanodrop ND-1000 equipment, respectively.
cDNA was synthesized using QuantiTect Reverse Transcription kit (Qiagen GmbH, Hilden,
Germany). Quantitative analysis of gene expression was performed using the TaqMan qRT-PCR
with an ABI Prism 7900 HT System (Applied Biosystems, USA) using gene-specific probes and

8
primer pairs (Assays-on-demand, Applied Biosystems, USA) for SYT4 (assay ID:
Hs01086433_m1), SYT7 (Hs01590513_m1) and STX1A (Hs00270282_m1) in triplicates on 384-
well plate format using ABI 7900 platform (Applied Biosystems, USA). 1.2 ng cDNA was used
per well in 10-µL reaction volume containing TaqMan master mix (Applied Biosystems, USA).
No template control (NTC) wells containing aliquots from the RT reaction without the reverse
transcriptase enzyme were included to control for genomic DNA contamination. The human
HPRT1 (Applied Biosystem, USA) exhibited stable expression in all islet RNA preparations and
was used to normalize gene expression by the ∆∆Ct method, where the final normalized quantity
was expressed as 2^-(Ct target - Ct control).
2.6. Immunocytochemistry.
Handpicked human islets were transferred to calcium free isolation solution and dispersed into
single cells. Cells were seeded on poly-L-leucine (Sigma-Aldrich) coated dishes and cultured
overnight in RPMI-1640 medium (SVA, Sweden) supplemented with 10 mM glucose, 5%
(vol/vol) fetal calf serum, 100 μg/ml streptomycin, 100 IU/ml penicillin and 2 mM L-Glutamine
(Sigma-Aldrich). Cells were fixed and stained as described elsewhere (Vikman et al., 2006).
Primary antibodies rabbit polyclonal anti-Syntaxin1A (SySy 110 302) and Guinea pig
monoclonal anti-insulin (EuroDiagnostica B65-1) was used and secondary antibodies for rabbit
conjugated to Cy5 (Jacksson 711:175:152) and Guinea-pig conjugated to Cy2 (Jackson
706:225:148). Immunoflourescent was detected using confocal microscopy (META 510, Carl
Zeiss, Germany). Mean intensity of fluorescence was analysed in Zen 2009 version software
(Carl Zeiss, Germany). The plasma membrane and cytosol was marked and the nucleus
excluded. Mean intensity of each cell were divided by the area of the cell.
2.7. Western blot analysis
Frozen human pancreatic islets were thawed, resuspended in a buffer containing 50 mM TES, pH
7.4, 250 mM sucrose, 1 mM EDTA, and 0.1 mM EGTA, supplemented with Complete Protease
Inhibitor Cocktail (Roche) and homogenized by 10 short sonication pulses. Whole rat brain
(including cerebellum) was resuspended in a buffer containing 50 mM TES, 2 mM EDTA, 0.1
mM EGTA, 250 mM Sucrose, 40 mM phenylphosphate, 5 mM NaF, 1 mM dithioerythriol, 0.5
mM sodium orthovanadate, 10 µg/mL antipain, 10 µg/mL leupeptin, 1µg/mL pepstatin, pH 7.4
at a ratio of 3 mL buffer per gram of tissue and homogenized with a large glass homogenizer.
Total protein amount was determined according to Bradford (Bradford, 1976). Homogenates
from human pancreatic islets and rat brain were subjected to SDS-PAGE. Proteins were
transferred to polyvinylidene membranes (Millipore) and the membranes were stained with
Ponceau S (0.1% in 5% acetic acid) and blocked with 10% milk in a buffer consisting of 20 mM
Tris-HCl, pH 7.6, 137 mM NaCl and 0.1% (v/w) Tween-20 for 60 min. Membranes with
9
proteins were probed with antibodies for SYT4 (Synaptic Systems), SYT7 (Synaptic Systems),
SYT11 (Sigma-Aldrich), SYT13 (Nordic BioSite) and Cyclophilin B (PPIB) (Abcam) and
incubated overnight at 4C. Proteins were detected using the chemiluminescent Super Signal
West Pico Luminol/Enhancer solution from Pierce and the ChemiDoc XRS+ Imager (Bio-Rad
Laboratories). Quantification was made using Image Lab™ Software (Bio-Rad Laboratories).
2.8. siRNA transfection and insulin secretion assay on INS1-832/13 cells
INS1-832/13 cells were seeded at density of 400,000 cells per well on a 24-well plate in 1 mL
RPMI medium complete supplement without antibiotics. The following day, the cells were
transfected with Silencer® Select Pre-Designed siRNA (LifeTechnologies), siRNA ID in bracket:
Stx1A (s137946 and s137944), Syt4 (s134069), Syt7 (s133151), Syt11 (s133472), Syt13
(s135284) and Negative control No.1 siRNA (Cat# 4390844) using Lipofectamine RNAiMAx
(Invitrogen). A final transfection volume of 600 µL per well contain 1.5 µL of transfection
reagent and 50 nM of siRNA in Opti-MEM reduced serum media (Invitrogen). After 4 hours,
500 µL of RPMI medium with complete supplement without antibiotics was added. Medium was
changed the following the day and the cells were assayed after 48 h for insulin secretion with
subsequent protein and RNA extraction. Knockdown was assessed by RT-qPCR of the target
genes as described above using the following Taqman® gene expression assays (Life
Technologies): Stx1A (Rn00587278_m1), Syt4 (Rn01157571_m1), Syt7(Rn00572234_m1),
Syt11(Rn00581475_m1) and Syt13 (Rn00578161_m1).
After transfection insulin secretion measurements were performed. Confluent plates containing
transfected INS1-832/13 cells were washed twice with 1 mL pre-warmed Secretion Assay Buffer
(SAB), pH 7.2 (114 mM NaCl, 4.7 mM KCl, 1.2 mM KH2PO4, 1.16 mM MgSO4, 20 mM
HEPES, 2.5 mM CaCl2, 25.5 mM NaHCO3 and 0.2% Bovine Serum Albumin) containing 2.8
mM glucose. The cells were then pre-incubated for two hours in new 2 mL SAB with 2.8 mM
glucose. Afterwards, separate wells were incubated for 1 h in 1 mL SAB containing either 2.8
mM or 16.7 mM glucose. Secreted insulin was measured from supernatant using Coat-a-Count
Insulin radioimmunoassay kit (Siemens) and the values were normalized using total protein
content individually for each well.
2.9. Study population
The Diabetes Genetic Initiative (DGI) is a case-control study of individuals with T2D and
matched non-diabetic controls from Finland and Sweden (Saxena et al., 2007). 1463 patients
were classified with T2D according to WHO (1998) criteria with fasting plasma glucose ≥7.0
mmol/l or a 2 h glucose ≥11.1 mmol/l during an oral glucose tolerance test (OGTT). The 1467
control subjects were defined as normal glucose tolerant; with fasting plasma glucose <6.1

10
mmol/l and 2 h glucose <7.8 mmol/l, and had no first degree relatives with T2D (Table S1;
(Saxena et al., 2007)). In the present study, we included non-diabetic subjects only.
Measurements of insulin and glucose were performed according to the description of DGI at the
Broad Institute homepage (http://www.broadinstitute.org/diabetes). Insulinogenic index was
calculated as (Insulin30-Insulin0)/(Glucose30-Glucose0).
The Prevalence, Prediction and Prevention of Diabetes (PPP-Botnia), a population based study in
the Botnia region of Western Finland (Pyykkonen, Raikkonen, Tuomi et al., 2010) was used as a
replication cohort for genetic associations. Diagnosis of T2D was confirmed from subject
records or on the basis of fasting plasma glucose concentration ≥7.0 mmol/l and/or 2 h glucose
≥11.1 mmol/l). 4323 non-diabetic subjects were included in this study (Table S1).
All participants in DGI and PPP-Botnia gave written informed consent for the studies and the
local ethics committees approved the protocols.
2.10. Genotyping
In the DGI GWAS, genotyping was performed using Affymetrix 500K chip array (Saxena et al.,
2007). In PPP-Botnia and in human islets from cadaver donors rs12524194 and rs1339226 were
genotyped using allelic discrimination assays on the ABI 7900 platform (KASP on Demand,
KBioscience, Hertfordshire, UK and C__8331634_10, Applied Biosystems, Foster City, CA,
respectively). The genotyping call rates for both assays were above 96% and genotype calls were
in concordance based on 4.2% duplicate comparisons.
2.11. Statistical analyses
The mRNA expression of the 23 exocytotic genes on the microarray was compared between T2D
and non-diabetic donors using Mann-Whitney U-tests.
A χ2-test was used to analyze if a set of exocytotic genes showed significantly reduced gene
expression in pancreatic islets from individuals with T2D compared with non-diabetic pancreatic
islets. The test compared the observed (n=5) and expected (n=1.13) number of exocytotic genes
with nominally differential gene expression (p≤0.05) The expected number of exocytotic genes
was calculated based on the number of analyzed exocytotic genes using the microarray (n=23),
the total number of probeIDs analyzed using the microarray (n=28869) and the total number of
probeIDs that showed nominally reduced gene expression in the T2D human islets (n=1416).
Correlations were calculated using Spearman correlation coefficient (ρ).

11
Differences between groups in insulin secretion measurements performed in INS1-832/13 cells
after transfection with different siRNA were tested using Student’s t-test and multiple
comparisons were corrected using the Holm-Bonferroni method.
Genotype-phenotype associations were analyzed using linear regression analyses adjusted for
age, gender, BMI (DGI, PPP-Botnia) and geographic origin (DGI) assuming an additive genetic
model. Clinical characteristics of the participants in DGI and PPP-Botnia (Table S1) are
expressed as mean ± s.d or median (IQR). A genomic control inflation factor was used to correct
for population stratification (DGI). Phenotype values were logarithmically transformed to better
fit a normal distribution in both cohorts before analyses. Results are presented as beta coefficient
± SEM.
Statistical calculations were performed using PASW Statistics 18 for Windows (SPSS, Chicago,
IL, USA). A p-value less than 0.05 was considered significant.

12
3. Results
3.1. Decreased expression of genes involved in exocytosis in human islets from T2D donors
We were interested to examine if gene expression of exocytotic genes is down-regulated in
human islets from patients with T2D. Therefore, we analyzed microarray data of human
pancreatic islets from 55 non-diabetic and 9 T2D donors (Table 1). We identified 5 genes with
nominally reduced expression in islets from T2D donors compared to non-diabetic donors ( Fig.
1) namely, STX1A (p= 0.010), SYT4 (p=0.017), SYT7 (p=0.018), SYT11 (p=0.041) and SYT13
(p=0.0033). A χ2- test was next performed to examine if the observed number of exocytotic
genes down-regulated in T2D islets is more than expected. The frequency of observed exocytotic
genes with reduced expression (n=5) was compared to the theoretically expected number of
down-regulated exocytotic genes (n=1.13) in islets from T2D compared to non-diabetic donors.
This resulted in a χ2-value
of observed over theoretically expected down-regulated exocytotic
genes of 13.25 with p<0.001.
To validate the down-regulation seen in the microarray, 3 genes were selected for technical
replication using qRT-PCR. The technical validation (Fig. 2), ensued the reduced expression
levels of STX1A (p=0.027), SYT4 (p=0.017) and SYT7 (p=0.014) in human islets from T2D
donors (N=7) compared to non-diabetic donors (N=47).
Confirmation that the reduced gene expression could be transferred to protein level was
performed using confocal immunocytochemistry and western blot analysis. The protein level of
STX1A was significantly reduced in human islet from a T2D donor (n=14) as compared to the
level in islets from non-diabetic donors (N=2, n=37); Fig. 3a and b). Furthermore, western blot
analysis (Fig. 3c and d) revealed a significant decrease in the protein level of SYT4 and SYT11
in islets from T2D donors (N=2) as compared to non-diabetic donors (N=3). SYT7 protein level
was reduced by ~50% compared to mean control levels in one of the islet samples from a T2D
donor (Fig. 3c), but not in the other two investigated samples, and in summary SYT7 protein
levels showed no significant reduction (Fig. 3d). There was no significant difference in protein
levels of SYT13.
3.2. Correlation between expression of genes involved in exocytosis to GSIS and HbA1c
Exocytosis and thereby insulin secretion is dependent on the expression of exocytotic genes, and
studies in rodents have demonstrated impaired insulin secretion and exocytosis upon ablation of
these genes (see e.g. (Leung et al., 2007,Wang and Thurmond, 2009,Gustavsson et al., 2008)).
Thus, a positive correlation of mRNA expression of the exocytotic genes to GSIS suggests that
exocytotic genes may promote insulin secretion. Indeed, we found positive correlations between
mRNA expression and GSIS for STX1A (p=0.004), SYT4 (p=0.006), SYT7 (p=0.039) as well as
SNAP25 (p=0.042), STXBP1 (p=0.038), SYT11 (p=0.013) and SYT13 (p=0.002) using data from
13
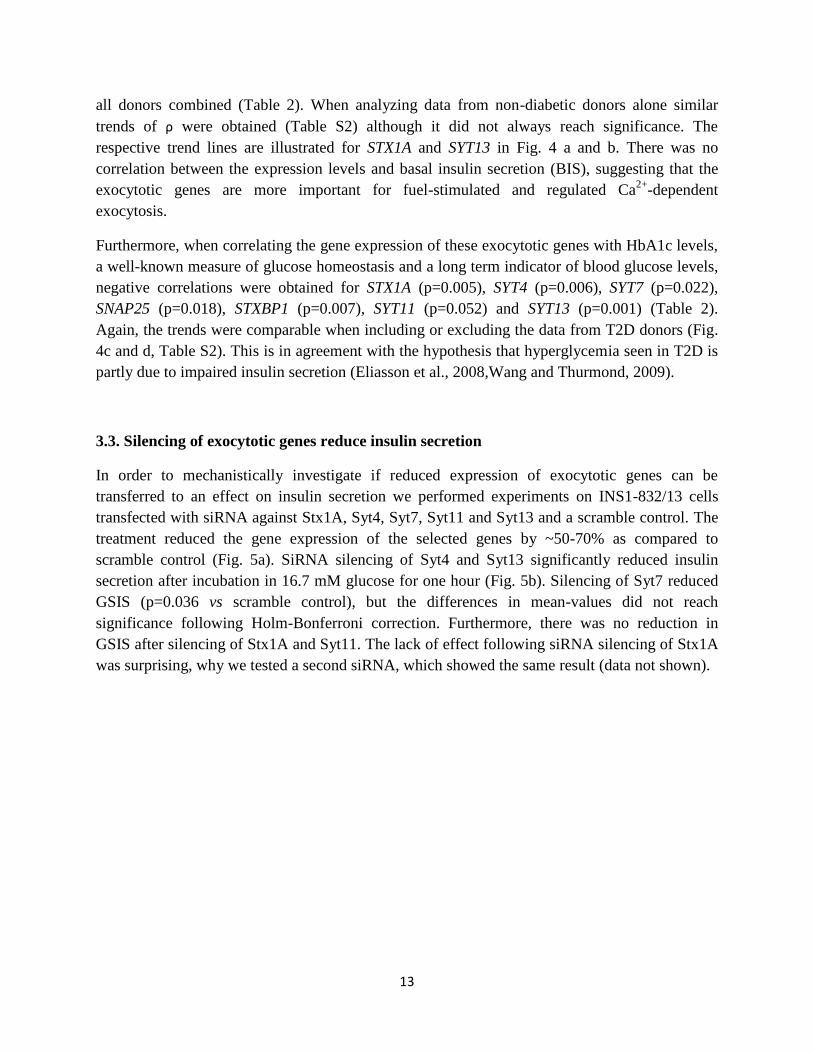
all donors combined (Table 2). When analyzing data from non-diabetic donors alone similar
trends of ρ were obtained (Table S2) although it did not always reach significance. The
respective trend lines are illustrated for STX1A and SYT13 in Fig. 4 a and b. There was no
correlation between the expression levels and basal insulin secretion (BIS), suggesting that the
exocytotic genes are more important for fuel-stimulated and regulated Ca2+
-dependent
exocytosis.
Furthermore, when correlating the gene expression of these exocytotic genes with HbA1c levels,
a well-known measure of glucose homeostasis and a long term indicator of blood glucose levels,
negative correlations were obtained for STX1A (p=0.005), SYT4 (p=0.006), SYT7 (p=0.022),
SNAP25 (p=0.018), STXBP1 (p=0.007), SYT11 (p=0.052) and SYT13 (p=0.001) (Table 2).
Again, the trends were comparable when including or excluding the data from T2D donors (Fig.
4c and d, Table S2). This is in agreement with the hypothesis that hyperglycemia seen in T2D is
partly due to impaired insulin secretion (Eliasson et al., 2008,Wang and Thurmond, 2009).
3.3. Silencing of exocytotic genes reduce insulin secretion
In order to mechanistically investigate if reduced expression of exocytotic genes can be
transferred to an effect on insulin secretion we performed experiments on INS1-832/13 cells
transfected with siRNA against Stx1A, Syt4, Syt7, Syt11 and Syt13 and a scramble control. The
treatment reduced the gene expression of the selected genes by ~50-70% as compared to
scramble control (Fig. 5a). SiRNA silencing of Syt4 and Syt13 significantly reduced insulin
secretion after incubation in 16.7 mM glucose for one hour (Fig. 5b). Silencing of Syt7 reduced
GSIS (p=0.036 vs scramble control), but the differences in mean-values did not reach
significance following Holm-Bonferroni correction. Furthermore, there was no reduction in
GSIS after silencing of Stx1A and Syt11. The lack of effect following siRNA silencing of Stx1A
was surprising, why we tested a second siRNA, which showed the same result (data not shown).
14
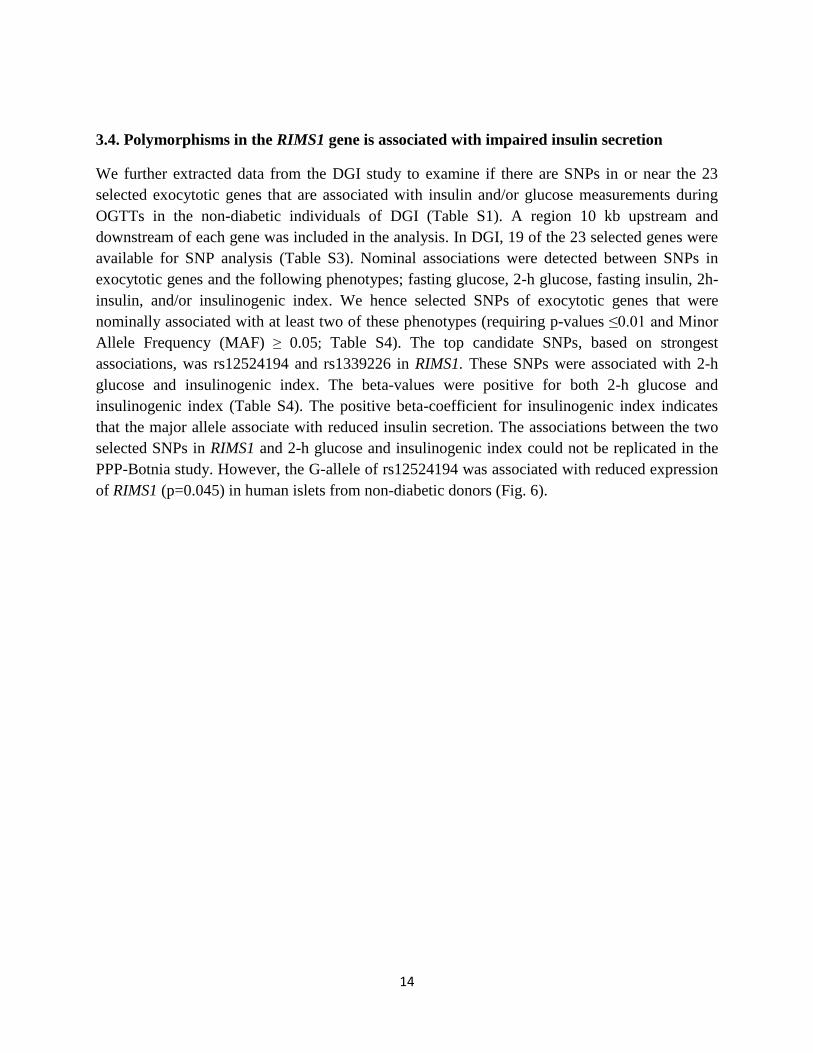
3.4. Polymorphisms in the RIMS1 gene is associated with impaired insulin secretion
We further extracted data from the DGI study to examine if there are SNPs in or near the 23
selected exocytotic genes that are associated with insulin and/or glucose measurements during
OGTTs in the non-diabetic individuals of DGI (Table S1). A region 10 kb upstream and
downstream of each gene was included in the analysis. In DGI, 19 of the 23 selected genes were
available for SNP analysis (Table S3). Nominal associations were detected between SNPs in
exocytotic genes and the following phenotypes; fasting glucose, 2-h glucose, fasting insulin, 2h-
insulin, and/or insulinogenic index. We hence selected SNPs of exocytotic genes that were
nominally associated with at least two of these phenotypes (requiring p-values ≤0.01 and Minor
Allele Frequency (MAF) ≥ 0.05; Table S4). The top candidate SNPs, based on strongest
associations, was rs12524194 and rs1339226 in RIMS1. These SNPs were associated with 2-h
glucose and insulinogenic index. The beta-values were positive for both 2-h glucose and
insulinogenic index (Table S4). The positive beta-coefficient for insulinogenic index indicates
that the major allele associate with reduced insulin secretion. The associations between the two
selected SNPs in RIMS1 and 2-h glucose and insulinogenic index could not be replicated in the
PPP-Botnia study. However, the G-allele of rs12524194 was associated with reduced expression
of RIMS1 (p=0.045) in human islets from non-diabetic donors (Fig. 6).

15
4. Discussion
A typical feature of T2D is a loss of the first phase of the biphasic insulin secretion. It is
suggested that the loss correlates to an impairment of the machinery underlying the exocytotic
process of insulin release, and we hence hypothesized that the mRNA expression of exocytotic
genes is altered in T2D islets. Indeed, we found that expression of STX1A, SYT4, SYT7, SYT11
and SYT13 was nominally down-regulated in islets from T2D donors. In addition, the expression
of these genes correlated positively with GSIS and negatively with HbA1c levels, supporting the
importance of exocytotic genes for insulin secretion and glucose homeostasis.
In agreement with a previous study (Ostenson et al., 2006) we demonstrate down-regulation of
STX1A gene expression in islets from T2D donors, and that expression of STXBP1 and SNAP25
negatively correlate with HbA1c levels. Furthermore, we identified several novel members
belonging to the SYT family i.e. SYT4, 7, 11 and 13, which exhibit decreased expression in islets
from T2D donors. Of the five genes with reduced expression, three was demonstrated to have
reduced protein levels; STX1A, SYT4 and SYT11 in islets from T2D donors. Protein levels were
investigated in a smaller number of individuals which might be reflected in that SYT7 and
SYT13 protein levels were not significantly different. The disparities seen might be due to the
inter-individual differences within the studies in terms of number of individuals investigated, the
matching of the two groups and the clinical differences between individuals. Regardless, it
highlights that reduced expression of exocytotic genes may be an important factor involved in
T2D. It should be acknowledged that the mean BMI of the T2D donors in this study was fairly
low (Table 1), which may suggest that some of the donors were undiagnosed with T1D.
However, a high BMI is not the sole cause of T2D and we have recently published data where
we demonstrate that a set of genetic variants is associated with reduced exocytosis and that this
effect is more pronounced in islets from donors with a low BMI (Rosengren, Braun, Mahdi et al.,
2012). The reduced expression of exocytotic genes is most likely not due to altered proportions
of the different cell types of the human islets since it has been reported that the β-cell number is
not reduced in T2D (Clark, Jones, de Koning et al., 2001,Rahier, Goebbels and Henquin, 1983)
although this cannot be fully discarded (Butler, Janson, Bonner-Weir et al., 2003).
It has previously been demonstrated that immunoneutralization of Stx1 (Martin et al.,
1995,Vikman et al., 2006) or expression of botulinum neurotoxin C1 light chain to cleave Stx1
(Lang, Zhang, Vaidyanathan et al., 1997) result in reduced exocytosis. Furthermore, studies in
mice depleted of Stx1 display decreased number of docked granules at the plasma membrane and
absence of first phase insulin secretion (Ohara-Imaizumi, Fujiwara, Nakamichi et al., 2007).
Indeed, in our study, expression of STX1A in human islets correlated positively with GSIS (Fig.
4a). Surprisingly, we observed no effects on GSIS following siRNA silencing of Stx1A in INS1-
832/13 cells (Fig. 5b). However, the siRNA secretion-experiments performed over one hour in
high glucose is dominated by the second phase of insulin secretion, whereas Stx1A most likely
influence first phase insulin secretion. Thus, effects on the first phase insulin secretion might not

16
be detected. Apart from Stx1A, Stx4 has been suggested to be important for insulin secretion in
rodents. Stx4 has been demonstrated to be more important for second phase insulin secretion
(Jewell, Oh and Thurmond, 2010). Thus it might be that Stx4 oversees second phase insulin
secretion and can compensate for the loss of Stx1, although it was ascertained that Stx4 mRNA
levels was not changed after siRNA silencing of stx1A (data not shown). Another explanation
could be that 50% of Stx1A suffices for fusion and thereby we could not detect any effect in
GSIS after siRNA silencing. Regardless, the absence of effect in the knock-down experiments in
INS1-832/13 cells does not exclude that reduced expression of STX1A has a role in decreasing
the insulin release in human islets.
The fact that we could not find any correlations in human islets between the expression levels
and insulin secretion at 1 mM glucose (basal insulin secretion), when the Ca2+
influx through
voltage-dependent Ca2+
channels are inhibited, suggests that the expression of exocytotic genes
is mainly important for Ca2+
-dependent exocytosis evoked by an increase in glucose
concentration. This is in line with our findings that the expression levels of several members of
the synaptotagmin family, thought to act as the main Ca2+
-sensors of exocytosis, are down-
regulated in T2D donors.
This is the first study demonstrating that expression of SYT4, 7, 11 and 13 in human islets
correlates positively with GSIS and is reduced in islets from T2D donors. In addition, both SYT4
and SYT11 protein levels were significantly reduced. In this context it is of interest that SYT11
has not previously been shown to be expressed in pancreatic islets. Syt7 have earlier been
demonstrated to be present in β-cells in rodents (Gut et al., 2001) and depletion of Syt7 leads to
reduced first phase insulin secretion (Gustavsson et al., 2008,Li, Wang, Xu et al., 2007). This
agrees with our results from the human islets (Table 2), but we could not observe any significant
reduction of secretion in INS1-832/13 after siRNA silencing of Syt7.
Syt4 is the most conserved member of the synaptotagmin family and several functions of Syt4
have been proposed in neurons. These include maturation of granules (Ahras, Otto and Tooze,
2006) and both stimulatory and inhibitory effect on exocytosis (Mori and Fukuda, 2011). The
protein is present in insulin secreting cells (Gut et al., 2001), but no study have presented any
effect on insulin exocytosis. Here we demonstrate that SYT4 gene expression is reduced in islets
from T2D donors (Figs. 1 and 2) with a concomitant decrease in SYT4 protein level (Fig. 3c and
d). Moreover, siRNA silencing of Syt4 significantly reduce GSIS in insulin-secreting cells (Fig
5b). Thus, it can be suggested that SYT4 take part in the regulation of insulin secretion, by a yet
not fully elucidated mechanism.
We detect a reduced gene expression of SYT13 in islets from T2D donors which is in line with
reduced Syt13 gene expression in the diabetic Zucker rat (Parton et al., 2006). In addition,
SYT13 gene expression is positively correlated to GSIS (Fig. 4b, Tables 2 and S2) and silencing
of Syt13 reduced insulin secretion in INS1-832/13 cells (Fig. 5b). The protein level of SYT13 in
human islets was not significantly different between the two groups why the observed down-

17
regulation of SYT13 gene expression might be a false-positive finding. However, the immunoblot
analysis was performed on islets from few individuals, due to limited amount of material.
Moreover, the insulin secretion measurements clearly demonstrate a role for SYT13 in insulin
secretion (Figs. 4b and 5b).
The positive correlation between gene expression levels and GSIS in human islets for STX1A,
SYT4, SYT7, SYT11, SYT13, SNAP25 and STXBP1 suggest a possible role of these genes in
maintaining glucose homeostasis. This fits with the concomitant negative correlation to HbA1c.
It is uncertain if the reduced expression is causing the increase in blood glucose or if the change
in expression is a result of the hyperglycemia. In our hands, siRNA silencing of exocytotic genes
was followed by reduced insulin secretion, indicating that reduced gene expression may
contribute to increases in blood glucose. It can be questioned if the impaired insulin secretion
seen in the islets from T2D donors can be due to the reduced insulin content in these islets.
However, expression of most exocytotic genes still correlate either negatively to HbA1c and/or
positively to GSIS (Table S2), when correlation analysis was performed in non-diabetics only
where insulin content was not reduced.
According to our cut-off points we found that two SNPs: rs12524194 and rs1339226 in the gene
RIMS1 were nominally associated with 2-h glucose and insulinogenic index in non-diabetic
individuals of DGI. However, we were unable to replicate this finding in a population-based
replication cohort from Botnia, Finland. Nevertheless, we found that the G-allele of rs12524194
was associated with reduced expression of RIMS1 in human islets (Fig. 6). Interestingly, carriers
of the G-allele displayed reduced insulin secretion (Table S4). Given the rather extensive SNP
analysis of the exocytotic genes performed, we are tempted to conclude that single
polymorphisms of these genes seem not to be a primary cause of impaired insulin secretion. Yet,
it is possible that if we were to investigate further upstream or downstream sections or used
larger cohorts, additional SNP associations could be detected. The down-regulation of the
exocytotic genes may instead be attributed to epigenetic changes. Indeed, epigenetic factors
including DNA methylation and histone modifications have been associated with decreased gene
expression related to reduced insulin secretion in human islets (Kaneko, Ueki, Takahashi et al.,
2010,Sandovici, Smith, Nitert et al., 2011,Yang, Dayeh, Kirkpatrick et al., 2011). Furthermore,
changes in gene expression can also be ascribed to the action of microRNAs (miRNAs); small
non-coding RNAs that infers translational regulation of specific target proteins (Guay, Roggli,
Nesca et al., 2011). We have recently detected an up-regulation of rno-miR-335 in the diabetic
GK-rat model (Esguerra, Bolmeson, Cilio et al., 2011) and validated its target protein Stxbp1.
Furthermore, the same miRNA putatively targets Snap25. Finally, it has been demonstrated that
β-cell specific knock-out of PI3K in mice leads to reduced expression of Snap25, Stx1A and
Vamp2 via impaired PI3K/Akt pathway and the transcription factor FoxO1 (Kaneko et al.,
2010). In this context, it is interesting that we found that the expression of SNAP25 and STXBP1
in human islets positively correlated to GSIS although we could not detect any SNPs that
associated with reduced expression of these genes (data not shown).

18
There is increasing evidence that impairment of the exocytotic machinery is one of several
contributing factors in the pathogenesis of T2D. This is further strengthened by this study, where
expression of some of the key players involved in this process are demonstrated to be altered in
islets from T2D donors, and where reduced expression has been shown to translate into
decreased insulin secretion. Additional studies are needed to further evaluate the role of e.g.
SYT4 in human islets insulin secretion and the relationship between expression of exocytotic
genes and development of T2D.

19
Acknowledgements
We thank Britt-Marie S. Nilsson and Anna-Maria V. Ramsay for technical assistance and the
LUDC human tissue laboratory. This work was supported by the Swedish Research Council
(Project grants: LE: 521-2008-4057; CL; 521-2010-2745; LG: 521-2007-4037; Collaboration
grant 521-2008-3086; Linneaus grant 349-2008-2974; Exodiab 2009-1039, 2009-4120), The
Novo Nordisk Foundation, The Swedish Diabetes Association, The Knut and Alice Wallenberg
Foundation, The Albert Påhlsson Foundation and a DPLU exchange grant to SAA. LE and CL
are senior researchers at the Swedish Research Council.

20
References
[1] Del Prato, S. and Tiengo, A., 2001. The importance of first-phase insulin secretion:
implications for the therapy of type 2 diabetes mellitus, Diabetes Metab Res Rev. 17, 164-74.
[2] Gerich, J.E., 2002. Is reduced first-phase insulin release the earliest detectable
abnormality in individuals destined to develop type 2 diabetes?, Diabetes. 51 Suppl 1, S117-21.
[3] Hosker, J.P., Rudenski, A.S., Burnett, M.A., Matthews, D.R. and Turner, R.C., 1989.
Similar reduction of first- and second-phase B-cell responses at three different glucose levels in
type II diabetes and the effect of gliclazide therapy, Metabolism. 38, 767-72.
[4] Barg, S., Eliasson, L., Renstrom, E. and Rorsman, P., 2002. A subset of 50 secretory
granules in close contact with L-type Ca2+ channels accounts for first-phase insulin secretion in
mouse beta-cells, Diabetes. 51 Suppl 1, S74-82.
[5] Eliasson, L., Abdulkader, F., Braun, M., Galvanovskis, J., Hoppa, M.B. and Rorsman, P.,
2008. Novel aspects of the molecular mechanisms controlling insulin secretion, J Physiol. 586,
3313-24.
[6] Gerber, S.H. and Sudhof, T.C., 2002. Molecular determinants of regulated exocytosis,
Diabetes. 51 Suppl 1, S3-11.
[7] Leung, Y.M., Kwan, E.P., Ng, B., Kang, Y. and Gaisano, H.Y., 2007. SNAREing
voltage-gated K+ and ATP-sensitive K+ channels: tuning beta-cell excitability with syntaxin-1A
and other exocytotic proteins, Endocr Rev. 28, 653-63.
[8] Wang, Z. and Thurmond, D.C., 2009. Mechanisms of biphasic insulin-granule exocytosis
- roles of the cytoskeleton, small GTPases and SNARE proteins, J Cell Sci. 122, 893-903.
[9] Ohara-Imaizumi, M., Nishiwaki, C., Nakamichi, Y., Kikuta, T., Nagai, S. and
Nagamatsu, S., 2004. Correlation of syntaxin-1 and SNAP-25 clusters with docking and fusion of
insulin granules analysed by total internal reflection fluorescence microscopy, Diabetologia. 47,
2200-7.
[10] Gaisano, H.Y., Ostenson, C.G., Sheu, L., Wheeler, M.B. and Efendic, S., 2002.
Abnormal expression of pancreatic islet exocytotic soluble N-ethylmaleimide-sensitive factor
attachment protein receptors in Goto-Kakizaki rats is partially restored by phlorizin treatment and
accentuated by high glucose treatment, Endocrinology. 143, 4218-26.
[11] Martin, F., Moya, F., Gutierrez, L.M., Reig, J.A. and Soria, B., 1995. Role of syntaxin in
mouse pancreatic beta cells, Diabetologia. 38, 860-3.
[12] Vikman, J., Ma, X., Hockerman, G.H., Rorsman, P. and Eliasson, L., 2006. Antibody
inhibition of synaptosomal protein of 25 kDa (SNAP-25) and syntaxin 1 reduces rapid exocytosis
in insulin-secreting cells, J Mol Endocrinol. 36, 503-15.
[13] Pang, Z.P. and Sudhof, T.C., 2010. Cell biology of Ca2+-triggered exocytosis, Curr Opin
Cell Biol. 22, 496-505.
[14] Sudhof, T.C., 2002. Synaptotagmins: why so many?, J Biol Chem. 277, 7629-32.
[15] Grise, F., Taib, N., Monterrat, C., Lagree, V. and Lang, J., 2007. Distinct roles of the
C2A and the C2B domain of the vesicular Ca2+ sensor synaptotagmin 9 in endocrine beta-cells,
Biochem J. 403, 483-92.
[16] Iezzi, M., Kouri, G., Fukuda, M. and Wollheim, C.B., 2004. Synaptotagmin V and IX
isoforms control Ca2+ -dependent insulin exocytosis, J Cell Sci. 117, 3119-27.
[17] Parton, L.E., McMillen, P.J., Shen, Y., Docherty, E., Sharpe, E., Diraison, F., Briscoe,
C.P. and Rutter, G.A., 2006. Limited role for SREBP-1c in defective glucose-induced insulin
secretion from Zucker diabetic fatty rat islets: a functional and gene profiling analysis, Am J
Physiol Endocrinol Metab. 291, E982-94.
[18] Gao, Z., Reavey-Cantwell, J., Young, R.A., Jegier, P. and Wolf, B.A., 2000.
Synaptotagmin III/VII isoforms mediate Ca2+-induced insulin secretion in pancreatic islet beta -
cells, J Biol Chem. 275, 36079-85.

21
[19] Gut, A., Kiraly, C.E., Fukuda, M., Mikoshiba, K., Wollheim, C.B. and Lang, J., 2001.
Expression and localisation of synaptotagmin isoforms in endocrine beta-cells: their function in
insulin exocytosis, J Cell Sci. 114, 1709-16.
[20] Gauthier, B.R. and Wollheim, C.B., 2008. Synaptotagmins bind calcium to release
insulin, Am J Physiol Endocrinol Metab. 295, E1279-86.
[21] Gustavsson, N., Lao, Y., Maximov, A., Chuang, J.C., Kostromina, E., Repa, J.J., Li, C.,
Radda, G.K., Sudhof, T.C. and Han, W., 2008. Impaired insulin secretion and glucose intolerance
in synaptotagmin-7 null mutant mice, Proc Natl Acad Sci U S A. 105, 3992-7.
[22] Gandini, M.A., Sandoval, A., Gonzalez-Ramirez, R., Mori, Y., de Waard, M. and Felix,
R., 2011. Functional Coupling of Rab3-interacting Molecule 1 (RIM1) and L-type Ca2+
Channels in Insulin Release, J Biol Chem. 286, 15757-65.
[23] Kwan, E.P., Xie, L., Sheu, L., Nolan, C.J., Prentki, M., Betz, A., Brose, N. and Gaisano,
H.Y., 2006. Munc13-1 deficiency reduces insulin secretion and causes abnormal glucose
tolerance, Diabetes. 55, 1421-9.
[24] Yasuda, T., Shibasaki, T., Minami, K., Takahashi, H., Mizoguchi, A., Uriu, Y., Numata,
T., Mori, Y., Miyazaki, J., Miki, T. and Seino, S., 2010. Rim2alpha determines docking and
priming states in insulin granule exocytosis, Cell Metab. 12, 117-29.
[25] Zhang, W., Efanov, A., Yang, S.N., Fried, G., Kolare, S., Brown, H., Zaitsev, S.,
Berggren, P.O. and Meister, B., 2000. Munc-18 associates with syntaxin and serves as a negative
regulator of exocytosis in the pancreatic beta -cell, J Biol Chem. 275, 41521-7.
[26] Ostenson, C.G., Gaisano, H., Sheu, L., Tibell, A. and Bartfai, T., 2006. Impaired gene
and protein expression of exocytotic soluble N-ethylmaleimide attachment protein receptor
complex proteins in pancreatic islets of type 2 diabetic patients, Diabetes. 55, 435-40.
[27] Ghanaat-Pour, H. and Sjoholm, A., 2009. Gene expression regulated by pioglitazone and
exenatide in normal and diabetic rat islets exposed to lipotoxicity, Diabetes Metab Res Rev. 25,
163-84.
[28] Ghanaat-Pour, H. and Sjoholm, A., 2011. Exenatide and Pioglitazone Regulate Fatty
Acid-Induced Gene Expression in Normal and Diabetic Human Islets, Metabolomics. 1, 1-24.
[29] Lehtovirta, M., Kaprio, J., Forsblom, C., Eriksson, J., Tuomilehto, J. and Groop, L.,
2000. Insulin sensitivity and insulin secretion in monozygotic and dizygotic twins, Diabetologia.
43, 285-293.
[30] Koeck, T., Olsson, A.H., Nitert, M.D., Sharoyko, V.V., Ladenvall, C., Kotova, O.,
Reiling, E., Ronn, T., Parikh, H., Taneera, J., Eriksson, J.G., Metodiev, M.D., Larsson, N.G.,
Balhuizen, A., Luthman, H., Stancakova, A., Kuusisto, J., Laakso, M., Poulsen, P., Vaag, A.,
Groop, L., Lyssenko, V., Mulder, H. and Ling, C., 2011. A common variant in TFB1M is
associated with reduced insulin secretion and increased future risk of type 2 diabetes, Cell Metab.
13, 80-91.
[31] Lyssenko, V., Lupi, R., Marchetti, P., Del Guerra, S., Orho-Melander, M., Almgren, P.,
Sjogren, M., Ling, C., Eriksson, K.F., Lethagen, A.L., Mancarella, R., Berglund, G., Tuomi, T.,
Nilsson, P., Del Prato, S. and Groop, L., 2007. Mechanisms by which common variants in the
TCF7L2 gene increase risk of type 2 diabetes, J Clin Invest. 117, 2155-63.
[32] Olsson, A.H., Ronn, T., Ladenvall, C., Parikh, H., Isomaa, B., Groop, L. and Ling, C.,
2011. Two common genetic variants near nuclear-encoded OXPHOS genes are associated with
insulin secretion in vivo, Eur J Endocrinol. 164, 765-71.
[33] Rosengren, A.H., Jokubka, R., Tojjar, D., Granhall, C., Hansson, O., Li, D.Q., Nagaraj,
V., Reinbothe, T.M., Tuncel, J., Eliasson, L., Groop, L., Rorsman, P., Salehi, A., Lyssenko, V.,
Luthman, H. and Renstrom, E., 2010. Overexpression of alpha2A-adrenergic receptors
contributes to type 2 diabetes, Science. 327, 217-20.
[34] Tsunoda, K., Sanke, T., Nakagawa, T., Furuta, H. and Nanjo, K., 2001. Single nucleotide
polymorphism (D68D, T to C) in the syntaxin 1A gene correlates to age at onset and insulin
requirement in Type II diabetic patients, Diabetologia. 44, 2092-7.
22
[35] Romeo, S., Sentinelli, F., Cavallo, M.G., Leonetti, F., Fallarino, M., Mariotti, S. and
Baroni, M.G., 2008. Search for genetic variants of the SYNTAXIN 1A (STX1A) gene: the -352
A>T variant in the STX1A promoter associates with impaired glucose metabolism in an Italian
obese population, Int J Obes (Lond). 32, 413-20.
[36] Saxena, R., Voight, B.F., Lyssenko, V., Burtt, N.P., de Bakker, P.I., Chen, H., Roix, J.J.,
Kathiresan, S., Hirschhorn, J.N., Daly, M.J., Hughes, T.E., Groop, L., Altshuler, D., Almgren, P.,
Florez, J.C., Meyer, J., Ardlie, K., Bengtsson Bostrom, K., Isomaa, B., Lettre, G., Lindblad, U.,
Lyon, H.N., Melander, O., Newton-Cheh, C., Nilsson, P., Orho-Melander, M., Rastam, L.,
Speliotes, E.K., Taskinen, M.R., Tuomi, T., Guiducci, C., Berglund, A., Carlson, J., Gianniny, L.,
Hackett, R., Hall, L., Holmkvist, J., Laurila, E., Sjogren, M., Sterner, M., Surti, A., Svensson, M.,
Tewhey, R., Blumenstiel, B., Parkin, M., Defelice, M., Barry, R., Brodeur, W., Camarata, J.,
Chia, N., Fava, M., Gibbons, J., Handsaker, B., Healy, C., Nguyen, K., Gates, C., Sougnez, C.,
Gage, D., Nizzari, M., Gabriel, S.B., Chirn, G.W., Ma, Q., Parikh, H., Richardson, D., Ricke, D.
and Purcell, S., 2007. Genome-wide association analysis identifies loci for type 2 diabetes and
triglyceride levels, Science. 316, 1331-6.
[37] Olsson, A.H., Yang, B.T., Hall, E., Taneera, J., Salehi, A., Nitert, M.D. and Ling, C.,
2011. Decreased expression of genes involved in oxidative phosphorylation in human pancreatic
islets from patients with type 2 diabetes, Eur J Endocrinol. 165, 589-95.
[38] Bradford, M.M., 1976. A rapid and sensitive method for the quantitation of microgram
quantities of protein utilizing the principle of protein-dye binding, Anal Biochem. 72, 248-54.
[39] Pyykkonen, A.J., Raikkonen, K., Tuomi, T., Eriksson, J.G., Groop, L. and Isomaa, B.,
2010. Stressful life events and the metabolic syndrome: the prevalence, prediction and prevention
of diabetes (PPP)-Botnia Study, Diabetes Care. 33, 378-84.
[40] Rosengren, A.H., Braun, M., Mahdi, T., Andersson, S.A., Travers, M.E., Shigeto, M.,
Zhang, E., Almgren, P., Ladenvall, C., Axelsson, A.S., Edlund, A., Pedersen, M.G., Jonsson, A.,
Ramracheya, R., Tang, Y., Walker, J.N., Barrett, A., Johnson, P.R., Lyssenko, V., McCarthy,
M.I., Groop, L., Salehi, A., Gloyn, A.L., Renstrom, E., Rorsman, P. and Eliasson, L., 2012.
Reduced Insulin Exocytosis in Human Pancreatic beta-Cells With Gene Variants Linked to Type
2 Diabetes, Diabetes. 61, 1726-33.
[41] Clark, A., Jones, L.C., de Koning, E., Hansen, B.C. and Matthews, D.R., 2001.
Decreased insulin secretion in type 2 diabetes: a problem of cellular mass or function?, Diabetes.
50 Suppl 1, S169-71.
[42] Rahier, J., Goebbels, R.M. and Henquin, J.C., 1983. Cellular composition of the human
diabetic pancreas, Diabetologia. 24, 366-71.
[43] Butler, A.E., Janson, J., Bonner-Weir, S., Ritzel, R., Rizza, R.A. and Butler, P.C., 2003.
Beta-cell deficit and increased beta-cell apoptosis in humans with type 2 diabetes, Diabetes. 52,
102-10.
[44] Lang, J., Zhang, H., Vaidyanathan, V.V., Sadoul, K., Niemann, H. and Wollheim, C.B.,
1997. Transient expression of botulinum neurotoxin C1 light chain differentially inhibits calcium
and glucose induced insulin secretion in clonal beta-cells, FEBS Lett. 419, 13-7.
[45] Ohara-Imaizumi, M., Fujiwara, T., Nakamichi, Y., Okamura, T., Akimoto, Y., Kawai, J.,
Matsushima, S., Kawakami, H., Watanabe, T., Akagawa, K. and Nagamatsu, S., 2007. Imaging
analysis reveals mechanistic differences between first- and second-phase insulin exocytosis, J
Cell Biol. 177, 695-705.
[46] Jewell, J.L., Oh, E. and Thurmond, D.C., 2010. Exocytosis mechanisms underlying
insulin release and glucose uptake: conserved roles for Munc18c and syntaxin 4, Am J Physiol
Regul Integr Comp Physiol. 298, R517-31.
[47] Li, Y., Wang, P., Xu, J., Gorelick, F., Yamazaki, H., Andrews, N. and Desir, G.V., 2007.
Regulation of insulin secretion and GLUT4 trafficking by the calcium sensor synaptotagmin VII,
Biochemical and biophysical research communications. 362, 658-664.

23
[48] Ahras, M., Otto, G.P. and Tooze, S.A., 2006. Synaptotagmin IV is necessary for the
maturation of secretory granules in PC12 cells, J Cell Biol. 173, 241-51.
[49] Mori, Y. and Fukuda, M., 2011. Synaptotagmin IV acts as a multi-functional regulator of
Ca2+-dependent exocytosis, Neurochem Res. 36, 1222-7.
[50] Kaneko, K., Ueki, K., Takahashi, N., Hashimoto, S., Okamoto, M., Awazawa, M.,
Okazaki, Y., Ohsugi, M., Inabe, K., Umehara, T., Yoshida, M., Kakei, M., Kitamura, T., Luo, J.,
Kulkarni, R.N., Kahn, C.R., Kasai, H., Cantley, L.C. and Kadowaki, T., 2010. Class IA
phosphatidylinositol 3-kinase in pancreatic beta cells controls insulin secretion by multiple
mechanisms, Cell Metab. 12, 619-32.
[51] Sandovici, I., Smith, N.H., Nitert, M.D., Ackers-Johnson, M., Uribe-Lewis, S., Ito, Y.,
Jones, R.H., Marquez, V.E., Cairns, W., Tadayyon, M., O'Neill, L.P., Murrell, A., Ling, C.,
Constancia, M. and Ozanne, S.E., 2011. Maternal diet and aging alter the epigenetic control of a
promoter-enhancer interaction at the Hnf4a gene in rat pancreatic islets, Proc Natl Acad Sci U S
A. 108, 5449-54.
[52] Yang, B.T., Dayeh, T.A., Kirkpatrick, C.L., Taneera, J., Kumar, R., Groop, L., Wollheim,
C.B., Nitert, M.D. and Ling, C., 2011. Insulin promoter DNA methylation correlates negatively
with insulin gene expression and positively with HbA(1c) levels in human pancreatic islets,
Diabetologia. 54, 360-7.
[53] Guay, C., Roggli, E., Nesca, V., Jacovetti, C. and Regazzi, R., 2011. Diabetes mellitus, a
microRNA-related disease?, Transl Res. 157, 253-64.
[54] Esguerra, J.L., Bolmeson, C., Cilio, C.M. and Eliasson, L., 2011. Differential glucose-
regulation of microRNAs in pancreatic islets of non-obese type 2 diabetes model Goto-Kakizaki
rat, PLoS One. 6, e18613.
24
TABLES
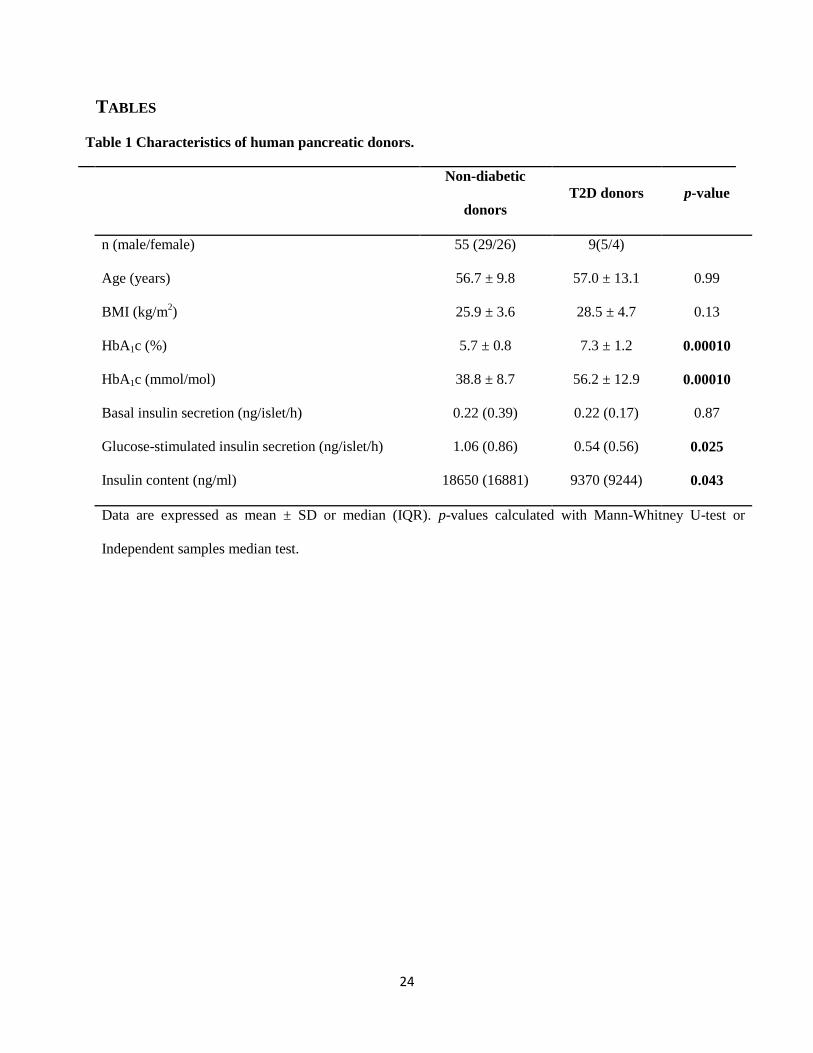
Table 1 Characteristics of human pancreatic donors.
Non-diabetic
donors
T2D donors p-value
n (male/female) 55 (29/26) 9(5/4)
Age (years) 56.7 ± 9.8 57.0 ± 13.1 0.99
BMI (kg/m2) 25.9 ± 3.6 28.5 ± 4.7 0.13
HbA1c (%)
HbA1c (mmol/mol)
5.7 ± 0.8
38.8 ± 8.7
7.3 ± 1.2
56.2 ± 12.9
0.00010
0.00010
Basal insulin secretion (ng/islet/h) 0.22 (0.39) 0.22 (0.17) 0.87
Glucose-stimulated insulin secretion (ng/islet/h)
Insulin content (ng/ml)
1.06 (0.86)
18650 (16881)
0.54 (0.56)
9370 (9244)
0.025
0.043
Data are expressed as mean ± SD or median (IQR). p-values calculated with Mann-Whitney U-test or
Independent samples median test.

25
Table 2. Spearman correlations (ρ) between expression of exocytotic genes and HbA1c, GSIS and
BIS in human donors.
Gene HbA1c (n=52) GSIS (n=48) BIS (n=48)
ρ p-value ρ p-value ρ p-value
RIMS1 0.189 0.180 -0.006 0.968 0.59 0.689
RIMS2 -0.393 0.004 0.265 0.069 -0.090 0.541
SNAP25 -0.327 0.018 0.295 0.042 0.092 0.535
STX1A -0.386 0.005 0.409 0.004 0.198 0.178
STXBP1 -0.371 0.007 0.300 0.038 0.025 0.868
STXBP2 0.379 0.006 -0.238 0.104 0.079 0.595
STXBP3 0.087 0.541 0.118 0.423 0.193 0.189
SYT1 -0.81 0.567 0.264 0.069 0.190 0.196
SYT2 -0.123 0.386 -0.075 0.614 -0.124 0.403
SYT3 0.010 0.944 -0.151 0.307 0.054 0.713
SYT4 -0.377 0.006 0.393 0.006 0.079 0.591
SYT5 -0.198 0.160 0.269 0.064 -0.008 0.959
SYT6 0.020 0.890 -0.103 0.487 -0.051 0.729
SYT7 -0.318 0.022 0.298 0.039 0.047 0.753
SYT8 -0.159 0.259 0.028 0.851 0.019 0.896
SYT9 -0.097 0.496 -0.049 0.742 -0.147 0.318
SYT11 -0.271 0.052 0.355 0.013 0.120 0.418
SYT13 -0.458 0.001 0.440 0.002 0.130 0.379
VAMP2 -0.287 0.039 0.250 0.087 -0.066 0.656
UNC13A -0.269 0.054 0.266 0.068 0.034 0.818
UNC13B -0.187 0.185 -0.095 0.522 -0.023 0.875
UNC13C 0.032 0.823 -0.128 0.385 -0.083 0.575
UNC13D -0.014 0.919 -0.262 0.072 -0.091 0.536
Data were obtained from non-diabetic and T2D donors and are presented by the Spearman
correlation factor (ρ) and p-value of the association. Significant correlations (p<0.05) are
indicated in bold. GSIS-Glucose Stimulated Insulin Secretion; BIS- Basal Insulin Secretion
26
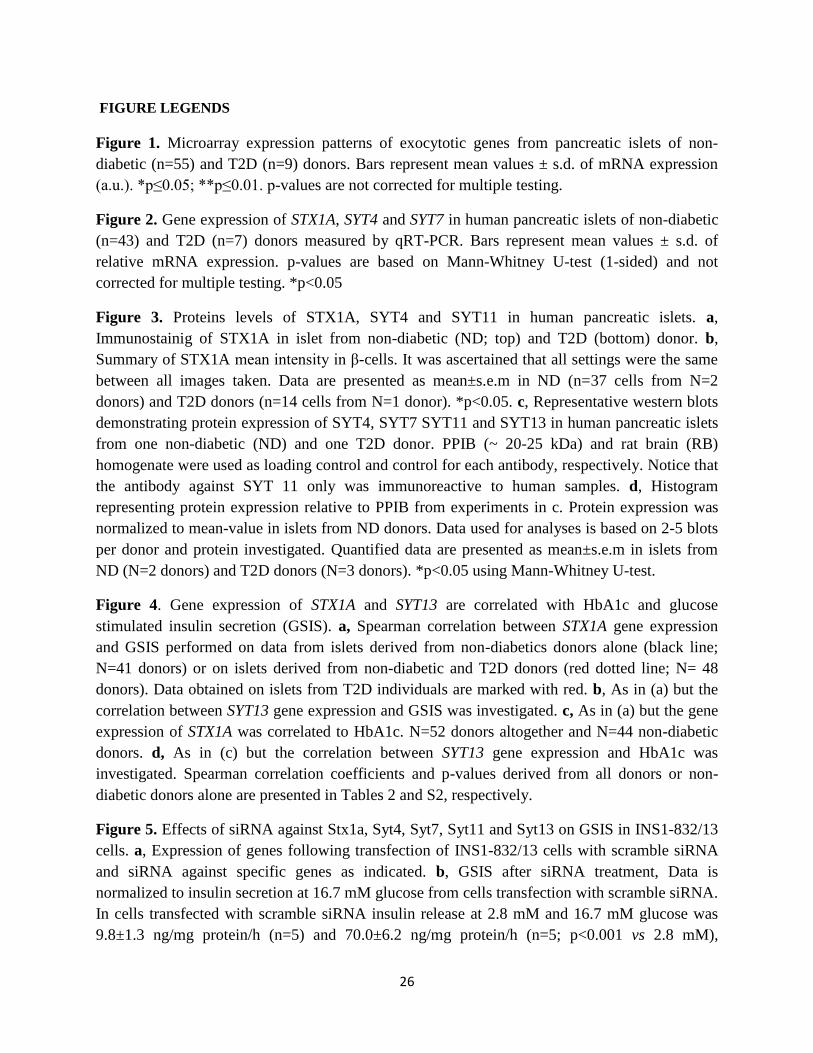
FIGURE LEGENDS
Figure 1. Microarray expression patterns of exocytotic genes from pancreatic islets of non-
diabetic (n=55) and T2D (n=9) donors. Bars represent mean values ± s.d. of mRNA expression
(a.u.). *p≤0.05; **p≤0.01. p-values are not corrected for multiple testing.
Figure 2. Gene expression of STX1A, SYT4 and SYT7 in human pancreatic islets of non-diabetic
(n=43) and T2D (n=7) donors measured by qRT-PCR. Bars represent mean values ± s.d. of
relative mRNA expression. p-values are based on Mann-Whitney U-test (1-sided) and not
corrected for multiple testing. *p<0.05
Figure 3. Proteins levels of STX1A, SYT4 and SYT11 in human pancreatic islets. a,
Immunostainig of STX1A in islet from non-diabetic (ND; top) and T2D (bottom) donor. b,
Summary of STX1A mean intensity in β-cells. It was ascertained that all settings were the same
between all images taken. Data are presented as mean±s.e.m in ND (n=37 cells from N=2
donors) and T2D donors (n=14 cells from N=1 donor). *p<0.05. c, Representative western blots
demonstrating protein expression of SYT4, SYT7 SYT11 and SYT13 in human pancreatic islets
from one non-diabetic (ND) and one T2D donor. PPIB (~ 20-25 kDa) and rat brain (RB)
homogenate were used as loading control and control for each antibody, respectively. Notice that
the antibody against SYT 11 only was immunoreactive to human samples. d, Histogram
representing protein expression relative to PPIB from experiments in c. Protein expression was
normalized to mean-value in islets from ND donors. Data used for analyses is based on 2-5 blots
per donor and protein investigated. Quantified data are presented as mean±s.e.m in islets from
ND (N=2 donors) and T2D donors (N=3 donors). *p<0.05 using Mann-Whitney U-test.
Figure 4. Gene expression of STX1A and SYT13 are correlated with HbA1c and glucose
stimulated insulin secretion (GSIS). a, Spearman correlation between STX1A gene expression
and GSIS performed on data from islets derived from non-diabetics donors alone (black line;
N=41 donors) or on islets derived from non-diabetic and T2D donors (red dotted line; N= 48
donors). Data obtained on islets from T2D individuals are marked with red. b, As in (a) but the
correlation between SYT13 gene expression and GSIS was investigated. c, As in (a) but the gene
expression of STX1A was correlated to HbA1c. N=52 donors altogether and N=44 non-diabetic
donors. d, As in (c) but the correlation between SYT13 gene expression and HbA1c was
investigated. Spearman correlation coefficients and p-values derived from all donors or non-
diabetic donors alone are presented in Tables 2 and S2, respectively.
Figure 5. Effects of siRNA against Stx1a, Syt4, Syt7, Syt11 and Syt13 on GSIS in INS1-832/13
cells. a, Expression of genes following transfection of INS1-832/13 cells with scramble siRNA
and siRNA against specific genes as indicated. b, GSIS after siRNA treatment, Data is
normalized to insulin secretion at 16.7 mM glucose from cells transfection with scramble siRNA.
In cells transfected with scramble siRNA insulin release at 2.8 mM and 16.7 mM glucose was
9.8±1.3 ng/mg protein/h (n=5) and 70.0±6.2 ng/mg protein/h (n=5; p<0.001 vs 2.8 mM),

27
respectively. Data is presented as mean±sem of n=5 experiments in each group. ***p<0.001 and
**p<0.01 vs scramble using Students t-test corrected by the Holm-Bonferroni-method.
Figure 6. Expression of RIMS1 (a.u.) in islets with different genotypes of rs12524194. *p<0.05
vs the expression of RIMS1 in AA carriers.