GLOBE TELECOM, INC. 1Q06 Investors’ Briefing · GLOBE TELECOM, INC. 1Q06 Investors’ Briefing...
13
1 1 GLOBE TELECOM, INC. GLOBE TELECOM, INC. GLOBE TELECOM, INC. GLOBE TELECOM, INC. 1Q06 Investors’ Briefing 1Q06 Investors’ Briefing 1Q06 Investors’ Briefing 1Q06 Investors’ Briefing May 9, 2006 May 9, 2006 May 9, 2006 May 9, 2006 2 Q1 Highlights – Sustaining the gains of 2H 2005 ! Operating metrics continuing on upward Operating metrics continuing on upward trajectory trajectory – Subscriber growth across all brands, lower churn – Steady ARPUs despite price-based offers in the market ! Strong financial performance Strong financial performance – EBITDA and EBIT at historic highs, with higher revenues and lower spend – Q1 net income of P3.5 billion, up 19% YoY, despite three-fold growth in income taxes to P1.5 billion – Before FX/MTM gains, net income up 40% YoY and 19% quarter-on-quarter
Transcript of GLOBE TELECOM, INC. 1Q06 Investors’ Briefing · GLOBE TELECOM, INC. 1Q06 Investors’ Briefing...
1
1
GLOBE TELECOM, INC.GLOBE TELECOM, INC.GLOBE TELECOM, INC.GLOBE TELECOM, INC.1Q06 Investors’ Briefing1Q06 Investors’ Briefing1Q06 Investors’ Briefing1Q06 Investors’ Briefing
May 9, 2006May 9, 2006May 9, 2006May 9, 2006
2
Q1 Highlights –Sustaining the gains of 2H 2005
!! Operating metrics continuing on upward Operating metrics continuing on upward trajectorytrajectory
– Subscriber growth across all brands, lower churn
– Steady ARPUs despite price-based offers in the market
!! Strong financial performanceStrong financial performance
– EBITDA and EBIT at historic highs, with higher revenues and lower spend
– Q1 net income of P3.5 billion, up 19% YoY, despite three-fold growth in income taxes to P1.5 billion
– Before FX/MTM gains, net income up 40% YoYand 19% quarter-on-quarter
2
3
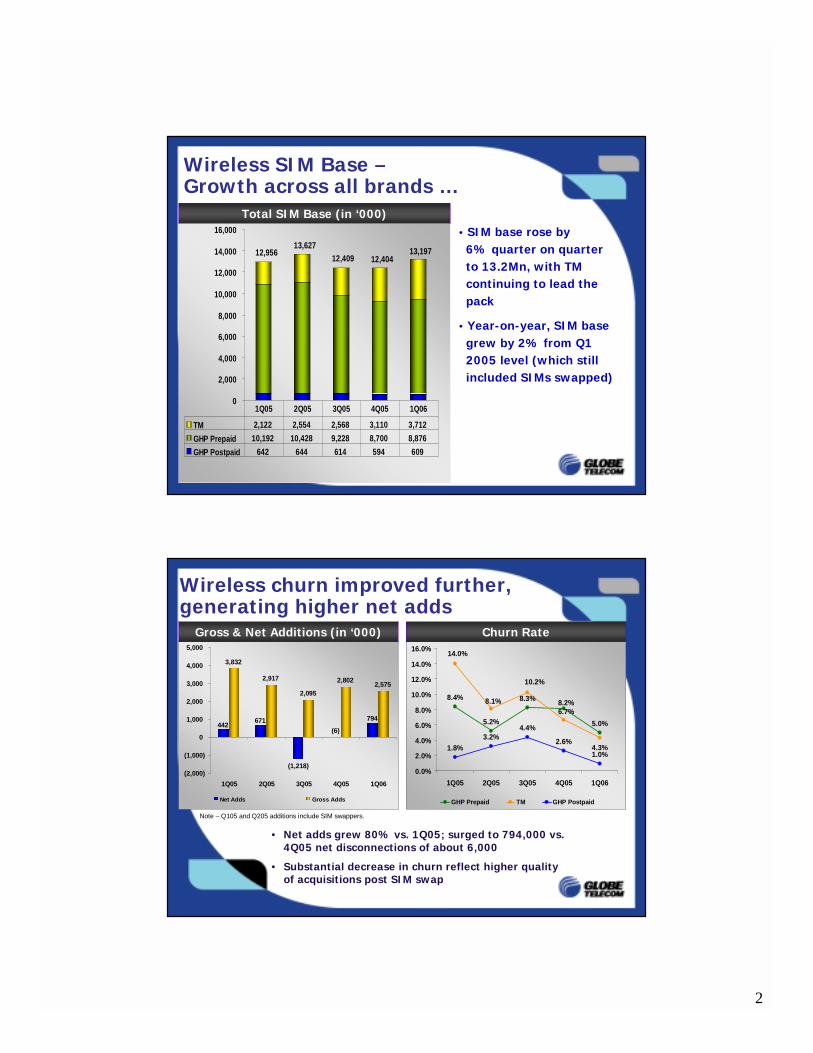
Total SIM Base (in ‘000)
12,40913,19712,956
13,627
12,404
0
2,000
4,000
6,000
8,000
10,000
12,000
14,000
16,000
TM 2,122 2,554 2,568 3,110 3,712
GHP Prepaid 10,192 10,428 9,228 8,700 8,876
GHP Postpaid 642 644 614 594 609
1Q05 2Q05 3Q05 4Q05 1Q06
Wireless SIM Base –Growth across all brands …
• SIM base rose by 6% quarter on quarter to 13.2Mn, with TM continuing to lead the pack
• Year-on-year, SIM base grew by 2% from Q1 2005 level (which still included SIMs swapped)
4
(1,218)
(6)
3,832
2,917
2,095
2,8022,575
794671442
(2,000)
(1,000)
0
1,000
2,000
3,000
4,000
5,000
1Q05 2Q05 3Q05 4Q05 1Q06
Net Adds Gross Adds
8.4%
5.2%
8.3%
5.0%
4.3%1.8%3.2%
4.4%
2.6%
1.0%
8.2%
10.2%
8.1%
14.0%
6.7%
0.0%
2.0%
4.0%
6.0%
8.0%
10.0%
12.0%
14.0%
16.0%
1Q05 2Q05 3Q05 4Q05 1Q06
GHP Prepaid TM GHP Postpaid
Gross & Net Additions (in ‘000)
Wireless churn improved further, generating higher net adds
Churn Rate
• Net adds grew 80% vs. 1Q05; surged to 794,000 vs. 4Q05 net disconnections of about 6,000
• Substantial decrease in churn reflect higher quality of acquisitions post SIM swap
Note – Q105 and Q205 additions include SIM swappers.
3
5
114
205226
285 301
144
87 8659 72
7,587
9,068
5,462
4,303
7,430
188189
406
371
262
-
100
200
300
400
500
600
700
1Q05 2Q05 3Q05 4Q05 1Q06
-
2,000
4,000
6,000
8,000
10,000
GHP Prepaid TM Postpaid Blended
SAC (in P)
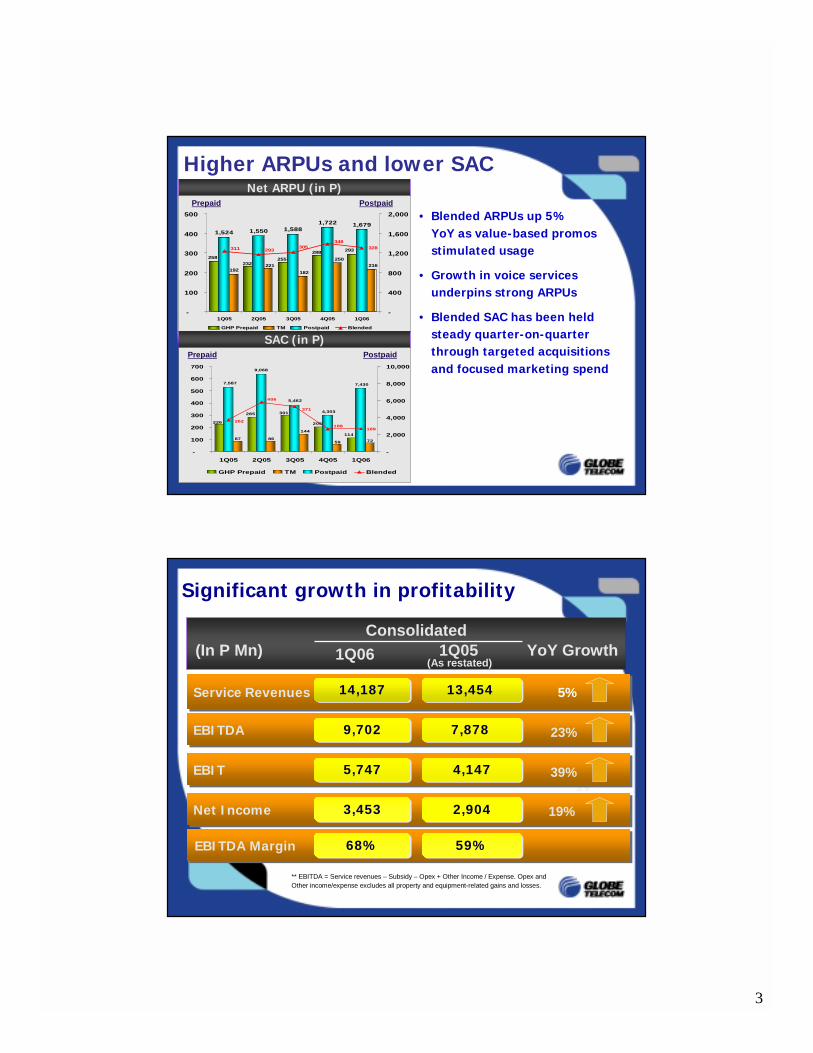
Net ARPU (in P)
Higher ARPUs and lower SAC
Prepaid Postpaid
Prepaid Postpaid
• Blended ARPUs up 5% YoY as value-based promos stimulated usage
• Growth in voice services underpins strong ARPUs
• Blended SAC has been held steady quarter-on-quarter through targeted acquisitions and focused marketing spend
293288
255232
258
216250
182
221192
1,524 1,550
1,722 1,6791,588
328348
311 293305
-
100
200
300
400
500
1Q05 2Q05 3Q05 4Q05 1Q06-
400
800
1,200
1,600
2,000
GHP Prepaid TM Postpaid Blended
6
Significant growth in profitability
(In P Mn) 1Q06 1Q05 YoY Growth(As restated)
Service RevenuesService Revenues
3.9
13,454 13,454 14,18714,187 5%
EBITDAEBITDA 7,878 7,878 9,7029,702 23%
EBITEBIT 4,1474,1475,7475,747 39%
Net Income Net Income 2,9042,9043,4533,453 19%
EBITDA Margin EBITDA Margin 68%68% 59%59%
** EBITDA = Service revenues – Subsidy – Opex + Other Income / Expense. Opex and Other income/expense excludes all property and equipment-related gains and losses.
Consolidated
4
7
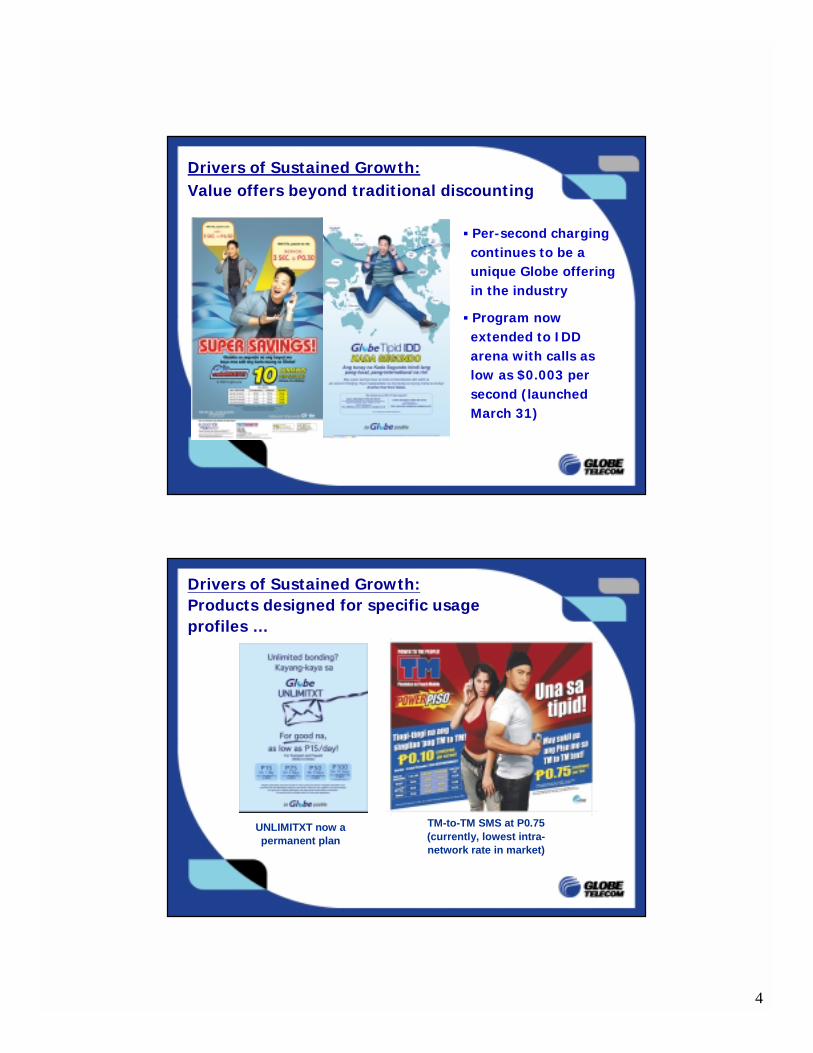
Drivers of Sustained Growth: Value offers beyond traditional discounting
" Per-second charging continues to be a unique Globe offering in the industry
" Program now extended to IDD arena with calls as low as $0.003 per second (launched March 31)
8
Drivers of Sustained Growth:Products designed for specific usage profiles …
UNLIMITXT now a permanent plan
TM-to-TM SMS at P0.75 (currently, lowest intra-network rate in market)

5
9
Drivers of Sustained Growth:… and targeted subscriber segments
Kababayan program –Reduced rates for calls to Japan & Saudi Arabia, and mobile calls to HK CSL &
Singtel
Php 7.50/minute for calls to US and Canada during off-peak
hours
10
• Improving subscriber experience in tandem with value offers through
! Improved customer service
! Superior local and international coverage
! Relevant innovations
• Building brand equity –“Dahil ang lakas mo saGlobe”
Drivers of Sustained Growth:Stronger brand image …

6
11
Launched last April 16 –P 0.90 to all networks
(lowest rate in the market today)
Drivers of Sustained Growth:… enabled by continuous enhancements in connectivity …
12
Drivers of Sustained Growth:… and relevant, forward-looking innovations
• 1st in High-Speed Data Packet Access (HSDPA or 3.5G) in Asia-Pacific – Launched last March 30 for corporate accounts
7
13
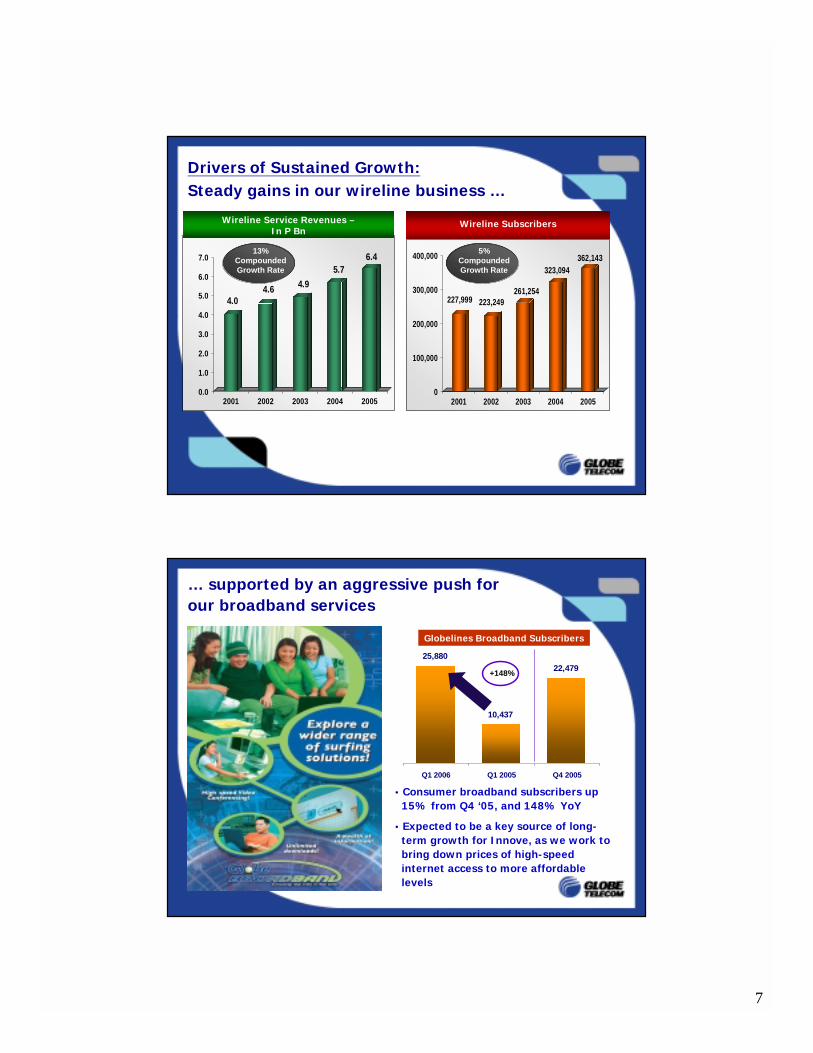
4.04.6 4.9
5.76.4
0.0
1.0
2.0
3.0
4.0
5.0
6.0
7.0
2001 2002 2003 2004 2005
227,999 223,249261,254
323,094362,143
0
100,000
200,000
300,000
400,000
2001 2002 2003 2004 2005
Drivers of Sustained Growth:Steady gains in our wireline business …
Wireline Service Revenues –In P Bn
Wireline Subscribers
13% Compounded Growth Rate
5% Compounded Growth Rate
14
+148%
… supported by an aggressive push for our broadband services
25,880
10,437
22,479
Q1 2006 Q1 2005 Q4 2005
Globelines Broadband Subscribers
• Consumer broadband subscribers up 15% from Q4 ‘05, and 148% YoY
• Expected to be a key source of long-term growth for Innove, as we work to bring down prices of high-speed internet access to more affordable levels
8
15
29.8
20.5
15.8
21.2
14.8
27%
52%
40%
106%
33%
0
5
10
15
20
25
30
35
2001 2002 2003 2004 2005
0%
20%
40%
60%
80%
100%
120%
Capex % of sales
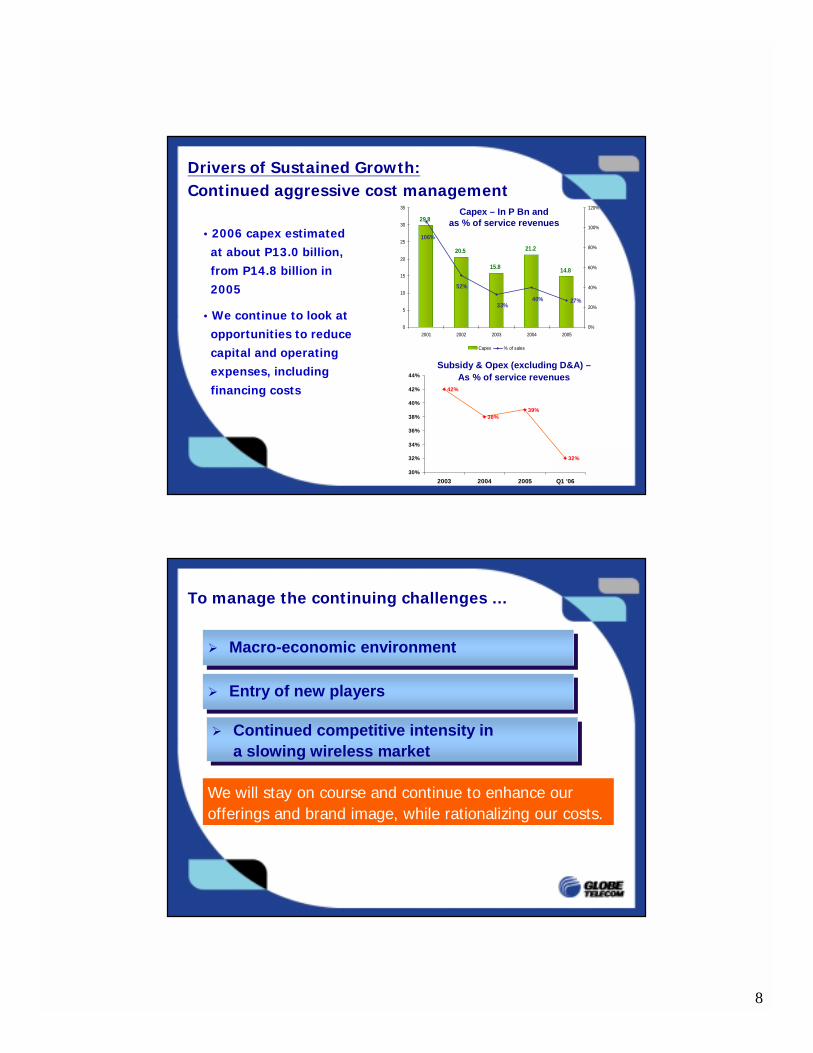
Capex – In P Bn and as % of service revenues
• 2006 capex estimated at about P13.0 billion, from P14.8 billion in 2005
• We continue to look at opportunities to reduce capital and operating expenses, including financing costs
Drivers of Sustained Growth:Continued aggressive cost management
42%
38%39%
32%
30%
32%
34%
36%
38%
40%
42%
44%
2003 2004 2005 Q1 '06
Subsidy & Opex (excluding D&A) –As % of service revenues
16
! Entry of new players! Entry of new players
! Macro-economic environment! Macro-economic environment
! Continued competitive intensity in a slowing wireless market
! Continued competitive intensity in a slowing wireless market
To manage the continuing challenges …
We will stay on course and continue to enhance our offerings and brand image, while rationalizing our costs.
9
17
Financial Performance
18
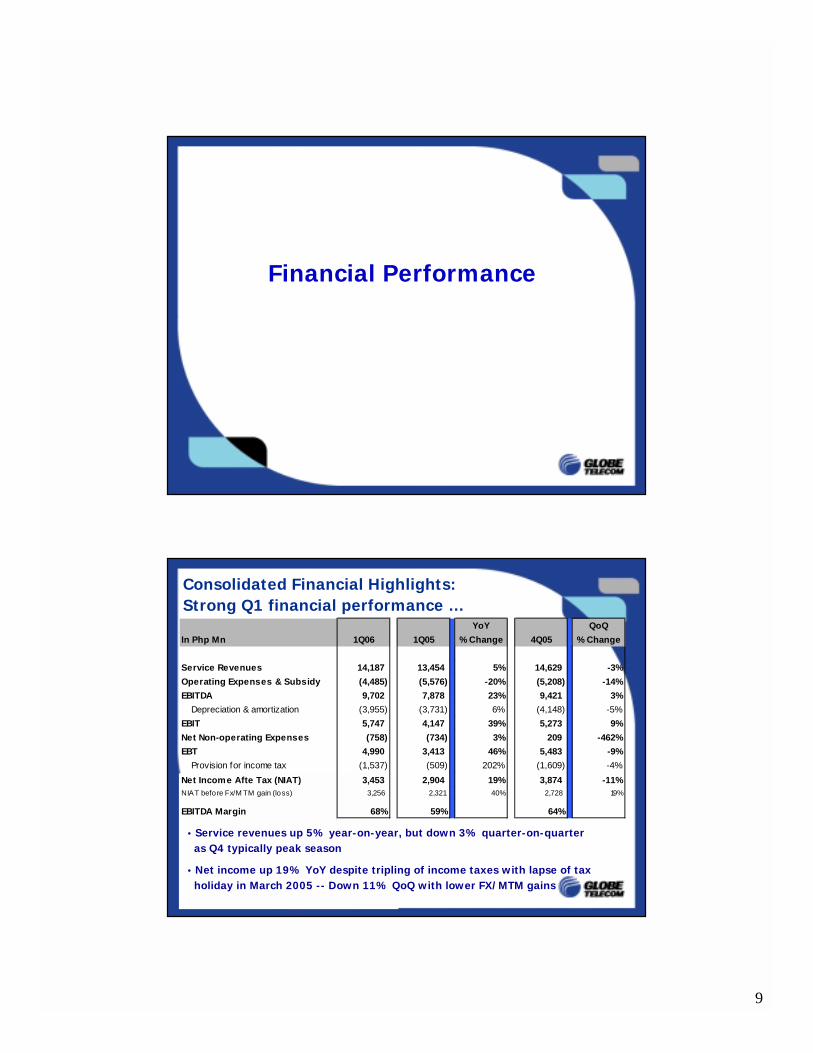
Consolidated Financial Highlights: Strong Q1 financial performance …
• Service revenues up 5% year-on-year, but down 3% quarter-on-quarter as Q4 typically peak season
• Net income up 19% YoY despite tripling of income taxes with lapse of tax holiday in March 2005 -- Down 11% QoQ with lower FX/MTM gains
YoY QoQ
In Php Mn 1Q06 1Q05 % Change 4Q05 % Change
Service Revenues 14,187 13,454 5% 14,629 -3%
Operating Expenses & Subsidy (4,485) (5,576) -20% (5,208) -14%
EBITDA 9,702 7,878 23% 9,421 3%
Depreciation & amortization (3,955) (3,731) 6% (4,148) -5%
EBIT 5,747 4,147 39% 5,273 9%
Net Non-operating Expenses (758) (734) 3% 209 -462%
EBT 4,990 3,413 46% 5,483 -9%
Provision for income tax (1,537) (509) 202% (1,609) -4%
Net Income Afte Tax (NIAT) 3,453 2,904 19% 3,874 -11%NIAT before Fx/M TM gain (loss) 3,256 2,321 40% 2,728 19%
EBITDA Margin 68% 59% 64%
10
19
-
1,000
2,000
3,000
4,000
5,000
6,000
7,000
8,000
9,000
10,000
2003 2004 2005 2006
9,702
-
1,000
2,000
3,000
4,000
5,000
6,000
2003 2004 2005 2006
5,747
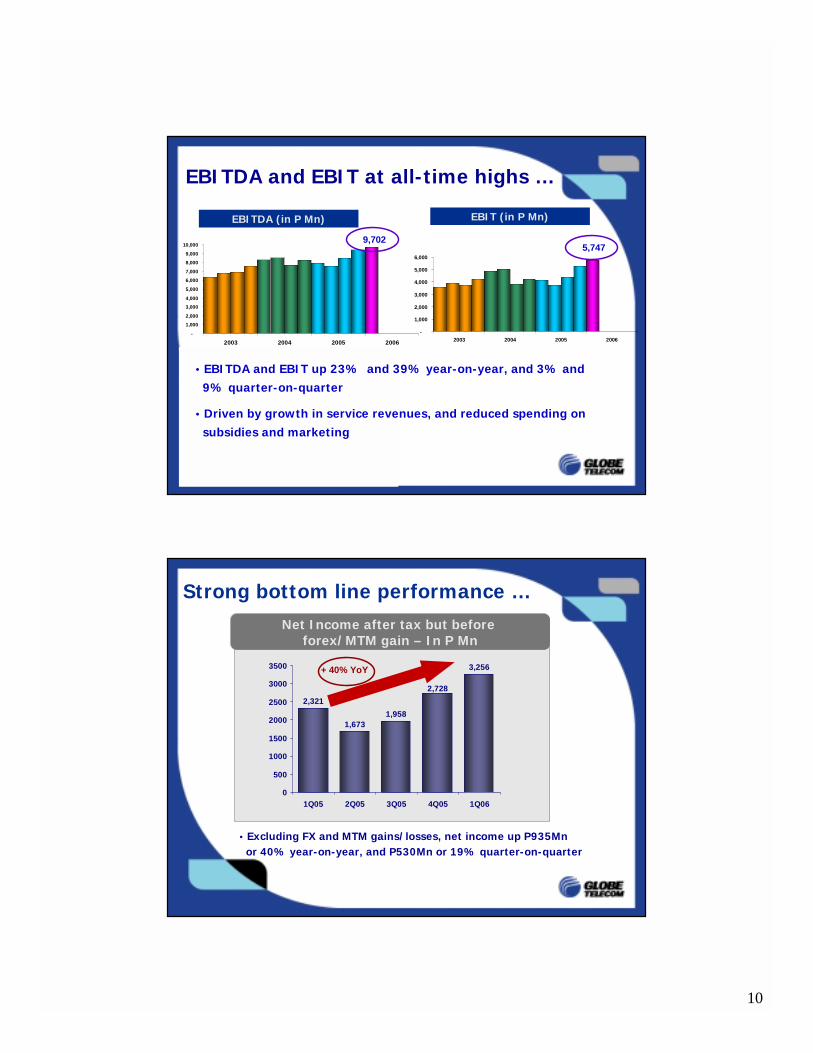
EBITDA and EBIT at all-time highs …
EBITDA (in P Mn) EBIT (in P Mn)
• EBITDA and EBIT up 23% and 39% year-on-year, and 3% and 9% quarter-on-quarter
• Driven by growth in service revenues, and reduced spending on subsidies and marketing
20
2,321
1,6731,958
3,256
2,728
0
500
1000
1500
2000
2500
3000
3500
1Q05 2Q05 3Q05 4Q05 1Q06
Net Income after tax but before forex/MTM gain – In P Mn
Strong bottom line performance …
• Excluding FX and MTM gains/losses, net income up P935Mn or 40% year-on-year, and P530Mn or 19% quarter-on-quarter
+ 40% YoY
11
21
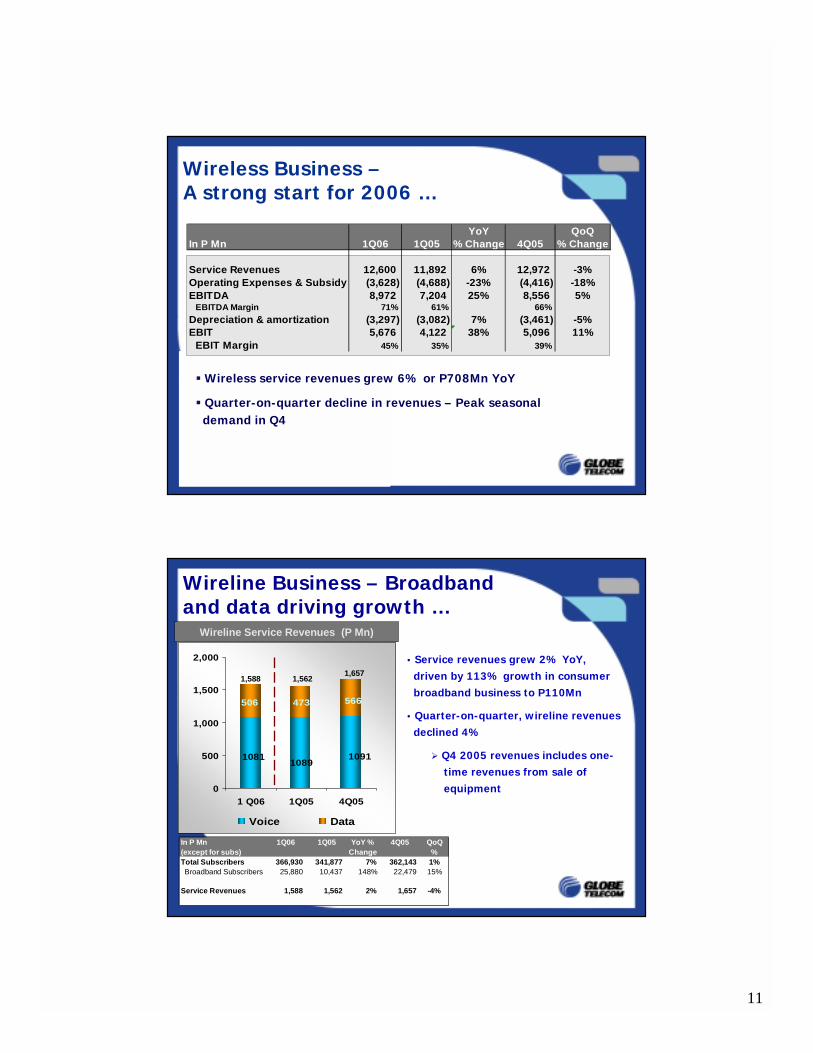
Wireless Business –A strong start for 2006 …
" Wireless service revenues grew 6% or P708Mn YoY
" Quarter-on-quarter decline in revenues – Peak seasonal demand in Q4
YoY QoQIn P Mn 1Q06 1Q05 % Change 4Q05 % Change
Service Revenues 12,600 11,892 6% 12,972 -3%Operating Expenses & Subsidy (3,628) (4,688) -23% (4,416) -18%EBITDA 8,972 7,204 25% 8,556 5%
EBITDA Margin 71% 61% 66%
Depreciation & amortization (3,297) (3,082) 7% (3,461) -5%EBIT 5,676 4,122 38% 5,096 11%
EBIT Margin 45% 35% 39%
22
10811089
1091
566473506
0
500
1,000
1,500
2,000
1 Q06 1Q05 4Q05
Voice Data
Wireline Service Revenues (P Mn)
Wireline Business – Broadband and data driving growth …
In P Mn 1Q06 1Q05 4Q05(except for subs)Total Subscribers 366,930 341,877 7% 362,143 1% Broadband Subscribers 25,880 10,437 148% 22,479 15%
Service Revenues 1,588 1,562 2% 1,657 -4%
YoY % Change
QoQ %
1,5881,657
1,562
• Service revenues grew 2% YoY, driven by 113% growth in consumer broadband business to P110Mn
• Quarter-on-quarter, wireline revenues declined 4%
! Q4 2005 revenues includes one-time revenues from sale of equipment
12
23
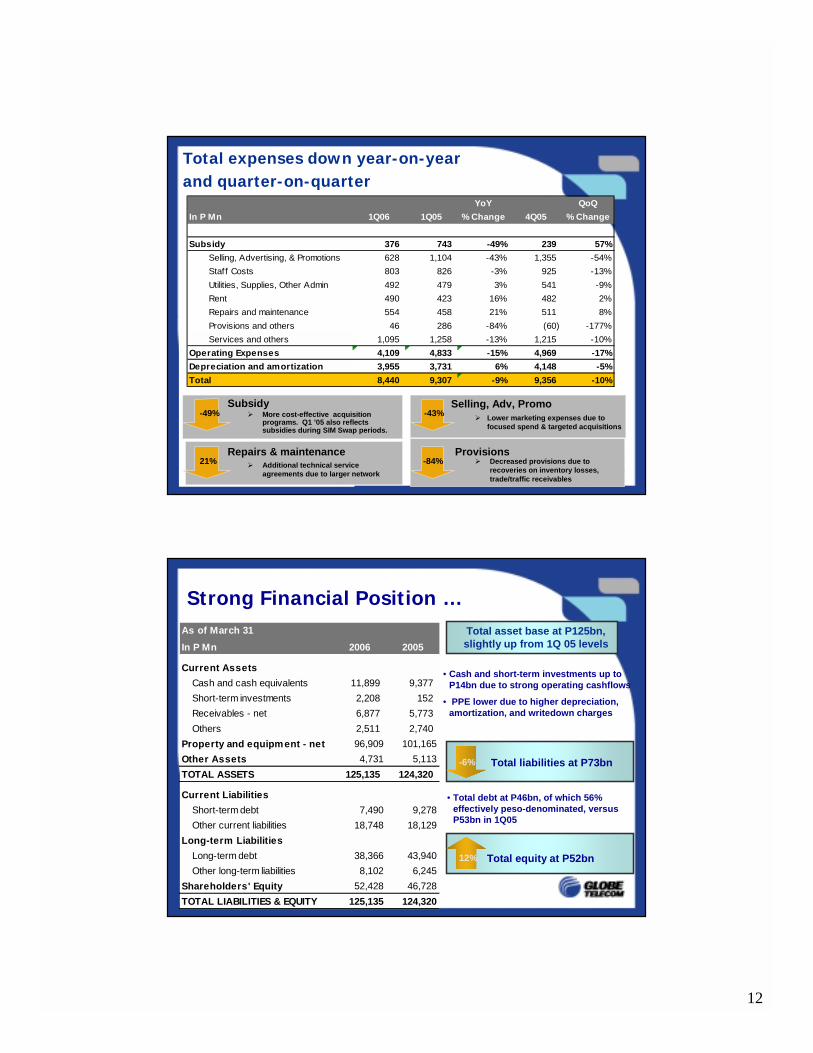
Total expenses down year-on-yearand quarter-on-quarter
Selling, Adv, PromoSubsidy
Repairs & maintenance21%
Provisions
YoY QoQ
In P Mn 1Q06 1Q05 % Change 4Q05 % Change
Subsidy 376 743 -49% 239 57%
Selling, Advertising, & Promotions 628 1,104 -43% 1,355 -54%
Staff Costs 803 826 -3% 925 -13%
Utilities, Supplies, Other Admin 492 479 3% 541 -9%
Rent 490 423 16% 482 2%
Repairs and maintenance 554 458 21% 511 8%
Provisions and others 46 286 -84% (60) -177%
Services and others 1,095 1,258 -13% 1,215 -10%
Operating Expenses 4,109 4,833 -15% 4,969 -17%
Depreciation and amortization 3,955 3,731 6% 4,148 -5%
Total 8,440 9,307 -9% 9,356 -10%
! More cost-effective acquisition programs. Q1 ’05 also reflects subsidies during SIM Swap periods.
! Lower marketing expenses due to focused spend & targeted acquisitions
! Additional technical service agreements due to larger network
! Decreased provisions due to recoveries on inventory losses, trade/traffic receivables
-49% -43%
-84%21%
24
Total asset base at P125bn, slightly up from 1Q 05 levels
• Cash and short-term investments up to P14bn due to strong operating cashflows
• PPE lower due to higher depreciation, amortization, and writedown charges
1Q05
Strong Financial Position …
• Total debt at P46bn, of which 56% effectively peso-denominated, versus P53bn in 1Q05
Total liabilities at P73bn-6%
Total equity at P52bn
As of March 31
In P Mn 2006 2005
Current Assets
Cash and cash equivalents 11,899 9,377
Short-term investments 2,208 152
Receivables - net 6,877 5,773
Others 2,511 2,740
Property and equipment - net 96,909 101,165
Other Assets 4,731 5,113
TOTAL ASSETS 125,135 124,320
Current Liabilities
Short-term debt 7,490 9,278
Other current liabilities 18,748 18,129
Long-term Liabilities
Long-term debt 38,366 43,940
Other long-term liabilities 8,102 6,245
Shareholders' Equity 52,428 46,728
TOTAL LIABILITIES & EQUITY 125,135 124,320
12%
13
25
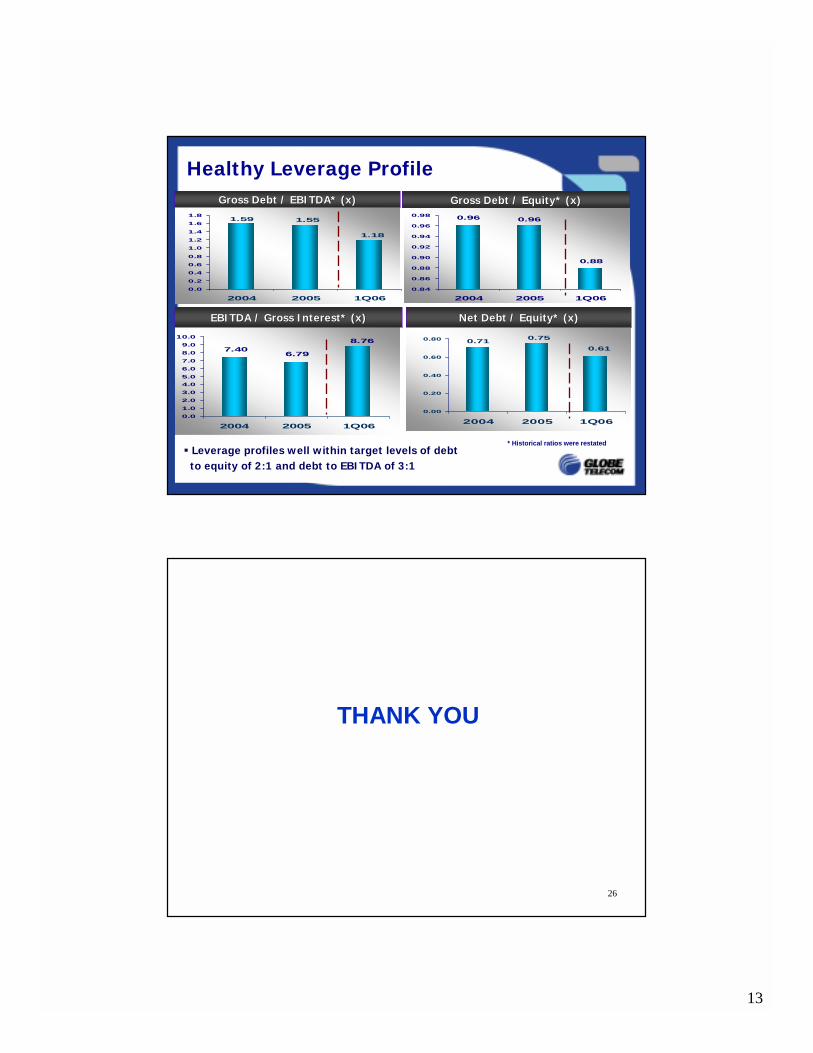
0.71 0.75
0.61
0.00
0.20
0.40
0.60
0.80
2004 2005 1Q06
0.88
0.960.96
0.84
0.86
0.88
0.90
0.92
0.94
0.96
0.98
2004 2005 1Q06
8.76
6.797.40
0.0
1.0
2.0
3.0
4.0
5.0
6.0
7.0
8.0
9.0
10.0
2004 2005 1Q06
1.18
1.551.59
0.0
0.2
0.4
0.6
0.8
1.0
1.2
1.4
1.6
1.8
2004 2005 1Q06
Healthy Leverage ProfileGross Debt / EBITDA* (x)Gross Debt / EBITDA* (x) Gross Debt / Equity* (x)Gross Debt / Equity* (x)
EBITDA / Gross Interest* (x)EBITDA / Gross Interest* (x) Net Debt / Equity* (x)Net Debt / Equity* (x)
* Historical ratios were restated" Leverage profiles well within target levels of debt
to equity of 2:1 and debt to EBITDA of 3:1
26
THANK YOU