GLOBAL VALUE CHAIN DEVELOPMENT REPORT 2019 …
196
TECHNOLOGICAL INNOVATION, SUPPLY CHAIN TRADE, AND WORKERS IN A GLOBALIZED WORLD GLOBAL VALUE CHAIN DEVELOPMENT REPORT 2019
Transcript of GLOBAL VALUE CHAIN DEVELOPMENT REPORT 2019 …

TECHNOLOGICAL INNOVATION, SUPPLY CHAIN TRADE, AND WORKERS IN A GLOBALIZED WORLD
GLO BAL VALUE CH A I N DEVELO PME NT R E P O R T 2019

© 2019 World Trade Organization
World Trade Organization Centre William RappardRue de Lausanne 1541211 Geneva 2SwitzerlandTelephone: +41 (0)22 739 51 11Internet: www.wto.org
This work is a product of the World Trade Organization, the Institute of Developing Economies (IDE-JETRO), the Organisation for Economic Co-operation and Development, the Research Center of Global Value Chains headquartered at the University of International Business and Economics (RCGVC-UIBE), the World Bank Group, and the China Development Research Foundation. It is based on joint research efforts to better understand the ongoing development and evolution of global value chains and their implications for economic development. The findings, interpretations, and conclusions expressed in this work are those of the authors and do not necessarily reflect the views of the co-publishing partners, their Boards of Executive Directors, or the governments they represent.
The co-publishing partners do not guarantee the accuracy of the data included in this work. The boundaries, colors, denominations, and other information shown on any map in this work do not imply any judgment on the part of the co-publishing partners concerning the legal status of any territory or the endorsement or acceptance of such boundaries.
Rights and PermissionsThe material in this work is subject to copyright. Because the co-publishing partners encourage dissemination of their knowledge, this work may be reproduced, in whole or in part, for non-commercial purposes as long as full attribution to this work is given.
Any queries on rights and licenses, including subsidiary rights, should be addressed to World Bank Publications, The World Bank Group, 1818 H Street NW, Washington, DC 20433, USA; fax: 202–522–2625; e-mail: [email protected].
WTO print ISBN 978-92-870-4771-7WTO web ISBN 978-92-870-4968-1
This publication uses US spelling. All mentions of dollars refer to US dollars, unless otherwise indicated. The term “billion” refers to a thou-sand million.
The Research Center of Global Value Chains acknowledges the financial support from the Bill & Melinda Gates Foundation.

iii
Contents
Foreword by Michael Spence . . . . . . . . . . . . . . . . . . . . . . . . . . . . . . . . . . . . . . . . . . . . . . . . . . . . vCo-publishing partners . . . . . . . . . . . . . . . . . . . . . . . . . . . . . . . . . . . . . . . . . . . . . . . . . . . . . . . viContributors . . . . . . . . . . . . . . . . . . . . . . . . . . . . . . . . . . . . . . . . . . . . . . . . . . . . . . . . . . . . . viiAcknowledgements . . . . . . . . . . . . . . . . . . . . . . . . . . . . . . . . . . . . . . . . . . . . . . . . . . . . . . . . viiiAbbreviations and acronyms . . . . . . . . . . . . . . . . . . . . . . . . . . . . . . . . . . . . . . . . . . . . . . . . . . . . ix
Key messages x
Executive summary 1David Dollar
Chapter 1 Recent patterns of global production and GVC participation 9Xin Li (Beijing Normal University), Bo Meng (IDE-JETRO), and Zhi Wang (RCGVC-UIBE)
Chapter 2 Trade, value chains and labor markets in advanced economies 45Marc Bacchetta (WTO) and Victor Stolzenburg (WTO)
Chapter 3 Global value chains and employment in developing economies 63Claire H. Hollweg (World Bank Group)
Chapter 4 Technological progress, diffusion, and opportunities for developing countries: Lessons from China 83Satoshi Inomata (IDE-JETRO) and Daria Taglioni (World Bank Group)
Chapter 5 Understanding Supply Chain 4 0 and its potential impact on global value chains 103Michael J. Ferrantino (World Bank Group) and Emine Elcin Koten (World Bank Group)

iv • Technological innovation, supply chain trade, and workers in a globalized world
Chapter 6 The digital economy, GVCs and SMEs 121Emmanuelle Ganne (WTO) and Kathryn Lundquist (WTO)
Chapter 7 Should high domestic value added in exports be an objective of policy? 141David Dollar (Brookings Institution), Bilal Khan (RCGVC-UIBE), and Jiansuo Pei (SITE-UIBE)
Chapter 8 Improving the accounting frameworks for analyses of global value chains 155Nadim Ahmad (OECD)
Appendix 1 Chapter Authors’ Conference: Final programme 179
Appendix 2 Technological Innovation, Supply Chain Trade, and Workers in a Globalized World: Global Value Chain Development Report 2019 Background Paper Conference 181

v
Foreword
T here are different ways to analyze the global economy. One is to view it through the lens of growth and struc-tural change in individual economies, developed and developing. A second is to use the lens of global value
chains (GVCs), the complex network structure of flows of goods, services, capital and technology across national borders. Both are useful and they are complementary to one another.
The 2019 edition of the GVC Development Report is enor-mously valuable, in part because it captures the underlying tech-nological and economic forces that are transforming the patterns of global interconnectedness.
The report notes that there are two megatrends in process. One is the growth of developing countries, the expansion of the middle classes in them, and the shift in the share of global purchas-ing power toward the developing economies. By itself this would produce major shifts in the characteristics of GVCs. Regional trade rises as a share, especially in Asia. More production now goes to rapidly growing domestic markets in developing countries instead of being exported outside the region. Trade is shifting from a stark version of comparative advantage based on differential labor costs and labor arbitrage, toward something that more closely resembles the intra-industry model of trade among developed economies based on product and technological differentiation. Of course, that process is far from complete, and there remain ear-ly-stage, and relatively low-income developing countries for which the growth models will continue to depend on accessing global demand via labor-intensive, process-oriented manufacturing.
The second megatrend is the digitization of the underpinnings of entire economies and, by implication, GVCs and the global economy. This too is a process that is underway and one that has much further to go. It is difficult if not impossible to accurately pre-dict the endpoint, if there is one. But there are important insights that the second GVC report highlights.
One clear message is that as economies move to being built in part on digital foundations, trade, GVCs and digital technology cannot be separated and dealt with as independent trends and forces.
For early-stage developing countries, automation will at some point displace the labor-intensive technologies that underpinned the earlier Asian growth stories. That shift will occur differentially by sector, with textiles and more generally the sewing trades being the least vulnerable in the short run. The message is two-fold: don’t give up on the traditional growth model but move rap-idly to expand internet capability and the digital underpinnings and infrastructure of the economy.
The mobile-internet- and platform-centered open ecosystems, along with mobile payment systems and enabled financial services, have the potential to support inclusive growth patterns and expand the channels, opportunities, and accessible markets for SMEs. Data from China’s domestic economy experience supports these trends. Exploiting the international potential of these platforms to expand trade and access for SMEs requires investment and infrastructure in developing countries, but also new trade regimes that increase the openness of the ecosystems. In other words, the potential to sup-port growth and employment in SMEs via access to global markets on digital platforms is as yet largely unexploited.
The report supports and adds to a broad range of studies that suggest that the combination of trade and various aspects of digital transformation has contributed to job and income polarization, and that vigorous policies (by government and business) are required to restore more inclusiveness to the observed growth patterns. This is especially true in developed economies. Key policies are those that support the workforce in transitions as a growing range of tasks are automated and jobs shift toward a mix of tasks that are complemen-tary to the machines.
In developing countries, especially those in the middle-income category, while the pressures on the structure of jobs and employ-ment are similar to developed economies, the net impact of dig-ital technology appears to have been positive for growth and for employment.
There is an important caution in the report. The long-run goal of development is of course to increase productivity, employment and incomes. But in the context of GVCs, attempts to artificially increase the domestic value-added content of exports, ahead of the technological deepening of the economy, are likely to be counterproductive.
At a more macro level, while trade continues to grow, especially in services (where there remain challenging measurement prob-lems) the declines in trade relative to global GDP and the rising share of intraregional trade are understood to be largely the natural consequences of economic development and the early stages of the digital transformation of economies, and not mainly the result of trade frictions and resistance to globalization engendered by the adverse distributional features of growth patterns.
The second GVC report is carefully researched and deep in insights. It does an admirable job of capturing the complexity of a global economy in rapid transition, and especially of bringing into focus the major forces and trends and their impacts.
Michael Spence Nobel Laureate in Economics

vi • Technological innovation, supply chain trade, and workers in a globalized world
Co-publishing partners
T his work has been co-published by the World Trade Organization, the Institute of Developing Economies (IDE-JETRO), the Organisation for Economic Co-oper-ation and Development, the Research Center of Global
Value Chains headquartered at the University of International Business and Economics (RCGVC-UIBE), the World Bank Group, and the China Development Research Foundation.
The World Trade Organization (WTO) is an international organization that deals with the global rules of trade between nations. The WTO administers agreements, negotiated and signed by its members, which provide the legal ground rules for international commerce. Their purpose is to help trade flow as freely as possible for the economic development and the welfare of its members’ citizens. The WTO is serviced by a secretariat which provides expert, impartial and independent support to member governments, including research, analysis and statistical information related to the role and developments of trade in the global economy.
IDE-JETRO is a government-affiliated research institute that conducts basic and comprehensive research on economics, politics, and social issues in developing countries. Through its research, IDE-JETRO contributes knowledge of developing economies and better understanding of the regions to the gov-ernment and public.
The Organisation for Economic Co-operation and Devel-opment (OECD) is an international and inter-governmental organization comprising the world’s main industrialized market
economies whose mission is to promote policies that will improve the economic and social well-being of people around the world: “Better Policies for Better Lives”. The OECD does this by provid-ing a forum for governments to share experiences and by seek-ing solutions to common problems.
The Research Center of Global Value Chains (RCGVC) is a global academic think tank headquartered at the University of International Business and Economics, focusing on basic and interdisciplinary research activities on the development of global value chains (GVCs) and its implication on global economies.
The World Bank is an international development institution established by Articles of Agreement adopted by its member countries. The World Bank’s overarching mission is to reduce poverty, improve living conditions, and promote sustainable and comprehensive development in its developing member coun-tries. It has established two ambitious goals to anchor its mis-sion: end extreme poverty within a generation and boost shared prosperity. The World Bank will achieve these goals by providing loans, concessional financing, technical assistance, and knowl-edge sharing services to its developing member countries and through partnerships with other organizations.
The China Development Research Foundation (CDRF) is a public foundation initiated by the Development Research Center of the State Council (DRC). Its mission is to advance good gover-nance and public policy to promote economic development and social progress.

vii
Contributors
Co-editors
David Dollar Senior Fellow, China Center, Brookings Institution
Emmanuelle Ganne Senior Analyst, World Trade Organization
Victor Stolzenburg Research Economist, World Trade Organization
Zhi Wang Professor and Director, Research Center for Global Value Chains, University of International Business and Economics (RCGVC-UIBE); Research Faculty and Senior Policy Fellow, Schar School of Policy and Government, George Mason University
Other contributors
Nadim Ahmad Head of Trade and Competitiveness Statistics Division, Organisation for Economic Co-operation and Development
Marc Bacchetta Counsellor, World Trade Organization
Michael J Ferrantino Lead Economist for Trade Policy, World Bank Group
Claire H Hollweg Senior Economist, World Bank Group
Satoshi Inomata Chief Senior Researcher, Institute of Developing Economies – Japan External Trade Organization
Bilal M Khan Assistant Professor, Research Center for Global Value Chains, University of International Business and Economics
Emine Elcin Koten Consultant, World Bank Group
Xin Li Professor, School of Statistics, Beijing Normal University
Kathryn Lundquist Statistician, World Trade Organization
Bo Meng Senior Overseas Research Fellow (New York), Institute of Developing Economies - Japan External Trade Organization
Jiansuo Pei Associate Professor, School of International Trade and Economics, University of International Business and Economics
Daria Taglioni Senior Economist, World Bank Group

viii • Technological innovation, supply chain trade, and workers in a globalized world
Acknowledgments
T he Global Value Chains Development Report is a joint publication of the World Trade Organization (WTO), the Institute of Developing Economies (IDE–JETRO), the Organisation for Economic Co-operation and
Development (OECD), the Research Center of Global Value Chains (RCGVC-UIBE), the World Bank Group, and the China Development Research Foundation, based on joint research efforts to better understand the ongoing development and evo-lution of global value chains and their implications for economic development.
This second report draws contributions from 23 background papers; 16 of them were presented and discussed at the confer-ence “Technological Innovation, Supply Chain Trade, and Work-ers in a Globalized World” in Beijing during March 22–23, 2018, organized by the RCGVC and the China Development Research Foundation. Drafts of the eight chapters of the report were pre-sented and discussed at the second Authors’ Conference in Geneva on October 8, 2018, organized by the WTO. The editors thank the authors of background papers and individual chap-ters and the discussants and participants in the two conferences for insightful comments and suggestions that helped draft and improve the chapters (see appendices 1 and 2 for the programs). Special thanks go to our external reviewers: Jonathan Eaton
(Penn State University), Gary Hufbauer (Peterson Institute for International Economics), Alonso de Gortari (Princeton and Dart-mouth), Kalina Manova (University College London), Maurice D Kugler (George Mason University), Marcel Timmer (the University of Groningen), and Felix Tintelnot (University of Chicago). The editors are grateful to Michael Spence for his keynote speech at the background paper conference in Beijing and his invalu-able expertise and advice on the overall narrative of the report. The editors also thank Robert Koopman, chief economist of the World Trade Organization and Caroline Freund, director of the World Bank Group’s Trade, Regional Integration and Investment Climate, for their guidance and support during the joint research process as well as research and data contributions from the Asian Development Bank.
The editors are grateful to William Shaw, who copy-edited the report, and to Anthony Martin, Head of WTO Publications, and Helen Swain, WTO Publications Editor, who were responsible for the production of the report.
The RCGVC would like to acknowledge the financial support from the Bill & Melinda Gates Foundation and National Science Foundation of China (grant No. G0304-71733002).
The report’s co-editors are David Dollar, Emmanuelle Ganne, Victor Stolzenburg and Zhi Wang.

ix
Abbreviations and acronyms
ADB Asian Development Bank AI artificial intelligenceASEAN Association of Southeast Asian NationsB2B business-to-businessB2C business-to-consumer CDRF China Development Research Foundation CEO Chief Executive OfficerCIF ost, insurance and freightCMI customer-managed inventoryDRC Development Research Center of the State
Council DVA domestic value-addedDVAR domestic value-added ratioECU electronic control unitEDI electronic data interchangeESUT extended supply-use tableFATS foreign affiliates statisticsFDI foreign direct investmentF O B free-on-boardFTZ foreign trade zoneGDP gross domestic productGM global manufacturingGSM global system for mobile communication GTH Global Trade HelpdeskGVC global value chainHIC high-income countryICIO inter-country input-outputICT information and communication technologyIDB Inter-American Development Bank
IDE–JETRO Institute of Developing Economies IMF International Monetary FundIoT Internet of ThingsIPR intellectual property rightsITC International Trade CentreLACEX World Bank’s Labor Content of ExportsLDC least-developed countryLMIC low/medium-income countryMFN most-favored nationMNE multinational enterpriseOECD Organisation for Economic Co-operation
and Development R&D research and developmentRCGVC Research Center of Global Value Chains RFID radio frequency identification SME small and medium-sized enterpriseSNA System of National AccountsSTEM science, technology, engineering, and
mathematicsSUT supply and use tableTFP total factor productivityTiVA trade in value-addedUIBE University of International Business and EconomicsUNCTAD United Nations Conference on Trade
and DevelopmentVMI vendor-managed inventoryWB World BankWIOD World Input-Output TablesWTO World Trade Organization

x • Technological innovation, supply chain trade, and workers in a globalized world
Key messages
• The growth of global value chains has slowed since the Global Financial Crisis of 2008-09 but not stopped. In fact, complex global value chains (GVCs) grew faster than GDP in 2017.
• Factoring in GVCs when studying the impact of trade on labor markets reveals that trade has not been a significant contributor to declines in manufacturing jobs in advanced economies, and that job gains in services have offset job losses in manufacturing.
• The emergence of GVCs has offered developing countries opportunities to integrate into the global economy by deliver-ing jobs and higher income.
• The impacts of technological change and increased produc-tivity on employment linked to GVCs have been offset by growing consumer demand, and in the short term, automa-tion will not dramatically reduce the attractiveness of low-wage destinations, especially for labor-intensive tasks that require human dexterity.
• The impact of new digital technologies on GVCs is uncertain: they may reduce the length of supply chains by encouraging
the re-shoring of manufacturing production, thus reducing opportunities for developing countries to participate in GVCs, or they may strengthen GVCs by reducing coordination and matching costs between buyers and suppliers.
• Despite the aggregate gains they create, trade, automation and digital technologies can cause disruption and widen exist-ing disparities across regions and individuals. This calls for broad and comprehensive adjustment policies.
• While small and medium-sized enterprises (SMEs) are under-represented in GVCs, the digital economy provides new opportunities for SMEs to play a more active role.
• Open and transparent policies tend to promote GVC-led growth more than import-reducing policies targeted at raising the share of domestic value-added in exports.
• Using value-added trade rather than gross trade statistics is crucial to understanding GVCs and their impact on jobs. Efforts to continue to improve the quality of these estimates are strongly encouraged.

1
Executive summaryDAVID DOLLAR
More than two-thirds of world trade occurs through global value chains (GVCs), in which production crosses at least one border, and typically many borders, before final assembly. The phenomenal
growth in GVC-related trade has translated into significant eco-nomic growth in many countries across the globe over the last two decades, fueled by reductions in transportation and com-munication costs and declining trade barriers. But, at the same time, it has contributed to distributional effects that mean that the benefits of trade have not always accrued to all, which has, at least in part, been a driver in the backlash against globalization and the rise of protectionism and threats to global and regional trade agreements. In addition, new technological developments such as robotics, big data, and the Internet of Things (IoT) are beginning to reshape and further transform GVCs. This second GVC development report takes stock of the recent evolution of GVC trade in light of these developments.
Update on trends in GVCs
The growth of global value chains has slowed since the global financial crisis. A country’s GDP (value added) can be decom-posed into purely domestic, traditional trade, in which a product is made in one country and consumed in another, simple value chain trade, in which a good made in one country crosses one border and is used in production in the partner country before consumption there, and complex value chain trade, in which production crosses multiple borders. From 2000-2007, GVCs, especially complex ones, were expanding at a faster rate than
other components of GDP. During the global financial crisis there was naturally some retrenchment of GVCs, followed by quick recovery (2010-2011) but since then, with the exception of 2017, growth has, in the main, slowed. In 2017 expansion of complex GVCs was faster than GDP growth, but it is too early to say if this is a new trend or just a one-year blip.
Concerning which sectors are particularly amenable to GVCs, over a long period we found that, the higher the technol-ogy (knowledge) intensity of a sector, the more significant the increase of complex GVC activities. Thus, GVC linkages are espe-cially important for high-tech sectors and it is in these areas that we see highly complex value chains involving many countries.
We also distinguish between intra-regional GVC activities and inter-regional ones. Activities within North American economies would be an example of the former, whereas China’s growing contribution to value chains centered on the U.S. or Germany would be examples of the latter. Between 2000 and 2017, the weight of intra-regional GVC activities in “Factory Asia” came to exceed that of “Factory North America”. In contrast, the share of intra-regional GVC activities declined relatively in both Europe and North America and their share of inter-regional production sharing activities increased, especially their GVC linkages with “Factory Asia”, reflecting in large part increased inter-connect-edness with China. China is increasingly playing an important role as both a supply and demand hub in traditional trade and simple GVC networks, although the U.S. and Germany are still the most important hubs in complex GVC networks.
GVC analysis also provides some insight into bilateral trade balances and how they should be interpreted. In a world in which most trade consists of parts and components, bilateral trade

2 • Technological innovation, supply chain trade, and workers in a globalized world
balances are significantly affected by the supply and demand of third countries; and, net imports are no longer a proper measure of the impact of an international trade shock on the domestic economy in the age of GVCs, compared to the time when final goods trade dominated. China happens to be at the end of many Asian value chains, taking sophisticated components from Japan, the Republic of Korea, and Chinese Taipei and assembling these into final products. Two-thirds of all intermediate imports of information and communication technology (ICT) products, coming from other countries in Factory Asia, but also with signif-icant contributions from Europe and North America, are used as inputs into Chinese exports. Indeed, the Chinese domestic value content of their exports of ICT products accounts for only around half of the total export value. As such, trade balances look very different in value-added terms. For example, the U.S. trade defi-cit in ICT products with China is roughly cut in half if the calcula-tion is made in value added terms.
Labor market effects of GVCs in developed countries
One of the main controversies of globalization is its effect on labor markets in both developed and developing economies. Across advanced economies, the real median wage has grown slowly over the past two decades and manufacturing employ-ment has been on the decline, while incomes of highly skilled workers and owners of capital have soared. There are of course many factors at work here, and not all are related to globaliza-tion, especially countries’ own domestic tax and transfer policies, but one additional factor has been big developing countries, especially China and Eastern European economies, opening up and joining the global economy.
A number of studies have concluded that, in particular, the impact of Chinese import competition on the U.S. labor market, especially after China joined the WTO, was a significant factor behind U.S. manufacturing employment dropping sharply after 2000. But these analyses have typically only provided a partial view of the overall impact on employment, by and large ignoring the reality of value chains. A full view requires that we account for the fact that the development of value chains results in churning across economies, as firms and countries specialize and create certain types of jobs while eliminating others. General equilib-rium analyses of the so-called “China shock” that take account of GVCs find that, for the U.S., trade was not a main contribu-tor to the loss of manufacturing jobs and has only minor aggre-gate employment effects. One important reason for this more nuanced effect is that while some industries contracted because of increased competition, others expanded thanks to the cost savings that GVC linkages provided, counterbalancing jobs lost in contracting industries. This is consistent with economic theory, which suggests that trade should not have a large net effect on employment.
That being said, the effects vary considerably across regions and individuals with different skill levels. Moving from the
nationwide and sectoral level to regional and individual outcomes reveals substantial heterogeneity in how aggregate effects map out. For instance, when local labor markets within countries are not sufficiently diversified, trade can widen regional disparities. Regions specialized in import-competing and upstream industries can fall behind, while areas with industries that export or benefit from cost savings due to cheaper imported inputs pull away.
Similarly, trade may work in the same direction as other drivers in contributing to labor market polarization. In particular, automa-tion has impacted jobs in the middle of the skills distribution, with remaining jobs concentrated at the high and low ends. Between 1999 and 2007, the years when China was reducing barriers and entering the WTO, nearly all advanced economies had increases in employment shares for high- and low-skilled jobs, and declines for middle-skill work (see Figure 1).
While trade and automation are making a country as a whole richer, there is a need for adjustment policies to ensure a more even distribution of these gains. This is especially the case as value chains magnify trade-induced changes in skill requirements and thereby raise the demand for worker flexibility and the need for training support. With regard to the optimal design of such policies, value chains make targeted or specific labor market interventions increasingly difficult. As input-output linkages cause trade shocks to spread more widely within economies, import competition is less and less limited in terms of industries, regions, or skill levels. As a result, it can become more difficult to identify the exact reason for individual displacement. Therefore, adjustment policies should not differentiate between the various reasons for worker displacement, such as automation or trade, and be less dependent on affected workers fulfilling certain
FIGURE 1 Percentage point changes in employment shares by skill level between 1995-2015Percent
High skillMiddle skillLow skill
-15
-10
-5
0
5
10
Southern Europe
Northern Europe
Western Europe
Total North America
Japan Central Europe
Source: OECD (2017). See chapter 2 for details.

Executive summary • 3
conditions. In addition, mobility and place-based policies could usefully complement general labor market policies to address regional divergence.
Labor market effects of GVCs in developing countries
The emergence of global value chains has offered developing countries new opportunities to integrate into the global econ-omy. This has fundamental impacts on where jobs go, who gets them, and what type of jobs they are. Significant parts of the developing world are deeply involved in GVCs. Their input has been initially concentrated in labor-intensive activities, which may have had important impacts on poverty in developing countries. For example, the boom in exports to the United States following the US–Vietnam Bilateral Trade Agreement of 2001 was partic-ularly beneficial to wages of unskilled workers, reduced the skill premium, and was a key driver of poverty reduction in Viet Nam because it was concentrated in unskilled, labor-intensive GVC sectors, most notably textiles.
There is a positive association between output growth and employment growth within GVC sectors, which increased over-all welfare as workers moved out of agriculture or the informal sector toward better paying, higher value-added jobs. Women who previously had difficulty accessing this type of wage work have filled many of these jobs. Employment and wage impacts can happen both directly within exporting firms as well as indi-rectly through these firms’ demand for goods and services from the domestic economy. The extent to which GVCs interact with domestic labor thus depends on the linkages of exporting firms to domestic, input-supplying firms. The firms that export directly account for only a small part of GVC jobs. In Viet Nam, most of the job creation results from backward linkages – that is, in
indirect exporting firms that supply inputs to the direct exporters (see Figure 2).
The relationship between GVC integration and level of employment though is not necessarily positive in all contexts. Imports of goods and services (backward GVC participation) matter as much as exports of intermediates (forward GVC partici-pation) to be successful in GVCs, where opening up to imports is often a pre-condition to successfully export. However, there may be import-competing effects in labor markets.
Evidence as well as intuition suggests that GVC participation will have other distributional implications. Greater participation of developing countries in global trade is expected to integrate not only markets for products, services, finance and technology, but also, directly and indirectly, markets for labor. The hallmark of globalization is big developing countries opening up and join-ing global trade. In general, such economies are abundant in unskilled labor and scarce in skilled labor and capital relative to global averages. The factor-endowment theory of trade predicts that trade will reduce returns to unskilled labor in advanced econ-omies while raising returns to capital and skilled labor. This trend has generally been observed. But the opposite trend should occur in developing countries that open up: wages of unskilled workers, clearly the most abundant factor in many developing countries, should rise faster than other factor rewards. This has not happened in most developing countries; rather, employment creation and wage gains have been biased towards more skilled workers. GVC expansion in developing countries is associated with higher relative demand for skilled workers. Characteristics of GVCs themselves, by supporting more complex industrial organization, as well as services inputs that are complementary to value chains, can be skill-biased.
Automation may be threatening GVC jobs in developing countries in the long term, where the routine tasks more suscep-tible to automation are increasingly performed. Technological
FIGURE 2 Many jobs in Viet Nam are tied to exports, directly and indirectly
0
5000
10000
15000
20000
25000
1989 1996 2000 2007 2012Year
Total JOBX
Direct JOBX
Indirect JOBX 0 2000 4000 6000 8000 10000 12000
Public administration, activities of party and membership organizations and defence
Construction
Electricity, gas and water supply
Other services activities
Real estate, renting and business activities; scientific activities and technology
Financial intermediation
Education and training; health and social work; recreational, cultural and sporting activities
Transport, storage and communications
Mining
Hotels and restaurants
Trade
Agriculture, forestry and fishery
Manufacturing
Direct JOBX Indirect JOBX
Source: Hollweg (2017). See chapter 3 for details.

4 • Technological innovation, supply chain trade, and workers in a globalized world
advancements that largely get diffused through global value chains are affecting how GVCs support jobs in developing coun-tries. Evidence suggests that changes in efficiency in GVCs has negative impacts on employment linked to countries’ participa-tion in the global production of products, all else equal. Tech-nological innovation has also lowered the demand for low-skilled workers relatively more than compared to high-skilled workers. Nevertheless, the adverse effects of changing production tech-nologies and efficiencies on employment have been offset by increased consumer demand, whereby the domestic consump-tion expenditures in large emerging economies such as China and India will generate new demand for labor for the global economy
These distributional consequences of trade and other forces are a principal concern to policymakers. Policies also play an important role in mediating the relationship between GVCs and employment in developing countries. These include policies that support (i) participation of developing countries in GVCs, (ii) fos-tering positive spillovers from GVC participation, (iii) upgrading to higher value-added tasks within GVCs, and (iv) mediating neg-ative effects from winners, such as inequality.
Technological progress, diffusion, and opportunities for developing countries
The nature of technology used in products plays a major role in determining the governance structure of value chains and the benefits of participation for developing countries. Standardization through breaking production into modules with a high degree of functional autonomy (limited mutual interference between mod-ules) can dramatically reduce the amount of R&D, learning by doing, and the number of complementary skills needed to pro-duce a good. This greatly increases opportunities for developing country firms to participate in formerly capital-intensive industries through reducing entry costs into global value chains.
However, widespread access to standardized products with little ability to modify technical features can lead to an exces-sive supply of homogeneous products in a local market, resulting in intense price competition and limited technology transfer. By contrast, technology that facilitates scope for product modifica-tion and greater interaction with lead manufacturers can help boost technology transfer and product upgrading by develop-ing country firms. Chapter 4 illustrates this interaction between changes in technology and opportunities for developing coun-tries through developments in the automotive and cell phone industries in China.
The chapter argues that policies for helping domestically owned firms to become technologically standalone – what some might refer to as “techno-nationalism” – do not necessarily deliver the expected results in terms of upgrading. The world’s most powerful technology companies, both from emerging and advanced countries, work with global suppliers and even with competitors in “open innovation” environments. Hence, the advice to policymakers seeking to upgrade toward the global technology frontier is to prioritize measures that encourage
firms to be full partners in global technology ecosystems and to pursue open source innovation solutions.
The question that now remains is whether firms from other countries, especially in less/least-developed regions, can repli-cate the positive experience of leveraging platforms by Chinese firms as demonstrated in this chapter. And does automation of production even prevent initial entry based on low wages?
Robotics, 3D printing, the IoT, Big Data, and cloud comput-ing, among others, are transforming entire industries. The evi-dence suggests that automation reduces some of the incen-tives for GVCs to relocate to lower-wage countries. However, it is also seen that automation does not necessarily dampen the attractiveness of low-wage destinations, especially for labor-in-tensive tasks that require human dexterity. In the apparel indus-try, for example, soft materials like fabrics are difficult to handle through automation compared to solid materials such as metal or wooden objects, and sewing/stitching can still be out of the reach of “robots’ hands”.
In this sense, automation is likely to have only a limited impact on developing countries’ opportunities to participate in value chains through the offshoring of production by high-income countries, at least in the short term. Foreign direct investment flows (greenfield investment) from high-income countries to low- and middle-income countries has declined since 2010. Nev-ertheless, there are important differences across industries and between production and assembly tasks within industries. The pattern across countries also suggests that some FDI may have migrated from China to low-income and middle-income coun-tries in Asia and Africa and from higher- to lower-income coun-tries in the Europe and Central Asia region.
While automation does not pose immediate risks to shut the door to labor-intensive exports from developing countries, gov-ernments need to develop a comprehensive digital strategy. Our economies are increasingly sitting on a digital foundation, one that is generating high-speed growth and disruptive change. The employment and investment of tomorrow will be data inten-sive, and value in a knowledge economy is increasingly created by innovative ideas and data.
Not only is embracing digital technologies good for the economy, but it is also good for society. The digitally powered, knowledge-intensive GVCs that are emerging and are likely to dominate in the coming years have a strong potential for inclu-sion. As Nobel Prize winner Mike Spence points out, they have low marginal costs of production and are non-rival. Moreover, they can expand markets for small businesses beyond traditional geographies. They can also expand financial inclusion, as data on e-commerce can be used as collateral, and smartphones link up poorer countries to these opportunities.
GVCs and digital technology
“Supply Chain 4.0” is the re-organization of supply chains – design and planning, production, distribution, consumption, and reverse logistics – using technologies that are known as

Executive summary • 5
“Industry 4.0”. These technologies emerged in the 21st century and are largely implemented by firms that are at the frontier of supply chain management in high-income countries. The most frequently mentioned supply management techniques are the IoT, big data analytics, 3D printing, advanced (autonomous) robotics, smart sensors, augmented reality, artificial intelligence, and cloud computing. Through these advanced techniques, a continuous flow of information between the retailer and supplier keeps the shelves stocked and there is no longer a “back room” in stores where inventory is kept.
“Supply Chain 4.0” is about transforming the model of supply chain management from a linear model in which instructions flow from supplier to producer to distributor to consumer, and back, to a more integrated model in which information flows in multiple directions. While lead firms are increasingly analyzing this information through “supply chain control towers,” the end effect of this development is making the goods economy more responsive to consumer demand. According to a recent PwC (2016a) study on the rise of Industry 4.0, a third of the more than 2,000 respondents say their companies have started to digitize their supply chains, and fully 72% expect to have done so five years from now.
In “Supply Chain 4.0”, the internet makes the warehouse vis-ible to the customer and within the warehouse, some technol-ogies such as autonomous logistics and robotic transport can be employed to substantially improve pick-and-pack perfor-mance. Business-to-business (B2B) e-commerce consists of links in supply chains – whether transactions between parts suppliers and assemblers, between distribution centers and retailers, or online purchases of services which in many cases support the supply chain. B2B commerce can be implemented either through websites, much like business-to-consumer (B2C) e-commerce, or through electronic data interchange (EDI) which is a mature tech-nology through which the computer systems of the buyer and seller are directly connected using a common record format.
To rapidly assess and respond to changes in customer demand, tracking and tracing throughout the supply chain is enabled through sensing technologies underlying the IoT, including radio frequency identification (RFID), Bluetooth, and global system for mobile communication (GSM). Applications of IoT are increasingly used to facilitate the management strategies of “customer-managed inventory” (CMI) or “vendor-managed inventory” (VMI) in which information is initially provided by a customer and then transmitted up the supply chain to the ware-house. Technologies such as RFID tags then transmit information to the distribution center so that orders can be fulfilled. An EDI system causes an order created electronically by the customer to be instantly duplicated without error in the vendor’s computer system, and the invoice to be similarly electronically duplicated in the customer’s computer system. Some of these processes are being implemented through blockchain, a distributed ledger technology that allows multiple parties to maintain copies of the same information in various locations, either in an open manner or requiring individual entities’ permission to access the network. Its special feature is that historical entries cannot be altered.
New technologies gather prodigious amounts of data. Big data analytics is about using data to drive useful business intel-ligence, answering the questions, “What just happened?”, “Why did it happen?”, and “What are we going to do next?” The ability to collect and analyze data gathered in the whole supply chain makes it possible to “run scenarios within the platform”, where the platform is conceived of as an overarching software solution within the supply chain control center. Besides saving time and labor, and reducing errors, EDI enables a large amount of data capture about customer behavior which can be the basis for supply chain analytics using either “big data” or “small data” techniques.
The use of modern technology and human labor in warehouses are often complements, rather than substitutes, especially in con-ditions where e-commerce is substantially increasing demand for certain goods and services. E-commerce is a mechanism for translating unpaid household shopping time into paid market time. Instead of consumers spending time shopping, workers in warehouses and on delivery trucks are picking goods off ware-house shelves and bringing them to the consumer’s front door. Most of the jobs being created involve moving goods around either in warehouses or delivery vehicles and have many of the characteristics of factory work. A study using U.S. data gathered in the Occupational Employment Statistics of the Bureau of Labor Statistics, shows that employment in the most dynamic parts of the supply chain has grown at a rate substantially exceeding that of the overall economy since 2011. These sectors include ware-housing and storage, couriers and messengers (i.e. express deliv-ery), and non-store retailers (i.e. e-commerce companies).
Digital technologies and the internet are becoming the foun-dation of entire economies. There are huge benefits in terms of inclusive patterns of growth, innovation and entrepreneurial opportunities, but the downside risks are much larger than was initially understood. Trade and investment will be vulnerable in the near complete absence of international agreements on the uses and prohibited abuses of the internet and data.
The digital economy and SMEs
Small and medium-sized enterprises in general have low direct participation in international trade, compared to large enter-prises. This result makes economic sense as long as there are fixed costs in exporting, such as learning about foreign markets or rules and minimum scales for shipping. In theory, the spread of GVCs should reduce these effects and make it easier for SMEs to participate in trade as the break-up of the production process makes it feasible for a specialized firm to find niche markets. Yet, SMEs are underrepresented in GVCs.
This may be changing, however, as access to information and communication technology (ICT) continues to grow. For example, there is evidence that the internet reduces search costs, facilitat-ing more exchange and increasing firm productivity. Cross-bor-der e-commerce platforms are also providing new opportunities for SMEs and even micro firms.

6 • Technological innovation, supply chain trade, and workers in a globalized world
Using firm-level data from the World Bank’s Enterprise Sur-veys, new research finds that whether a firm has a website on the internet facilitates the participation of manufacturing SMEs in GVCs and trade. In particular, such SMEs are more likely to use foreign inputs for production and export their output. Further, ICT connectivity is found to be more important for small firms than for large ones when considering whether or not a firm par-ticipates in trade.
Evidence underlines the importance of ICT access for SMEs to join GVCs in the digital economy, however, access to new tech-nology varies not only between firm size, but also regionally by level of development. Infrastructure constraints faced by devel-oping countries in e-commerce range from the most basic, such as access to a steady supply of electricity, to the more complex, such as not having access to electronic payment systems or a lack of high-speed internet cables. This is a particular problem, not only because information communication technology (ICT) is necessary for e-commerce, but also because ICT is now consid-ered a pre-requisite for joining most GVCs. No matter the inter-net’s functionality, regardless of lacking features such as broad-band connection and e-commerce platforms, e-commerce can only develop if the internet is present. This is in line with empir-ical studies showing that access to the internet improves export performance in developing countries across manufacturing and services sectors through reduced search costs and decreased distance barriers. Furthermore, the internet has also been shown to increase firm productivity, especially of smaller and less inno-vative firms.
However, SMEs face a number of additional challenges inte-grating into GVCs with the digital economy. On top of lagging behind large firms in terms of overall digital technology use and capability, small businesses may also find it difficult to access e-commerce platforms and payment systems. National policy may also be inadvertently preventing successful internationaliza-tion of SMEs via GVCs. Complex customs procedures, regulatory uncertainty and barriers to services trade all adversely affect SMEs and pose challenges to SME participation in GVCs, despite the opportunities provided by e-commerce.
These findings underscore the continuing need to improve the ICT environment/infrastructure and to expand services such as e-payment and e-commerce, all of which benefit SMEs dispro-portionally, but they also highlight the lack of information regard-ing SMEs. In theory the digital economy holds potential for SME participation in GVCs, but for effective policies to be developed, better data will need to be collected.
Should high domestic value added in exports be an objective of policy?
Global value chains make it easier for developing countries to move away from export reliance on unprocessed primary prod-ucts to become exporters of manufactures and services. Before the development of GVCs, a country had to master the pro-duction of a whole product in order to export it. GVCs allow
countries to specialize in a particular activity and join a global production network. As a developing country moves from export of primary products to export of manufactures and services via GVCs, the ratio of domestic value added to gross export value tends to fall. Developing countries often start out at the end of value chains, with labor-intensive assembly of parts produced elsewhere. For some individual products, the ratio of domestic value added to gross export value can be very small, maybe only a few percentage points. The gross exports from the country can be very large, but this is an artifact of the position in the value chain. The country’s value added contribution to the export is much smaller. Many developing countries worry about this phe-nomenon and aspire to increase their value added contribution to exports. There are a number of reasons why this objective should be approached cautiously. It may seem like simple math that a higher domestic value added share means more total value added exported and hence more GDP. But that simple idea ignores the reality that imported goods and services are a key support to a country’s competitiveness. If a country artifi-cially replaces key inputs with inferior domestic versions, the end result is likely to be fewer gross exports and less, not more, total value added exports.
History provides a number of interesting lessons about this issue. First, in almost all countries, developed and developing alike, the share of domestic value added in exports has tended to trend downwards over time. This reflects the expansion of global value chains. Even the countries best known for final products in key sectors such as autos, machinery, and electronics rely heav-ily on imported inputs, both manufactures and services. Many of the iconic products in the world, such as BMW cars and iPhones, have large amounts of imported inputs that go into final assem-bly. Developing countries have learned part of this lesson and are generally quite open to imports of parts and components. However, imported services are also a key input into manufac-tures, and developing countries tend to be more protectionist vis-à-vis services. Both trade in services and investment in ser-vices (often needed in order to trade the services) tend to be more restricted in developing countries, than policies towards manufactures. Developing countries that have more imported service content in their exports tend to be more persistent and successful exporters of manufactures.
A second point about the ratio of domestic content to gross value of exports is that the early East Asian industrializers show a highly non-linear trend in this variable. In the case of Japan, this ratio fell in the early post-war period as the country opened up and began to use imported inputs. In the 1980s, however, the ratio increased as Japan became a capable producer of a wide range of manufactured intermediates and parts. Since 1990 there has again been a sharp trend downwards in domestic con-tent as complex value chains developed throughout Asia. Japan is an industrial powerhouse with many successful brands, and it is revealing that the domestic content ratio in the most recent year is the lowest ever recorded. Being an industrial powerhouse does not mean that all activities take place within the border. Japanese firms use imported goods and services in a highly

Executive summary • 7
efficient manner. The Republic of Korea’s and Chinese Taipei’s experiences are very similar to Japan’s, but with a lag.
China’s recent experience is an important counter-example. At the beginning of economic reform there was a sharp drop in the domestic value added ratio as the country moved from exporting primary products to assembling apparel and elec-tronics using parts produced in other countries. However, over the past decade the ratio has been rising, catching the attention of other developing countries. Our research indicates that this trend is primarily the result of technological advance in China, not the result of restrictive trade policy. What is happening to China now is analogous to what happened to Japan in the 1980s and the Republic of Korea in the 1990s, as their technological capability advanced. If China’s experience continues to be simi-lar to the earlier industrializers, then the ratio can be expected to peak and later decline as labor-intensive activities are off-shored to lower wage locations and more imported components and parts are used in production to keep Chinese firms competitive in international markets. China’s development is likely to be influ-enced by its “Made in China 2025” industrial policy. This policy aims to make China a technology leader in ten advanced manu-facturing sectors. China has set indicative targets for domestic value added in these sectors. In semiconductors, for example, China currently imports 90% of usage, but plans to produce 70% of usage by 2025, which would be an extraordinary shift. What remains unclear is what policy tools China will use. If it restricts imports or direct investment in these sectors, it will make its firms less competitive, not to mention inflaming global trade tensions.
Issues in GVC measurement
The proliferation and development of global input-output tables in recent years has significantly transformed our ability to inter-pret global production. But, important though such initiatives have been, they are typically silent on the role of multinationals in this new landscape. In addition, the policy debate in recent years has increasingly focused on ‘inclusive globalization’, refer-ring to the growing realization that the benefits of globalization may not have accrued to all members of society equally, even if only as a process of transition.
With traditional macroeconomic statistics, it is not immediately clear, for example, which categories of workers in which countries benefit from globalization (and how) and which may have been, even if only temporarily, left behind. Moreover, trade in val-ue-added (TiVA) estimates, derived through the construction of a global input-output table, implicitly assume that all firms within a given sector have the same production function (input-output technical coefficients), import intensity and export intensity.
This of course has never been true. We know for example that larger firms will typically have different production functions compared to smaller firms, because of economies of scale, and also higher labor productivity. And these firms will also typically be more export and, indeed, import orientated than their smaller counterparts (reflecting in part the disproportionate costs of
trade faced by smaller firms compared to larger firms). The same generalizations hold true for foreign-owned enterprises, or enter-prises with affiliates abroad, compared to purely domestic firms; for example, the foreign content of exports by foreign-owned firms in the transport sector in the United States is twice that of domestically owned firms. But TiVA estimates, relying as they do on national supply-use and input-output tables, cannot reflect these heterogeneities; thus, key measures, such as the import content of exports, are downward biased.
Additional complexities can create significant interpretative challenges for users of TiVA type statistics. Because inter-coun-try input-output tables value transactions at basic, and not market, prices, many of the related TiVA analyses reveal only some of the story. What is often not fully understood in the use of tables valued in basic prices is that they exclude the value that is added at the end of the chain by distribution sectors (in par-ticular retail and wholesale, which often include value associated with marketing activities and brands). At the heart of the debate, and indeed confusion, is that input-output tables in basic prices are in essence a mechanism to provide a view of production, and because they remove significant distribution margins at the end of the chain, they are less well equipped to provide a perspec-tive from the consumption point of view. This has a direct impact on smile-curve type analyses that describe where sectors are in value chains and how far they are from final demand. Moreover, although the basic price concept may provide a correct view of, for example, the domestic value-added or services content of a country’s total exports, it provides an arguably distorted view of the same measure of a given good seen from a consumption, or free-on-board (FOB) perspective. This is because basic prices exclude often significant distribution margins related to trans-portation from the factory gate to the customs frontier, which may also reflect significant contributions from activities related to brand, R&D, design, and marketing. For example, the US domes-tic value-added content of its exports of textiles and clothing in FOB prices was around 20% in 2016 compared to 3% using the pure basic price approach.
The basic price approach also limits the scope to reveal addi-tional dependencies related to globalization, for example jobs sustained in retailers through sales of imports. A complementary accounting framework is developed in “market” prices to illus-trate the insights that can be gained through such an approach. In the United States, for example, the sale of imports supported 9.0 million jobs.


9
CHAPTER 1
Recent patterns of global production and GVC participationXin Li (Beijing Normal University), Bo Meng (IDE-JETRO), and Zhi Wang (RCGVC-UIBE)
ABSTRACT
Taking advantage of a new accounting method to decom-pose GDP production into pure domestic production, tra-ditional trade, simple and complex GVC activities, this chapter examines recent trends in global value chain (GVC) activities across the world. Our main findings show that the pace of GVC activities picked up in 2017 after a period of slow down since 2012; intra-North American and intra-Euro-pean GVC activities declined relative to inter-regional trans-actions due to higher penetration via Factory Asia but value
chains still remain largely regional; China is increasingly playing an important role as both a supply and demand hub in traditional trade and simple GVC networks, although the US and Germany are still the most important hubs in com-plex GVC networks; bilateral trade balances are significantly affected by the supply and demand of third countries; and net imports are no longer a proper measure of the impact of international trade on the domestic economy in the age of GVCs.
• The growth of global value chains has slowed since the 2008-09 Global Financial Crisis but has not stopped. From 2000 to 2007, global value chains (GVCs), especially complex ones, expanded at a faster rate than GDP. During the global financial crisis there was naturally some retrenchment of GVCs, followed by quick recovery (2010-2011), but since then growth has mostly slowed. However, most recent data for 2017 show that complex GVCs grew faster than GDP.
• Value chains remain largely regional but they are not static. Between 2000 and 2017, intra-regional GVC trade increased in “Factory Asia” reflecting, in part, upgrading by China and other Asian economies. In contrast, intra-regional GVC trade in “Factory Europe” and “Factory North America” decreased slightly relative to inter-regional GVC trade reflecting stronger linkages with “Factory Asia”.
• China has emerged as an important hub in traditional trade and simple GVC networks, but the United States and Germany remain the most important hubs in complex GVC networks.

10 • Technological innovation, supply chain trade, and workers in a globalized world
Global value chains, where firms specialize in a particu-lar set of activities in one country to produce parts and components for other countries, have spread the pro-duction process across countries; their share of world
production and trade has expanded greatly over the past three decades. In the years immediately after the global financial crisis, however, the expansion of GVCs significantly slowed, according to GVC production measures reported in the 2017 GVC develop-ment report. At the same time, the world has seen the emergence of populist, protectionist movements in many advanced countries. The looming trade tension between the United States and its major trading partners, especially China, the second largest econ-omy in the world, will have significant consequences for growth opportunities in developing countries, but also, in a world of high levels of interdependence, developed economies.
The first chapter of this report updates trends in GVC pro-duction and trade activities in both developed and developing economies by technology (knowledge) intensity and income level, according to the production decomposition method pro-posed by Wang et al (2017). This approach classifies the embod-ied factor content in a product into GVC and non-GVC activities
based on whether it crosses national borders or not. Value-added creation is only classified as a GVC activity when the embodied factor content in a product crosses a national border for produc-tion purposes (Box 1.1).
The chapter is organized as follows. Section 1 describes the changing pattern of global production activities and GVC participation across countries and industries based on global inter-country input-output (ICIO) tables constructed by Asian Development Bank, which covers 62 economies and 35 indus-tries up to 2017. Section 2 demonstrates the changing distribu-tion of value-added production activities along typical global value chains, as more developing countries have been integrated into the global production network. Section 3 uses network analysis to demonstrate the topology of the global production network structure of traditional trade, simple and complex GVC activities, and their evolution between 2000 and 2017. Section 4 analyzes the multilateral nature of bilateral trade and focuses on three sensitive bilateral trade relations (US-China, US-Germany, US-Japan) to demonstrate the roles third countries have played in determining bilateral trade balances in the age of global value chains. Section 5 concludes.
BOX 1.1A production decomposition to identify and measure GVC activities
In Wang et. al. (2017), production activities are divided into 4 broad types depending on whether they involve produc-tion sharing between two or more countries. The first type is value added produced at home and absorbed by domes-tic final demand without involving international trade. No factor content crosses national borders in the entire produc-tion and consumption process. The second type is domestic value added embodied in final product exports, that is, tra-ditional trade: products are made completely by domestic factors and factor content crosses a national border once for consumption only. The third type is domestic value added embodied in a country-sector’s intermediate trade that is used by the partner country to produce its domestic products consumed locally, or is foreign value added that is imported directly from partner countries and used for domestically consumed products. Factor content is used in production outside the home country and crosses a national border once for production. Therefore, it is referred to as “simple GVC activities”. The last type is value added embodied in intermediate exports/imports that is used by a partner country to produce exports (intermediate or final) for other countries. In this case, factor content crosses a national border at least twice, so is referred to as “com-plex GVC activities.” Production activities in the first two types are entirely conducted within national borders, and
there is no cross-country production sharing; the difference between the two is whether they satisfy either domestic or foreign final demand. The last two types are cross-country production sharing activities; the differences between the two are whether they satisfy partner country or other coun-tries’ final demand, and the number of times factor content crosses national borders. Domestic and import input-output coefficient matrixes in ICIO tables are used to distinguish domestic and foreign factor content in various production activities. The classification and relation among the four types of production are depicted in Figure 1.1.
According to this decomposition method, GVC activities as a share of total production activities can be used to mea-sure the intensity of each country-sector’s participation in cross-country production sharing activities. Essentially, this approach measures the percentage of production in a par-ticular country-sector that has been engaged in global pro-duction networks. The forward GVC participation indicator is based on a decomposition of GDP production; it shows the percentage of production factors employed in a coun-try-sector that have been involved in cross-country produc-tion sharing activities. The backward participation indicator is computed based on a decomposition of final goods pro-duction; it shows the percentage of final products produced by a country-sector coming from GVC activities.

Recent patterns of global production and GVC participation • 11
1. The changing pattern of global production activities and GVC participation2
GVC activities as a share of global GDP fell from 2011 to 2016, as the share of purely domestic production activities rose (see Figure 1.2, which is an update of Figure 2.3 in the 2017 GVC Development Report based on the newly released ICIO tables by the Asian Development Bank). This continues the downward trend in GVC activities shown in the 2017 GVC report based on data through 2014. However, the growth of global trade surpassed the growth of global GDP for the first time in nearly six years in 2017, and there were signs of a recovery of GVC activities.
The nominal growth rate of all types of production activi-ties (the four activities are defined in Box 1.1) fell sharply during 2012-2016, with a much sharp slowdown in cross-country, pro-duction-sharing GVC activities. The decline was the steepest for complex GVC activities, followed by simple GVC activities, tra-ditional trade and domestic production activities; the average annual changes for these four types of activities during 2012-2016 were -1.65%, -1.00%, -0.28% and 1.49% respectively (indi-vidual year data are reported in Figure 1.3, which is an update of Figure 2.5 in the 2017 GVC report). Thus, the limited increase in global GDP from 2012-2016 was almost entirely accounted by the growth of pure domestic production; international trade contributed very little during this slow recovery period. In 2017, the growth rate of global trade exceeded that of global GDP, a
10% increase in complex GVC activities led the growth. However, rising trade tensions between the United States and its major trading partners, especially China, has introduced tremendous uncertainty in the global economy recovery process. Determin-ing whether the recovery of cross-country production sharing activities in 2017 has started a new trend requires more years of data and further analysis.
A first step is to measure the impact of the recent, sharp changes in commodity prices on nominal growth rates of pro-duction activities shown above. The global prices of crude oil and other bulk commodities have gone through a “super circle” since 2000. For example, the per barrel crude oil price (dated Brent) fluctuated dramatically during 2000-2018, rising from less than 30 US dollars in 2000 to over 110 dollars in 2011, falling to less than 50 dollars by 2016, and then rebounding to about 70 dollars since early in 2018. Because crude oil and other bulk com-modities are important intermediate inputs in global production, these price fluctuations may affect the relative nominal growth patterns of different types of value-added creation activities measured in current US dollars shown in Figure 1.3.
It appears, however, that the more rapid decline in the nom-inal value of GVCs than other activities as a share of GDP from 2011-2016 was not due simply to price changes. Figure 1.4 shows the growth rate of the volume of world merchandise trade, world real GDP and their ratio during 1995-2017. For each year when global real trade growth was faster than global real GDP growth, complex GVC activities had the highest nominal rate of growth
FIGURE 1.1 Decomposition of production activities1
Traditional TradeCross border
for consumptionPortugal wine in
exchange for England cloth
GVCsCross border for production
Intermediate trade
Pure DomesticNo border
crossing
Hair cut
GVCsProduction sharingbetween two or more countries
Production ofValue-added orFinal products
Complex GVCsCross border at least twice
iPhone/Auto
Simple GVCsCross border once for production
Chinese steel in US building

12 • Technological innovation, supply chain trade, and workers in a globalized world
FIGURE 1.2 Trends in production activities as a share of global GDP, by type of value-added creation activity, 1995-2017 Percent
10
8
6
4
2
01995 1996 1997 1998 1999 2000 2001 2002 2003 2004 2005 2006 2007 2008 2009 2010 2011 2012 2013 2014 2015 2016 2017
76
78
80
82
Domestic
Simple GVC
Financial Crisis
Dotcom Bust
Asian Financial Crisis
Traditional GVC
Complex GVC
84
86
Source: 1995-2009 are based on the University of International Business and Economics (UIBE) GVC indexes derived from the 2016 World Input-Output Table,
and 2010-2017 are based on the UIBE GVC indexes derived from the Asian Development Bank (ADB) 2018 ICIO tables.
FIGURE 1.3 Nominal growth rates of different value added creation activities, global level, 2000-2017
Domestic Traditional Trade Simple GVC Complex GVC The nominal growth of GDP (right)
--1155%%
--1100%%
--55%%
00%%
55%%
1100%%
1155%%
--3300%%
--2200%%
--1100%%
00%%
1100%%
2200%%
3300%%
2001 2002 2003 2004 2005 2006 2007 2008 2009 2010 2011 2012 2013 2014 2015 2016 2017
Source: 2000-2010 are based the UIBE GVC indexes derived from the 2016 World Input-output table, and 2011-2017 are based on the UIBE GVC indexes derived
from the ADB 2018 ICIO tables.

Recent patterns of global production and GVC participation • 13
among the four type activities shown in Figure 1.3. And when world trade grew slower than world GDP, complex GVC activi-ties grew more slowly than other activities. This can be under-stood intuitively, because complex GVC activities are the only one of these four components of value added production where factor content embedded in products cross a national border at least twice. When complex GVC activities grow slower than pure domestic production activities, as happened during 2012-2016, world trade grows slower than GDP.
To evaluate the impact of the shift in production patterns after the global financial crisis to GVC participation across coun-tries and industries, we plot the forward and backward GVC par-ticipation indicators jointly in a scatterplot based on ADB ICIO tables (Figure 1.5). The two red dotted lines indicate the world’s average forward and backward participation rates and divide the figure into four quadrants. Most countries fall along the 45-degree line, indicating that countries that have a high degree of forward participation also tend to have a high degree of back-ward participation. Major resource exporters, such as Mongolia, Russia and Norway, fall above the 45-degree line (Figure 1.5, upper left). Since natural resources are the most upstream sec-tors, these economies tend to have much higher degree of for-ward GVC participation than backward GVC participation.
Across sectors3, mining (represented by the purple dots) is in the upper left corner, indicating a high degree of forward GVC participation but a low degree of backward GVC participation. Most service sectors, especially for sectors in the other services group (utility, education, health care and personal services, rep-resented by the blue dots) tend to be in the lower left corner, meaning that they have low participation in GVC activities by both measures. In comparison, high research and development (R&D) intensity manufacturing sectors (red dots) tend to be in the upper right quarter of the graph, reflecting their active partic-ipation in GVCs as both producers and buyers of intermediate products.
Ten years after the global financial crisis, global GVC partic-ipation has not returned to pre-crisis levels: the global average GVC participation rate (as a share of GDP) was 0.1289 in 2017, compared to 0.1343 in 2007. GVC activities recovered faster in high-income countries than in middle-income countries. The recovery of specific GVC activities (backward versus forward par-ticipation) also differs across income groups. Forward GVC par-ticipation increased more rapidly than backward participation in the high-income countries, especially in the high-income Eastern European countries (the forward participation rate of the Czech Republic rose from 0.2355 in 2007 to 0.2812 in 2017, of Estonia
FIGURE 1.4 The growth rate of merchandise trade volume and real global GDP, 1995-2017, %
2.5
1.5
2.5
1.81.6
2.5
-0.2
1.4
1.92.3
1.71.9
1.51.1
3.2
1.7
0.8 0.9 0.9 0.90.7
1.5
-3.0
-2.0
-1.0
0.0
1.0
2.0
3.0
4.0
-15.0
-10.0
-5.0
0.0
5.0
10.0
15.0
20.0
1995
1996
1997
1998
1999
2000
2001
2002
2003
2004
2005
2006
2007
2008
2009
2010
2011
2012
2013
2014
2015
2016
2017
World merchandise volume trade growth (left)
World GDP growth (left) Ratio of trade growth to GDP growth (right)
Source: Global GDP is from World Development Indicators, WB and World Economy Outlook, IMF; Merchandise volume trade is from UNCTAD. The ratio of
trade decline to GDP decline in 2009 is 7.4, out of scale shown in the graph.

14 • Technological innovation, supply chain trade, and workers in a globalized world
from 0.2536 to 0.3151, of Hungary from 0.2298 to 0.2777, and of Latvia from 0.1818 to 0.2712). A higher growth rate of forward participation in manufacturing and service sectors often implies faster upgrade of GVC production activities4 as well as the deep-ening of intra-product specialization brought about by the recov-ery of cross-country production sharing activities. At the same time, some middle-income economies such as Mexico, Romania and Viet Nam moved up faster in backward participation, which mirrors what happened in developed countries. Finally, some Asian developing economies that experienced a decline in both forward and backward GVC participation have not yet seen a
return to pre-crisis levels. For instance, India’s forward and back-ward participation rate dropped from 0.1006 and 0.1382 in 2007 to 0.0655 and 0.0991in 2017, respectively. China, Indonesia and Philippines also were subjected to similar declines.
Comparing the development of different GVC activities in dif-ferent income groups in longer period, significant growth of GVC participation only occurred in high-income countries. In partic-ular, their forward GVC participation rate increased from 9.5 in 2000 to 12.7 in 2017, while simple and complex activities con-tributed approximately equal shares (Table 1.1). The GVC partic-ipation rate actually declined in upper middle income countries.
FIGURE 1.5 GVC participation indicators, country levels and sector levels
0.0 0.1 0.2 0.3 0.4 0.5 0.6 0.7
Forw
ard
-Lin
kage
Backward-Linkage
High income
Lower middleincome
BBRRNN
UUSSAA
LLUUXXSSIINN
MMAALL
VVNNMM
NNOOR
MMOONN
RRUUSS
KKAAZZ
0.1343
0.1343
0.0
0.1
0.2
0.3
0.4
0.5
0.6
0.7
0.0
0.1
0.2
0.3
0.4
0.5
0.6
0.7
0.0
0.1
0.2
0.3
0.4
0.5
0.6
0.7
0.0
0.1
0.2
0.3
0.4
0.5
0.6
0.7
0.0 0.1 0.2 0.3 0.4 0.5 0.6 0.7
Forw
ard
-Lin
kage
Backward-Linkage
AGR
FBSHTI
LTI
MIN
MTIOSE
TTC
0.1343
0.1343 2007
0.0 0.1 0.2 0.3 0.4 0.5 0.6 0.7
Forw
ard-
Link
age
Backward-Linkage
High income
Lower middleincome
Upper middleincome
LUX
UUSSA
VVNNMMRRUUSS
BBRRNN
MMYYSSNNOOR
MMOONN
LLAAOO
0.1289
0.1289 20172007
0.0 0.1 0.2 0.3 0.4 0.5 0.6 0.7
Forw
ard
-Lin
kage
Backward -Linkage
AGR
FBS
HTI
LTI
MIN
MTI
OSE
TTC
0.1289
0.1289 2017
Upper middleincome
Note: AGR is an abbreviation of Agriculture, MIN is Mining; HTI, MTI and LTI are High, middle and low R&D intensive industries respectively; TTC is Trade and
Transportation; FBS is Financial and Business services; OSE is other services.
Source: the UIBE GVC indexes derived from the ADB 2018 ICIO tables.

Recent patterns of global production and GVC participation • 15
This is because participation in cross-border production sharing is only one kind of division of labor that can contribute to indus-trialization. The substitution of imported intermediate inputs by domestically-produced intermediate inputs in advanced devel-oping economies, such as the industrial upgrading in China, may also reduce the intensity of GVC participation due to the deepening of domestic division of labor and the lengthening of
domestic value chains. The proper combination of cross-border and domestic value chains, or domestic and foreign factor con-tent in a particular product, should be determined by market forces (this issue is examined in detail in Chapter 7).
The 2008/2009 global financial crisis had a dramatic, nega-tive impact on GVC participation for all countries in the world (Figure 1.6). The GVC participation rate increased by 4.3% per
TABLE 1.1A Forward GVC participation indexes by country groups(Percent of GDP)
Income level
GVC participation Simple GVC Complex GVC
2000 2007 2017 2000 2007 2017 2000 2007 2017
High 9.5 11.8 12.4 5.6 6.8 7.1 3.8 5.0 5.3
Upper middle 11.4 14.1 10.5 7.2 8.4 6.4 4.2 5.6 4.2
Lower middle 10.8 12.4 9.1 6.9 7.6 5.7 3.9 4.8 3.4
TABLE 1.1B Backward GVC participation indexes by country groups(percent of final goods production)
Income level
GVC participation Simple GVC Complex GVC
2000 2007 2017 2000 2007 2017 2000 2007 2017
High 9.3 11.7 11.8 5.8 6.8 6.5 3.5 4.9 5.3
Upper middle 12.5 14.1 10.5 7.3 7.7 6.3 5.2 6.4 4.2
Lower middle 11.7 14.2 11.8 7.9 9.3 7.6 3.8 4.8 4.2
Source: the UIBE GVC indexes derived from the ADB 2018 ICIO tables.
FIGURE 1.6 The changing intensity of GVC participation by income groups, 1995-2017
8.09.0
10.011.012.013.014.015.016.0
1995
1996
1997
1998
1999
2000
2001
2002
2003
2004
2005
2006
2007
2008
2009
2010
2011
2012
2013
2014
2015
2016
2017
World average High incomeLower middle income Upper middle income
Backward participationForward participation
World average High incomeLower middle income Upper middle income
8.09.0
10.011.012.013.014.015.016.0
1995
1996
1997
1998
1999
2000
2001
2002
2003
2004
2005
2006
2007
2008
2009
2010
2011
2012
2013
2014
2015
2016
2017
Note: 1995-2011 are from WIOD 2014ed, 2012-2017 are from ADB ICIO database. The global average GVC participation ratio may above all three country groups
in some years, due to the incomplete country coverage in both ADB and WIOD database. ADB ICIO table only covers 62 countries and the WIOD ICIO table
only covers 43 countries, rest countries in the world are classified as rest of the world in both databases. Therefore, when the GVC participation in those not
individually identified countries increase, the global average will be higher than the three country groups reported here, and this is confirmed by the analysis of
Figure 1.6-1.8 below.
Source: The UIBE GVC indexes derived from the WIOD and ADB 2018 ICIO tables. In particular, the data from 1995 to 2011 derived from the WIOD, and the data
from 2012-2017 derived from ADB.

16 • Technological innovation, supply chain trade, and workers in a globalized world
year during the pre-crisis GVC expansion period (2000-2008). This rate declined by 14.9% during the crisis in 2009, but recov-ered by 9.0% during 2010-2011. However, the world average GVC participation rate declined by 1.6% per year with the sharp slow-down of global trade from 2012 on, mainly driven by middle-in-come countries (the complex GVC participation rate of high-in-come countries was higher in 2017 than in 2007). In particular, the GVC participation rate of the lower middle-income and upper middle-income groups in 2017 was still approximately 2.6 and 3.7 percentage points lower than their participation rate in 2007.
According to the table 1.2a and table 1.2b, the participation rates of most industry groups are still lower than their pre-cri-sis levels, especially for all the goods producing industries. The tables also indicate that the complex GVC activities rate increased more (or declined more) than did the simple GVC
activities rate in most industry groups, indicating complex GVC activities are more sensitive to external economic shocks.
Analysis over a longer period shows that GVC activities of all sectors increased from 2000 to 2017. The higher the technol-ogy (knowledge) intensity of the sector, the larger the increase in complex GVC activities. For instance, the forward GVC par-ticipation rate of the high, middle and low technology-intensive manufacturing sectors increased by 4.2, 3.8 and 3.2 percentage points during 2000 to 2017. Complex GVC activities contributed 58.1% of these increases, on average, with a particularly high contribution (76.4%) to the 4.2 percentage point increase of the GVC participation rate in the high-tech sector. The forward/backward GVC participation rates in the business and financial services sector, which also is relatively knowledge intensive, also increased from 10.7/5.8 to 15.2/9.4, respectively (Table 1.2).
TABLE 1.2B Backward GVC participation indexes by industry groups(percent of final goods production)
Sector level
GVC participation Simple GVC Complex GVC
2000 2007 2017 2000 2007 2017 2000 2007 2017
High Tech 22.3 28.8 26.8 8.4 9.8 9.6 13.9 19.0 17.3
Middle Tech 19.1 26.9 25.9 10.0 14.4 13.2 9.1 12.5 12.7
Low tech 16.6 21.8 20.5 9.9 11.7 10.5 6.7 10.1 10.0
Business & financial 5.8 8.7 9.4 4.2 5.7 5.9 1.7 2.9 3.6
Trade and transportation 7.1 10.3 10.4 4.9 6.8 6.7 2.2 3.4 3.7
Other services 6.9 10.2 10.0 5.3 7.6 7.3 1.6 2.5 2.6
Agriculture 8.4 11.3 9.6 5.7 7.5 6.2 2.7 3.8 3.4
Mining 10.2 12.1 11.4 6.5 6.1 7.6 3.7 5.9 3.8
Source: the UIBE GVC indexes derived from the ADB 2018 ICIO tables.
TABLE 1.2A Forward GVC participation indexes by industry groups(percent of value added)
Sector level
GVC participation Simple GVC Complex GVC
2000 2007 2017 2000 2007 2017 2000 2007 2017
High Tech 25.3 30.7 28.8 13.8 16.1 15.6 11.5 14.6 13.2
Middle Tech 22.5 21.6 23.7 14.5 16.4 14.7 8.0 9.7 9.1
Low tech 12.4 15.8 15.3 7.9 9.9 9.5 4.5 5.9 5.8
Business & financial 10.7 14.9 15.2 6.6 9.1 9.0 4.0 5.8 6.2
Trade and transportation 10.2 13.4 13.4 6.2 7.9 8.0 4.0 5.5 5.4
Other services 2.3 3.5 3.3 1.4 2.1 2.0 0.9 1.4 1.3
Agriculture 8.3 11.4 10.6 5.8 7.8 7.2 2.4 3.6 3.5
Mining 39.9 54.3 48.3 25.6 34.5 29.6 14.3 19.8 18.8
Source: the UIBE GVC indexes derived from the ADB 2018 ICIO tables.

Recent patterns of global production and GVC participation • 17
Higher GVC intensity in the high-tech, knowledge intensive sec-tors in part reflects the role of GVCs in the dissemination of tech-nology from the lead firms to their suppliers (Rodrik, D., 2018).
The high intensity of complex GVC activities in high-tech sectors indicates R&D and other technology inputs have pro-moted intra-product specialization and the extension of global production networks. Slicing the production process into differ-ent tasks has greatly extended the depth and scope of interna-tional exchange and division of labor, from between products to between stages of the production of individual products, thus
generating new sources of comparative advantage for interna-tional exchange. The organization of production based on tasks by multinational enterprises, in which parts and components of special products (such as computers, automobiles and airplanes) cross national borders several times (complex GVC activities) is the fundamental force that drove global trade growth faster than global GDP growth before the global financial crisis. It also provided new opportunities for developing countries to be integrated into global economy by specializing in some simple tasks in which they have a comparative advantage, thus enabling
FIGURE 1.7 GVC participation indicators by countries and sectors, 2007 and 2017, manufactures
0.0
0.1
0.2
0.3
0.4
0.5
0.6
0.7
0.8
0.9
1.0
0.0
0.1
0.2
0.3
0.4
0.5
0.6
0.7
0.8
0.9
1.0
0.0
0.1
0.2
0.3
0.4
0.5
0.6
0.7
0.8
0.9
1.0
0.0
0.1
0.2
0.3
0.4
0.5
0.6
0.7
0.8
0.9
1.0
0.0 0.1 0.2 0.3 0.4 0.5 0.6 0.7 0.8 0.9 1.0
0.0 0.1 0.2 0.3 0.4 0.5 0.6 0.7 0.8 0.9 1.0 0.0 0.1 0.2 0.3 0.4 0.5 0.6 0.7 0.8 0.9 1.0
0.0 0.1 0.2 0.3 0.4 0.5 0.6 0.7 0.8 0.9 1.0
Forw
ard
-Lin
kage
Backward-Linkage
LLUUXX
IINNDD
HHKGG
CCYYPP
MMYYSS
VVNNM
MMEEXX
TTWWNIITTAA
DDEEUU
0.2605
0.2688
High income
Lower middleincome
Upper middleincome
High income
Lower middleincome
Upper middleincome
High income
Lower middleincome
Upper middleincome
High income
Lower middleincome
Upper middleincomeFo
rwar
d-L
inka
ge
Backward -LinkageCCAAMM
SSGGPP
BBRRNN
MMYYSS
IIDDNN
MMEEXX
VVNNM
LLAAOO
0.1581
0.2179 2007_LTI 2017_LTI
2007_MTI 2017_MTI
Forw
ard
-Lin
kage
Backward-LinkageCCAAMM
IINNDD
UUSSAA
HHKKGGLLTTUU
TTHHAADDEEUU
IITTAAVVNNMM
MMEEXX
0.2372
0.2586
Forw
ard-
Link
age
Backward-Linkage
IIDDNN VVNNMM
BBRRNN
RRUUSS
CCYYPP
SSGGPP
MMEEXXJJPPNN
TTHHAA
FFIINN
TTUURR
LLAAOO 0.1527
0.2051
Note: the country abbreviation is according to the ISO 3166-1 alpha-3, and a complete list of the current officially assigned ISO 3166-1 alpha-3 codes is available
on the United Nations International Trade Statistics: https://unstats.un.org/unsd/tradekb/knowledgebase/country-code.
Source: the UIBE GVC indexes derived from the ADB 2018 ICIO tables.

18 • Technological innovation, supply chain trade, and workers in a globalized world
FIGURE 1.8 GVC participation indicators by countries and sectors, 2007 and 2017, services
High income
Lower middleincome
Upper middleincome
High income
Lower middleincome
Upper middleincome
High income
Lower middleincome
Upper middleincome
2017_FBS
2017_TTC
2017_OSE
High income
Lower middleincome
Upper middleincome
Forw
ard
-Lin
kage 2007_OSE
BBTTNN
KKGGZZMMLLTT 0.0349
0.1026
Backward-Linkage
Backward-Linkage
High income
Lower middleincome
Upper middleincome
2007_TTC
Forw
ard
-Lin
kage
Backward-Linkage
SSGGPP
LLUUXXMMYYSS
MMOONN
BBEELLVVNNM
KKAAZZ
RRUUSS
0.1340
0.1026
Forw
ard-
Link
age
Backward-Linkage
MMYYSS
LLUUXX
TTHHAACCYYPP
NNLLDDIIRRLL
MMLLTTSSGGPP
FFRRAA 0.1516
0.0944
Forw
ard-
Link
age
MMLLTTUUSSAA
VVNNMM
NNLLDD
0.0331
0.0996
Forw
ard
-Lin
kage
Backward-Linkage
BBEELL
LLUUXX
VVNNM
MMDDV
RRUUSS
CCHHN
TTWWN
LLTTUU
SSGGPP
0.1337
0.1039
High income
Lower middleincome
Upper middleincome
0.0
0.1
0.2
0.3
0.4
0.5
0.6
0.7
0.8
0.9
1.0
0.0
0.1
0.2
0.3
0.4
0.5
0.6
0.7
0.8
0.9
1.0
0.0
0.1
0.2
0.3
0.4
0.5
0.6
0.7
0.8
0.9
1.0
0.0
0.1
0.2
0.3
0.4
0.5
0.6
0.7
0.8
0.9
1.0
0.0
0.1
0.2
0.3
0.4
0.5
0.6
0.7
0.8
0.9
1.0
0.0
0.1
0.2
0.3
0.4
0.5
0.6
0.7
0.8
0.9
1.0
0.0 0.1 0.2 0.3 0.4 0.5 0.6 0.7 0.8 0.9 1.0 0.0 0.1 0.2 0.3 0.4 0.5 0.6 0.7 0.8 0.9 1.0
0.0 0.1 0.2 0.3 0.4 0.5 0.6 0.7 0.8 0.9 1.00.0 0.1 0.2 0.3 0.4 0.5 0.6 0.7 0.8 0.9 1.0
0.0 0.1 0.2 0.3 0.4 0.5 0.6 0.7 0.8 0.9 1.00.0 0.1 0.2 0.3 0.4 0.5 0.6 0.7 0.8 0.9 1.0
Forw
ard
-Lin
kage
Backward-Linkage
LLUUXX
KKGGZZ
IIRRLL
MMYYSS
KKAAZZ
FFRRAA
NNLLDD
0.1493
0.08662007_FBS
Source: the UIBE GVC indexes derived from the ADB 2018 ICIO table.

Recent patterns of global production and GVC participation • 19
developing countries to achieve rapid industrialization through joining GVCs.
Generally speaking, industry groups in manufactures have higher average GVC participation intensity than industry groups in mining and services (see the scatter plots of backward and forward participation rates across countries—Figures 1.7, 1.8 and 1.9). In the mining sector, which is the main source of raw materials input in the early stages of production, the forward participation ratio is generally higher than backward participa-tion for most countries, while in other services (utilities, educa-tion, health care and domestic services), which are closer to the final consumer and placed at the final stage of the production chain, the backward participation is higher than forward par-ticipation for most countries. In manufactures, higher R&D and knowledge intensities are associated with a higher GVC partic-ipation rate (see above). In services, GVC participation is also
heterogeneous across industries. Communication, financial and business services, as well as trade and transportation services, have much higher GVC participation rates than other domestic services such as education, health care and personal services, because the former are critical inputs in the modern production process.
GVC participation rates also differ significantly by geo-graphic region5. Figures 1.10-1.12 report both forward and back-ward GVC participation intensities and their inter- and intra-re-gional shares for manufacture industries in the three major supply chain blocks (North America, Europe and Asia). In each figure, the very last pair of columns are the GVC participation rates in levels and the previous columns are the decomposition across regions. For example, in Figure 1.10, which pertains to Asia, the bar for Asia shows the share of intra-regional activities in Asia’s total GVC participation, while the other bars show the
FIGURE 1.9 GVC participation indicators by countries and sectors, 2007 and 2017, agriculture and mining
High income
Lower middleincome
Upper middleincome
0.0
0.1
0.2
0.3
0.4
0.5
0.6
0.7
0.8
0.9
1.0
0.0
0.1
0.2
0.3
0.4
0.5
0.6
0.7
0.8
0.9
1.0
0.0
0.1
0.2
0.3
0.4
0.5
0.6
0.7
0.8
0.9
1.0
0.0
0.1
0.2
0.3
0.4
0.5
0.6
0.7
0.8
0.9
1.0
0.0 0.1 0.2 0.3 0.4 0.5 0.6 0.7 0.8 0.9 1.0
0.0 0.1 0.2 0.3 0.4 0.5 0.6 0.7 0.8 0.9 1.0 0.0 0.1 0.2 0.3 0.4 0.5 0.6 0.7 0.8 0.9 1.0
0.0 0.1 0.2 0.3 0.4 0.5 0.6 0.7 0.8 0.9 1.0
Forw
ard
-Lin
kage
Backward -Linkage
2007_AGR
VVNNM
LLAAOO
LLUUXXTTHHAA
MMYYSS
0.1137
0.1131
High income
Lower middleincome
Upper middleincome
Forw
ard
-Lin
kage
Backward -Linkage
2007_MinKKAAZZ
NNLLDD
RRUUSS
MMLLTT
VVNNMM
KKGGZZ
MMOON
NNOORR
GGBBRR
DDNNKK
0.5429
0.1207
High income
Lower middleincome
Upper middleincome
Forw
ard-
Link
age
Backward-Linkage
2017_AGR
MMYYSS
LLAAOO
LLUUXX
BBEELL
IIDD
TTHHAA
0.1064
0.0961
High income
Lower middleincome
Upper middleincome
Forw
ard-
Link
age
Backward-Linkage
2017_MinNNLLDD
AAUUSS
JJPPNN
MMOONN
IIRRLLGGBBRR
DDEEUU
NNOORR
CCHHNN
0.4835
0.1138
Source: the UIBE GVC indexes derived from the ADB 2018 ICIO table.

20 • Technological innovation, supply chain trade, and workers in a globalized world
participation of other regions in Asian GVCs, either as suppliers (backward linkages for Asia) or purchasers (forward linkages for Asia). The light- and dark-colored portions of the bar show the shares of different groups inside the region (the light-colored portions represent East Asia and Western Europe, and the dark color portions represent the Rest of Asia and Eastern Europe).
Generally speaking, the higher the degree of economic inte-gration in a regional production network, the higher the intra-re-gional GVC activities. In 2000, “Factory Europe” had the highest degree of economic integration, so its share of intra-regional GVC activities is the highest among the 3 regional production networks; North America ranks second and Asia third. However, ten years after the financial crisis, along with the rising scale of the regional economy, the share of intra-regional GVC activities in “Factory Asia” exceeded that of “Factory North America”, especially in complex GVC participation. In contrast, the share of intra-regional GVC activities has declined in both “Factory Europe” and “Factory North America” and their share of inter-re-gional production sharing activities has increased, especially their GVC linkage with “Factory Asia”.
In “Factory Asia”, the increase of cross-country production sharing activities in the last decade was led by intra-regional complex GVC activities. This share increased from 38.5%/39.6% of Asia’s total forward/backward complex GVC activities in 2000 to 43.9%/46.2% in 2017. Another notable development was the market-driven enlargement of “Factory Asia”, as more Asian lower middle-income countries were integrated into Asian production network during this period. In the “Rest of Asia”, the shares of forward and backward GVC activities rose from 10.2% to 11.8% and from 16.6% to 19.4%, respectively. However, the importance of North America and Europe as both destinations of Asia’s GVC exports (Figure 1.10, forward GVC activities) and sources of Asia’s GVC imports (Figure 1.10, backward GVC activities) has declined.
In Europe, the decline in complex GVC activities represent-ing the breadth of regional production linkages is much more than that of simple GVC activities. In particular, the share of intra-regional complex forward GVC participation decreased by 6.7 percentage points in the last decade, from 47.6% to 40.9%, and intra-regional backward complex cross-border
FIGURE 1.10 Forward and backward (simple/complex) GVC participation, share of intra-and inter-regional GVC activities in manufacturing, (%), 2000 and 2017, Asia
Simple forward GVC activities in manufacturing
Simple backward GVC activities in manufacturing Complex backward GVC activities in manufacturing
Complex forward GVC activities in manufacturing
42.0
13.3
27.2
17.5
10.4
45.5
9.0
18.1
27.4
11.2
0.0
5.0
10.0
15.0
20.0
25.0
30.0
35.0
40.0
45.0
50.0
0.0
5.0
10.0
15.0
20.0
25.0
30.0
35.0
40.0
45.0
50.0
Asia EU NAFTA ROW Simple GVCPt_F
Asia EU NAFTA ROW Simple GVCPt_B
Asia EU NAFTA ROW ComplexGVCPt_B
Asia EU NAFTA ROW ComplexGVCPt_F
The rest of Asia
East Asia
Western EU
Eastern EU
38.5
22.820.5
18.2
7.7
43.9
22.5
15.618.0
7.8
2000 2017
2000 2017
The rest of Asia
East Asia
Western EU
Eastern EU
41.1
12.2
24.8 21.9
7.8
48.5
6.9
15.0
29.6
7.4
0.05.0
10.015.020.025.030.035.040.045.050.0
39.6
21.816.8
21.8
9.7
46.2
23.7
12.817.8
9.3
0.0
10.0
20.0
30.0
40.0
50.0
The rest of Asia
East Asia
Western EU
Eastern EU
The rest of Asia
East Asia
Western EU
Eastern EU
Note: the last set of bars represent the overall GVC participation ratios for Asia in 2000 and 2017. The country groups refer to footnote 5.
Source: the UIBE GVC indexes derived from ADB 2018 ICIO tables.

Recent patterns of global production and GVC participation • 21
production sharing activities fell by more than 8 percent-age points, from 41.1% to 33.0%. This was mainly due to the relative decline of intra-regional GVC linkages in Western Europe, since this share in Eastern Europe increased during this period. The shares of inter-regional production sharing activities between Europe and Asia and Rest of the World also increased; the manufacturing links between Europe and Asia are more reflected in the complex GVC activities, and the man-ufacturing links with Rest of World are more reflected in the simple GVC activities. For instance, the share of Asia as the destination of Europe’s complex GVC exports and the share of Asia as the source of Europe’s complex GVC imports both increased by over 4 percentage points, from 12.9% to 17.3% and 12.3% to 16.6%, respectively. East Asia contributed 79.9% and 81.4% of these changes, respectively. The share of Rest of the World as the destination of Europe’s simple GVC exports and as the source of Europe’s simple GVC imports increased from 12.1% to 20.8% and 15.0% to 25.0%, respectively during this period.
In North America, the share of intra-regional complex GVC activities in forward/backward linkages fell by 6.7% and 8.1% from 2000 to 2017, respectively, although the share of intra-re-gional simple GVC activities changed slightly. The concomitant rise in the share of inter-regional complex activities reflects the more globalized supply chains in North America today compared to 17 years ago (recall that complex GVC activities involves prod-ucts that cross national borders at least twice, which has been the most important driving force behind globalization). More-over, the development is not only reflected in the manufacturing sectors, but also in services sectors. For instance, in telecommu-nication, financial and business services, North America’s share of both GVC exports to and GVC imports from Asia and Europe exceeded its share of intra-regional GVC activities in 2017, par-ticularly for complex GVC activities.6 This reflects the intensive outsourcing of services from the United States to Asian countries (such as India and Philippines), and the tightly linked financial and business service supply chain activities between North America and Europe.
FIGURE 1.11 Forward and backward (simple/complex) GVC participation, share of intra-and inter-regional GVC activities in manufacturing, (%), 2000 and 2017, Europe
Simple forward GVC activities in manufacturing
Simple backward GVC activities in manufacturing
Complex forward GVC activities in manufacturing
Complex backward GVC activities in manufacturing
2000 2017
Asia EU NAFTA ROW Simple GVCPt_F
10.2
62.4
15.312.1
16.616.4
50.0
12.9
20.8 19.7
0.05.0
10.015.020.025.030.035.040.045.050.055.060.065.0
0.05.0
10.015.020.025.030.035.040.045.050.055.060.065.0
0.05.0
10.015.020.025.030.035.040.045.050.055.060.065.0
0.05.0
10.015.020.025.030.035.040.045.050.055.060.065.0
The rest of Asia
East Asia
Western EU
Eastern EU
12.9
62.5
12.8 11.8 12.617.3
59.6
9.713.3
18.9
The rest of Asia
East Asia
Western EU
Eastern EU
Asia EU NAFTA ROW Simple GVCPt_B
9.7
60.0
15.3 15.011.2
16.2
46.3
12.5
25.0
11.8
The rest of Asia
East Asia
Western EU
Eastern EU 2000 2017
12.3
63.6
10.7 13.3 15.116.6
64.6
Asia EU NAFTA ROW ComplexGVCPt_B
Asia EU NAFTA ROW ComplexGVCPt_F
7.411.5
23.1The rest of Asia
East Asia
Western EU
Eastern EU
Note: the last set of bars represent the overall GVC participation ratios for Europe.
Source: the UIBE GVC indexes derived from the ADB 2018 ICIO tables.

22 • Technological innovation, supply chain trade, and workers in a globalized world
2. The changing distribution of value-added along typical GVCs7
This section uses “smile curve” analysis to discuss how the distri-bution of value added across countries and industries via GVCs changes when more and more developing countries are partici-pating in global production networks.
The concept of the smile curve was first proposed around 1992 by Stan Shih, the founder of Acer, a technology company headquartered in Chinese Taipei (Shih 1996). In the personal computer industry, Shih observed that both ends of the value chain bring higher value added to the product than the middle part. In business management theory, the smile curve is a graph-ical depiction of how value added varies across the different stages of bringing a product to the market in a manufacturing industry. The logic of the smile curve has been widely used in case studies of individual firms, but rarely identified, measured, and evaluated at the country level by using real data with explicit consideration of GVCs. As we show in the 2017 GVC Develop-ment Report, by borrowing the image of the smile curve and con-sistently measuring both the value-added gains from GVC par-ticipation and the distance between producers and consumers
through a recently-developed input-output based methodology (see Ye, Meng et.al., 2015; Meng, Ye et.al., 2017), the relationship between value-added distribution and GVC participation can be empirically identified and drawn for various GVCs.8
In Figures 1.13 and 1.14, we take the final goods exports of Mexico’s ICT industry and Japan’s auto industry as examples. The y-axis of these figures shows compensation per employee (a proxy for technology level or a first-order approximation of labor productivity)9 in constant 2000 U.S. dollars, and the x-axis denotes distance showing how far a specific participating coun-try and industry pair in the particular GVC of interest is away from global consumers.10 The data used is from the WIOD (2016 ver-sion), which covers 43 economies and 56 industries over 15 years (2000-2014), with the total number of GVC participants (43 × 56 = 2,408) represented as circles in these figures. The size of the circle represents the absolute value added created by joining the corresponding GVC (the minimum threshold for inclusion in the figure is 0.1% of the total value-added gain measured in million U.S. dollars). The smooth line is fitted by local polynomial regres-sion–smoothing weighted by its value-added volume, and the shadowed area represents the confidence interval around the smooth line. Using the estimated smile curve can enhance our
FIGURE 1.12 Forward and backward (simple/complex) GVC participation, share of intra-and inter regional GVC activities in manufacturing, (%) 2000 and 2017, North America
Simple forward GVC activities in manufacturing
Simple backward GVC activities in manufacturing
Complex forward GVC activities in manufacturing
Complex backward GVC activities in manufacturing
Asia EU NAFTA ROW Simple GVCPt_B
2000 2017
Asia EU NAFTA ROW Simple GVCPt_F
18.6 17.0
51.5
12.98.7
19.8
11.4
49.0
19.8
10.2
0.0
10.0
20.0
30.0
40.0
50.0
60.0
0.0
10.0
20.0
30.0
40.0
50.0
60.0
0.0
10.0
20.0
30.0
40.0
50.0
60.0
0.0
10.0
20.0
30.0
40.0
50.0
60.0
The rest of Asia
East AsiaWestern EU
Eastern EU
2000 2017
Asia EU NAFTA ROW ComplexGVCPt_F
19.422.2
47.6
10.86.5
22.7 23.6
40.9
12.77.0
19.416.1
48.2
16.3
6.3
20.9
8.9
49.0
21.2
7.5
The rest of Asia
East Asia Western EU
Eastern EU
The rest of Asia
East AsiaWestern EU
Eastern EU
Asia EU NAFTA ROW ComplexGVCPt_B
19.825.5
41.1
13.58.2
23.0
30.7 33.0
13.09.6
The rest of Asia
East Asia Western EU
Eastern EU
Note: the last set of bars represent the overall GVC participation ratios for North America.
Source: the UIBE GVC indexes derived from the ADB 2018 ICIO table.

Recent patterns of global production and GVC participation • 23
FIGURE 1.13 Mexico’s ICT final goods exports related value chain, 2000 and 2014
Note: y-axis represents the compensation per employee in constant thousand U.S. dollars (base year: 2000); the x-axis represents the length of the correspond-
ing production chain in average stages of production.

24 • Technological innovation, supply chain trade, and workers in a globalized world
FIGURE 1.14 Japan’s auto final goods exports related value chain, 2000 and 2014
Note: -axis represents the compensation per employee in constant thousand U.S. dollars (base year: 2000); the x-axis represents the length of the corresponding
production chain in average stages of production.

Recent patterns of global production and GVC participation • 25
understanding of the participants (countries and industries) of a specific GVC as well as their positions and economic gains from the chain.
The plotted GVC for Mexico’s ICT (MEX17) final goods exports to the world market in 2000 clearly appears as a smile curve (see Figure 1.13). The main participants in the pre-fabrication stages (upstream) of this value chain comprise many US industries, such as ICT (USA17), wholesale trade (USA29), legal accounting, head offices, management consultancy activities (USA45), electrical equipment (USA18), fabricated metal products (USA16), machin-ery and equipment n.e.c. (USA19), and chemicals (USA11); some Mexican domestic industries, such as chemicals (MEX11), machin-ery and equipment n.e.c. (MEX19), electrical equipment (MEX18); and several Japanese industries such as ICT (JPN17), basic metals (JPN15), and fabricated metal products (JPN16). The main partic-ipants in the post-fabrication stages (downstream) comprise US industries such as wholesale trade (USA29), retail trade (USA30), warehousing (USA34) and so on. Most participating industries upstream and downstream in Mexico’s ICT exports-related value chain are from the US and Japan, countries with high levels of labor compensation, while most participating industries in the middle of the value chain are from the Mexico’s domestic indus-tries with low levels of labor compensation. Therefore, the whole chain naturally appears as a smile curve.
However, the shape of the curve changed significantly in 2014, from a smile curve to a kind of “W” curve. At least three fac-tors contributed to the remarkable changes in the shape of this smile curve. One was the rapidly increasing presence of Chinese industries in Mexico’s value chain upstream. As seen in 2014, many Chinese industries with low compensation per employee, such as ICT (CHN17), wholesale trade (CHN29), mining (CHN4), electrical equipment (CHN18), machinery and equipment n.e.c. (CHN19), and basic metals (CHN15), replaced other countries’ positions in the Mexican value chain. Those Chinese industries became some of the main players, with a large value-added gain in the pre-fabrication stage of this value chain. This reflects the fact that producing ICT exports in Mexico used more Chinese intermediate inputs directly and indirectly. The second factor was the rapid technological upgrades that occurred in the US ICT industry (USA17), indicated by the simultaneous increase in compensation per employee and maintenance of a large volume of value-added gain. This implies that Mexico’s ICT produc-tion was highly dependent on high-tech US intermediates. The third factor was the increasing volume of value-added gain by Mexico’s service industries (legal accounting, head offices, man-agement consultancy activities (MEX45); other professional, scientific, technical, and veterinary activities (MEX49)) in the pre-fabrication stage. All these developments may have also contributed to the overall expansion of Mexico’s ICT value chain, as the entire length (x-axis) of this chain increased from 6.8 to 8.3 between 2000 and 2014.
Japan’s final auto (JPN20) products exports-related value chain also experienced a dramatic change from a smile curve to an inverted smile curve-a frown from 2000 to 2014 (Figure 1.14). To some extent, this may have reflected the successful transition
of Japan’s auto industry from traditional mass producer to mass customizer, based on digital technology and artificial intelli-gence, similar to what happened in German’s auto industry (as reported in the 2017 GVC Development Report). The mass cus-tomized manufacturing stage accounted for a relatively large portion of the total value gain, while the traditional high-end design and sales functions accounted for only a small portion of total value-added creation, mostly by producers from foreign countries. This is contrary to the typical intuition from the smile curve, in which traditional manufacturing stands only at the low end of the value chain, such as Mexico’s ICT final goods exports in 2000. But it could also reflect the ongoing structural change in GVCs, such as the emergence of the customer to manufacturing (C2M) business model in several industries. The most important changes between 2000 and 2014 were the increasing number and variation of foreign participants and the increasing length of the curve. In 2000, the United States and Germany dominated foreign participants upstream and downstream, while in 2014, more industries from foreign countries were involved, especially industries from China. This clearly reflects the increasing diversity and complexity of international fragmentation in Japan’s auto production. In addition, given the increase in labor compensa-tion and absolute volume of value-added gain in Japan’s auto industry, along with the relatively low level of labor compensa-tion of upstream and downstream participants from China, the slope of the entire curve became much steeper. This implies that Japan’s auto sector has enhanced its comparative advantage by outsourcing more upstream and downstream tasks that were for-merly done by Japanese employees to China through GVCs.
3. The topology and structure change of GVC production and international trade11
Network analyses have been used widely to visually simplify the image of GVC activities given their increasing complexity (see Ferrarini, 2013; Ferrantino and Taglioni, 2014; Zhou, 2016; Xiao et al., 2017). Unlike the literature in international trade-related net-work analyses, we separate bilateral trade flows across countries into three types of networks (traditional trade networks, simple GVC networks and complex GVC networks) based on the pro-duction activity decomposition method proposed by Wang et al. (2017) (see Box 1.2).12 The network analysis in this section provides a new view about how trade and production sharing activities are concentrated among bilateral trade partners, as well as the changing interdependency among trading partners in different networks.
One conclusion of the network analysis, which covers 62 coun-tries and 35 sectors from 2000 to 2017, is that the topology struc-ture of networks (at the aggregate and individual sector levels) changes only gradually. Even the financial crisis of 2008 did not result in a significant change in the network topology in 2009. This implies that the structure of global production networks expressed by the topology of country to country relationships is resilient, even when economic shocks of a large magnitude hit

26 • Technological innovation, supply chain trade, and workers in a globalized world
the global economy. Therefore, this analysis considers only the long-term change from 2000 to 2017.13 We consider both the networks for the aggregate economy (all goods and all services), as well as selected typical GVC sectors (textile, ICT, and ser-vices) as examples.
3.1 Supply hubs of value-added tradeSupply hubs of value-added trade at the aggregate levelAs shown in the upper-left part of Figure 1.15, the three large regional supply hubs in the traditional trade networks in 2000 were the US, Germany and Japan. Obviously, these three hubs have very important linkages with their neighbor countries. The US has strong linkages to its two North American part-ners, Canada and Mexico, the two large Asian countries, Japan and the Republic of Korea, and Brazil, India and Australia. Japan can also be considered as a regional supply hub in the Asia-Pacific region, since the US, China, the Republic of Korea, Chinese Taipei and many Asian countries have Japan as their most important value-added supplier through final product trade. Germany is the largest supply hub in the European area, because the majority of value-added imports in final products by almost all European countries is from Germany. When zoom-ing in the figure, we can also find some small regional hubs in the European area, such as the UK, France, Italy, Spain, Bel-gium, and Russia, and in the Asia-Pacific region, such as China, the Republic of Korea, India, Thailand, and Singapore, who have more than two linkages with other countries.
Comparing the situation of 2000 to that for 2017 (the upper-right part of Figure 1.15), it seems there was no significant change in the network topology in Europe and North America, but dramatic changes occurred for Asia: China took over Japan’s position and became a global supply hub of value-added export through final products trade. China not only had important link-ages with other hubs (the US and Germany), but also with its Asian neighbors (Japan, the Republic of Korea, Chinese Taipei, and almost all Asian countries) and other emerging countries
(Russia, Brazil, India). When comparing the magnitude of the value-added flows across countries over time, it is easy to see that the linkages between China and other main regional hubs as well as its surrounding countries became much thicker.
The middle-left part of Figure 1.15 shows the simple GVC trade networks for all goods and services in 2000. Compared to the traditional trade networks, the US was a global supply hub with important outflow linkages to the other two regional hubs, Germany and Japan. Some remarkable differences can be observed within each region. For example, compared to the traditional trade networks, more extra-regional countries had the US as their main supplier of value added through simple GVC trade. This also reflects the fact that US intermediate prod-ucts were greatly used as inputs for many countries to produce domestically-used final products. The UK, which was a sub-hub in Europe in the traditional trade networks, becomes a sub-hub with important linkage with the US in the simple GVC trade networks.
A remarkable structural change in the simple GVC trade net-works occurred between 2000 and 2017 (the middle-right part of Figure 1.15). In 2017 there was no longer any important link-age between any two hubs, as simple GVC activities became more concentrated within Europe, North America and Asia. The US and Germany connected to each other indirectly through the Netherlands. The number of countries with strong linkages to the US decreased dramatically, as most of the surrounding linkages moved to China. Germany maintained its position as a regional supply hub in Europe with strong linkages to more countries. China replaced Japan and part of the US position and became the second largest supply hub in terms of both the magnitude of its value-added exports and the number of strong linkages to other countries.
Looking at the evolution of the complex GVC trade networks from 2000 to 2017 (see the bottom panel of Figure 1.15), trade became more concentrated among regional trading partners, and there was no important direct linkage among regional hubs.
BOX 1.2How network graphs are drawn in our GVC analysis
We draw two types of networks from ADB ICIO data to identify the hubs of various networks from importer and exporter perspectives. One takes a specific country as a supply hub if the majority of the imports by most countries in the network is from that country. Another takes a spe-cific country as a demand hub if the majority of the exports from most countries in the network goes to that country. In our network figures, the size of the bubble represents the share of a country’s value-added exports or imports in total value-added exports or imports. The share of value-added flow between each trading partner in total value-added flow is represented by the thickness of the linkage. The
arrow of the linkage shows the direction of the value-added flow. Two tests are used to determine whether a linkage line appears between trading patterns (taking the case of supply hub related networks as an example): 1) if country A takes the largest share in country B’s value-added imports, a linkage will be shown from A to B; or 2) if country A’s share in country B’s value-added imports is larger than 25%, a linkage will be shown from A to B. The first standard is the so-called “Top1” threshold widely used in network analyses to identify the most important linkages. The second stan-dard is used to adjust the density of the network, in order to avoid losing other important linkages.14

Recent patterns of global production and GVC participation • 27
The US connected with Germany indirectly through two coun-tries, Luxembourg and the UK. In addition, the volume of Chi-na-made intermediates used as inputs for its downstream coun-tries to further produce exporting products increased rapidly over the period as seen from the bubble size change for China.
Supply hubs of value-added trade in various networks for selected sectorsThe topologies and changes in structure over time in individ-ual sectors may differ considerably from the aggregate patterns shown above. Figure 1.16 shows the textile sector related networks.
Obviously, there were many regional supply hubs in the traditional trade networks in 2000. There were three main regional supply hubs in Europe, Germany, Italy and the UK, who exported textile sector value-added to their trading partners through final goods trade. Germany and the UK connected indirectly through Turkey. India was also a sub-supply hub with inflow linkage from the UK and outflow linkages to Nepal and Bangladesh. The presence of Italy, as the most traditional country with strong fashion sectors, can be clearly identified in these networks. This is very different from the networks at the aggregated level shown in Figure 1.15, in which Italy’s presence in the textile sector is largely masked.
FIGURE 1.15 Supply hubs of trade in value-added in various networks at the aggregate level
Traditional trade networks (all goods and services)
Simple GVC trade networks (all goods and services)
Complex GVC trade networks (all goods and services)
PAKHKG
CHN
JPN
SRIVIE
PHI
SIN
MDVBAN LAO
CAMBRN
THAMALIDN
TAP
KORAUS
FIJ
INDBTN
NPL
USA
MEX
CAN
BRA
GBRFRA
ITA
NLDSWE
NOR
BEL
LUXMLT GRC
ESP
PRT
CYP
IRL
AUT
DNK
CHE
POLFIN
EST
CZE
HUNROM
SYNHRVSVK
LVABGR
KGZ MON
KAZ
LTU
TUR
RUS
DEU
KAZ
LTU
DEU
GBRFRA
PRT
NOR
MLT
CYP HKGCHE
LVA
FIN
DNR
CZEHUN
ROMSVK LUX BGR
HRV
BRN
AUS
SVN
DEU
ITAESPNLD
LTU
BEL
SWE
AUT
GRC
EST
CHNMAL
VIE
IDN TAPTUR THA
RUS
KGZ MON
PHI PAKLAO
FIJ
BRA
JPN
KOR
INDSRI
BTN NPL
BANCAM
IRL
KAZ
USA
CAN
MEX
SIN
MDV
CAMLAO
CHNJPN
VIE
BRN
IDN TAPKOR
AUS
SIN
IND
BTNNPL
USA
CANFRA
ITA
NLDESP
PRT
CYPIRLAUT
FIN
CHE
DNK
POL
CZEHUN
ROMHRV
SVN TUR EST
KGZ
LVA
RUS
DEU
BGR
LTU
DEU
GBR
BEL
LUX
SWE
NOR
SVK
KAZ MON
THAMAL
GRC
MEX
MLT BRA
FIJPAKMDV
BAN
PHIHKG
SR
LAO
VIEPHI
NPL
IDNAUS
GBRFRA
AUT
DNK
CHE
CZE
HUN
BGRGRC SVN TUR
LVA
RUS
DEU
PAK
LTU
DEU
NLD
ESPPRT
NOR
SRI
KAZMON
HKG MALFIJ
LUXMLT
ITA
SWE
ROMFIN
EST
SVK
HRVCYP
KGZCAM
CHN
BTNBTN
IND
KOR
JPN
THA
TAP
BAN
CAN
MEXSIN
BELIRL
MDV
BRA
USA
LAO
CHN
FRA
ITANLDESP
PRT
CYP
LUXAUT
FIN
SWE
CZE
POL
HUN
ROM
SVN TUR
KGZ
LVA
DEU
BGR
LTU
DEU
GBR
BELNOR
KAZ
MON
GRCCAN
BRA
VIE
IDN
TAP
KORSIN
INDBTN
NPLTHA
MALFIJ PAK
PHIHKG
DNK
CHE
EST
SVKMLT
HRV
RUSJPN
BAN
CAM
BRN
MEX
USA
IRL
AUS
BTN
GBRFRA
MLT
LUXAUT
CHE
ITA
CZENOR
ROM
SVN TURKGZ
PRTBEL
KAZ
CYP
GRC
CAN
BRA
IDN
TAP
THAAUS
POL
SVK EST
LVA
RUS MEX
USA
ESP
BGR
NLD
SWE
DNK
FINHUN
HRV
LTU
MAL
BRNIND
NPL MDVFIJ
KOR
DEU
BAN
HKG
VIEPHI
PAK MON SRILAO
CAM
CHN
IRL
SIN
JPN
2000 2017
2000 2017
2000 2017
Note: the size of the circles represents the magnitude of value-added exports. The volume of value-added flow between each pair of trading partners is repre-
sented by the thickness of the line linking the two.
Source: Meng et al. (2018) based on the UIBE GVC indexes derived from the ADB 2018 ICIO table.

28 • Technological innovation, supply chain trade, and workers in a globalized world
The structure of textile networks changed dramatically from 2000 to 2017. China became the largest and the unique global supply hub; in the figure China has pushed away all the other regional hubs and surrounding countries to the periphery of the traditional trade networks. This phenomenon is consistent with the fact that textile final goods made in China can be found every-where in the world. Mixed reasons may explain this phenomenon. China already had substantial textile production capacity in its early stage of development. Thus it easily joined GVCs by export-ing more final textile products when tariff and non-tariff barriers decreased in other countries after its WTO accession. Moreover,
China had a significant comparative advantage in exporting appar-els, given its large labor force with lower wages, while FDI inflows from developed countries helped make China the largest exporter of textile and apparel products in the world. By 2017, China’s tex-tile sector played a dominant role in traditional trade networks as well as the simple and complex GVC trade networks. This implies that China is gradually upgrading its textile sector, and thus can export more intermediates to other countries through GVC trade. Although China has grown to become a new rival in GVC trade through upgrading of intermediate exports of textile, Italy can still maintain its position as a regional hub especially in the complex
FIGURE 1.16 Supply hubs of trade in value-added in various networks for the textile sectorTraditional trade networks (textile sector)
Simple GVC trade networks (textile sector)
Complex GVC trade networks (textile sector)
TUR
ITA
FRABEL
PRT
ESPROMBGR
GRCSVN
HRV
FIN
ESTLTU
SWE
DNKNOR
POLNLD
AUT
HUN
CZECHE
SVK LVA LUX IRLGBR
MLTCYP
IND
BTNNPL
IDN
PAKJPN
PHIBAN TAP
THA
KOR
MAL
MONSIN
BRNLAO
MDVCAM
KGZ
HKGSRIRUS
KAZFIJ
AUSVIE
MEXUSA
CAN
BRA
DEU CHN LUXSVK
AUT
HUNCHEHRVGRC
CYP
IRL
PRT
HKGMLTFIJSINMON
LAORUS
MALAUS
PHI TAP JPN PAK
KOR
BRNBAN
MDV BTN
IND
NPL
IDN CAM
VIE ESTLTUBGRROM
CAN
USA
MEX
FRA
ESPPOL
BEL NLD CZE DNK SVE FINSVN
LVANOR
KGZKAZ
BRA
THA
TUR
ITA
DEU CHN
GBR
GRC
BOR
MLT
SVN
HRV
ROMPRT FRA
CHEHUN
LUXSVK
POLCZEAUT
IRL
GBR
ESPBEL
NLDNOR
LTU SVE FIN DNK EST LVAKAZ
HKGFIJ
KGZSIN
BRAMEX
CANIDN
KOR
CAMJAP
TAPIND
BTNBAN
THA
MDVSRIPAK
AUSMAL
PHIMON
LAOBRN
RUS
CYP VIE
DEU
ITA
TUR
USACHN
NPL
AUT
NLD
CHE
POLCZE
HUNFIN
SVN LTU HRV SVKLVA
PRT
GRCROM
FRAESP
FIJ
BTN
PHIPAK
THA
AUS
IND
CAMLAOCYP
MDVSRIVIE
RUS
KAZ
SINIDN
BRA USA
MEX
CAN
LUXKGZ
MONBAN MAL
HKGNPL
BRN
DEU
BGR
ITA
CHN
JAP TAP
KOR
TUR
MLTBEL
EST
SWEIRLDNK
NOR
GBR
2000 2017
2000 2017
2000 2017
MDV
FRAESP
ITA
TUR
MLT
EST
SWE
IRLDNKNOR
GBR
BEL
GRC
ROMBGR
AUTNLD
CHE
POL
CZE
HUNFIN
SVN LTUHRV
SVK
LVA
DEU
PRT
LUX
MONMAL
HKG
NPL
CYP
SRI
VIERUS KAZ
SIN
IDNBRA
KOR
PAK
CAMLAO
TAP
PHI
JAP
CHN
BAN
FIJ
AUS
THAIND
BTNBRN
MEX
CAN
KGZ
USA
LUXIRL
BEL NLD NOR
FINDNK
ESTLVA
KAZKGZ
MLT
ROMPRT
FRA
HUN SVK
CHE
CZE
POL
AUT
SVN
HRVITA
DEU
BGRLTU GRC
TUR
MEX
CAN
USABRA
IDNKOR
VIEJAPTAP
IND
BTNBAN
THA
MDV
PAKAUS
MALPHI
MONLAO
BRN
SRI
SIN
FIJ
HKG
SWEESP
GBR
NPL
CAM
CHN
CYPRUS
Note: the size of the circles represents the magnitude of value-added exports. The volume of value-added flow between each pair of trading partners is repre-
sented by the thickness of the line linking the two.
Source: Meng et al. (2018) based on the UIBE GVC indexes derived from the ADB 2018 ICIO table.

Recent patterns of global production and GVC participation • 29
GVC trade networks. This indirectly reflects the strength of Italy’s technology in producing complex textile products compared to other European countries whose presences have declined in com-plex GVC trade networks over time.
The network topology for ICT experienced dramatic changes from 2000 to 2017 (Figure 1.17 shows the ICT sector’s val-ue-added exports related networks). In 2017, China took over Japan’s position, becoming a global supply hub in both tradi-tional trade and simple GVC networks. Inside Asia in 2017, Japan, the Republic of Korea and Chinese Taipei played very important roles as sub-hubs. The US became a largely regional supply hub,
keeping just important linkages with a limited number of coun-tries. Japan’s presence decreased dramatically, as it moved from a global supply hub in the traditional trade networks and regional supply hub in the simple GVC networks in 2000 to the periph-ery of the Asia-Pacific region in 2017. These changes reflect the so-called industrial hollowing15 out in the US and Japan’s ICT sectors (especially for final goods production), accompanied by large scale FDI from these countries to China. The latter made an important contribution to China’s ICT development, since even in recent years more than half of China’s ICT exports were pro-duced by foreign-owned enterprises.
FIGURE 1.17 Supply hubs of trade in value-added in various networks for the ICT sector
Traditional trade networks (ICT sector)
Simple GVC trade networks (ICT sector)
Complex GVC trade networks (ICT sector)
MONMDV
BRA
PAK
CAM
BRN
MEX
CANGBR
FRA
SWE
IRL
NORITAFINNLD
LVAEST NPL MLT
AUTBEL
ESPDNK
HUNPOL
ROM
CZE
LTUSVK
PRT
SVN
LUXHRV
GRCBGR CYP
KAZ KGZ
CHN
HKG
FIJBAN
LAOSRI
VIETHA PHI
TAP
KORMAL
AUS
IND
BTN
USA
SIN
JPN
TUR
DEU
IDN
CHE
BEL
KGZ
ROM
SVN
HRVBGR
LTU
TURVIE
JPN
IND
BTN
BAN
THA
AUS
MAL
MON
LAO
SRI
RUS
CHEFRA
ITAAUT
PHIDNKFIN
NOR
POL
LVA
HUN
ESPPRT
CAN
MEX
IDN
TAP
SINBRN
SVK MDV
KAZ
IRLBRA
FIJ
CAMHKGCYPPAKGRC
MLTLUX
EST
GBRCZE
CHN
NPL
KOR
USA
SWE
DEU
NLD
BEL
KGZROM
SVN
HRVBGR
LTU
TUR
VIE
INDBTN
BAN
THAAUS
MAL
MON LAOSRI
RUS
CHE
FRA
ITA
AUT
DNKFIN
NOR
POL
LVA
HUN
ESP
PRT
CAN
MEX
IDN
BRN
SVK
MDV
KAZ
BRA
FIJ
CAMHKG
PAK
GRC
MLT
LUX
EST
GBR
CZE
NPL
SWE
NLD
JPNTAP
KOR
PHI
IRL
DEU CHN USA
CYP
SWE
IRL
NOR
NLD
LVAEST BEL
DNKLUX
KAZ
KGZ
ESPFIN
IDN
KOR
MON
MDV
PAKBTN
FIJ
BAN
LAO
SRIVIE
THA
AUS
BRN
HKG
CYP
ROMPRT
CHE
POL
CZE
MLTAUT
HUN
LTU
ITA
TUR
IND
CAM
RUS
BRA
DEUCHN
MEX
CAN
TAPBGRGRC
HRVSVK
SVN
FRA
NPL
USA
PHIMAL
GBR
SIN
JPN
MDV
BEL
ROM
SVNHRV
BGR
LTU
RUS
CHE
FRA
ITA
AUT
DNK
FIN
NOR
POL
LVA
HUN
ESP
PRT
SVK
GRC
MLT
LUX
EST
GBRCZESWE
DEU
CYP
KGZ
BAN
MONLAO
SRI
KAZ
FIJ
CAMHKG
PAK
NLD
BRA
KOR
JPN
PHI
BTN THA
TUR NPLAUSVIE
TAPIDN
CHN
CANMEX
BRN
IRL
MAL
SIN
USA
IND
2000 2017
2000 2017
2000 2017
SWE
IRL
NOR
NLDLVA EST
BELDNK
LUX
KGZESP
FIN
MEX
CAN
IDN
KOR
MON
MDVPAKBTNFIJ
BAN
LAO
SRIVIE
THA
PHIJPN
TAP
AUS
SIN
BRN
HKG
CYP
HRVSVN BGR
ROMPRT
FRA
CHE
POL
CZE
MLTAUT
HUN
SVK GRC
DEU
ITA
TUR
IND
CHN
USA
NPL
GBR
CAM
RUS
BRA
MAL
Note: the size of the circles represents the magnitude of value-added exports. The volume of value-added flow between each pair of trading partners is repre-
sented by the thickness of the line linking the two.
Source: Meng et al. (2018) based on the UIBE GVC indexes derived from the ADB 2018 ICIO table.

30 • Technological innovation, supply chain trade, and workers in a globalized world
Nevertheless, the US and Japan remained important hubs in complex GVC networks in 2017, in terms of both the volume of value added traded and the number of countries with strong linkages. The US and Japan were still the main suppliers of com-plex intermediate goods used by downstream countries through complex GVC activities. At the same time, China’s ICT sector exported more value added through both simple and complex GVC trades. This provides some evidence of the ongoing indus-trial upgrading in China’s ICT industries, since more intermediate products have been made in China.
The US was the largest supply hub for services in 2000 in the traditional trade networks (Figure 1.18 shows the services sec-tor’s value-added exports related networks). The US had sig-nificant outflow linkages to Canada and Japan, and indirectly connected with the other supply hub, Germany, through third countries (Ireland and the UK) in 2000. In 2017, however, the US had few direct outflow linkages going to Asia. In 2017, Germany maintained its presence as a regional supply hub with import-ant linkages to other sub-regional hubs (France and Italy), lost its linkage with the sub-regional hub Russia, and added a linkage
FIGURE 1.18 Supply hubs of trade in value-added in various networks for the services sector
Traditional trade networks (services sector)
Simple GVC trade networks (services sector)
Complex GVC trade networks (services sector)
SWE
IRL
NOR
LVA
EST
BEL
DNK
LUX
KAZ
KGZ
FIN
IDNMON
MDV
PAKBTN
FIJ
BAN
LAO
SRI
VIETHA BRN
HKG
CYP
ROM
PRT
CHE
POL
CZE
MLT
AUT
HUNLTU
TUR
CAM
BRA
TAPBGR
GRC
HRVSVK SVN
NPL
PHI
MAL
GBR
SIN
NLD
CHN
CAN
ITA
ESP
FRA
DEU
RUS
JPN
USA
KOR
AUS
IND
MEX
MDV
BEL
ROM
SVN HRV
BGR
LTU
RUS
AUT
DNK
FIN
NOR
LVA
HUN
PRT
SVK
GRC
MLT
LUX
EST
CZE
CYP
KGZBAN
MON
SRI
KAZ
FIJ
CAMHKG
NLD
BTN
THA
NPL
AUS
VIE
TAP
IDN
CAN
MEX
BRN
IRL
MAL
JPN
SIN
TUR
FRA
ITA
CHEPOLESP
SWE
PAK
BRA
DEU
LAO
IND
KOR
THA
GBR
USA
CAN
IDN
MON
MDV
PAK
BTN
FIJBAN
LAO
SRI
VIE
THA
BRNCAMNPL
PHI
MAL
SIN
CHN
INDTAP
KORAUS
JPN
HKG
IRL
NOR
LVA
EST
BEL
DNK
LUX
KAZ
KGZ
CYP
ROM
PRTCHE
POL
CZE MLT
AUT
HUN
LTU
TUR
BRA
BGR
GRC
HRV
SVKSVN
MEX
NLDITA
ESP
FRA
DEU
SWE FIN
GBR
USA
RUS
MDV
ROM
SVNHRVBGR
LTU
AUT
DNK
FIN
NOR
LVA
HUN
PRT
SVK
GRC
MLT
LUX EST
CZE
CYP
KGZ
BANMON
SRIFIJ
CAM
HKGBTN
THA
NPL
AUS
VIE
TAP
BRN
IRL
MALSIN
TUR
CHEPOL
ESP
PAK
BRA
LAOIND
KAZ
CAN
MEX
NLD
FRAITA
IDN
KOR
PHI
BEL
DEU
GBR
RUS
CHN
JPN
USA
SWE
CAN
IDN
MON
PAK
BTNFIJBAN
LAOSRI
VIE
THA
BRN
CAM
NPLSIN
CHN
IND
TAP KORAUS
IRL
NOR
LVA
ESTDNK
LUX
KAZ
KGZ
CYP
ROM
PRT
CHE
POL
CZE
MLT
AUT
HUN
LTU
TUR
BRA
BGR
GRC
HRV
SVKSVN
MEX
ESPSWE
FINFRA
GBR
NLDITA
BEL
DEU
RUS
JPNPHI
MAL MDV
HKG
USA
MDV
ROM
SVN HRV
BGR
LTUAUT
DNKFIN
NOR
LVA
HUN
PRT
SVK
MLT
LUXEST
CZE
CYP
KGZ BAN
MON SRI FIJCAM
HKG BTN
THA
NPL
AUS
VIE
TAP
IRL
MALSINTUR
CHE
POL
ESP
PAK
LAO
KAZ
CAN
MEX
KOR
PHI
BEL
GBRFRAITA
BRA
BRNGRC
NLD
SWE
DEU
RUS
IDN
CHN
JPN
USA
2000 2017
2000 2017
2000 2017
CHN
Note: the size of the circles represents the magnitude of value-added exports. The volume of value-added flow between each pair of trading partners is repre-
sented by the thickness of the line linking the two.
Source: Meng et al. (2018) based on the UIBE GVC indexes derived from the ADB 2018 ICIO table.

Recent patterns of global production and GVC participation • 31
with the new sub-regional hub, Poland, in Europe. China took over Japan’s position in Asia and became a large supply hub with an important presence in exporting service sector value added to the US and other Asian economies in the traditional trade net-works. While China did not export a large amount of services to the global market directly, China was the largest manufacturing final goods exporter and the value added of China’s domestic services were embodied in these exports.
In the simple GVC trade networks, the US maintained its role as the largest supply hub in 2017, but lost some important trading
partners, such as the UK (which joined the European networks as a sub-supply hub), as well as Japan, the Republic of Korea and Hong Kong, China (which have joined the Asia networks as sub-hubs surrounding China). There was no longer any direct link-age between the US and Germany in 2017, but they indirectly linked to each other through the Netherlands. China took over Japan’s role, becoming a regional supply hub with an important inflow linkage from the US and outflow linkages to other Asian economies. This implies that China’s services sector directly and indirectly exported value added to other Asian economies
FIGURE 1.19 Demand hubs of trade in value-added in various networks at the aggregate level
Traditional trade networks (all goods and services)
Simple GVC trade networks (all goods and services)
Complex GVC trade networks (all goods and services)
DEU
CAN
IDN
MON
PAK
BTN
BAN
LAO
SRI
VIETHA
BRN
CAM
NPLSIN
CHN
TAPKOR
AUS
IRL
NOR
LVA
EST
DNK
LUX
KAZ
KGZ
CYPROM
PRT
CHEPOL
CZE
MLT
AUT
HUN
LTUTUR
BRA
BGR
GRC
HRV
SVK
SVN
MEXESP SWE FIN
GBR
NLD
ITA
BEL
RUS
JPN
PHI
MAL
MDV
HKG
FRA
FIJ
USADEU
MDV
ROM
SVN
HRV
BGR
LTUAUT
DNK
FINNOR
LVA
HUN
PRT
SVK
MLT
LUX
ESTCZE
CYP
KGZ
BAN SRI
FIJ
CAM
MONHKG
BTNTHA NPL
AUS
VIE
TAP
IRL
MALSIN
TUR
CHEPOLESP
PAK
LAO
KAZ
CAN
MEX
KOR
PHI
BEL
GBR
FRA
BRA
BRNGRC
SWE
RUS
CHNJPN
USA
NLD
INDIDN
IDN
MON
PAK
BTN
BAN
LAO
SRI
VIE
THA
CAM
NPL
SINTAP
KOR
AUS
IRL
NOR
LVA
EST
DNK
LUX
KAZ
KGZ
CYP
ROM
PRT
CHE
CZE
MLTAUT
HUN
LTU
TUR
BRA
BGR
GRC
HRV
SVKSVN
MEX
ESP
SWE
GBR
NLD
ITABELRUS
JPNPHIMAL
MDV
HKG
FRA
FIJ
USADEU
BRN
POL
CHN
CAN
FIN
IND
MDV
ROM
SVN
HRV
BGR
LTU
AUT
DNK
LVA
HUN
PRT
SVK
MLT
LUX
EST
CZE
CYP
KGZ
BAN
SRI
FIJ
CAMMON
HKG
BTN
THA
NPL
VIE
TAP
IRL
MALSIN
TUR
POL
ESP
PAK
LAO
KAZ
MEX
PHI
BEL
BRA BRN
GRC
SWE
RUS
NLD
IND
IDN
DEU
CHN
USA
KOR
JPN
CAN
GBRITA
FRA
FINCHE
DEU
IDN
MON
PAK
BTNBAN LAOSRI
VIE
THA
CAM
NPL
SIN
TAP
KOR
AUS
IRL
NOR
LVA
EST
DNK
LUX
KAZKGZ
CYPROM
PRT
CZE
MLT
AUT
HUN
LTU
TUR
BRA
BGR
GRC
HRV
SVK
SVN
MEX
ESP SWEGBR
NLDITA
BEL
RUS JPN
PHI
MAL
MDV
HKG
FRA
FIJ
USA
BRN
POLCHN
CAN
FIN
IND
CHE
MDV
ROM
SVN
HRVBGR LTU
AUT
DNKLVA HUN
PRT
SVK
MLT
LUX
ESTCZE
CYP
KGZ
BAN
SRI
FIJ CAMHKG
BTNNPL
IRL
MALTUR
POLESP
PAK
LAO
KAZ
MEX
PHI
BEL
BRN
GRC
SWE
RUS
NLD
IND
IDN
DEU CHN USA
JPN
CAN
GBR
ITAFRA
FIN
CHE
NORTAP
SIN
KORMON
THA VIE
BRA
AUS
20002017
2000 2017
2000 2017
Note: the size of the circles represents the magnitude of value-added imports. The volume of value-added flow between each pair of trading partners is repre-
sented by the thickness of the line linking the two.
Source: Meng et al. (2018) based on the UIBE GVC indexes derived from the ADB 2018 ICIO table.

32 • Technological innovation, supply chain trade, and workers in a globalized world
used to produce final goods. However, China still largely relied on US-made intermediate services when producing domestically- used final goods.
A very similar pattern can also be found in the complex GVC trade networks. One difference is that Germany’s services sector had a much larger presence in exporting value added through multiple cross-border transactions of intermediate goods in GVCs. This is probably due to the following fact: Germany has a high comparative advantage in exporting high-tech and complex intermediate goods, which embody value added from the domes-tic services sector, since producing these high-tech intermediate exports requires inputs from the domestic services sectors, such as business supporting services and financial intermediaries.
3.2 Demand hubs of value-added trade in various networksDemand hubs of value-added trade in various networks at the aggregate levelThe US was the unique global import demand hub in 2000, with connections to several Asia Pacific economies and some Euro-pean counties, and stronger linkages with the regional demand hubs of Germany, the UK and Japan (upper part of Figure 1.19). The structure didn’t change greatly in 2017, except for the dra-matic rise of China as a new regional demand hub in Asia with the strongest outflow linkage to the US. A similar pattern can be seen in the change in the simple GVC trade networks (the middle part of Figure 1.19) from 2000 to 2017, except that China became a regional demand hub with more inflow linkages from Asian
FIGURE 1.20 Demand hubs of trade in value-added in various networks for the textile sectorTraditional trade networks (textile sector)
Simple GVC trade networks (textile sector)
Complex GVC trade networks (textile sector)
MLT
DNK
PRT
SVK
CAM
DEU
GBR
FRAITA
NLD
SWENOR
BEL
LUX
CYP
IRL
AUT
GRCCHEHRV
POL
FINEST
CZEHUN
SVN
VIE
BGR
KGZ
MON
RUS
PAKCHN
JPN
SRI
SIN
MDVBAN
ROM
LAOBRN
THA
MALIDN
TAP
TUR KOR
PHI
AUS
FIJ
CHN
IND
BTN
NPL
MEX
CAN
BRA
KAZ
LTU LVA
ESP
USA
GBR
FRA
ITA
NLD
SWE
NORBEL
LUX
MLT
GRC
CYPIRL
AUT
DNKPRT
CHE
POL
FIN
CZEHUN
SVN
HRV
SVK
BGR
KGZ
MON
TUR
THARUS
HKG
CHN
JPN
SRI
SIN
MDV
BAN
LAOCAM
BRN
MAL
IDN
TAPKOR
PHI
FIJ
BTN
NPL
IND
MEX
CAN
BRA
AUS
KAZ
LTU
ESP
DEU
EST
ROM
VIELVA
USA
GBR
FRA
ITA
NLD
SWENOR
BEL
LUX
MLT
GRC
CYP
IRL
AUT
DNK
PRT
CHE
POL
FIN
CZE
HUN
SVNHRV
SVK
BGR
KGZ
MON
TUR
THA
RUS
HKG
JPN
SRI
SIN
MDV
PAK
BAN
LAO
CAMBRN
MAL
IDNTAP
KOR
PHI
FIJ
BTN
NPL
IND
MEX CANBRA
AUS
KAZ
LTU
ESP
DEU
EST
ROM
VIE
LVA
USACHN
GBR
FRA
ITA
NLD
SWENOR
BEL
LUX
GRC
CYP
IRL
AUT
DNK
PRT
CHE
POL
FIN
CZE
HUN
SVN
HRVSVK
BGR
KGZ
MON
TUR
IND
THA
RUS
HKG
JPNSRI
SIN
MDV
PAK
BAN
LAO
CAM
BRNMAL
IDNTAP KOR
PHI
FIJBTNNPL
IND
MEX
CAN
BRA
AUSKAZ
LTU
ESP
DEU
EST
ROM
VIE
LVA
USACHN
GBRFRA
NLD
SWENOR
BEL
LUX
MLT
GRCCYP
IRL RUS
ITA
DNKPRT
CHE
POL
FIN
CZE
HUN
SVN
LVA
SVK
BGR
KGZTUR
THA
HKG
JPN
CHN
SRI
SIN
MDV BAN
LAO
CAMBRN
MAL
IDN
INDPAK
MONTAP
KOR
PHI
FIJ
BTN
NPL
AUS
MEX
CAN BRA
KAZ
LTU
ESP
DEU
EST
HRV
ROM
VIE
AUT
USA
CZEFRA
NLD
SWENOR
BELGBRITA
LUX
MLT
GRC
CYP
IRL RUS
POL
DNK
PRT
FIN
HUN
SVNLVA
SVK
BGR
KGZ
TURTHA
HKG JPN
CHN
SRI
SIN
MDV
BAN
LAO
CAMBRN
MAL
IDN INDPAK
MON
TAP
KOR
PHI
FIJ
BTNNPL
AUS
MEX
CAN
BRA
KAZ
LTU
ESP
DEU
ESTHRV
ROM
VIE
AUT
USA
2000 2017
2000 2017
2000 2017
Note: the size of the circles represents the magnitude of value-added imports. The volume of value-added flow between each pair of trading partners is repre-
sented by the thickness of the line linking the two.
Source: Meng et al. (2018) based on the UIBE GVC indexes derived from the ADB 2018 ICIO table.

Recent patterns of global production and GVC participation • 33
economies, as well as from some emerging countries outside Asia (Russia and Brazil). However, there was no global demand hub in the complex GVC trade networks (the bottom part of Figure 1.19) in either 2000 or 2017, as GVC imports of Germany, the US and China were concentrated with their regional trading partners. Germany’s presence increased by 2017 to larger than that of the US, and China expanded rapidly. The US only maintained import-ant linkages with its two regional partners, Canada and Mexico.
All the above observations imply that the more complex the network, the more concentrated the cross-border transactions of intermediate goods in GVCs. In other words, geographic distance
still matters in globally fragmented production, especially in com-plex GVCs. This is because regional trade agreements recently have made greater progress than WTO negotiations in reducing the trans-action costs, including tariffs and non-tariff barriers, involved in each border crossing. At the same time, regional trade agreements also follow rules-of-origin which likely promote complex GVC activities.
Demand hubs of value-added trade in various networks for selected sectorsGreater variation in the structural change in networks can be found at the sector level. In the textile sector, the volume of
FIGURE 1.21 Demand hubs of trade in value-added in various networks for the ICT sectorTraditional trade networks (ICT sector)
2000 2017
MLTDNK
PRT
SVKCAM
DEU
GBR
FRA
ITA NLD
SWE
NOR
BELLUX
CYP
IRLAUT
GRC
CHE
HRV
POLFIN
EST
CZE
HUN
SVN VIE
BGR
KGZ
MON
RUS
PAK
HKG
CHN
JPN
SRI
SIN
MDV
BAN
ROM
LAO
BRN
THA
MAL
IDNTAP
TUR
KOR
PHI
AUS
FIJ
IND
BTN NPL
MEXCAN
BRAKAZ
LTU
LVA
ESP
USA
GBR
FRAITA
NLD
SWE
NORBEL
LUX
MLT
GRC
CYP
IRL
AUT
DNK
PRT
CHE
POL
FIN
CZEHUN
SVNHRVSVK BGR
KGZ
MON
TUR
THA
RUS
PAK
HKG
CHNJPN
SRI
SIN
MDV
BANLAO
CAM
BRN
MAL
IDN
TAPKORPHI
FIJBTN
NPL
IND
MEX
CAN
BRA
AUS
KAZ
LTU
ESP
DEU
EST
ROM
VIE
LVA
USA
2000 2017
Simple GVC trade networks (ICT sector)
GBR
FRA
ITANLD
SWE
NORBELLUX
MLT
GRC
CYPIRL
AUTDNK
PRT
CHEPOL
FIN
CZE
HUN
SVN
HRV
SVK BGR
MONTUR
THARUS
PAK
USACHN
JPNSRI
MDV
LAO
CAM
BRN
HKG
MAL
IDN
TAPKOR
PHI
FIJ
BTN
BAN
NPLIND
MEX
CAN
BRA
AUSKAZ
KGZ
LTU
ESP
DEU
EST
ROM
VIE
LVAMLT
DNK
PRT
SVK
CAM
DEU
GBRFRA
ITA
NLD
SWE
NOR
BEL
LUX
CYP IRL
AUT
GRC CHE
HRV
POL
FIN
EST
CZEHUN
SVNVIE
BGR
KGZ
MON
RUS
PAK
HKG
CHN
JPN SRI
SIN
MDV
BAN
ROM
LAO
BRN THAMAL
IDNTAP
TUR
KOR
PHIAUS
FIJ
IND
BTN NPL
MEX
CAN
BRA
KAZ
LTU
LVAESP
USA
2000 2017
Complex GVC trade networks (ICT sector)
GBR
FRA
ITA
NLD
SWE
NOR
BEL
LUX
MLT
GRCCYPIRL
AUT
DNK
PRT
CHE
POL
FIN
CZE
HUN
SVN
HRV
SVK
BGR
MON
TUR
THA
RUSPAK
USACHN
JPN
SRI
LAO
CAM
BRN
HKG
MDVMAL
SIN
IDN
TAP
KORPHI
FIJ
BTN
BAN
NPLIND
MEX
CAN
BRA
AUS
KAZ KGZ
LTU
ESP
DEU
EST
ROMVIE
LVA
MLT
DNK
PRT
SVK
CAM
DEU
GBRFRA
ITA
NLDSWE
NORBEL
LUX
CYP
IRL
AUT
GRC
CHE
HRV
POL
FIN
ESTCZE
HUN
SVN
VIEBGR
KGZ
MON
RUS
PAK
CHN
JPN
SRI
SIN
MDV
BAN
ROM
LAO
BRNTHA
MAL
IDN
TAPTUR
KOR
PHI AUS
FIJ
IND
BTN NPL
MEX
CANBRA
KAZ
LTU
LVA
ESP
USA
Note: the size of the circles represents the magnitude of value-added imports. The volume of value-added flow between each pair of trading partners is repre-
sented by the thickness of the line linking the two.
Source: Meng et al. (2018) based on the UIBE GVC indexes derived from the ADB 2018 ICIO table.

34 • Technological innovation, supply chain trade, and workers in a globalized world
China’s trade increased sharply from 2000 to 2017, but its only important outflow linkage was to the US (Figure 1.20). Germany’s presence as a regional demand hub fell from 2000 to 2017, while Russia became an important regional demand hub in Europe with inflow linkages from some Eastern European and Central Asian countries. In the simple GVC networks, China’s importance as a regional demand hub increased, with an important outflow link-age to the US and inflow linkages from most Asian economies. On the other hand, Italy changed from the largest regional demand hub in Europe to an isolated country, as Italy’s participation pat-tern in simple GVCs changed from an intermediate goods-ori-ented importer to an intermediate goods-oriented exporter. In
the complex GVC networks, the connection in Europe, Asia and North America became more concentrated with their regional partners. The importance of France, Turkey and Viet Nam as sub-regional demand hubs increased substantially by 2017. Com-pared to the position in simple GVC trade networks, Russia’s pres-ence was very low in the complex GVC trade networks.
In the ICT sector, China became the largest demand hub for the traditional trade networks. In 2017, China had the largest magni-tude of imports (indicated by the size of the circle) and important inflow linkages from Germany, Japan, the Republic of Korea, Chi-nese Taipei, and outflow linkages to the US (Figure 1.21). A very similar pattern for China can also be found in the simple GVC trade
FIGURE 1.22 Demand hubs of trade in value-added in various networks for the services sector
Traditional trade networks (services sector)
Simple GVC trade networks (services sector)
Complex GVC trade networks (services sector)
GBR
FRA ITANLD SWE NORBEL
LUXMLT
GRC
CYPIRL
AUT
DNK
PRT CHE
POL
FIN
EST
CZE
HUN
ROM
SVNHRV SVK
LVA
BGR
KGZ
MONTUR
RUS
PAK
HKG
CHN
JPN
SRI
SIN
MDV
BAN
LAO
CAMBRN
THA
MAL IDNTAPKOR
PHI
AUSFIJ
IND
BTN
NPL
USA MEX
CAN
BRA
KAZ
LTU
ESP
DEU
GBR
FRA
ITANLD
SWE
NORBEL
LUX
MLT
GRCCYP
IRL
AUT
DNK
PRTCHE
HRVPOL FIN
EST
CZE
HUNROM
SVNVIE
SVK
LVA
BGR
KGZ
MON
TURRUS
PAK
HKGCHN JPNSRI
SIN
MDVBAN
LAO
CAM
BRN
THA
MAL
IDN
TAPKORPHI
AUSFIJ
INDBTN
NPL
MEXCAN
BRA
KAZ
LTU
ESP
USADEU
GBR
FRAITA
NLD
SWE NORBEL
LUX
MLT
GRCCYP
IRL
AUT
DNK
PRT
CHE
POL
FIN
EST
CZE
HUN
SVN
HRV
SVK
LVA
BGR
KGZ
MON
TUR
RUS
PAK
HKG
CHN
JPN
SRI
SIN
MDV
BAN
LAO
CAM
BRN MALIDN TAP
KOR PHI
AUS
FIJ
BTNNPL
MEX
CAN
BRAKAZ
LTU
ESP
DEU
ROM
USA
GBR
FRAITA
NLDSWE
NORBEL
LUX
MLT
CYP
IRL
AUT
DNK
PRT
CHE
HRV
POL FIN
EST
CZE
HUN
SVN
VIE
SVKLVA
BGR
KGZ
MON
RUSPAK
HKG
CHN
JPNSRI
SIN
MDV
BAN
ROM
LAO
CAM
BRN
THA MAL IDN
TAP
KOR PHIAUS
FIJ
IND
BTNNPL
MEX
CAN
BRA
KAZ
LTU
ESP
USADEU
DEU
GBR
FRAITA NLD
SWENOR
BEL
LUXCYP IRL
AUT
GRC
CHE
HRV
POL
FIN
EST
CZE
HUN
SVN
VIE
SVK
LVA
BGR
KGZMON
RUS
PAK
HKG
CHN
JPN
SRI
SIN
MDV
BANROM
LAOCAM
BRNTHA
MALIDN
TAP
TUR
KOR
PHI
AUS
FIJIND
BTN
NPL
MEX
CANBRA
KAZ
LTU
ESP
USA
GBRFRA
ITA NLDSWE
NOR
BEL
LUX
MLT
GRC
CYP
IRL
AUT
DNKPRT
CHE
POL
FIN
EST
CZE
HUN
SVN HRV
SVK
LVABGR
KGZ
MON
TUR
THA
RUS
PAK
HKG
CHN
JPN
SRI
SIN
MDV
BAN
LAO
CAM
BRN
MAL
IDN
TAP
KOR
PHI
FIJ
BTN
NPL
IND
MEX
CAN
BRA
AUS
KAZ
LTU
ESP
DEU
ROM
USA
20002017
2000 2017
2000 2017
Note: the size of the circles represents the magnitude of value-added imports. The volume of value-added flow between each pair of trading partners is repre-
sented by the thickness of the line linking the two.
Source: Meng et al. (2018) based on the UIBE GVC indexes derived from the ADB 2018 ICIO table.

Recent patterns of global production and GVC participation • 35
networks. By 2017 the US had lost many inflow linkages from Asia, but still maintained many inflow linkages from other economies in the simple GVC trade networks. In the complex GVC trade net-works, Europe, Asia and North America had become more sepa-rated, as there was no longer any direct or indirect linkage among the regional hubs Germany, China and the US. Europe changed from multi-hubs to a single hub type network, while Asia changed from a single hub to a multi-hub type network.
The most important structural change in the services sector was the rise of China, which in 2017 became a regional demand hub in all three networks (Figure 1.22). The US was still the only global demand hub in services for both traditional and simple GVC trade networks. The complex GVC trade networks are largely separated, since there was no direct linkage among regional hubs in both 2000 and 2017. Germany’s presence in the complex GVC trade networks had increased by 2017, reflecting the significant depen-dence of most European countries’ services sectors on German demand for intermediate imports.
From the perspective of global production networks, we can see that the rise of China has dramatically changed the whole topology of GVCs from both the demand and supply sides at both the aggre-gated and individual sector levels. This clearly reflects the fact that China is no longer just a “factory” exporting huge amounts of final goods to the world; China has emerged as a new “superpower” through rapid industrial upgrading, which is reflected in the large scale of its exports and imports of intermediate goods and services via both simple and complex GVC trade networks. In other words, more countries, especially in Asia, have become highly dependent on China’s supply of value-added and its demand for value-added directly and indirectly via GVCs. Another interesting finding that is not so remarkable, but can be clearly observed in our results, is that most of China’s final demand in the past was previously satis-fied by its own domestic suppliers, whereas nowadays imports play
a greater role in meeting this demand. Because of this and due to China’s rapid increase in purchasing power, China has become one of the most important demanders of value-added through final goods trade for several other countries. While China’s per capita GDP is still lower than most developed countries (US$8,827 for China versus US$59,532 for the US in 2017 according to data from the World Bank Group), given China’s potential for positive economic growth, the ongoing process of further opening-up, and its large population size, it is not difficult to imagine that China will become an important demand hub even in traditional trade net-works as a large buyer of final goods in the near future. No doubt, this will also significantly change the world map of economic inter-dependence, as well as the distribution pattern of countries’ influ-ential power in many senses.
4. The multilateral nature of bilateral trade balances in the age of GVCs16
Discussions of the US trade deficit in the press often focus on the aggregate deficit. The US has run huge trade deficits in manufac-turing products, but has enjoyed a trade surplus in agricultural products and services (Figure 1.23). The US trade deficit in man-ufacturing products increased sharply in the late 1990s, acceler-ated after China joined the WTO in 2001, and further widened a few years after the global financial crisis.
The dramatic increase in the U.S. manufacturing trade defi-cit with China since China’s WTO accession is largely a result of the movement of production facilities from other industrialized countries (mainly Japan and the Asian NICs) to China (Table 1.3 reports the share of U.S. major trading partners’ contribution to the U.S. trade deficit in manufactured products between 1990 and 2017). For example, in 1990, Japan and the four Asian Tigers
FIGURE 1.23 United States worldwide trade balance in broad economic sectors % GDP
-5
-4
-3
-2
-1
0
1
2
1995
1996
1997
1998
1999
2000
2001
2002
2003
2004
2005
2006
2007
2008
2009
2010
2011
2012
2013
2014
2015
2016
2017
Agriculture, hunting, forestry and fishing Mining Manufacturing Service
Source: Bureau of Economic Analysis, US Department of Commerce, available online at https://www.bea.gov/

36 • Technological innovation, supply chain trade, and workers in a globalized world
TABLE 1.3 Share of U.S. trade deficit in manufacturing products with partners(percent)
CAN JPN Four Asian NICs DEU MEX ASEAN9 CHN Rest of
OECD ROW G7
1990 7.5 49.4 25.7 10.2 -1.9 6.1 10.3 -6.7 -0.5 70.4
1995 6.7 45.3 10.8 10.0 5.7 13.1 24.2 -6.0 -9.8 66.9
2000 6.2 24.9 9.1 8.3 3.6 11.5 25.5 7.3 3.7 45.1
2005 4.1 15.1 3.7 8.5 4.2 9.4 37.0 12.9 5.1 34.3
2008 -2.2 16.5 1.6 8.6 5.8 11.1 57.6 9.2 -8.2 31.0
2009 -7.0 14.6 1.7 8.0 6.8 13.0 70.5 7.9 -15.5 21.7
2010 -5.9 15.1 -0.2 7.9 8.1 11.0 67.1 9.7 -12.8 22.9
2011 -7.5 15.0 -0.2 10.4 6.1 11.1 67.6 9.0 -11.5 23.4
2012 -8.6 16.9 0.1 12.2 5.6 11.7 70.6 7.3 -16.0 27.0
2013 -9.5 16.4 -1.4 13.8 5.2 12.8 72.6 8.5 -18.4 28.4
2014 -8.4 13.5 0.4 13.2 5.2 13.6 67.7 11.0 -16.2 25.5
2015 -5.1 11.2 1.7 11.1 7.3 13.6 59.5 11.3 -10.5 23.5
2016 -4.5 11.0 1.9 9.2 8.2 14.3 55.4 11.9 -7.4 21.4
2017 -4.7 10.5 1.2 8.5 8.1 14.7 56.1 12.8 -7.2 20.1
Data Source: OECD Bilateral Trade in Goods by Industry and End-use (BTDI*E), ISIC, Rev.4, available online: https://stats.oecd.org/Index.aspx?DataSetCode=BT-
DIXE_I4. ASEAN 9 include MYS, PHL, THA, IDN, VNM, BRN, KHM, MMR and LAO. SGP is included in Four Asian NICs.
BOX 1.3Identifying and measuring the third country effect in bilateral trade
An integrated mathematical framework to trace value added and identify double counted items in gross trade flows is pro-vided in Koopman, Wang and Wei (KWW, 2014). A country’s gross exports can be decomposed into the sum of four con-ceptually different components: (a) domestic value added that is ultimately absorbed abroad, or value-added exports (VAX) as named by Johnson and Noguera (2012); (b) domes-tic value added that is exported (as intermediate exports) and then returned home (RDV); (c) foreign value added used in the production of exports (FVA); and (d) multiple counted value added due to back and forth cross-border intermedi-ate trade (PDC). KWW further shows that these components of gross exports all have specific types of relationships with GDP statistics: VAX is the home country’s GDP used to sat-isfy foreign demand, in which the factor content embodied in gross exports crosses national borders at least once; RDV is not part of home country’s value added exports, but is part of home country’s GDP that is eventually absorbed at home as the country’s final demand, through which domes-tic factor content crosses national borders at least twice; FVA is a part of other countries’ GDP, or the factor content
in exports that also crosses national borders at least twice; PDC counts in no country’s GDP, as it is the factor content that has already been counted by at least one of the three components above and crosses national borders at least three times but is recorded in gross trade statistics by each country’s custom authority.
By identifying which parts of the gross trade transac-tions are double counted relative to GDP statistics, the KWW method provides a way to correctly interpret gross trade data in value added terms (relative to GDP) and links gross trade and GDP statistics (the two most important and popular used economic statistics today) based on the System of National Accounts standard (SNA). Wang, Wei, and Zhu (2014) extend the KWW accounting framework to trade at the bilateral, sector, and bilateral sector levels and provide a consistent accounting framework that resem-bles in spirit that of KWW (2014) across different levels of aggregation. By splitting these four broad components into more detailed items, the roles of third countries in bilateral trade can be clearly identified and measured, as indicated by Table 1.4.

Recent patterns of global production and GVC participation • 37
BOX 1.3 (continued)Identifying and measuring the third country effect in bilateral trade
The decomposition of bilateral trade at a detailed level shows that the role of third countries in bilateral trade can be measured by 3 of the 8 detailed components (in blue font): DVA_IND, OVA and ODC. The ratio of DVA_IND to gross trade is used to measure the importance of a part-ner country as a transfer platform for the home country’s DVA absorbed in third countries. This ratio is determined by the production sharing arrangement between the home and partner country, as well as by final demand in third countries. Similarly, the ratio of OVA to gross trade is used to measure the importance of third countries’ factor content for the home country’s export production.
This ratio is driven by final demand in the partner coun-try and the production sharing arrangement between the home and third countries. Finally, the ratio of ODC to gross trade is used to measure the complexity of the third-country effect. This ratio is determined by the pro-duction arrangement among home, partner and third countries. ODC refers only to intermediate inputs that cross a national border at least three times (a firm uses intermediate inputs from a country to produce intermedi-ate inputs in another country for production of exports to a third country, involving production sharing activities of at least among 3 countries).
TABLE 1.4 Decomposition of bilateral gross trade to identify and measure the roles of third counties in bilateral trade(percent)
Core KWW decomposition Detailed Decomposition Economic interpretation Relation to GDP
statisticsNumber of border crossings
VAX_GValue added exports
DVA_DIR Domestic VA in production of exports that is finally absorbed by trading partner
Home GDP satisfies final demand in partner country At least once
DVA_IND Domestic VA in production of exports that is finally absorbed by third countries
Home GDP satisfies final demand in third countries
At least twice
RDV_GReturned DVA
RDV_G Domestic VA first exported but finally returned home and consumed there
Home GDP satisfies own domestic final demand through international trade
FVAForeign value added
MVA Trading partner’s VA used in production of exports that return to and is absorbed by partner
Partner’s GDP satisfies final demand in partner country
OVA Third countries’ VA used in production of exports that is finally absorbed by partner
Third countries’ GDP satisfies final demand in partner country
PDCPure double counting
ODC Pure double counting in gross exports sourced from third countries
No country’s GDP
At least three times
DDC Pure double counting in gross exports sourced from home
No country’s GDP
MDC Pure double counting in gross exports sourced from partner
No country’s GDP

38 • Technological innovation, supply chain trade, and workers in a globalized world
were the source of about 75% of the U.S. worldwide trade deficit in manufactured products, but by 2017 their share had declined to less than 12%. Over the same period, China’s share of the U.S. trade deficit in manufacturing products increased dramatically from 10% to about 73% in 2013, and has declined since then. In other words, while China was becoming an increasingly import-ant source of manufactured goods, the relative importance of the rest of the industrialized world as a whole was declining (see the last column of Table 1.3), because many firms in these econ-omies were shifting their manufacturing and assembly facilities to China via their FDI to China. Trade statistics by ownership from China Customs confirm that China’s trade surplus in man-ufacturing products with the US was mainly generated by wholly foreign-owned enterprises (FIE) and joint venture companies (JOV), although Chinese-owned private firms (PRI) have played an increasing role in recent years17.
Along with China, other emerging economies, such as Mexico and the ASEAN countries, have been increasingly integrated into
global production networks over the last two decades and have increased their share of the US global trade deficit in manufac-tured goods (Table 1.3). This suggests that the development of various global production chains is one of the fundamental driv-ing forces of the growing U.S. bilateral trade deficit with China in manufactured products during the past two decades.
To examine the role GVCs have played in the geographical shifting of the US trade deficit in manufacturing products, this section analyzes the value-added structure of the three trade routes where the US has the largest deficit, namely US trade with China, Japan and Germany, using the gross trade account-ing method proposed by Koopman et. al (2014, see Box 1.3 for details).
We first look at the value-added structure for US net imports of computer, electronic and optical equipment (OECD-ICIO C30, 32 and 33) from China as an example. The decomposition results are reported in Table 1.5. Column (1) reports gross exports in millions of dollars (current prices). Column (2) reports value
TABLE 1.5 US-China trade of computer, electronic and optical equipment(million USD)
Year TEXP VAX_G DVA_DIR DVA_IND RDV_G DDC MC OVA ODC
(1)=2+3+4+5+6+7
(2)=2a+2b (2a) (2b) (3) (4) (5) (6) (7)
China exports to the United States
2000Value 17,553 4,356 3,652 704 21 64 1,785 9,385 1,942
Share 100 24.8 20.8 4 0.1 0.4 10.2 53.5 11.1
2007Value 94,153 33,869 29,826 4,043 195 1,003 6,229 47,502 5,356
Share 100 36 31.7 4.3 0.2 1.1 6.6 50.5 5.7
2014Value 166,296 76,573 67,422 9,151 675 2,537 9,301 69,035 8,176
Share 100 46 40.5 5.5 0.4 1.5 5.6 41.5 4.9
US exports to China
2000Value 5,362 3,441 2,504 936 572 139 46 725 440
Share 100 64.2 46.7 17.5 10.7 2.6 0.9 13.5 8.2
2007Value 13,930 9,182 4,891 4,291 2,016 237 427 886 1,182
Share 100 65.9 35.1 30.8 14.5 1.7 3.1 6.4 8.5
2014Value 25,054 18,544 11,099 7,445 3,346 317 754 1,033 1,061
Share 100 74 44.3 29.7 13.4 1.3 3.0 4.1 4.2
US net imports from China
2000Value 12,191 915 1,148 -232 -551 -75 1,739 8,661 1,502
Share 100 7.5 9.4 -1.9 -4.5 -0.6 14.3 71.0 12.3
2007Value 80,223 24,687 24,935 -248 -1,821 765 5,802 46,616 4174
Share 100 30.8 31.1 -0.3 -2.3 1.0 7.2 58.1 5.2
2014Value 141,242 58,029 56,323 1,706 -2,671 2,220 8,547 68,002 7,114
Share 100 41.1 39.9 1.2 -1.9 1.6 6.1 48.1 5.0
Source: The UIBE GVC indexes derived from the 2017 OECD ICIO table.

Recent patterns of global production and GVC participation • 39
added exports (VAX_G) associated with these gross trade flows. In the next five columns, major components of gross exports are reported: domestic value added that is ultimately absorbed by partner country ((2a) DVA_DIR); domestic value added that is ultimately absorbed by third countries ((2b) DVA_IND), which depends upon final demand in the third country; domestic value added in exports that is ultimately returned and consumed at home (column (3) RDV_G), which is part of home country’s GDP and final demand; loop effects between bilateral trading part-ners (Column (4) and (5) DDC and MC), third countries’ value added in gross exports (column (6), OVA) and pure double counting sourced from third countries (column (7), ODC).
The decomposition results not only reveal the mislead-ing nature of the balance of trade computed from gross trade statistics, but also the sources of such statistical illusion. Value added in exports (VAX_G) accounted for only 25% of China’s exports of computer, electronic and optical equipment to the US before China’s WTO accession. This share increased after-wards, but remained lower than 50% in 2014. The value added in exports from third countries consistently accounted for more than 50% of China’s exports of these goods throughout the sample period. The composition of US exports to China was the opposite, as the share of VAX_G dominated throughout the sample period (between 65-75%). The value added content from third countries (OVA+ODC) accounted for less than 20% of US gross exports of these goods, and declined to only about 8% in 2014. MC+OVA+ODC accounts for the largest portion of China’s exports, as China used upstream inputs from the US and third countries to produce its exports; DVA_IND+RDV+DDC is the largest portion of US exports, which are US products imported by China used as inputs to produce China’s exports for US and third country markets. Therefore, the main source of the trade imbalance in China-US bilateral trade in computer, electronic and optical equipment was the third countries’ value added in gross trade flows. Third countries accounted for 80.3% of the total trade imbalance in 2000, falling to 53.1% in 2014.
Bilateral trade balances (net imports) are often used by trade and labor economists as a measure of import penetration and the impact of external trade on domestic economic activity. When traditional (final goods) trade dominated international trade flows, the net imports captured the imported factor con-tent from the surplus economy to the deficit economy. However, when global trade is dominated by global value chains, gross trade balance is no longer a reliable measure of import penetra-tion. As shown in the bottom panel of Table 1.5, US net imports of computer, electronic and optical equipment only contain a very small portion of Chinese factor content. In 2000, Chinese value added (factor content) only constituted 7.5% of US total net imports from China. This share increased rapidly after China join the WTO, reaching 30.8% in 2007 and 41.1% in 2014.
Differences in the value-added structure of exports between China and the US reflects the different role that the two coun-tries’ firms played in this sector. With high design and system integration capacities, US multinationals were the lead firms of global value chains and occupied a top and central position in
the global production network. By contrast, Chinese firms began to join the global value chains since deregulation of foreign investment in 1992, undertaking processing and assembly tasks, so that the ratio of domestic value added to gross exports was very low; a great deal of value came from foreign upstream sup-pliers of raw materials, parts and components. In 2000, 98.7% of China’s exports of computer, electronic and optical equipment to the US were processing exports. After China entered the WTO, Chinese firms started to move up the global value chains. More Chinese firms upgraded to general trade, and the proportion of processing trade fell (from 87.3% in 2007 to 77.4% in 2014).
Such a value-added structure of US net imports from China is not uncommon. The important role played by third countries also can be observed in US net imports from Germany, Japan and many other trading partners. Figure 1.24 shows the val-ue-added structure of US total net imports from Germany. A much larger portion of US intermediate goods exports to Ger-many were re-exported to third countries compared to the share of US imports from Germany (DVA_IND, which depends on final demand in third countries) that was re-exported. Thus, in this re-exported portion, the US actually ran a large surplus with Germany in terms of value added, especially in services sectors. Compared to US net imports from China, US net imports from Germany contain a much higher share of Germany’s factor con-tent (around 80%), but third countries’ suppliers also accounted for around 40% (third countries’ final demand accounted for a negative 20%, implying that Germany’s imports from the US depended more on third countries’ final demand for Germany’s products that use US intermediate inputs). All of this demon-strates the complex composition and offsetting factors involved in gross net trade flows.
To further demonstrate the differing roles of third countries across bilateral trade routes, Figure 1.25 compares the changing value-added structure of: US net imports of computer, electronic and optical equipment from China and US net imports of trans-port and storage services from Germany; and US net imports of motor vehicles from Germany and Japan.
US net imports of ICT products from China increased rapidly after China joined the WTO, jumping from less than 10% of US sector value-added (11 billion USD) in 2001 (right scale of Figure 1.25, top left) to over 60% (141 billion USD) in 2014. Factor content from third countries played the most important role in this dramatic growth (well above 50%). This reflected other countries using China as an assembling hub to re-export their domestic value added to satisfy US final demand. Similarly, demand for German goods by third countries, mostly nearby European economies, were the driv-ing force behind the rise in US net exports of transport and storage services to Germany (Figure 1.25, bottom left).
Third countries’ production significantly affected US deficits in motor vehicles with Germany and Japan from 1995 to 2014. A substantial portion of US net imports from Germany (more than one fourth of US net imports in 2014) reflected factor content from third countries, mostly Eastern EU countries and China, while final demand in third countries accounted for only about 5% of US net imports over this period (Figure 1.25, bottom right).

40 • Technological innovation, supply chain trade, and workers in a globalized world
The importance of third countries’ factor content supply and final demand in US net imports of motor vehicles from Japan increased towards the end of this period, but remained at a lower level than in Germany.
This analysis illustrates that in the age of global value chains, when embodied factor content and sources of final demand of gross trade flows vary significantly across trade routes by coun-tries and products, net bilateral imports are no longer a reliable measure of the impact of trade with a partner country on domes-tic prices and wages. This also implies that any change in bilateral trade policy can have a significant impact on third countries that should not be overlooked in dealing with bilateral trade issues.
5. Conclusions
The rise of GVCs has significantly changed the nature and struc-ture of the world economy. The increasing complexity of GVCs also brings great challenges to policy making in both developed and developing countries. This chapter has presented trends in GVC production and trade up to 2017 from various perspec-tives, based on a recently developed production decomposition method that classifies factor contents embodied in a product into GVC and non-GVC activities depending on whether they cross national borders.
Several findings emerge from this chapter:First, the globalization of production slowed after 2011, indi-
cated by the increase of purely domestic production and the decline of GVC activities as a share of total production activities. As the growth of global trade surpassed the growth of global GDP for the first time in nearly six years, there were some signs of recovery of GVC activities in 2017, especially for complex GVCs activities. However, 10 years after the global financial crisis, global GVC participation has not returned to the pre-crisis level. Considering a longer period, the higher technology (knowledge) intensity of a sector, the more significant the increase of complex GVC activities.
Second, while the share of intra-regional GVC activities in total GVC activities increased in Asia from 2000 to 2017, the share of intra-regional GVC activities declined in both Europe and North America and their share of inter-regional production sharing activities increased, especially their GVC linkages with “Factory Asia”. GVC trade become more global in 2017 compare to 2000.
Third, from the view of global production network topology, China played an increasingly important role as both a supply and demand hub in traditional trade and simple GVC activities, while the US and Germany remained the most important hubs in com-plex GVC networks. China has emerged as a new hub through rapid industrial upgrading, represented by its more high-tech
FIGURE 1.24 Value-added structure of US net imports from GermanyShare % Billions USD
-20
-10
0
10
20
30
40
50
0
-40
-20
20
40
60
80
100
Net imports (right) DVA_DIR DVA_IND
RDV_G DDC+MC OVA ODC
1995
1996
1997
1998
1999
2000
2001
2002
2003
2004
2005
2006
2007
2008
2009
2010
2011
2012
2013
2014
Note: Refer to Box 1.3 for symbol definitions.
Source: The UIBE GVC indexes derived from the 2017 OECD ICIO tables.

Recent patterns of global production and GVC participation • 41
intermediate exports and imports. Bilateral trade, especially complex GVC trade, became more concentrated among major regional trading partners, indicating distance matters even for value-added trade and GVCs.
Fourth, in the age of GVCs, bilateral trade balances are no longer a reliable measure of the impact of partner countries on domestic economic activities. For example, production and final demand from third countries have had a significant impact on US net imports from China, Germany and Japan. And factor con-tent from third countries accounted for more than half of the bur-geoning deficit in US net imports of ICT products from China, which increased 12.8 times in the 15 years up to 2014 to reach 141 billion USD.
One important policy implication is that changes in trade policy can have broad and unanticipated effects. Unilateral imposition of trade protection on exports from a partner coun-try can have a significant impact on third countries when trade is carried out through GVCs, particularly complex GVCs. Indeed, as many products today are already “made in the world”, increasing import protection can even harm exports from the home country.
More policy analyses on the impact of technology changes and GVC trade on labor markets in developed and developing coun-tries will be discussed in detail in other chapters of this report.
Current residence-based national account rules treat all firms within national borders as domestic firms, so the value-added creation of foreign affiliates is treated as part of purely domestic production activities if they do not engage in cross border trade. However, some of their production may also be a type of GVC activity, especially in services because the supply of services through commercial presence abroad is an important way of conducting international transactions in services (mode 3 – com-mercial presence). The distinction between foreign and domestic owned firms is particularly relevant. However, no ICIO table cur-rently available is able to separate production activities between domestic firms and foreign affiliates to allow us to develop GVC measurement for such activities. Initiatives in this direction are being taken in the international statistical community. Chapter 8 of this report will discuss this and related GVC measurement issues in more details.
FIGURE 1.25 The roles of third countries can be very different in different bilateral trading routes Share % Billions USD
(a) US net imports from CHN, ICT (a) US net imports from JPN, motor vehicles
(a) US net imports from DEU, transport and storage (a) US net imports from DEU, motor vehicles
-20
0
20
40
60
80
100
120
140
160
0
-10
10
20
30
40
50
60
70
80
90
1995
1996
1997
1998
1999
2000
2001
2002
2003
2004
2005
2006
2007
2008
2009
2010
2011
2012
2013
2014
Net Imports(Right) DVA_IND OVA ODC
0
5
10
15
20
25
30
35
40
45
50
0
2
4
6
8
10
12
1995
1996
1997
1998
1999
2000
2001
2002
2003
2004
2005
2006
2007
2008
2009
2010
2011
2012
2013
2014
14
-9
-8
-7
-6
-5
-4
-3
-2
-1
0
-10
-5
0
5
10
15
20
25
30
35
1995
1996
1997
1998
1999
2000
2001
2002
2003
2004
2005
2006
2007
2008
2009
2010
2011
2012
2013
2014
0
5
10
15
20
25
30
0
5
10
15
20
25
30
1995
1996
1997
1998
1999
2000
2001
2002
2003
2004
2005
2006
2007
2008
2009
2010
2011
2012
2013
2014
Note: The blue bars represent net gross imports, measured in percent of US sector value-added according to the scale in vertical axes on the right, a positive
number indicates US trade deficit, a negative number indicates US surplus; The lines represent third countries’ roles, measured in percentage point according to
scale in vertical axes on the left. The y-axes indicates calender years. Refer to Box 1.3 for symbol definitions.
Source: The UIBE GVC indexes derived from the 2017 OECD ICIO tables.

42 • Technological innovation, supply chain trade, and workers in a globalized world
Notes
1. “Pure domestic” means domestic value-added in domestically pro-
duced final products that satisfy domestic final demand without
involving cross border trade and production sharing activities, it can
also be phrased as “not traded internationally”; “Traditional trade”
is final goods and services produced for exports with only domestic
factor content, it can also be phrased as “Trade in final products” or
“Ricardian Trade”; “GVCs” are basically “trade in intermediate prod-
ucts”. The distinction between simple and complex GVC activities
in our estimates are determined by the number of national border
crossing, not the differences in technology or the complexity of actual
production process (although there is a correlation between them),
so they can be phrased as “value-added activities cross one or more
than one national borders”. Some care is needed in interpretation,
for example a large economy is likely to see lower levels of estimated
complex GVCs than would be the case if the same economy was split
into a series of smaller economies.
2. This section was written by Xin Li and Zhi Wang.
3. We aggregate the 65 WIOD industries into 8 industry groups: (1)
AGR: Agriculture, Hunting, Forestry and Fishing (ISIC rev.3 “01T05”);
(2)Min: Mining and Quarrying (ISIC rev.3 “10T14”); (3) HTI: High R&D
intensive industries (ISIC rev.3 “24, 29T34, 352,353, 359”);(4) MTI:
Medium R&D intensive industries (ISIC rev.3 “25T28, 351, 37”); (5) LTI:
low R&D intensive industries (ISIC rev.3 “15T23, 36”), (6) TTS: Trade
and Transportation (ISIC rev.3 “50T52”, 55, “60T63”);(B)FBS Post and
Telecommunications, Financial and Business services (ISIC rev.3 “64,
65T67, 71T74”); (8) OSE: Real Estate Activities, Utility, Construction,
and: other services (ISIC rev.3 “70, 75, 80, 85, 90T93, 95, 40,41, 45”).
4. The relative value of the forward and backward participation indi-
ces indicates a country-sector’s position in the global production
network. A higher degree of forward participation than backward
participation implies that the country is more actively engaged
in upstream production activities in GVCs. Some care is needed in
interpretation however, see Ahmad, N., et al. (2017), “Indicators on
global value chains: A guide for empirical work”, OECD Statistics
Working Papers, No. 2017/08, OECD Publishing, Paris, https://doi.
org/10.1787/8502992f-en.
5. As a result, industry became an inappropriate analytical unit for the
study of international trade. See the discussion on firm heterogeneity
for the empirical challenges to tackle this problem in Chapter 8.
6. Its GVC exports share to Europe and Asia was 40.4% and 20.4%
respectively, higher than its share of intra-regional complex GVC
activities at 18.1%; Its complex GVC imports share from Europe and
Asia was 31.2% and 27.8% respectively, also higher than its share of
intra-regional complex GVC activities at only 20.7%,
7. This section was written by Bo Meng and Ming Ye.
8. Some care is needed in interpreting smile curves produced using
input-output tables in basic prices, see also Chapter 8.
9. The data for compensation per employee is from the WIOD Socio
Economic Accounts 2016 version (compensation of employees /
number of employees).
10. The distance is measured by a value-added weighted average of pro-
duction stages. For detailed methodology, one can refer to Ye, Meng
et.al. (2015).
11. This section was written by Bo Meng, Hao Xiao and Jiabai Ye.
12. Data are from the ADB ICIO database (the 2018 version).
13. It should be noted, these types of plots are better for capturing long-
run changes on the extensive margin rather than short-run changes
that occur on the intensive margin.
14. It should be noted that country size may result in some bias in our
analysis. For example, countries exporting to the US are more likely to
see their exports classified as ‘simple’ than ‘complex’ GVC activities,
compared to exports within a ‘fragmented’ region of smaller countries
(e.g. EU).
15. A large number of studies have argued that due to rising manufac-
turing costs in developed nations, many companies are looking to
less-developed nations to set up manufacturing facilities in hopes of
reducing costs. These developed countries are being “hollowed out”,
which poses a threat to many factory workers because they could
lose their job to someone in another country. The level of industrial
hollowing out can be measured by net FDI outflows, unemployment
rates, the share of manufacturing industries in GDP, and other means.
16. This section was written by Fei Wang, Zhi Wang and Kunfu Zhu.
17. Based on trade statistics collected by the General Administration
of Customs of the People’s Republic of China (GACC), China had a
304.8 billion USD trade surplus in manufacturing products with the
United States in 2017. The share of FIE and JOV was 55%, the share of
PRI was 41%, while SOE and other firms represented only about 4%.

Recent patterns of global production and GVC participation • 43
References
Baldwin, Richard E. and Javier López- González (2013). Supply-Chain trade:
A portrait of global patterns and several testable hypotheses, NBER
Working paper 18957, National Bureau of Economic Research.
Ferrantino M J, Taglioni D. (2014). Global value chains in the current trade
slowdown, World Bank Economic Premise, 137.
Ferrarini B. (2013). Vertical trade maps, Asian Economic Journal, 27(2):
105–123.
Johnson, R. and Noguera, G. (2012). Accounting for Intermediates: Pro-
duction Sharing and Trade in Value-added, Journal of International
Economics, 86(2):224-236.
Koopman, R., Wang, Z., Wei, S-J. (2014). Tracing Value-Added and Double
Counting in Gross Exports. The American Economic Review, 104(2):
459-494.
Los B., Timmer M.P., de Vries G.J., (2015). How Global are Global Value
Chains? A New Approach to Measure International Fragmentation,
Journal of Regional Science, 55(1): 66-92.
Meng, B., M. Ye, Wei, S-J. 2017. Value-added Gains and Job Opportunities
in Global Value Chains, IDE Discussion Paper, 668, IDE-JETRO, Chiba
City, Japan.
Meng, B., Xiao, H., Ye, J., Li, S. (2018). Are global value chains truly global?
A new perspective based on the measure of trade in value-added, IDE
Discussion Paper, 736, IDE-JETRO, Chiba City, Japan.
Mudambi, R. (2008). Location, Control and Innovation in Knowledge-Inten-
sive Industries. Journal of Economic Geography, 8(5), 699-725.
Rodrik, D. 2018. New Technologies, Global Value Chains, and the Develop-
ing Economics. Pathways for Prosperity Commission Background Paper
Series: No.1 Oxford, United Kingdom.
Shin, N., Kraemer, K.L., Dedrick, J. (2012). Value Capture in the Global Elec-
tronics Industry: Empirical Evidence for the “Smiling Curve” Concept.
Industry and Innovation, 19(2), 89-107.
Shih, S. (1996). Me-Too is Not My Style: Challenge Difficulties, Break through
Bottlenecks, Create Values (Chinese Taipei: The Acer Foundation).
Wang, Zhi, Shang-Jin Wei, and Kunfu Zhu, 2014, “Quantifying International
Production Sharing at the Bilateral and Sector Levels,” NBER Working
Paper 19677.
Wang, Zhi, Shang-Jin Wei, Xinding Yu, and Kunfu Zhu, 2017a, “Measures of
Participation in GlobalValue Chains and Global Business Cycles”, NBER
Working Paper No. 23222.
Xiao, H., Sun, T., Meng, B., Cheng, L. (2017). Complex network analysis
for characterizing global value chains in equipment manufacturing,
PlosOne, 12 (1): e0169549.
Ye, M., B. Meng, and S. Wei. 2015. “Measuring Smile Curves in Global
Value Chains.” IDE Discussion Paper 530, IDE-JETRO, Chiba City,
Japan.
Zhou, M., Wu, G., Xu, H. (2016). Structure and formation of top networks in
international trade, 2001–2010, Social Networks, 44: 9–21.


CHAPTER 2
* We would like to thank Klaus Michael Keller for excellent research assistance and inputs to this chapter. We further would like to thank Michael Ferrantino,
Bill Shaw and participants at the second conference for the GVC Development Report 2019 for helpful comments and suggestions.
Trade, value chains and labor markets in advanced economies*
By Marc Bacchetta (WTO) and Victor Stolzenburg (WTO)
ABSTRACT
Trade is a major source of employment. Nevertheless, trade has recently been caught in the crossfire in discussions around the decline of manufacturing employment and the polarization of labor markets in advanced economies. In this chapter we examine what the academic literature has to say on the relationship between trade and labor markets, with a specific focus on studies with a value chain perspective. We find that trade has only modest effects on aggregate employment and is unlikely to have been a major contrib-utor to the decline of manufacturing. However, the effects
vary considerably across regions and individuals with dif-ferent skill levels. This implies that policy has a central role to play in making sure that the gains from trade are shared evenly. Our findings highlight that a value chain perspec-tive is important for assessing the impact of trade on labor markets. The emergence of value chains has strengthened linkages between sectors, magnified trade’s impact on skill demand and requires novel trade statistics. Ignoring this leads to a biased view of trade and overestimates its role in the decline of manufacturing employment.
• Factoring in GVCs when studying the impact of trade on labor markets reveals that trade has not been a significant contributor to declines in manufacturing jobs in advanced economies, and that job gains in services have offset job losses in manufacturing.
• However, the effects of trade can vary considerably across regions and individuals with different skill levels, compounding regional disparities and labor market polarization driven by other factors such as automation.
• Adjustment policies should not differentiate between the various reasons for worker displacement, such as automation or trade, and should be less dependent on affected workers fulfilling certain conditions.
45

46 • Technological innovation, supply chain trade, and workers in a globalized world
1. Introduction
Trade is a major source of employment in advanced economies. Estimates suggest that exports supported 12 million jobs in 2014 in the United States alone.1 The importance of exports for employment becomes even
more apparent when expressed in terms of shares. Figure 2.1 shows that exports may account for almost 50% of jobs in Ireland and around 30% of jobs in Germany. Similarly, imports can con-tribute to employment. By reducing the costs of production, they can lead to higher demand which can translate into more jobs.2
In addition, jobs supported by imports or exports pay a signif-icant premium when compared to jobs supported by domestic demand. Martins and Opromolla (2011) find that average wages are up to 30% higher in exporting and importing plants com-pared to non-trading plants.
Despite this positive role, trade has recently been caught in the crossfire in the discussion around the decline of manufacturing employment in advanced economies. In fact, foreign competition has been blamed for job and income losses for many decades. In particular the rise of new economic powerhouses has tradi-tionally caused popular backlashes against liberal trade regimes in incumbent countries leading to policies that increase barriers to imports. Examples reach from the British Merchandise Marks Act of 1887 targeted at German imports to Japan’s 1981 volun-tary export restraints. Today, import competition from emerging markets and formerly planned Eastern European economies has been mentioned among the main factors behind the labor market adjustments that have taken place over the last decades. A series of recent empirical studies find that trade liberalization epi-sodes have had a detrimental impact on labor market outcomes.
A prominent role in this regard has been given to China’s WTO accession in 2001 (Autor et al., 2013; Pierce and Schott, 2016), the conclusion of NAFTA in 1994 (Hakobyan and McLaren, 2016), and the EU enlargement in 2004 (Braakmann and Vogel, 2011).
Since the results of these studies are contrary to the common view among economists that trade has only minor employment impacts,3 several literature surveys have recently re-examined the role of international trade for labor market outcomes to reach a conclusive and comprehensive assessment of trade’s impact on employment and wages.4 This chapter summarizes the findings of these surveys but, crucially, also sheds light on a topic that has not received sufficient attention in recent articles: the impact of the expansion of value chains on the relationship between trade and labor markets.
As discussed in the first chapter of this report and its 2017 predecessor, the rise of domestic and international production fragmentation has proceeded rapidly in recent decades. Firms have unbundled their factories and outsourced production stages across the globe. This has major implications for the inter-actions between trade and labor markets, and it is important to examine them separately from the wider trade and labor market discussion to fully understand their effects. Three main conse-quences of value chains can be highlighted.
Firstly, the impact of import competition on labor markets is not limited to import-competing industries anymore. Instead, downstream customers and upstream suppliers are affected much more than in a non-fragmented economy. Therefore, trade shocks propagate more widely through the economy than in the past. For instance, when an industry contracts due to for-eign competition this will hurt its upstream supplier industries and the suppliers’ suppliers since they will face lower demand.
FIGURE 2.1 Domestic employment supported by exports
0%
10%
20%
30%
40%
50%
AUS CAN CHE DEU DNK ESP EU FIN FRA GBR IRL ITA JPN NLD NOR SWE USA
Indirect
Direct
Notes: Authors’ calculations based on 2014 data from the World Input Output Database (WIOD). For the methodology please refer to Calì et al. (2016). Direct
refers to employment supported in exporting establishments using the share of exports in total output of these establishments. Indirect refers to employment
supported in establishments that supply exporters and depend on foreign demand via these supply linkages. In many countries more than half of the jobs sup-
ported by exports are due to indirect value chain linkages.

Trade, value chains and labor markets in advanced economies • 47
Downstream customers, on the other hand, could benefit from cheaper inputs that foreign competition implies. As a result, it is necessary to take into account input-output linkages between industries as well as the position of industries in the value chain when analyzing the effect of trade on labor markets. This becomes strikingly clear when looking at Figure 2.1. It shows that in several advanced economies more than half of the jobs sup-ported by exports are not within exporting establishments but within supplier establishments.
Secondly, the expansion of value chains entails not only sec-tors that compete across countries but also tasks and stages. This means that competition happens at a much finer level with severe consequences for skill demand within countries. The production of many goods takes place in various stages that require different levels of skills. Value chains allow unbundling these stages spa-tially so that countries well-endowed in skilled (unskilled) labor can specialize in skilled (unskilled)-intensive stages. This shifts aggregate skill demand much more than traditional trade, which required all stages with their different intensities to be performed domestically, and might lead to an increased polarization of the labor market.
Thirdly, value chains imply that traditional gross trade sta-tistics are insufficient to properly assess the impact of trade on labor markets because they mis-measure the scale and scope of import competition. For example, when firms offshore assembly stages but keep upstream stages domestic, gross import statis-tics heavily overstate import competition because they suggest that the complete value chain was offshored. Even if all stages are offshored, gross import statistics tend to falsely assign competi-tion to downstream industries because they suggest that the full value of an imported good has been created by the downstream exporting industry when in fact much of the value is supplied by foreign upstream industries. This causes competition to be over-stated downstream but understated upstream.
Due to these three changes, a comprehensive overview of the impact of trade on labor markets requires a value chain perspec-tive. Moreover, a value chain perspective is not only relevant to correctly assess whether trade boosts employment and wages or not, but it also changes subsequent policy recommendations. For example, when trade shocks spread more widely within econ-omies and when competition moves to ever finer degrees, it becomes increasingly difficult to target individuals hurt by trade.
This chapter discusses the three changes and their implica-tions for the relationship between trade and labor markets and for adjustment policies along four major debates surrounding labor markets in advanced economies. The four debates concern the role of trade in:
• the decline of manufacturing employment, • nation-wide employment trends, • the rise in regional inequality, and • the increase in labor market polarization. In each case, the discussion starts with a summary of the
results of studies that do not take value chains into account and then highlights the additional insights that value chain studies can add.
The chapter shows that trade is likely to raise aggregate employment and real wages and that taking a value chain per-spective is important. In particular, cost savings due to cheap imports and export opportunities create employment in many sectors of the economy that do not trade directly but benefit from trade through input-output linkages. Even when the focus is on the manufacturing sector, the evidence paints a more benign picture of trade which contrasts with popular perception. Once the rise of value chains is properly accounted for, it suggests that trade has contributed at best a relatively small share to the decline of manufacturing employment in advanced economies.
Trade has, however, contributed to regional and individual disparities. Since industries tend to cluster regionally, studies show that the impact of trade is very heterogeneous across geo-graphic areas. While trade benefits labor markets in regions with exporting industries and industries that rely on imported inputs, it might hurt regions that compete directly with foreign pro-ducers. Therefore, it leads to a spatial divergence in economic activity. Similarly, trade is shown to increase the demand for skills and, thus, has uneven effects across individuals, a trend that has been aggravated by the rise of value chains. This is where policy intervention has the potential to play an important role. The right interventions can spread the gains from trade more evenly and guarantee that regions and individuals are not hurt by globalization.
The chapter proceeds as follows. Section 2 discusses the role of trade in the decline of manufacturing employment. Section 3 assesses how trade affects aggregate nationwide labor market outcomes. Section 4 examines the impact of trade on regional inequality. Section 5 analyses the impact on skill demand and the polarization of the labor market. Section 6 proposes potential policy responses. Section 7 concludes.
2. Trade, GVCs, and the decline of manufacturing employment
One of the most contested issues in the trade and labor market debate is whether and by how much imports have contributed to the decline of manufacturing employment in advanced econ-omies vis-à-vis alternative factors such as technology-driven productivity improvements or changes in preferences towards services. Across all high-income economies the share of man-ufacturing employment in total employment has been steadily declining for decades which has attracted considerable atten-tion, potentially due to the fact the manufacturing jobs pay a premium even after controlling for a variety of worker character-istics (Langdon and Lehrman, 2012). In the public debate, trade has been and continues to be listed as a prime culprit behind job losses in the manufacturing sector.
Economic studies from the 1990s and early 2000s show in this regard that after a trade shock, employment in import-compet-ing industries suffers relative to employment in export-oriented sectors (e.g. Revenga, 1992). More recent studies focusing on the effects of rising Chinese import competition on US labor markets

48 • Technological innovation, supply chain trade, and workers in a globalized world
find similar results and have sparked a heated debate around the role of trade in explaining the loss of manufacturing jobs. US manufacturing employment was stable around 18 million workers between 1965 and 2000 before falling by 18 percent between 2001 and 2007. Estimates of the share of this loss of jobs due to trade based on “back-of-the-envelope” calculations in popu-lar media outlets, blogs and policy briefs range between 1 and 20 per cent (De Long, 2017; Krugman, 2016b; Hicks and Devaraj, 2015) with one author going as far as to claim that the growing manufacturing trade deficit of the United States can explain almost all of the manufacturing jobs lost in the period between 2000 and 2007 (Scott, 2015).
More rigorous economic analyses support the claim that trade has played a limited role, explaining at the very most one quarter of the recent decline. Seminal work in this area by Autor et al. (2013), who examine the increase in Chinese import compe-tition by comparing more and less exposed local labor markets in the United States, finds that it can explain around 25 per cent of the manufacturing decline. Studies based on this work show that similar but less pronounced trends can be observed in sev-eral European countries (Donoso et al., 2015; Balsvik et al., 2015; Malgouyres, 2017). There is also evidence of large productivity gains in advanced economies from trading with China, however with substantial job losses in exposed industries (Ahn and Duval, 2017). Another study shows that detrimental effects on employ-ment in manufacturing in the United States arose because of the elimination of tariff uncertainty rather than tariff reduction after China’s WTO entry (Pierce and Schott, 2016).
One explanation could be that advanced economies react to increased import-competition in manufactured goods by spe-cializing in the tradable services sector, such as business ser-vices, R&D, design or financial services, in which they typically have a comparative advantage (Spence and Hlatshwayo, 2012). The trade-induced shift from a manufacturing- to services-based economy is however not found to happen smoothly at the micro-level. Indeed, considering the movements of workers between sectors in Germany, there is little evidence that the increasing employment in service industries comes from incumbent man-ufacturing workers who directly switch jobs without undergoing an unemployment spell. Instead, the rise of services is found to be driven by young labor market entrants who exhibit different sectoral entry behaviours than previous generations, and by returnees out of non-employment who take up jobs in different industries than their previous one (Dauth et al., 2018).
However, many factors other than trade have been boosting the non-tradeable sector in advanced economies over time. For instance, changing demand patterns caused by demographic change and increased incomes favour services over manufac-turing. Moreover, Bernard and Fort (2017) suggest that part of the manufacturing decline is due to a statistical misconception, because some firms are counted as wholesalers despite their involvement in the production of goods, with Apple Inc. serv-ing as a prime example. By re-classifying these firms as manu-facturers, up to two million jobs in the US can be shown to have switched from services to manufacturing in 2007. Even more
remarkable is that half of the decline of manufacturing employ-ment in Denmark between 1994 and 2007 is due to firms switch-ing their sectoral affiliation from manufacturing to services which implies that no actual job loss has taken place in these instances (Bernard et al., 2017).
Importantly, trade implies not just import competition but also export opportunities and cheaper inputs. According to recent work, the global export expansion of US manufactur-ing products, which was supported by cheap Chinese inputs into US production, almost completely offset job losses due to import competition from China (Feenstra et al., 2017). In Ger-many, new export opportunities in Central Eastern Europe have even slowed down the decline of manufacturing employ-ment despite rising import competition (Dauth et al., 2018). In addition, Chinese imports and offshoring have reduced prices in the US considerably (Amiti et al., 2017; Handley and Limao, 2018). This is likely to lead to significant cost savings for firms and higher consumer spending. Evidence shows that these cost reductions enabled import-competing US manufacturing firms to shift resources to industries in which they enjoy a comparative advantage relative to China. This has led, in turn, to an increase in overall manufacturing employment and wages among these firms (Magyari, 2017). Cost savings have also enabled offshor-ing firms to expand onshore employment, leading to overall employment gains in offshoring industries (Kovak et al., 2017). According to recent evidence, higher consumer spending in addition with other indirect effects, such as the between-region elasticity of labor supply, can even fully cancel out manufac-turing employment losses due to Chinese import competition (Adao et al., 2019).
Another important issue brings us finally to the importance of a value chain perspective in the analysis. Value chains have spread considerably over the last decades both domestically and internationally. The average share of in-house production in total output decreased by 8% from 1995 to 2011, indicating an on-go-ing fragmentation process.5 This spatial unbundling of produc-tion has profound implications for the impact of trade on labor market outcomes. Ignoring these implications can lead to severe mismeasurement of the impact of trade shocks on employment and wages.
The foremost reason why it is important to take value chains into account when assessing the impact of trade on labor market outcomes is that the spread of value chains within and across countries has strengthened inter- and intra-industry linkages considerably over the last decades. These linkages imply that trade shocks propagate through the economy much more than in a vertically integrated world. Evidence from Belgium shows for instance that while only 7.3% of Belgian firms export, 42.4% supply exporters directly or indirectly and are thus dependent on foreign demand (Dhyne and Rubinova, 2016). Even more strik-ingly, 97% of all Belgian firms are dependent on foreign inputs even though only 15% import directly (Tintelnot et al., 2017). As a result, looking only at exporting and import-competing firms or industries when examining the trade and labor market rela-tionship means missing a major part of the picture.

Trade, value chains and labor markets in advanced economies • 49
In this context, researchers have revisited the seminal work by Autor et al. (2013) that examines the effect of Chinese import competition on labor market outcomes in US commuting zones. In contrast to the original study, the new work considers as exposed not only industries that produce the products that the US imports from China but also these industries’ upstream sup-plier and downstream customer industries (Wang et al., 2018). It thus takes a value chain perspective. The hypothesis is that supplier industries are hurt by import competition when their customers contract because the demand for their products decreases. Customer industries, on the other hand, might ben-efit from import competition affecting their suppliers since they can reduce their costs by switching from domestic to cheaper foreign suppliers, which can raise demand for their products and subsequently employment. This would be in line with recent findings showing that firms that source more inputs from abroad expand production and increase domestic sourcing as well (Antràs et al., 2017).
Extending the definition of import exposure in this value chain consistent manner attenuates the findings by Autor et al. (2013) for manufacturing employment. Wang et al. (2018) find that commuting zones more exposed to Chinese imports fare only slightly worse in terms of manufacturing employment and real wage growth than less exposed regions. This is mainly due to employment creation in downstream industries that expand, potentially due to cheaper inputs. Directly exposed industries
and upstream industries face relative employment and wage losses. These combined losses are however balanced out by the downstream gains, leading to a small negative impact of imports on manufacturing.
Other studies have performed similar exercises with different methodologies that take input-output linkages into account but have failed to observe positive effects on downstream indus-tries of the same magnitude (Acemoglu et al., 2016; Caliendo et al., 2018). They nevertheless suggest that the contribution of Chinese import competition to the decline of US manufac-turing from 2000 to 2007 is about one third smaller than the corresponding value by Autor et al. (2013) who do not have a value chain perspective. The difference regarding the magnitude of downstream effects is likely due to an improper measure of downstream and upstream exposure in the latter studies.6,7
The difference in results across these studies raises a second important point. In the age of GVCs, gross trade statistics can be misleading because they ignore complex cross-border pro-duction linkages which are better accounted for by trade in value added statistics as highlighted by chapter 1 of this report. In particular, recent research highlights that by relying on gross trade data many studies on Chinese import competition ignore the high amount of US value added in Chinese exports to the US, the high services and primary sector content in manufac-turing exports, as well as double counting due to back-and-forth trade.8 Figure 2.2 illustrates this point by showing that the
FIGURE 2.2 Value added sources of Chinese manufacturing exports(% share of exports)
0 25 50 75 100
Food, beverages and tobacco
Textiles and textile products
Leather, leather and footwear
Wood and products of wood and cork
Pulp, paper, printing and publishing
Coke, refined petroleum nuclear fuel
Chemicals and chemical products
Rubber and plastics
Other non-metallic mineral
Basic metals and fabricated metal
Machinery, nec
Electrical and optical equipment
Transport equipment
Manufacturing, nec; recycling
Primary industries
Service industries
Own industry
Other manufacturingindustries
Notes: Author’s calculations based on ADB-WIOD data for 2015. The chart highlights that the majority of value added in an industry’s manufacturing exports is
sourced from other industries, in many cases outside of manufacturing.

50 • Technological innovation, supply chain trade, and workers in a globalized world
majority of value added in manufacturing exports is not added in the exporting industry but in upstream industries, including services. These three factors limit import competition exposure of manufacturing industries considerably. When using the more appropriate value-added trade statistics, the effect of Chinese import competition is reduced by about one third (Jakubik and Stolzenburg, 2018).
In sum, once exports, input-output linkages, and value-added trade statistics are accounted for, trade seems to have contrib-uted to the recent decline in manufacturing employment in advanced economies only to a very small degree, if at all. In fact, trade even slowed the decline down in some countries, such as Germany. Separate from this, and potentially more important, is the question of how trade has affected the overall number of jobs across all sectors. After all, manufacturing is only responsi-ble for a minor share of overall employment in most advanced economies. This question is discussed in the next section.
3. Trade, GVCs, and nation-wide labor market outcomes
As said above, other sectors than manufacturing make up for most of employment in advanced economies, in particular the services sector. Since more and more services become tradable or linked to foreign competition and demand through input-out-put linkages, aggregate labor market effects of trade have become increasingly distinct from its effect on manufacturing. This further highlights the importance of a value chain perspec-tive for assessments of the trade and labor market relationship.
Theories of international trade typically suggest that trade should not have a major effect on the aggregate level of employ-ment. They tend to predict that trade has second order effects by shifting resources across firms and sectors, which can affect aggregate employment if labor market frictions are sector or firm-specific (Helpman and Itskhoki, 2010; Davis and Harrigan, 2011; Carrère et al., 2015). They stress however that the dominant determinant of unemployment is country-, sector- and firm-spe-cific labor market institutions.
Descriptive statistics are broadly in line with what economic theory predicts. In contrast to a relatively widespread perception in developed countries, trends in aggregate labor market out-comes, such as labor force participation, employment-to-pop-ulation ratios, the unemployment rate or real wages have not shown dramatic changes since the early 1990s, other than those related to the Great Recession (World Trade Organization (WTO), 2017). There is no increasing trend in unemployment or decreasing trend in labor force participation that is common to developed countries and could potentially be related to glo-balization or more specifically to the expansion of North-South trade. What can be observed however, are differences in the levels of employment indicators across countries, which suggests that country-specific factors play an important role in explaining labor market outcomes.
Of course, theory can be based on false assumptions and descriptive statistics can be misleading. Therefore, it is important to examine the empirical literature to see if it confirms the pre-dictions. Different methodologies have been applied to assess the relationship between trade and aggregate employment, and all are broadly in line with theory and simple correlations. For instance, cross-country econometric studies that estimate the effect of changes in trade policy or trade openness on changes in employment find that trade shocks reduce unemployment mod-estly. A 1 per cent decrease in tariffs is estimated to lower unem-ployment by about 0.35 per cent, while a 10 percentage point increase in trade openness is found to reduce aggregate unem-ployment by about three-quarters of a percentage point (Dutt et al., 2009; Felbermayr et al., 2011). Using novel value-added trade statistics, one study finds that the 2004 EU Enlargement led to employment gains of up to 0.11% in EU15 countries (Kaplan et al., 2018).
Similarly, an input-output analysis of trade-induced labor demand changes finds that trade added close to one million jobs to the US economy from 1995 to 2011, mostly due to an increase in services exports (Feenstra and Sasahara, 2017). An important feature of the study for the purposes of this chapter is that it highlights how important input-output linkages are for the outcome. For instance, it shows that exports generated 4.1 million additional jobs in services sectors, of which about 1.4 million were not due to services exports but rather to services embedded in manufacturing exports through cross-sector value chain linkages.
Other studies have estimated the effect of trade on aggre-gate employment by simulating the effects of trade flow or policy changes in structural models of trade. Applications of this approach lead to remarkably similar conclusions. For example, an analysis of the rise of Chinese import competition suggests that the US has experienced aggregate employment gains due to the expansion of services industries that benefit from cheap imported inputs (Adao et al., 2019; Caliendo et al., 2018). A related study on NAFTA emphasizes the relevance of taking input-output linkages into account in this approach by showing that in their absence some effects are underestimated by 50% (Caliendo and Parro, 2015).
One study with a similar approach finds that a return to most-favored-nation (MFN) tariffs between Britain and the EU-27 would lead to significant job losses in both Britain and the EU27. The same model predicts that a potential EU-US trade agreement, which would eliminate all import tariffs and reduce non-tariff barriers, would create about 0.35 million jobs in the US and over 1 million jobs in the EU. It then highlights that between 60% and 72% of the employment effects of these policy shocks would be due to indirect effects caused by value chain linkages rather than due to direct effects (Vandenbussche et al., 2017; Vandenbussche et al., 2018).9 An advantage of these two studies is that they rely on value added trade data and, therefore, avoid the pitfalls of gross trade data pointed out by Jakubik and Stol-zenburg (2018).

Trade, value chains and labor markets in advanced economies • 51
National effects could also be inferred from intra-coun-try studies. A study exploiting differences in exposure of US commuting zones to Chinese import competition finds that labor markets in more exposed regions perform better than less exposed labor markets as negative effects of trade on manufacturing employment are more than offset by trade-in-duced gains in services employment (Wang et al., 2018). If less exposed labor markets incur only minimal employment and wage changes due to trade, then the effects of trade on labor market outcomes at the national level should be positive. Consequently, this approach further confirms the finding that trade leads to moderate but positive changes in labor market outcomes. Interestingly, the study also highlights, similar to Feenstra and Sasahara (2017) and Caliendo et al. (2018), that local job gains in services industries that benefit from cheap Chinese manufacturing inputs are of paramount importance for this finding.
Given the relative unanimity in the findings of studies that apply a large variety of methods, it is safe to conclude that trade has a small but positive effect on aggregate labor market out-comes in advanced economies. Due to the changing industrial structure of advanced economies, these gains mainly accrue in the services sector where many high-income countries have a comparative advantage. Once again, assessing the question from a value chain perspective has a major impact on the results and is central to the conclusion.
4. Trade, GVCs, and regional divergence
The finding that trade leads to small positive labor market out-comes at the aggregate level could conceal substantial het-erogeneity in effects at the regional level. Since trade shifts resources across sectors and firms and since the distribution of sectors and firms across regions is not uniform, trade shocks should affect regions differently depending on their industrial structure. Indeed, the same research that was discussed for the debate on the decline in manufacturing shows that the effects of trade on labor markets vary considerably by region.
Initial work found that in the absence of accounting for input-output linkages, rising imports lead to higher unemploy-ment, lower labor force participation, and reduced wages in US local labor markets that are more exposed to Chinese imports relative to less exposed labor markets. This applies to directly exposed manufacturing workers, and in terms of wage losses also to workers in non-tradable services industries whose output suf-fers from lower regional demand (Autor et al., 2013). Moreover, workers in exposed local labor markets appear to be reallocated to non-exposed industries and therefore experience greater job churning and reduced lifetime income as a consequence of increased imports from China (Autor et al., 2016; Asquith et al., 2017). These results are also corroborated by studies that look at other advanced economies, including France, Germany, Norway and Spain (Autor et al., 2016; Malgouyres, 2017; Dauth et al., 2014).
However, as was the case with manufacturing employment, once the effects of export expansion, cheaper inputs, and value chain linkages are added to the equation, the picture changes. Regions home to offshoring firms have benefitted from local employment gains due to employment expansion in offshoring firms and positive spill-over effects (Kovak et al., 2017). Moreover, the effect of import competition shocks can be attenuated at the regional level if job losses in some sectors or firms are compen-sated by job creation in other sectors or firms in the same com-muting zone. Trade opening often means both opening of the domestic market and improved access to export markets at the same time, and firms that gain access to foreign markets raise their exports and generate new jobs. One study concludes that since many import-competing regions in the US also export or benefit from cheaper inputs, the effects basically balance out and exposed and unexposed local labor markets follow a similar trend (Feenstra et al., 2017). Industrial diversification is therefore a key aspect for a fast and smooth regional adjustment to trade. Evidence from Germany shows that when regions are too con-centrated, trade can widen regional disparities despite its posi-tive aggregate effect (Yi et al., 2017).
As with exports, analyses of input-output linkages can uncover positive effects of import competition by illustrating how industries might benefit from cheaper inputs. The advan-tage of analysis at the regional level compared to the with-in-manufacturing level is that one can capture a wider set of industries that benefit from cheaper inputs. After all, many ser-vices industries rely on manufacturing inputs as well. One study finds in this regard that Chinese imports raised US employment in the construction industry alone by 50,000 workers (Caliendo et al., 2018). More generally, the inclusion of the services sector in the analysis made possible by comparing regions is important because manufacturing represents only a small share of employ-ment. According to data from the Federal Reserve Bank of St. Louis, manufacturing accounted for only 20% of employment in Germany and 10% in the US in 2012. In contrast, industries that use manufacturing imports as inputs cover almost the entirety of employment. This observation is highlighted in Figure 2.3 which shows by how much industries are exposed to manufacturing import competition, differentiated into three different forms of exposure. The figure shows that while direct import competi-tion is limited mainly to manufacturing, downstream exposure is prevalent in all sectors. This can explain why downstream employment creation can more than offset employment losses in upstream and directly exposed industries within the same local labor market, as shown by Wang et al. (2018).10
Finally, using value added data can show a very different picture of the geography of trade shocks than that indicated by analysis based on gross trade flows as Figure 2.4 shows. Loca-tions specialized in downstream industries, in particular electrical machinery and electronic equipment, are much less exposed to import competition than what gross imports would suggest. On the other hand, the opposite holds for certain locations special-ized in upstream manufacturing, including steel. Two extreme cases in this regard are San Jose, California, home to Silicon
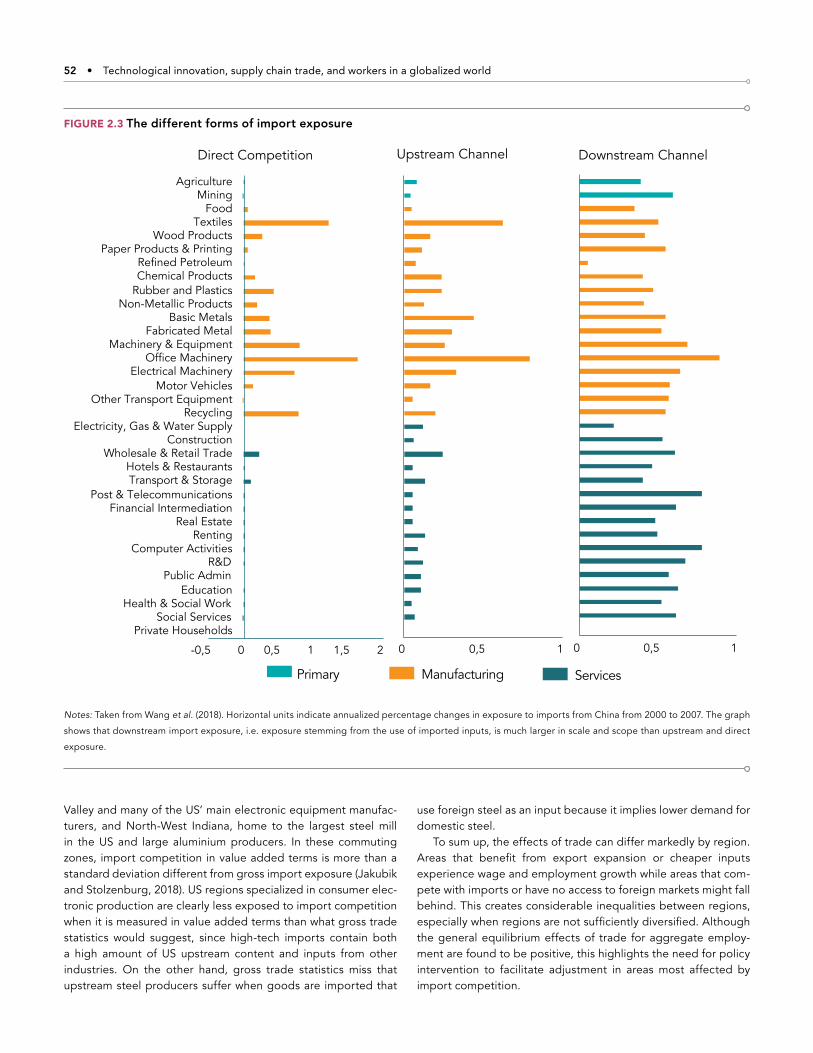
52 • Technological innovation, supply chain trade, and workers in a globalized world
Valley and many of the US’ main electronic equipment manufac-turers, and North-West Indiana, home to the largest steel mill in the US and large aluminium producers. In these commuting zones, import competition in value added terms is more than a standard deviation different from gross import exposure (Jakubik and Stolzenburg, 2018). US regions specialized in consumer elec-tronic production are clearly less exposed to import competition when it is measured in value added terms than what gross trade statistics would suggest, since high-tech imports contain both a high amount of US upstream content and inputs from other industries. On the other hand, gross trade statistics miss that upstream steel producers suffer when goods are imported that
use foreign steel as an input because it implies lower demand for domestic steel.
To sum up, the effects of trade can differ markedly by region. Areas that benefit from export expansion or cheaper inputs experience wage and employment growth while areas that com-pete with imports or have no access to foreign markets might fall behind. This creates considerable inequalities between regions, especially when regions are not sufficiently diversified. Although the general equilibrium effects of trade for aggregate employ-ment are found to be positive, this highlights the need for policy intervention to facilitate adjustment in areas most affected by import competition.
FIGURE 2.3 The different forms of import exposure
0 0,5 10 0,5 1-0,5 0 0,5 1 1,5 2
Private HouseholdsSocial Services
Health & Social WorkEducation
Public AdminR&D
Computer ActivitiesRenting
Real EstateFinancial Intermediation
Post & TelecommunicationsTransport & StorageHotels & Restaurants
Wholesale & Retail TradeConstruction
Electricity, Gas & Water SupplyRecycling
Other Transport EquipmentMotor Vehicles
Electrical MachineryOffice Machinery
Machinery & EquipmentFabricated Metal
Basic MetalsNon-Metallic Products
Rubber and PlasticsChemical ProductsRefined Petroleum
Paper Products & PrintingWood Products
TextilesFood
MiningAgriculture
Direct Competition Upstream Channel Downstream Channel
Primary Manufacturing Services
Notes: Taken from Wang et al. (2018). Horizontal units indicate annualized percentage changes in exposure to imports from China from 2000 to 2007. The graph
shows that downstream import exposure, i.e. exposure stemming from the use of imported inputs, is much larger in scale and scope than upstream and direct
exposure.

Trade, value chains and labor markets in advanced economies • 53
5. Trade, GVCs, and labor market polarization
This section finally turns to the question whether trade has con-tributed to a polarization of labor markets in advanced economies. Polarization refers to a rise in low- and high-skilled employment at the expense of medium-skilled jobs and has been observed across a wide range of advanced economies, as can be seen in Figure 2.5. Trade may play a role here because it can significantly affect the composition of employment by task and by occupation, in addition to trade’s impact on the structure of employment by sector or by region. The new jobs that trade creates in more pro-ductive sectors and firms are not necessarily the same as those that disappear in import-competing industries or firms. Rather, together with technology, trade tends to increase the demand for high-skilled workers compared to mid- and low-skilled workers, and to decrease the demand for mid-skilled workers performing routine tasks compared to both high- and low-skilled categories. In order to account for this, it is necessary to examine the effect of trade on the demand for specific tasks, distinguishing in particu-lar between routine and non-routine tasks.
Both traditional and more recent trade theories predict that trade should raise the demand for high-skilled relative to low-skilled workers. The traditional factor-endowment theory of comparative advantage predicts that trade will increase the rel-ative demand for skills in an advanced economy that is relatively skill-abundant. More recent theories point out several additional
channels through which trade can lead to an increasing demand for skills, not only in developed countries. For instance, an increase in the relative demand for high-skilled workers can come from a trade-induced change in the firm composition. When trade liberalization opens new trading opportunities, the most productive firms try to seize them and expand their production. At the same time, international trade stiffens competition in the domestic market, leading the least efficient firms to reduce their sales or close down. High-productivity expanding firms tend to be more skill-intensive than low-productivity downsizing firms, and therefore this change in firm composition may translate into an increase in the relative demand for high-skilled workers irre-spective of the industry specialization (Helpman et al., 2010). In addition, trade may increase the rewards for skill-biased technical change, which further raises skill demand (Bustos, 2011).
The rise of value chains is likely to have exacerbated this phe-nomenon since it allows for the offshoring of not just complete production processes but production stages (Baldwin, 2016). Theory suggests that as offshoring costs fall, firms in developed economies can relocate more production stages to developing economies which will allow the former to technologically upgrade and specialize in a narrower set of stages that are relatively skill-in-tensive corresponding to their comparative advantage (Feenstra and Hanson, 1995; Grossman and Rossi-Hansberg, 2008; Lee and Yi, 2018). Moreover, foreign demand for high quality goods causes exporters to demand technological upgrading also from
FIGURE 2.4 Difference in import exposure between gross trade and value added trade
1.85 − 4.760.92 − 1.850.00 − 0.92−0.92 − 0.00−1.21 − −0.92
Notes: Taken from Jakubik and Stolzenburg (2018). The colour scale differentiates between below and above one standard deviation of gross trade based ex-
posure differences. The units are in USD 1000 per worker. The graph shows that a value added import based exposure measure differs in some regions sharply
from a gross trade one.

54 • Technological innovation, supply chain trade, and workers in a globalized world
their suppliers which in turn have access to cheaper but more skill demanding inputs from abroad. This causes the upskilling effect to propagate through the supply chain. As a result, skill intensity has been shown to increase in close to one third of firms that nei-ther import nor export (Fieler et al., 2018).
Empirical research supports the view that international trade increases the relative employment of skilled workers in devel-oped countries. Detailed information on the skill structure within French manufacturing firms shows that firms employ relatively more skilled workers in marketing and development when they sell their products outside of France (Maurin et al., 2002). Other studies show that import competition leads to skill upgrading through its impact on product and process innovation. Using firm-level data for twelve European countries over the period 1996 to 2007, Bloom et al. (2016) estimate that increased trade with China accounted for about 15 per cent of the technology upgrading in Europe between 2000 and 2007. They also show that technology upgrading has had a significant impact on the relative employment of skilled workers. Supporting this evidence, an analysis of Belgian firms in the same period, 1996 to 2007, shows that import compe-tition from China led to skill upgrading in low-tech industries (Mion and Zhu, 2013). The findings suggest that the response to imports from China accounted for 27 per cent of the increase in the share of non-production workers, and for almost half of the increase in the share of highly-educated workers in the low-tech industries.
Firm-level evidence from France shows that offshoring is associated with a lower relative demand for production work-ers, especially for the less-skilled ones. Between 1986 and 1992, French manufacturing firms that increased their imports of final
goods, and which were therefore likely to engage in offshoring of the assembly stage, changed their labor force composition towards non-production activities such as marketing or distribu-tion (Biscourp and Kramarz, 2007). Evidence from the same study also shows that all types of offshoring, whether foreign sourc-ing of final goods or intermediate inputs, are associated with an increase in the share of skilled workers such as engineers or tech-nicians among the remaining production workers. Interestingly, the employment changes in this study were due to offshoring to other OECD countries, suggesting that skills upgrading within firms from high-income countries is not necessarily linked to off-shoring to low-wage countries. Rather, it appears to be associ-ated with increases in sourcing from foreign markets in general. Evidence from the United States further shows that imports of intermediate inputs from China mildly increased the relative employment of non-production workers compared to production workers (Wright, 2014). This upskilling effect has been magnified as domestic value chains have developed in China allowing for an even finer degree of specialization (Dollar et al., 2018).
Newly available data on occupational characteristics allows researchers to better characterize recent changes in the nature of work and the tasks required in each occupation beyond the high- vs low-skilled dichotomy. The types of tasks performed by a worker also determine whether a job is suitable to be offshored and whether it is susceptible to import competition from low-wage countries. Occupations that require repetitive, easily cod-ifiable tasks are easy to relocate or automate. Non-routine and manual occupations that require abstract thinking, face-to-face communication, or physical presence are much less tradeable
FIGURE 2.5 Percentage point changes in employment shares by skill level between 1995 and 2015
High skillMiddle skillLow skill
-15
-10
-5
0
5
10
Southern Europe
Northern Europe
Western Europe
Total North America
Japan Central Europe
Notes: Taken from OECD (2017). In many advanced economies the share of low- and high-skilled jobs expanded at the expense of middle-skilled jobs.

Trade, value chains and labor markets in advanced economies • 55
and automatable. Since routine tasks tend to be medium-skilled, manual tasks low-skilled and abstract tasks high-skilled, labor market polarization can arise with trade liberalization and techno-logical progress.
Firm- and worker-level evidence shows that offshoring and import competition have a small positive impact on the demand for non-routine occupations and thus on job polarization. Off-shoring by German multinational enterprises for example is asso-ciated with an increase in non-routine and interactive tasks per-formed in the onshore plants, and a higher share of high-skilled workers, accounting for about 10 to 15 per cent of these changes (Becker et al., 2013). Another recent study shows that in Denmark import competition from low-wage countries has led to a decline in routine, mid-skilled manufacturing occupations, and has there-fore contributed to an overall shift in employment towards both high- and low-skilled occupations (Keller and Utar, 2016). Evi-dence from the United States and Western Europe suggests that increased import competition measured at the occupation-level (rather than at the industry-level), and offshoring to low-income countries have brought about a relative decline in real wages, especially for low- and mid-skilled occupations intensive in rou-tine tasks (Ebenstein et al., 2014). Import competition and off-shoring are also found to reduce employment probabilities and wages for workers in exposed firms relative to those in export-ing firms, thus leading to wage polarization between skill groups and firms (Hakkala and Huttunen, 2016; Utar, 2016; Hummels et al., 2014). Finally, services offshoring also increases the relative demand for high-skilled workers in non-routine occupations but the effect is economically small (Crinò, 2010; Crinò, 2012).
However, studies that take a wider range of potential drivers of polarization into account find that technology is significantly more important in driving polarization than import competition or off-shoring in value chains (Goos et al., 2014; Autor et al., 2015; Zhu, 2017). Two recent studies stand out for accounting explicitly for the rise of GVCs. The first builds a task-based model of produc-tion in global value chains and decomposes observed changes in occupational labor demand into an automation and an offshoring component. It finds that while both factors have contributed to polarization in advanced economies, the effect of automation is dominant (Reijnders and de Vries, 2018). The second study goes a step further and decomposes changes in US labor demand into that due to participation in GVCs, competition from imports of Chinese final goods, and automation. The results suggest that import competition from China increased the share of low-skilled employment, while participation in GVCs increased the share of high-skilled employment. Trade as a combination of the two has thus contributed to polarization. The results for trade are however dwarfed by the estimates for the role of technology (Beverelli et al., 2018).
Independent of the exact driver, an increase in the demand for high- relative to low- or medium-skilled workers can translate into an increase in the share of skilled workers, an increase in the skill premium or a combination of both. In the short term, the supply of workers with a given skillset tends to be fixed and an increased demand for skills translates into increases in the skill
premium, i.e. the ratio of wages commanded by high-skilled and low-skilled workers. This higher skill premium acts as a signal for workers to increase their skill levels and acquire the appropriate type of skills. When skill supply responds to market changes, employment of high-skilled workers increases and the skill pre-mium tends to decrease. Increases in the skill premium can there-fore be an important mechanism in upskilling the labor force and consequently in advancing economic development. Due to labor market rigidities, the response of skill supply to an increased skill premium can take several years, leading to a sustained wage polarization. The ease of adjustment chiefly depends on workers’ characteristics. While high-skilled workers can adjust to changes in skill demand more promptly than low-skilled workers, upskilling or re-skilling of low-skilled workers takes more time.
Evidence from the U.S. labor market suggests that low-wage workers churn primarily among manufacturing sectors, where they are repeatedly exposed to subsequent trade shocks, while high-wage workers are better able to move across employers with minimal earnings losses and are more likely to move out of man-ufacturing conditional on separation (Autor et al., 2014; Krishna and Senses, 2014). Even when they move outside manufacturing, many workers faced with import competition have been shown to incur income losses as they land in low-skilled services jobs (Ebenstein et al., 2014). Danish evidence shows that workers in occupations that require cognitive skills either stay in mid-wage jobs or move upwards, and therefore are unaffected or benefit from import competition (Keller and Utar, 2016). It also shows that vocational training with a manufacturing focus makes mid-wage workers less vulnerable to wage declines if they stay in their job but it does not shield them from being obliged to move into low-wage jobs. Post-secondary education and vocational training with an information technology focus, on the other hand, pre-vents workers from having to move to low-wage jobs and strongly increases their chances of moving to high-wage jobs if they face import competition from a low-wage country.
To conclude, trade has contributed to an increase in the demand for skills and labor market polarization in advanced econ-omies. While it is by far not the most important factor behind these trends, its role is relevant. To make sure that the gains from trade are shared more widely across individuals with different skills, policy interventions are thus necessary. This is the focus of the next section.
6. Facilitating labor market adjustment to trade with GVCs
Economic openness, increased trade and investment, further inte-gration in GVCs, and the diffusion of technology create greater wealth and opportunities, but they also induce job displacement and political discontent. By slowing the adjustment process, labor and capital market frictions generate an efficiency loss at the aggregate level which corresponds to the income and welfare that is foregone as the economy performs below its potential. Evidence suggests that following trade opening, unemployment

56 • Technological innovation, supply chain trade, and workers in a globalized world
tends to increase before it decreases. A time-frame of 7 to 10 years appears to be necessary for economies to return to their new steady state (Arias et al., 2013; Artuç et al., 2010). Three fac-tors have been found to determine how easily countries adjust to trade, namely trade balances, the pattern of trade opening and the degree of regional diversification (Krugman, 2016a; Hakobyan and McLaren, 2016; Yi et al., 2017).
Adjustment processes also raise issues of equity, affecting the political support for an open economy. Even if on average the effects of trade are positive, workers with the wrong skills in neg-atively affected regions and/or sectors can suffer important and persistent losses. Evidence on the effects of NAFTA on the US labor market suggests, for instance, that despite average nomi-nal wages and overall employment remaining largely unaffected, certain workers who lived in more exposed areas or worked in more exposed sectors incurred earnings losses relative to less exposed peers (Hakobyan and McLaren, 2016). The combined role of location and industry exposure implied that a blue-collar foot-wear worker without a high school degree in a town specializing in footwear production was hit across several dimensions. The study reports that in the most vulnerable regions and industries, high-school dropouts experienced a decrease in wage growth over the decade of respectively 4 and 17 percentage points compared to similar workers that were less exposed. Evidence for Germany fur-ther shows that the expansion of export-oriented sectors did not benefit workers displaced by import competition. Instead, gains in these industries accrued primarily to workers from the same sector, new labor market entrants, or previously unemployed workers (Dauth et al., 2016). This is confirmed by Danish data (Keller and Utar, 2016), which suggests that many displaced mid-wage manufacturing workers moved into low-wage services jobs.
As a result of these efficiency, equity, and political economy issues, there is a strong rationale for governments to take a closer look at the concerns associated with adjustment processes and to take the necessary action to address them. This section dis-cusses how governments can facilitate adjustment to trade liber-alization with a specific focus on the challenges that arise due to value chains.
Policies that governments can implement to lower the cost of adjustment to a changing trade environment fall into three main categories: general adjustment policies, which typically consist of some combination of active labor-market policies (such as job search assistance and training) and passive labor-market policies (including income support and social insurance programs); spe-cific adjustment programmes; and other policies (including educa-tion, infrastructure, credit market, trade, mobility and place-based policies) that do not directly intervene in labor markets. Available evidence on the effectiveness of these policies suggests that there is no one-size-fits-all recipe to reduce trade-related adjust-ment costs (World Trade Organization (WTO), 2017).
General adjustment policies – which aim at addressing adjust-ment problems independently of their cause - appear to be more adequate than specific trade adjustment policies for facilitat-ing workers’ adjustment to trade in the presence of global value chains. Increasing input-output linkages between domestic and
foreign firms have caused trade shocks to spread more widely in an economy, leading to indirect employment effects up and down the value chains. Therefore, it is increasingly difficult for adversely affected workers in up- or downstream firms to qualify for spe-cific adjustment assistance. This means that not all of the adversely affected workers may be granted adjustment support, lowering the policy’s effectiveness in facilitating adjustment. Although spe-cific adjustment policies (e.g., the US Trade Adjustment Assistance program or the European Global Adjustment Fund) do cover workers from adversely-affected, first-tier upstream or down-stream producers, they fail to account for linkages between firms further up or down the value chain as well as linkages across bor-ders. General adjustment policies have the advantage that they can also support workers in those firms that are indirectly affected but do not qualify for specific adjustment assistance due to size thresholds or the difficulty to establish a clear chain of causality. More generally, non-specific adjustment policies also support workers adversely affected by technological change and other shocks which induce adjustment processes that are difficult to dis-entangle from, similar to and easy to confuse with those induced by trade. Figure 2.6 highlights that the scale and scope of these policies differs widely across advanced economies.
Training assistance and education programmes have an increasingly important role to play in facilitating adjustment to trade in global value chains. An important implication of value chain trade for labor markets is that it has transformed interna-tional competition, which now impacts economies at a much finer resolution (Baldwin, 2016). Traditionally, countries specialized in industries in which they were most competitive. With the rise of global value chains, however, comparative advantage has shifted towards the level of production stages and specific tasks within value chains. This has important implications for workers that lose their jobs in the adjustment process. While before the age of value chains it was easier to transition from sunset to sunrise sectors offering their initial human capital, these workers may now face difficulties marketing their initial skill set which might have become obsolete. As their old task might have disappeared altogether, workers either upgrade their skill sets to perform new different tasks with equal or better pay or transition without training into low-wage jobs (Keller and Utar, 2016). Therefore, training assis-tance programmes have become increasingly important in adjust-ment policies compared to employment subsidies or job search assistance, as they help displaced workers to better respond to the changing demand for skills. Effective training assistance and education policies promote skills that are relevant for multiple industries, increasing workers’ flexibility and resilience in an unpre-dictable job market (Baldwin, 2016).
Taking a value chain perspective and more broadly accounting for input-output linkages and exports when assessing the effects of trade on labor markets at the regional level does not alter the conclusion that these effects are likely to differ considerably between regions. What it does is to help identify these effects with more accuracy, thereby helping with the design of appro-priate adjustment policies. Most adjustment policies have a role to play in addressing regional adjustment difficulties but mobility

Trade, value chains and labor markets in advanced economies • 57
and place-based policies are the instruments of choice to address regional disparities in adjustment costs. When a region is nega-tively affected by import competition, some of the workers who lose their jobs and cannot find a new one may be willing to move to a region where they can be re-employed. However, because of mobility frictions they may not be able to do so. Mobility policies consist in various measures aimed at lowering or eliminating such frictions. Place-based policies can usefully complement mobil-ity policies by helping those who are negatively affected but are not willing to move. They can dampen negative effects of trade openness on local labor markets. Finally, new technologies can be utilized to bring regions that have fallen behind closer to hubs of innovation by reducing face-to-face constraints that are inherent to services delivery and many manufacturing processes. Technology also can enable training and education programs to reach a much wider and diverse audience at little cost. This can help to counter-act the forces that promote regional disparities. Importantly, suc-cessful coordination of the various policies requires cooperation between the different levels of government (Alden, 2017).
Trade in global value chains significantly affects the way gov-ernments can promote their economies’ competitiveness. Tradi-tionally, competitiveness policies aimed at fostering industries with the biggest spill-overs or at correcting market failures. They promoted investment in knowledge capital with government sponsored research, private-sector R&D subsidies and tax breaks,
in human capital with policies linked to education, training and retraining, and in infrastructure and social capital. However, as production factors, in particular financial and knowledge capital, have become much more mobile, competitiveness policies need to be targeted at those factors that are naturally more “sticky” such as certain types of human, social and physical capital as well as infrastructure in order to retain the investment’s benefits. Moretti (2012) finds that highly skilled labor presents an attractive combination of low mobility with high spill-overs whereas finan-cial capital gained for instance through tax breaks will likely flow to the place with highest return. As production structures are increasingly fragmented and productive factors increasingly more mobile, sectors have become the wrong operational unit with which to frame competitiveness and industrial policies. The focus now may rather be on cities as centres of excellence in a particular stage of production or developing to become a first-class centre (Baldwin and Evenett, 2012). In this perspective, cities should be seen as production hubs that provide a fast-adjusting range of diverse world-class services, including in particular inputs into manufactured exports, and a corresponding range of good jobs with a reasonably high level of resilience to international compe-tition (Baldwin, 2016). With their localized social capital, cities can serve as the breeding ground of innovation and can be seen as the competitive frontier of developed economies in the 21st century. With more diversified labor markets they also allow for a greater
FIGURE 2.6 Public Spending on Labor Market Policies in OECD countries(% of GDP)
0.000.250.500.751.001.251.501.752.00
Employment IncentivesStart−Up IncentivesDirect Job CreationPublic Employment Services and Administration
Sheltered and Supported Employment and RehabilitationTraining
Active Labor Market Policies
United StatesJapanIsraelChileSlovakiaEstoniaCanadaSloveniaAustraliaUnited KingdomNew ZealandRep. of KoreaCzech RepublicPolandNorwayItalyPortugalIrelandSwitzerlandSpainGermanyLuxemburgBelgiumAustriaNetherlandsHungaryFranceFinlandSwedenDenmark
0.00 0.25 0.50 0.75 1.00 1.25 1.50 1.75 2.00
Out−of−work income maintenanceEarly Retirement
Passive Labor Market Policies
Notes: Data from the OECD Labour Market Programmes database for 2015. UK data for 2011. The graph shows wide variation in scale and scope of labor market
policies across OECD countries.

58 • Technological innovation, supply chain trade, and workers in a globalized world
resilience of workers to adjust to changing economic conditions and can thereby improve the adjustment process (Yi et al., 2017).
Last but not least, with global value chains trade policy has become an even more problematic trade adjustment instrument than before, as its consequences for employment have become increasingly difficult to assess. While trade restrictions, for exam-ple in the form of safeguards, can help domestic firms to adjust by temporarily limiting import competition and increasing their share in the domestic market, they also penalize export-oriented industries and industries that benefit from cheaper inputs. Tariffs on imports of intermediates, for instance, can increase the sourc-ing cost of domestic exports and thereby worsen their competi-tiveness. Moreover, increased import tariffs can also have a nega-tive effect on domestic exporters if these are upstream suppliers of foreign firms adversely affected by the raised tariffs (Barbe and Riker, 2017). Vandenbussche et al. (2017) also point at the impor-tance of such cross-border linkages for domestic employment. They estimate that a return to MFN tariffs between the UK and the EU would cause job losses since many British firms are import-ant suppliers and buyers of continental European firms. Along the same lines, recent research suggests that spill-over effects due to supply chain linkages between manufacturing and non-manu-facturing industries have become more important over time and should be taken into account when shaping trade policy (Kühn and Viegelahn, 2018).
7. Conclusions
This chapter reviews research on the relationship between trade and labor markets in order to assess how trade has affected man-ufacturing and aggregate employment, as well as regional and skill-based inequality in advanced economies. It adds to the existing literature by taking a value chain perspective which prop-erly accounts for the rise of global value chains in the last three decades. Based on the review, it discusses how policy can facili-tate adjustment to international trade when production is increas-ingly fragmented across and within borders.
It highlights that value chain perspectives in labor market stud-ies of international trade are crucial due to three factors. Firstly, value chains imply that trade shocks are felt much more broadly in economies since firms and industries are connected through input-output linkages. Secondly, value chains have magnified trade’s impact on skill demand by allowing for specialization not only across but also within sectors according to compara-tive advantage. Thirdly, value chains make it necessary to com-plement traditional gross trade statistics with novel value added trade statistics in order to correctly measure the volume and geo-graphical incidence of trade shocks.
Taking these factors into account shows that trade leads to employment and wage gains at the national level, although in the case of employment these are small. At the sectoral level, it stresses that trade is unlikely to be a major driver of employment losses in manufacturing due to offsetting factors. While import competition can hurt employment in exposed industries and their
suppliers, cheaper imports lower costs in downstream firms which allows them to expand. In addition, export expansion has bene-fitted several manufacturing industries such that the combined effect of trade on manufacturing employment is likely to be minor.
However, moving from the nation-wide and sectoral level to regional and individual outcomes reveals substantial heterogene-ity in how these aggregate effects map out. For instance, when local labor markets within countries are not sufficiently diversi-fied, trade can widen regional disparities. Regions specialized in import-competing and upstream industries can fall behind, while areas with industries that export or benefit from cost sav-ings pull away. Similarly, trade can lead to labor market polariza-tion by favouring high-skilled employment over medium-skilled employment. While other factors like technological progress have contributed more significantly to these phenomena, policy can ensure a more even distribution of the gains from trade by addressing these inequalities.
The chapter finds that value chains make targeted or spe-cific interventions increasingly difficult. As input-output linkages cause trade shocks to spread more widely within economies, import competition is less and less limited in terms of industries, regions, or skill levels. As a consequence, it becomes important for policies that ease adjustment to trade to be more general and less dependent on affected workers fulfilling certain conditions. This is especially the case as value chains magnify trade-induced changes in skill requirements and thereby raise the demand for worker flexibility and the need for training support.
In sum, this review shows that trade benefits on average not only consumers but also workers. This finding goes against common views in public discussions and highlights the need for better com-munication on the benefits of trade. It also shows that there is an important part to play for policy as these benefits tend to cluster regionally and among individuals with the right characteristics.
As always, a number of caveats apply. Beyond those that per-tain to the generalization of country-specific results, two caveats are worth emphasizing here. First, this paper does not discuss the effects of trade in the presence of value chains on other out-comes such as, for example, labor force participation, employ-ment volatility, the geographical mobility of workers, the labor share of income, or indirect effects on political, sociological, or health outcomes, etc. This is mostly because of a lack of evidence, but also because there seems to be considerable heterogeneity even among developed countries with regard to the evolution of these variables. Note, however, that it is not unreasonable to assume that evidence concerning these other effects would be in line with the evidence on sectoral and regional employment. Second, some indirect effects of trade, notably on technology and productivity, are not taken into account. This means that a clean separation of the effects of trade from those of technology, a notoriously difficult objective to achieve given the strong inter-actions between trade and technology and the isomorphic nature of their effects, remains somewhat elusive. This should certainly not be seen as an argument against trade adjustment policies but rather as another reason why general adjustment policies should be prefered to specific trade adjustment programs.

Trade, value chains and labor markets in advanced economies • 59
Notes
1. These numbers are based on an accounting exercise. They are not
meant to suggest that an equivalent number of jobs would disappear
in autarky. Note that the estimates are likely upward biased as export-
ing firms tend to have a higher import content than non-exporting
firms and higher productivity and current input-output tables are not
able to differentiate between the two.
2. Sales and distribution of imports in particular to households are also
important contributors to jobs but not covered in this section. See
Chapter 8 for details.
3. See for instance, Krugman’s (1994, p. 25) famous quote: “It should
be possible to emphasize to students that the level of employment
is a macroeconomic issue […] with microeconomic policies like tariffs
having little net effect.”
4. See, e.g., Helpman (2016), Muendler (2017), and WTO (2017).
5. Authors’ calculation based on OECD-WTO TiVA data.
6. Positive downstream effects of Chinese imports have also been shown
for Japanese firm sales (Fabinger et al., 2017).
7. Wang et al. (2018) argue that to properly capture the impact on down-
stream producers it is for instance central to differentiate between
intermediate and final goods imports, since only the former has the
potential to reduce input prices. Failing to do so will lead to mea-
surement error biasing estimates towards zero. Similarly, cross-border
input trade might differ from intra-country input trade. The assump-
tion that US industries source nationally in the same way as from
abroad ignores that countries specialize within value chains and thus
provide different types of inputs. This equally causes measurement
error.
8. In the age of value chains gross trade data suffers from double count-
ing when intermediates cross the same border twice. If for example,
China produces phone cases and ships them to the US where high-
tech components are inserted before the phone travels back to China
for final assembly, then the phone case would be counted twice by
gross trade data.
9. Carrere et al. (2015) find a small increase in the US unemployment
rate due to a potential EU-US trade agreement but they don’t account
for input-output linkages. Moreover, they show that replacing NAFTA
with 20% import tariffs would increase unemployment by 6% in the
US and 21% in Mexico, an effect that might become even larger with
input-output linkages that magnify sectoral effects.
10. As was the case for manufacturing employment, Acemoglu et al.
(2016) and Caliendo et al. (2018) find a more muted balancing effect
of input-output linkages on regional disparity due to the issues out-
lined in the section on manufacturing employment.
References
Acemoglu, D., Autor, D. H., Dorn, D., Hanson, G. H. and Price, B. (2016),
‘Import Competition and the Great US Employment Sag of the 2000s’,
Journal of Labor Economics 34(S1): S141-S198.
Adao, R., Arkolakis, C., and Esposito, F. (2019), ‘Spatial Linkages, Global
Shocks, and Local Labor Markets: Theory and Evidence’, NBER Working
Paper No. 25544.
Ahn, J. and Duval, R. (2017), ‘Trading wtih China: Productivity Gains, Job
Losses’, IMF Working Paper No. 122, International Monetary Fund,
Washington D.C.
Alden, E. (2017), Failure to Adjust: How Americans Got Left Behind in the
Global Economy, Rowman & Littlefield.
Amiti, M., Dai, M., Feenstra, R. C. and Romalis, J. C. (2017), ‘How Did China’s
WTO Entry Benefit U.S. Consumers?’, NBER Working Paper No. 23487.
Antràs, P., Fort, T. C. and Tintelnot, F. (2017), ‘The margins of global sourcing:
Theory and evidence from US firms’, American Economic Review 107(9):
2514-2564.
Arias, J., Artuc, E., Lederman, D. and Rojas, D. (2013), ‘Trade, informal
employment and labor adjustment costs’, World Bank Policy Research
Working Paper No. 6614.
Artuç, E., Chaudhuri, S. and McLaren, J. (2010), ‘Trade shocks and labor
adjustment: A structural empirical approach’, The American Economic
Review 100(3): 1008-1045.
Asquith, B. J., Goswami, S., Neumark, D. and Rodriguez-Lopez, A. (2017),
‘U.S. Job Flows and the China Shock’, NBER Working Paper No. 24080.
Autor, D. H., Dorn, D. and Hanson, G. H. (2013), ‘The China Syndrome:
Local Labor Market Effects of Import Competition in the United States’,
American Economic Review 103(6): 2121-2168.
Autor, D. H., Dorn, D. and Hanson, G. H. (2014), ‘Trade adjustment: Worker
level evidence’, The Quarterly Journal of Economics 129(4): 1553-1623.
Autor, D. H., Dorn, D. and Hanson, G. H. (2015), ‘Untangling Trade and
Technology: Evidence from Local Labour Markets’, Economic Journal
125(584): 621-646.
Autor, D. H., Dorn, D. and Hanson, G. H. (2016), ‘The China shock: Learn-
ing from labor market adjustment to large changes in trade’, Annual
Review of Economics 8: 205-240.
Baldwin, R. and Evenett, S. (2012), ‘Value creation and trade in 21st century
manufacturing: What policies for UK manufacturing?’, in Greenaway, D.
(ed), The UK in a Global World, [4] London: Center for Economic Policy
Research: 71-128.
Baldwin, R. (2016), The Great Convergence: Information Technology and
the New Globalization, Cambridge (MA): Belknap Press.
Balsvik, R., Jensen, S. and Salvanes, K. G. (2015), ‘Made in China, sold
in Norway: Local labor market effects of an import shock’, Journal of
Public Economics 127: 137-144.
Barbe, A. and Riker, D. (2017), ‘The Effects of Tariffs on Employment in
Global Value Chains’, USITC Economics Working Paper 2017-07-A.
Becker, S., Ekholm, K. and Muendler, M. A. (2013), ‘Offshoring and
the onshore composition of tasks and skills’, Journal of International
Economics 90(1): 91-106.
Bernard, A. B. and Fort, T. C. (2017), ‘Factoryless Goods Producers in the
USA’, in Fontagné, L. and Harrison, A. (eds) , The factory-free economy:
Outsourcing, Servitization, and the Future of Industry, [5] Oxford: Oxford
Univeristy Press: 136-168.

60 • Technological innovation, supply chain trade, and workers in a globalized world
Bernard, A. B., Smeets, V. and Warzynski, F. (2017), ‘Rethinking De-Industri-
alization’, Economic Policy 32(89), 5-38.
Beverelli, C., Rubinova, S., Stolzenburg, V. and Woessner, N. (2018), ‘Did
Global Value Chains contribute to rising labour market polarization?’,
WTO, unpublished manuscript.
Biscourp, P. and Kramarz, F. (2007), ‘Employment, Skill Structure, and Inter-
national Trade: Firm-Level Evidence for France’, Journal of International
Economics 72(1): 22-51.
Bloom, N., Draka, M. and Van Reenen, J. (2016), ‘Trade induced technical
change? The impact of Chinese imports on innovation, IT and produc-
tivity.’, The Review of Economic Studies 83(1): 87-117.
Braakmann, N. and Vogel, A. (2011), ‘How does economic integration influ-
ence employment and wages in border regions? The case of the EU
enlargement 2004 and Germany’s eastern border’, Review of World
Economics 147(2): 303-323.
Bustos, P. (2011), ‘Trade Liberalization, Exports, and Technology Upgrad-
ing: Evidence on the Impact of MERCOSUR on Argentinian Firms’,
American Economic Review 101(1): 304-340.
Calì, M., Francois, J., Hollweg, C. H., Manchin, M., Oberdabernig, D. A.,
Rojas-Romagos, H., Rubinova, S., and Tomberger, P. (2016), ‘The Labor
Content of Exports Database’, World Bank Policy Research Working
Paper 7615.
Caliendo, L., Dvorkin, M. and Parro, F. (2018), ‘Trade and Labor Market
Dynamics: General Equilibrium Analysis of the China Trade Shock’, Yale
University, unpublished manuscript.
Caliendo, L. and Parro, F. (2015), ‘Estimates of the Trade and Welfare
Effects of NAFTA’, The Review of Economic Studies 82(1): 1-44.
Crinò, R. (2010), ‘Service Offshoring and White-Collar Employment’, Review
of Economic Studies 77(2): 595-632.
Crinò, R. (2012), ‘Service Offshoring and the Skill Composition of Labor
Demand’, Oxford Bulletin of Economics and Statistics 74(1): 20-57.
Dauth, W., Findeisen, S. and Suedekum, J. (2014), ‘The rise of the East and
the Far East: German labor markets and trade integration’, Journal of
the European Economic Association 12(6): 1643-1675.
Dauth, W., Findeisen, S. and Suedekum, J. (2018), ‘Trade and Manufactur-
ing Jobs in Germany’, American Economic Review 107(5): 337-342.
Dauth, W. and Suedekum, J. (2016), ‘Globalization and local profiles of eco-
nomic growth and industrial change’, Journal of Economic Geography
16(5): 1007-1034.
De Long, J. B. (2017), ‘NAFTA and other trade deals have not gutted Amer-
ican manufacturing — period’, https://www.vox.com/the-big-idea/
2017/1/24/14363148/trade-deals-nafta-wto-china-job-loss-trump.
Dhyne, E. and Rubinova, S. (2016), ‘The supplier network of exporters: Con-
necting the dots’, National Bank of Belgium Working Paper Research
No. 296.
Dollar, D., Kidder, M. and Khan, B. M. (2018), ‘The effect of production frag-
mentation on skills reallocation: Is it felt equally across levels of devel-
opment?’, UIBE, unpublished manuscript.
Donoso, V., Martin, V. and Minondo, A. (2015), ‘Do differences in the expo-
sure to Chinese imports lead to differences in local labour market out-
comes? An analysis for Spanish provinces’, Regional Studies 49(10):
1746-1764.
Dutt, P., Mitra, D. and Ranjan, P. (2009), ‘International trade and unemploy-
ment: Theory and cross-national evidence’, Journal of International
Economics 78(1): 32-44.
Ebenstein, A., Harrison, A., McMillan, M. and Phillips, S. (2014), ‘Estimat-
ing the impact of trade and offshoring on American workers using the
current population surveys’, Review of Economics and Statistics 96(4):
581-595.
Fabinger, M., Shibuya, Y. and Taniguchi, M. (2017), ‘International Influences
on Japanese Supply Chains’, RIETI Discussion Paper Series 17-E-022.
Feenstra, R. C. and Hanson, G. H. (1995), ‘Foreign Investment, Outsourcing
and Relative Wages’, NBER Working Paper No. 5121.
Feenstra, R. C., Ma, H. and Xu, Y. (2017), ‘US Exports and Employment’,
NBER Working Paper No. 24056.
Feenstra, R. C. and Sasahara, A. (2017), ‘The ‘China Shock’, Exports and
U.S. Employment: A Global Input-Output Analysis’, NBER Working
Paper No. 24022.
Felbermayr, G., Prat, J. and Schmerer, H.-J. (2011), ‘Trade and unem-
ployment: What do the data say?’, European Economic Review 55(6):
741-758.
Fieler, A. C., Eslava, M. and Xu, D. Y. (2018), ‘Trade, Quality Upgrading, and
Input Linkages: Theory and Evidence from Colombia’, American Eco-
nomic Review 108(1): 109-146.
Goos, M., Manning, A. and Salomons, A. (2014), ‘Explaining job polariza-
tion: routine-biased technological change and offshoring’, American
Economic Review 104(8): 2509-2526.
Grossman, G. M. and Rossi-Hansberg, E. (2008), ‘Trading tasks: A simple
theory of offshoring’, The American Economic Review 98(5): 1978-1997.
Hakkala, K. N. and Huttunen, K. (2016), ‘Worker-level consequences of
import shocks’, VATT Institute for Economic Research Working Paper
No. 74.
Hakobyan, S. and McLaren, J. (2016), ‘Looking for local labor market effects
of NAFTA’, Review of Economics and Statistics 98(4): 728-741.
Handley, K. and Limao, N. (2018), ‘Policy Uncertainty, Trade and Welfare:
Theory and Evidence for China and the U.S.’, American Economic
Review 107(9): 2731-2783.
Helpman, E. (2016), ‘Globalization and Wage Inequality’, NBER Working
Paper No. 22944.
Helpman, E., Itskhoki, O. and Redding, S. (2010), ‘Inequality and unem-
ployment in a global economy’, Econometrica 78(4): 1239-1283.
Hicks, M. and Devaraj, S. (2015), ‘The Myth and the Reality of Manufactur-
ing in America’, Ball State University, unpublished manuscript.
Hummels, D. L., Jørgensen, R., Munch, J. R. and Xiang, C. (2014), ‘The
Wage Effects of Offshoring: Evidence from Danish Matched Work-
er-Firm Data’, American Economic Review 104(6): 1597-1629.
Jakubik, A. and Stolzenburg, V. (2018), ‘The “China Shock” Revis-
ited: Insights From Value Added Trade Flows’, WTO Working Paper
ERSD-2018-10.
Kaplan, L. C., Kohl, T. and Martinez-Zarzoso, I. (2018), ‘Supply-chain trade
and labor market outcomes: The case of the 2004 European Union
enlargement’, Review of International Economics 26(2): 481-506.
9-25-2018.
Keller, W. and Utar, H. (2016), ‘International trade and job polarization: evi-
dence at the worker level’, CESIFO Working Paper No. 5978.
Kovak, B. K., Oldenski, L. and Sly, N. (2017), ‘The Labor Market Effects
of Offshoring by U.S. Multinational Firms: Evidence from Changes in
Global Tax Policies’, NBER Working Paper Series No. 23947.
Krishna, P. and Senses, M. Z. (2014), ‘International Trade and Labor Income
Risk in the U.S.’, Review of Economic Studies 81(1): 186-218.

Trade, value chains and labor markets in advanced economies • 61
Krugman, P. (1994), ‘What Do Undergrads Need to Know About Trade?’,
American Economic Review 83(2): 23-26.
Krugman, P. (2016a), ‘Analytics of Trade Deficits and Manufacturing Employ-
ment (Very Wonkish)’, https://krugman.blogs.nytimes.com/2016/12/26/
analytics-of-trade-deficits-and-manufacturing-employment-very-wonkish/.
Krugman, P. (2016b), ‘Trade and Manufacturing Employment: No Real Dis-
agreement’, City University of New York, unpublished manuscript.
Kühn, S. and Viegelahn, C. (2018), ‘Foreign trade barriers and jobs in global
supply chains’, International Labour Review.
Langdon, D. and Lehrman, R. (2012), ‘The Benefits of Manufacturing Jobs’,
U.S. Department of Commerce ESA Issue Brief #01-12.
Lee, E. and Yi, K. M. (2018), ‘Global Value chains and Inequality with Endog-
enous Labor Supply’, Journal of International Economics (forthcoming).
Magyari, I. (2017), ‘Firm Reorganization, Chinese Imports, and U.S. Manu-
facturing Employment’, Columbia University, unpublished manuscript.
Malgouyres, C. (2017), ‘The Impact of Chinese Import Competition on the
Local Structure of Employment and Wages: Evidence from France’,
Journal of Regional Science 57(3): 411-441.
Maurin, E., Thoenig, M. and Thesmar, D. (2002), ‘Globalization and the
demand for skill: an export based channel’, CEPR Discussion Paper No.
3406.
Mion, G. and Zhu, L. (2013), ‘Import competition from and offshoring to
China: A curse or blessing for firms?’, Journal of International Economics
89(1): 202-215.
Moretti, E. (2012), The New Geography of Jobs, Houghton Mifflin Harcourt.
Muendler, M. A. (2017), ‘Trade, Technology, and Prosperity: An Account
of Evidence from a Labor-market Perspective’, WTO Working Paper
ERSD-2017-15.
OECD (2017), ‘OECD Employment Outlook2017’, OECD Publishing, Paris.
Pierce, J. R. and Schott, P. K. (2016), ‘The surprisingly swift decline of US
manufacturing employment’, The American Economic Review 106(7):
1632-1662.
Reijnders, L. S. M. and de Vries, G. J. (2018), ‘Technology, offshoring and
the rise of non-routine jobs’, Journal of Development Economics 135:
412-432.
Revenga, A. (1992), ‘Exporting Jobs? The Impact of Import Competition on
Employment and Wages in U.S. Manufacturing’, Quarterly Journal of
Economics 107(1): 255-284.
Scott, R. E. (2015), ‘Manufacturing Job Loss’, Economic Policy Institute
Issue Brief 402.
Spence, M. and Hlatshwayo, S. (2012), ‘The Evolving Structure of the Amer-
ican Economy and the Employment Challenge’, Comparative Economic
Studies 54(4): 703-738.
Tintelnot, F., Kikkawa, A. K., Magne, M. and Dhyne, E. (2017), ‘Trade and
Domestic Production Networks’, Society for Economic Dynamics, 2017
Meeting Papers 381.
Utar, H. (2016), ‘Workers beneath the Floodgates: Impact of Low-Wage
Import Competition and Workers’ Adjustment’, CESifo Working Paper
Series No. 6224.
Vandenbussche, H., Connell, W. and Simons, W. (2017), ‘Global Value
Chains, Trade Shocks and Jobs: An Application to Brexit’, KU Leuven
Discussion Paper Series DPS17.13.
Vandenbussche, H., Connell, W. and Simons, W. (2018), ‘The cost of non-
TTIP: A Global Value Chain Approach’, CEPR Discussion Papers No.
12705.
Wang, Z., Wei, S.-J., Yu, X. and Zhu, K. (2018), ‘Re-examining the Effects of
Trading with China on Local Labor Markets: A Supply Chain Perspec-
tive’, NBER Working Paper No. 24886.
World Trade Organization (WTO) (2017) World Trade Report 2017: Trade,
Technology and Jobs, Geneva: WTO.
Wright, G. (2014), ‘Revisiting the employment impact of offshoring’, Euro-
pean Economic Review 66: 63-83.
Yi, M., Müller, S. and Stegmaier, J. (2017), ‘Industry Mix, Local Labor Mar-
kets, and the Incidence of Trade Shocks’, US Census Bureau, unpub-
lished manuscript.
Zhu, W. (2017) Heterogeneous Technological Changes and Their Impacts
on Income Inequality and Productivity Growth. Queen’s University,
Kingston, Ontario.


63
CHAPTER 3
Global value chains and employment in developing economiesClaire H. Hollweg (World Bank Group)
ABSTRACT
The emergence of global value chains – whereby goods that used to be produced within one country are now fragmented and distributed across global networks of production – has offered developing countries new opportunities to integrate into the global economy. This has also had fundamental impacts for workers in developing countries. The chapter shows that higher earnings and employment within sectors and firms is associated with GVC integration, which also sup-ports other spillovers that operate through labor markets. But it has also had distributional implications of where jobs go and the types of jobs they are. Jobs growth has occurred directly in the export sector, as well as indirectly through
linkages of exporting firms to domestic, input-supplying firms. Employment creation and wage gains have been biased towards more skilled workers in developing countries, which contrasts with the predictions of trade theory. The skill-biased nature of GVC trade is associated with increased complexity of global supply chains as well as increased use of skill-intensive inputs, notably services. New emerging trends, including automation and digitization, may further determine how employment in developing countries will be affected by GVC trade in the future. The findings point to education as well as trade and labor policies as important factors for strengthening the GVC-labor relationship.
• The emergence of GVCs has offered developing countries opportunities to integrate into the global economy, which has had a significant impact on jobs and income in GVC sectors and firms. Integration can have additional benefits for the wider economy as most jobs are generated through upstream domestic supply chains.
• Across the developing world, demand for skilled labor is rising. GVCs reinforce this trend by supporting more complex industrial organization and by relying on complementary skill-intensive services inputs.
• The impacts of technological change and increased productivity on employment linked to GVCs have been offset by growing consumer demand.

64 • Technological innovation, supply chain trade, and workers in a globalized world
1. Introduction
The emergence of global value chains – whereby goods that used to be produced within one country are now fragmented and distributed across global networks of production – has offered developing countries new
opportunities to integrate into the global economy. Countries no longer need to develop entire industries to export; firms instead can access global markets by specializing in specific products or tasks within a value chain. Today, significant parts of the devel-oping world are deeply involved in GVCs, with developing coun-tries’ share in global GVC trade estimated at about 33 percent in 2011 (Kummritz and Quast 2017).
Though powered by new technologies, the economic incen-tives for GVC trade were largely driven by access to lower-cost labor. Offshoring happened initially in assembly activities in light manufacturing, but GVCs have since expanded to agricul-tural and services sectors, as well as higher technology and more knowledge intensive manufacturing industries. This unbundling of production is expected to have implications for labor markets – where jobs go, who gets them, and what type of jobs they are (Farole 2015).
There are reasons to expect that the nationwide employment effects of GVC integration are different in developing than in developed countries. For example, workers in developing coun-tries often participate in different segments and tasks within GVCs than do workers in developed countries. Similarly, the introduction of new technologies may impact the GVC partici-pation of developed and developing countries differently. GVCs are a channel for the transmission of new technologies from developed to developing countries, which could also result in additional spillover effects of participation in terms of learning. Trade is also shown to increase the demand for skills, but the implications for workers may be different in developing countries that are abundant in unskilled labor and tend to participate in lower-skilled segments of value chains.
This chapter focuses on the nationwide implications of GVC integration for workers in developing countries, in terms of jobs and wages, sector of employment, and skills. It also explores technological change from the perspective of GVCs and its impli-cation for jobs and skills going forward. The chapter considers that GVC trade may not have the same effects on developing countries as non-GVC trade does, and takes a GVC focus when looking at these impacts. In doing so, it addresses four poli-cy-relevant questions.
First, how do GVCs impact jobs and earnings in developing countries? Supporting better jobs and higher wages are a pri-mary policy objective, which necessitates an understanding of the relationship between GVC participation and these labor market outcomes.
Second, does GVC trade have other development impacts on workers? There is a large literature showing that export-ing and importing raise productivity. Many of these impacts happen through labor markets, for example through learning
and technology dissemination. Whether and how these spillovers occur through GVC trade is important for policy.
Third, is GVC trade associated with increased demand for skilled labor in developing countries? And if so, through what channels? The factor-endowment theory of trade predicts that trade will reduce returns to unskilled labor in advanced econo-mies while raising returns to capital and skilled labor. However, the developing world shows rising relative demand for skilled labor, similar to advanced economies. Whether these trends are associated with GVC participation is important to understanding the implications of GVCs for workers.
Fourth, how are technological advancements within GVC trade affecting jobs and skills in developing countries? New technologies are transforming the production process and alter-ing our world of work (Hallward-Driemeier and Nayyar 2017), and many policy makers are deeply concerned about the impact of automation on assembly jobs in important GVC sectors.
The chapter shows that GVC integration has supported jobs and earnings, as well as other spillovers that operate through labor markets. Job and wage gains have been achieved not only within the exporting sector, but indirectly through linkages of exporting firms to domestic, input-supplying firms. However, GVC expansion in developing countries is also associated with higher relative demand for skilled workers. The chapter illus-trates that characteristics of GVCs themselves, by supporting more complex industrial organization, as well as services inputs that are complementary to value chains, can be skill-biased.
The chapter also shows that technological advancements that largely get diffused through global value chains are affecting how GVCs support jobs in developing countries. Evidence sug-gests that changes in efficiency in GVCs has negative impacts on employment linked to countries’ participation in the global production of products, all else equal. Technological innovation has also lowered the demand for low-skilled workers relatively more than compared to high-skilled workers. Nevertheless, the adverse effects of changing production technologies and effi-ciencies on employment have been offset by increased con-sumer demand, whereby the domestic consumption expendi-tures in large emerging economies such as China and India will generate new demand for labor for the global economy.
The chapter proceeds as follows. Section 2 surveys the empir-ical literature linking GVC participation to nationwide job and wage trends in developing countries. Section 3 discusses other spillovers resulting from features specific to GVCs that operate through countries’ labor markets. The potential links between GVC participation and the relative demand for skilled labor in developing countries are examined in Section 4, including spe-cific features of GVCs that could be behind this trend. Section 5 analyzes the potential implications of new technologies for GVCs from the perspective of labor markets. Section 6 identi-fies policy considerations for developing countries to achieve better labor-market outcomes from GVC participation. Section 7 concludes.

Global value chains and employment in developing economies • 65
2. GVCs and nationwide jobs and earnings in developing economies
A first step in analyzing the employment impact of GVCs on developing countries should consider not only the direct impact on jobs and wages, but also the nationwide implications for workers across sectors of the economy.
How do GVCs impact jobs and earnings in developing coun-tries? While there is a decades-long catalogue of literature on the labor market impact of trade, the literature on the relation-ship between GVCs and labor market outcomes is more nascent, though growing. Empirical studies are often limited to individual country studies and have focused mainly on high-income coun-tries, although some contributions have focused on developing countries.
Meng, Xiao, and Ye (2018) use a GVC-based structure decom-position analysis to identify determinant factors associated with the change in employment at the country level. Their decom-position is based on the World Input-Output Database (WIOD) at constant prices for the period of 2002-2007, 2007-2009, and 2009-2014. The objective is to better understand how GVCs affect employment at the country level.
Using the structural decomposition methodology, the change in employment between two different points of time can be explained by several factors, such as the change in domestic final demand, domestic production technology, exports and imports. In addition, this tool can be used to measure how much of the change in employment is caused by each of these factors. Unlike previous work, this chapter follows the approach used in Wang et al. (2017) to explicitly separate the impact of international trade into that related to traditional trade, simple GVCs and complex GVCs. This not only helps identify how changes in GVC participa-tion affect employment, but also helps measure how other fac-tors impact employment via various GVC routes.
In the model, a change in a country’s employment is decom-posed into the change in labor productivity, the change in GVC production networks (further explained by the change in pure domestic value chains, simple GVCs, and complex GVCs), and the change in final demand (further explained by the change in the level of final demand, the change in household / government / investment preferences, and the change in the structure of domestic expenditure). The results are presented in Figure 3.1 for the most recent period 2009 to 2014 for selected countries including China, India, the United States, Germany and Japan.
FIGURE 3.1 Decomposition of the change of a country’s labor between 2009 and 2014
-36%
-24%
-12%
0%
12%
24%
36%
48%
60%
-60%
-40%
-20%
0%
20%
40%
60%
80%
100%
CHN IND USA DEU JPN
Scale of foreign final demand
Scale of domestic final demand
Structure of foreign final demand
Structure of dommestic final demand
Preference of foreign investment
Preference of foreign government consumption
Preference of foreign household consumption
Preference of domestic investment
Preference of domestic government consumption
Preference of domestic household consumption
Complex GVCs
Simple GVCs
Domestic value chains
Labor intensity
Total change (right axis)
Source: Meng, Xiao, and Ye (2018).

66 • Technological innovation, supply chain trade, and workers in a globalized world
For each country, the figure plots the percentage change in jobs due to each of the separate effects, holding all else equal. Sum-ming across all effects gives the total percent change in jobs at the country level.
Increased participation in GVCs – especially in complex GVCs whereby cross-border transactions happen more than twice – is associated with employment increases in all five countries. How-ever, the positive impacts from increased participation in complex GVCs from 2009 to 2014 are getting smaller compared to the ear-lier periods analyzed in Meng, Xiao and Ye (2018). The impact of the change in simple GVCs is no longer positive for all countries, as it had previously been. Thus, the role played by GVCs in increasing employment has fallen since 2002-2007 and 2007-2009. The most important factors for employment growth are increases in domes-tic and foreign final demand, while labor productivity (output per worker) is the most important factor associated with reduced employment.
Other literature confirms the positive association between GVC participation and employment growth. The 2016 World Bank book Stitches to Riches (Lopez-Acevedo and Robertson, 2016) shows, based on data on the apparel sector in South Asia between 2000 and 2010, that when a country experiences a 1 percent increase in apparel output (which is used as a proxy for apparel exports), there is a 0.3-0.4 percent increase in employment. This increased overall welfare as workers moved out of agriculture or the infor-mal sector toward these better paying, higher value-added jobs. Shingal (2015) summarizes case studies on Vietnamese and Ban-gladeshi garments, Vietnamese and South African textiles, and Kenyan and South African horticulture. Overall, these case studies show that GVC-participation is welfare improving, in the sense that it provides opportunities for employment and income gains.
Shepherd and Stone (2012) empirically test the relationship between labor outcomes and GVC participation using a cross-sec-tion of firm-level data for OECD and emerging economies of Brazil, India, Indonesia, China and South Africa and fixed effect regres-sions. They show that firms with the strongest international link-ages, i.e. that import, export, and are foreign-owned, which serves as a proxy for GVC participation, show the highest employment levels. The positive effects of internationalization on labor demand is stronger for emerging markets than for OECD countries. Shep-herd and Stone (2012) also find that firms with the strongest inter-national linkages pay higher wages.
The relationship between GVC integration and level of employ-ment is not necessarily positive in all contexts. Imports of goods and services (backward GVC participation) matter as much as exports of intermediates (forward GVC participation) to be success-ful in GVCs, where opening up to imports is often a pre-condition to successfully export. However, there may be import-competing effects in labor markets. In the case of India, Banga (2016) examines the industry-level impact of participation in GVCs on employment during 1995-2011. Using fixed effects and GMM estimation tech-niques, the author analyzes how increasing foreign value added in output, foreign value added in exports, and domestic value added in exports of intermediate goods can affect employment growth. The results reveal that higher backward linkages have negatively
influenced employment growth in India, more so in the non-man-ufacturing industries. However, higher forward linkages did not have any significant impact on employment.
Evidence as well as intuition suggests that GVC participation will have other distributional implications with respect to where jobs go, the types of jobs they are, and who gets them. For example, GVC participation has also had important implications for gender outcomes (see Box 3.1). Shepherd and Stone (2012) find that firms with international linkages hire a larger share of female workers, providing evidence that international linkages provide greater opportunities for women to enter the formal labor market. Women who previously had difficulty accessing this type of wage work have filled many of these jobs (Barrientos, Gereffi, and Rossi 2010).
Employment and wage growth can happen both directly within exporting firms as well as indirectly through these firms’ demand for goods and services from the domestic economy, suggesting other distributional consequences. The extent to which GVCs interact with domestic labor thus depends on the linkages of exporting firms to domestic, input-supplying firms. Viet Nam is an example of a country that has benefitted greatly from trade opportunities, where exports support jobs both directly and indirectly (see Box 3.2).
The type of jobs also depends on the type of activities under-taken by firms within value chains, which also matters for GVCs development impact. As noted by Shephard and Stone (2012), the labor market impacts of assembly operations, which are rel-atively low wage and low skill, are different from those of more high technology production processes, which tend to be associ-ated with stronger relative demand for skilled labor and higher relative wages. For example, the boom in exports to the United States following the US–Viet Nam Bilateral Trade Agreement of 2001 was particularly beneficial to wages of unskilled work-ers, reduced the skill premium, and was a key driver of poverty reduction in Viet Nam because it was concentrated in unskilled, labor-intensive GVC sectors, most notably textiles (Fukase 2013; McCaig 2011).
3. GVCs and nationwide spillovers through labor markets
Are there other development impacts for workers of GVC trade? The opportunity for GVCs to impact labor markets goes beyond their direct and indirect impact on jobs and wages. There exists a large literature on spillover effects of learning by exporting as well as learning by importing. To the extent that GVC participa-tion supports domestic firms in developing countries to import and export, this can be a key channel by which GVC participation supports spillovers.
First, this can happen through access to information and open markets (Shepherd and Stone 2012), or by importing inputs that contain knowledge and technology. The governance structure of GVC relationships between lead firms and suppliers suggest additional mechanisms for knowledge spillovers. Buyers and

Global value chains and employment in developing economies • 67
BOX 3.1GVCs and gender outcomes
Evidence shows that women take on a larger share of jobs in labor-intensive value chains than do men. In sectors most intensively traded in GVCs – such as apparel, footwear, and electronics – lower-skilled, young, female workers account for the largest share of employment. In the Kenyan and Ugandan floriculture GVCs, women represent 65-75 percent of the labor force, working mostly in packhouses that offer higher incomes than on-farm labor does. In the apparel sector globally, women are a majority of the workforce. For example, in Turkey, two million of the three million workers in this sector in 2008 were women. In Bangladesh, approximately 80 percent of the gar-ment workers in the same year were women (Kumar 2017).
Yet global value chain participation does not necessarily lead to gender equality. Gender inequalities in GVC participation can manifest in a number of ways and for a number of reasons. For example, there is gender segregation both across and within
sectors. Women workers are more likely to be located in lower value-added components of value chains, are paid less than men, and are more likely to face problematic working conditions. The benefits of women’s participation in GVCs largely reflect greater numbers of jobs rather than opportunities to work in higher-pay-ing jobs within a sector (Bamber and Staritz 2016).
The disadvantages women often face in endowments, including assets, education, experience, and social capital, make it difficult for them to access the better jobs resulting from par-ticipation in GVCs. This was found to be the case in call centers in Egypt, where limited access to education, training, promotion and networks made it difficult for women to take advantage of the rising demand for higher technical skills generated by prod-uct upgrading (Ahmed 2013). These gender-intensified con-straints can restrict a country’s ability to remain competitive and upgrade to higher-value segments of the chain.
BOX 3.2Labor content of Viet Nam’s exports1
Exports have become increasingly important for jobs in Viet Nam. Following the methodology of Calì et al. (2016), Holl-weg (2017) computes the jobs content of Viet Nam’s exports using a panel of Viet Nam’s input-output tables between 1989 and 2012, matched with sectoral employment data from Viet Nam’s statistical yearbook. The calculations yield a set of linkages, both direct and indirect, across sectors of the number of jobs employed in export production. From 1989 to 2012, the total number of jobs supported by Viet Nam’s
exports – taking into account both the direct and indirect jobs – increased from 5.3 million to 20.5 million, or from less than 1 in 5 jobs to more than 2 in 5 (19% employed directly by exports and another 21% of the workforce indirectly).
The manufacturing sector dominates the number of jobs in exports. In 2012, manufacturing exports supported 11.8 million jobs, or 58 percent of total export jobs, more than a 12-fold increase since 1989. However, most of these export jobs are indirect—about 71 percent in 2012.
FIGURE 3.2 Direct, indirect (backward) and total jobs content of exports, total (left) and across sectors (right)Jobs (thousands)
Total JOBX Direct JOBX Indirect JOBX
0
5000
10000
15000
20000
25000
1989 1996 2000 2007 2012
Year
0 2000 4000 6000 8000 10000 12000
Public administration, activities of partyand membership organizations and defence
ConstructionElectricity, gas and water supply
Other services activities
Real estate, renting and business activities;scientific activities and technology
Education and training; health and social work;recreational, cultural and sporting activities
Financial intermediation
Mining
Transport, storage and communications
Hotels and restaurantsTrade
Agriculture, forestry and fishery
Manufacturing
Direct JOBX Indirect JOBX
Source: Hollweg (2017). Calculations using Viet Nam’s IO tables and employment data from Viet Nam’s Statistical Yearbook.

68 • Technological innovation, supply chain trade, and workers in a globalized world
BOX 3.3China’s import penetration in developed vs. developing countries
What has been the impact of increasing imports of Chinese intermediate goods, including on labor markets, in other countries? Increased availability of Chinese goods and services is argued to have put pressure on employment in import-competing sectors in other countries. Autor, Dorn, and Hanson (2013) and Acemoglu et al. (2016) have shown a negative employment effect from Chinese import pene-tration. Bernard, Jensen, and Schott (2006), Mion and Zhu (2013) and Bloom, Draca, and Van Reenen (2016) also show import competition effects on firm employment, survival, technology and innovation.
In the context of shared international production, how-ever, cheaper intermediate goods from China may also offer some countries competitive opportunities. Boffa, Santoni, and Taglioni (2018) quantify the impact of China’s increased import penetration of intermediate goods in terms of output and value added of partner countries. The authors build a trade-weighted measure of China’s import penetration, and empirically relate it with the growth rate of output and value added in partner countries. Since countries’ imports from China depend on their own domestic production struc-ture, this relationship may be endogenous. To overcome this endogeneity, Boffa, Santoni, and Taglioni (2018) instrument China’s import penetration with the weighted average Chi-nese intermediate import penetration in all trade partners. Rather than using trade weights (which may also be endog-
enous), an orthogonal set of weights are constructed using a gravity-model specification to predict cross-country inter-mediate flows based on bilateral exogenous determinants.
The authors show that China’s import penetration shock matters for output and value added in trading partners, but with differing effects across income groups with winners and losers (Figure 3.3). For high-income countries, higher import penetration of Chinese goods is associated with declines in gross output and value added. However, upper middle-income countries appear to have benefitted through deepening trade integration with China, where higher import penetration is associated with higher growth in gross output as well as value added. For low-income coun-tries, the results are inconclusive, as there is no relationship once additional controls are added. Overall, China’s market penetration has been an opportunity, rather than a threat, for some developing economies.
The degree of complementarity or substitution of domestic production with China’s imports is one factor potentially driving these varying results. If production struc-tures are substitutes, Chinese import penetration may dis-place local producers. On the other hand, China’s trading partners may benefit in terms of value added and output if their production structures are complementary to China’s. China requires inputs for its own production, which may stimulate foreign supply due to interregional linkages.
FIGURE 3.3 Estimated effect of China import penetration on gross output and value added
-0,2 -0,1 0 0,1 0,2 0,3 0,4 0,5 0,6 0,7
Low income
Middle income
High income
Value added Output
Note: Results of two-stage least squares estimates reported. Only significant estimates reported.
Source: Boffa, Santoni and Taglioni (2018).

Global value chains and employment in developing economies • 69
suppliers exchange not only goods and services, but also know-how and technology. Based on qualitative data, Gyeke-Dako et al. (2017) find that firms that are inserted into GVCs in Ghana, whereby governance structures are characterized by lead firms, are more likely to have employment strategies that improve the quality of employment compared with firms that do not have links with lead firms. Learnings effects and feedback loops in tacit knowledge also occurs from using more sophisticated tech-nology (MacGarvie, 2006). Similarly, there exist self-reinforcing complementarities between importing and innovation capabili-ties (Boeler, Moxnes, and Ulltveit-Moe, 2015).
Second, employer-sponsored training within GVCs can also be an effective mechanism for skills development. In Cambodia, exporters and foreign firms have a higher incidence of provid-ing training to workers than non-exporters or domestic firms. A 2012 Employer Skills Needs Survey undertaken by the ILO and National Employment Agency (NEA) have information on train-ing by ownership (foreign, Cambodian), and main market (inter-national, national, local). Nearly three quarters of foreign firms and export firms provide training to workers, compared to 57 percent of domestic firms and 61 percent of firms that service the national market.
Third, better working conditions may also result from GVC participation, as governments seek to comply with buyers’ stan-dards on health, safety and treatment of workers. Where GVC employment generates better rights and protection for workers, it can enhance social upgrading. But often this employment is insecure and unprotected, and there are significant challenges ensuring decent work and pay for more vulnerable workers. The downward pricing pressure found in many GVCs has simultane-ously led to negative social impacts. However, these outcomes do not necessarily occur automatically, and policies can support better working conditions (discussed below).
Fourth, growth and productivity spillovers can also material-ize for developing countries that participate in GVCs. For exam-ple, access to cheaper or more diversified varieties and comple-mentarities between imported inputs and domestic products leads to gains in scope and productivity, which is found to matter more than direct benefits from lower prices or higher quality of foreign inputs (Goldberg et al., 2010; Halpern, Koren, and Szeidl, 2015). Boffa, Santoni and Taglioni (2018) show that the increased supply of intermediate products by China has had output and value added gains for middle-income countries (see Box 3.3).
4. GVCs and the relative demand for skilled labor
The hallmark of globalization is big developing countries open-ing up and joining global trade. In general, such economies are abundant in unskilled labor and scarce in skilled labor and capi-tal relative to global averages. The factor-endowment theory of trade predicts that trade will reduce returns to unskilled labor in advanced economies while raising returns to capital and skilled labor. This trend has generally been observed. But the
opposite trend should occur in developing countries that open up: wages of unskilled workers, clearly the most abundant factor in many developing countries, should rise faster than other factor rewards. This has not happened in most developing countries; rather, employment creation and wage gains have been biased towards more skilled workers.
Is GVC trade associated with increased demand for skilled labor in developing countries? And if so, through what channels? A recent paper by Farole, Hollweg, and Winkler (2018) focuses on two specific patterns of GVC integration – backward (or ‘buy-ing-side’) and forward (or ‘selling-side’) – to empirically relate changes in GVC integration to changes in the relative demand for skilled labor.
Forward integration is defined by the incorporation of a firm’s exports in the production of exports by a third country, in other words, supplying intermediate inputs for other countries’ exports. For example, the Czech Republic may produce exhaust systems that are incorporated into an automobile produced in Germany, or Malaysia may produce microchips that are included in US-developed iPhone manufactured in China. This is often measured at the country-sector level in terms of overall levels (domestic value added embodied in third-country exports) and in terms of intensity (share of domestic value added embodied in third-country exports).
Backward integration is defined by the use of foreign inputs in production that is exported; in other words, buying foreign inputs in order to export. For example, Bangladesh may import textile fabric produced in Pakistan that is used to make clothing exported by Bangladesh. This is often measured at the coun-try-sector level in terms of overall levels (foreign value added in exports) and in terms of intensity (foreign share of total value added in exports).
Farole, Hollweg, and Winkler (2018) use data from the World Bank’s Labor Content of Exports (LACEX) database of 57 sec-tors for the years 2001, 2004, 2007, 2011, and 2014 and about 120 countries. The database uses input-output data from the Global Trade Analysis Project to measure the direct and indirect wages paid to produce exports by worker type. The labor market outcome is the relative demand for skilled labor (measured as wages paid to produce exports to skilled versus unskilled labor). It includes both the direct wages paid to workers in the export-ing sector, as well as the indirect wages paid to workers supply-ing domestic inputs to exports. The authors regress the labor market outcome on the log of the measure of GVC participation controlling for log of output at the country, sector and year level as well as country-sector, sector-year, and country-year fixed effects. The authors then interact the trade measure with a series of dummy variables that take the value of 1 to reflect country income level (high income, upper middle income, lower middle income, low income) and 0 if not, to detect the joint effect for that dummy of interest.
The estimated coefficient on the measure of GVC partici-pation is presented in Figure 3.4. The authors find that greater returns to skilled labor is correlated with GVC expansion on the buying side. This holds across all income categories, in particular

70 • Technological innovation, supply chain trade, and workers in a globalized world
high- and low-income countries, resulting in a U-shaped effect. The strong correlation in low-income countries runs counter to the discourse that GVC integration leads to specialization based on comparative advantage, which would presumably result in an increased demand for unskilled (low wage) labor in these coun-tries. The positive skill-biased affect associated with GVC partic-ipation as a buyer happens primarily in input-supplying sectors, with lower relative demand for skills directly in the exporting sectors. The authors find no correlation in the overall sample between GVC participation as a seller and the relative demand for skilled labor. However, high income countries show a positive relationship.
Firm-level analysis also confirms a positive and significant rela-tionship between GVCs and skilled labor. Shepherd and Stone (2012) find a positive and significant relationship between the number of skilled workers and firms with international linkages (that import, export, and are foreign owned). Applying propen-sity score matching techniques to firm-level data in a sample of 27 transition economies, Crinò (2012) find that importing inputs increases the relative demand for skilled labor. Specifically, it explains more than one quarter of the unconditional difference between importers and non-importers in the employment share of high skill workers.
Recent theories point out several channels through which trade can lead to an increasing demand for skills. For instance, an increase in the relative demand for high-skill workers can come from a trade-induced change in the firm composition. When trade liberalization opens new trading opportunities, the most productive firms try to seize them and expand their production. At the same time, international trade stiffens competition in the domestic market, leading the least efficient firms to reduce their sales or close down. High-productivity expanding firms tend to be more skill-intensive than low-productivity downsizing firms,
and therefore this change in firm composition may translate into an increase in the relative demand for high-skill workers irre-spective of the industry specialization (Helpman, Itskhoki, and Redding 2010). In addition, trade may increase the rewards for skill-biased technical change which further raises skill demand (Bustos 2011). Some studies attribute the labor demand bias against less-educated workers to both GVC participation and technological progress (discussed below).
This chapter explores three additional channels specific to GVC trade: (1) the importance of services for GVC trade, (2) the increased complexity of industrial organization in GVC trade, and (3) the skills composition of different activities performed within GVCs.
GVCs and services inputsThe emergence of GVCs has been accompanied by important changes in the services sector, where services have become crit-ical for countries’ trade, including participation and upgrading in global value chains. Services play a dual role—as inputs into manufacturing and agriculture value chains and as value chains of their own. Much of the value of manufactured goods comes from inputs of services industries; some studies estimate that services account for 40 percent of the value added of world trade (Lanz and Maurer 2015).
Differences in skills intensity across sectors mean distribu-tional implications of GVC participation on labor markets when GVC participation changes the relative demand for inputs across more- or less-skill intensive sectors. For example, ser-vices jobs are needed to manage the complexity of the supply chain and preserve production throughout the chain. Exam-ples include management, financial services, telecommunica-tions, and other services such as auditors and lawyers (Tagli-oni and Winkler, 2016), which tend to be more skill intensive.
FIGURE 3.4 Relationship between relative demand for skilled labor and GVC participation
0,02
0,009
0,012
0,025
lic
lmic
umic
hic
Foreign value added share
-0,0001
-0,0007
0,0003
lic
lmic
umic
hic
Domestic value added in 3rd country export share
(a) Buyer (b) Seller
Note: Coefficient estimate reported when statistically significant. hic = high income country; umic = upper middle income country; lmic = lower middle income
country; lic = low income country.
Source: Farole, Hollweg, and Winkler (2018).

Global value chains and employment in developing economies • 71
Calì and Hollweg (2017) show for South Africa that enhanced GVC participation in GVC-intensive sectors had distributional implications for skilled versus unskilled labor. Using the World Bank Labor Content of Exports database, the authors measure the direct and indirect labor content embodied within South Afri-ca’s exports between 2001 and 2011. They find that enhanced GVC participation in automotives and wearing apparel was asso-ciated with a decline in the relative demand for skilled labor directly employed in these GVC sectors, and an increase in the relative demand for skilled labor indirectly employed in sectors that produce inputs for GVC sectors, in particular services sectors.
Other literature confirms that GVC integration entails the use of upstream inputs that are not only more labor intensive than non-GVC exports, but also more skills intensive, as non-GVC exports rely on relatively more commodified upstream inputs (Farole and Pathikonda, 2017; Taglioni and Winkler, 2016). A case study of the impact of the Japanese Multinational Company on skilled labor in Malaysia shows that the integration of the subsidiary’s production network into its GVC spurred increas-ing needs for skill development, particularly in management and engineering services (Iberahim 2013). Fernandez-Stark, Bamber, and Gereffi (2010) show that the Chilean offshore ser-vices sector typically employs more skilled workers than other sectors: employees are typically younger, more likely to be male, and hold some level of tertiary education, most often from a technical education institution rather than a university.
GVCs and complex industrial organizationA recent study by Kidder and Dollar (2018) shows that GVC inte-gration can be biased towards more skilled workers in devel-oping countries. This happens because (i) GVCs are associated with more complex industrial organization, and (ii) more complex industrial organization is associated with more skilled labor in countries that export in GVCs.
First, Kidder and Dollar (2018) construct an average mea-sure of the value chain length, proposed by Wang et al. (2017), as a measure of complex industrial organization. That is, indus-tries with longer value chains are considered to be more com-plex. The measure is the weighted average number of produc-tion processes within the chain, starting from the product – for example, machinery – to the product’s raw inputs – for example, metal. The authors use global input-output data for 2008 from the World Input-Output Database. They also consider the length of the domestic portion of the value chain. Value chain length serves as an indication of how complex the production process has become.
The authors find a positive association between firms’ sourc-ing decisions of foreign intermediate inputs and the foreign mar-ket’s value chain length. That is, trading partners are more likely to import intermediate products from country-industries that have longer value chains. As an example, Figure 3.5 shows the destinations in which the manufacturing sectors in Mexico, China, Germany and the United States are sourcing their machinery. On the x-axis is the domestic value chain length of the source coun-try. On the y-axis is the log of the share of foreign intermediates
from the source country as a share of total foreign intermediates (i.e. the import share) in Mexico, China, Germany and the United States. There is a clear positive association between the domes-tic value chain length of the supplier and the import share from that supplier. Moreover, the strength of this correlation varies across levels of economic development; the correlation is stron-ger when the seller is from a high-income country. In sum, buyers import more from partners who have longer domestic value chains for all levels of development, but longer supply chains are more strongly correlated for high-income sellers.
What could drive this association? Buyers may prefer to estab-lish relationships with suppliers that have longer value chains, as a way to reduce the transaction costs in international trade. External transaction costs are high in international trade, and they are incurred at both the product level as well as the trading partner level. At the trading partner level, these transaction costs could include asymmetric information problems, language barri-ers, cultural differences, unfamiliar foreign contractual enforce-ment institutions, among others. Longer value chains within the supplier therefore reduces transaction costs for the importer.
Second, Kidder and Dollar (2018) empirically test the relation-ship between domestic value chain length and the skill composi-tion of the labor force, to determine to what extent lengthening of the value chain might be capable of explaining patterns in the distribution of skills. They regress the share of skilled labor in a country, industry and year on the upstream global value chain length of the industry, as well as other control variables for 2000-2008, and find a positive correlation between higher skills and longer global value chains (skills are concentrated in sectors with longer value chain length). To identify the direction of causality of this relationship, the authors then use an instrumental vari-ables approach by instrumenting value chain length with China’s trade liberalization, treated as an exogenous “China-shock”.
China is used as an exogenous shock to global value chain length of Chinese trading partners who are downstream of Chi-nese production. Imports into China are influenced by Chinese import tariffs. The impact of reducing import tariffs on partner countries’ value chain length will vary with the inherent tradabil-ity of sectors, as well as the distance to China. Kee and Tang (2015) show that the reduction in costs due to lower import tar-iffs led Chinese manufactures to substitute out of foreign goods and into domestic varieties. This in turn increased the value chain length of Chinese goods, which increases the global value chain length of trade partners who import intermediates from China. Thus, the import tariff reduction had a direct impact on both the Chinese domestic and Chinese global value chains. By interact-ing the Chinese tariffs with measures of tradability and distance, Kidder and Dollar (2018) come up with an instrument for value chain length that varies across sectors and trading partners. The authors show that the instrument is a good predictor of trading partners’ imports of intermediate products from China.
Kidder and Dollar (2018) find that value chain length itself affects the skills composition of the work force. In developed economies, there are strong positive effects on high-skilled labor, as well as moderate positive effects on medium-skilled

72 • Technological innovation, supply chain trade, and workers in a globalized world
labor. In developing economies, the results are a modest pos-itive effect on both high and medium skills. The low-skill labor share is negatively affected by value chain length in both devel-oped and developing countries.
The results are consistent with the idea that expansion of GVCs modified the usual effects of trade on the demand for factors. Services are the likely mechanism at play, as discussed above. First, skilled labor is needed to manage the value chain, in sectors like logistics and transport. Second, skilled labor is also needed in services inputs that are complementary to value chains, such as finance, telecommunications, and business services.
GVCs and upgradingThe changing nature of tasks and activities performed within value chains can also impact the relationship between GVC participation and the relative demand for skilled labor. For example, higher-value added activities such as research and development, design, brand-ing, sourcing, and customer support that make up important com-ponents of GVCs are also relatively more skill intensive.
China offers an interesting case study. Unlike the experience in other developing countries, China’s domestic value-added content in exports increased during the 2000s. Chen et al. (2018) analyze China’s domestic value added from activities in exports between 2002 and 2012, to understand whether this increase reflects a movement up the value chain towards higher value-added, skill-intensive activities.
The authors analyze China’s domestic value added from the perspective of activities in exports between 2002 and 2012. The authors used occupational data as well as inter-provincial input-output tables to distinguish between four possible busi-ness activities: R&D, fabrication, marketing, and other support services. The contribution of an activity is the wage income of workers that perform it, based on their occupation. Data is available for 42 industries in 31 provinces of China. A functional index of specialization (FS index) is constructed, which measures the relative specialization of a province for each of the possible business activities. A province is considered to have a relative specialization in the business activity if the FS index is above 1.
FIGURE 3.5 Source destination and value chain length
AUSAUT
BGRBRA
CAN CZE
DEU
DNK ESPEST
FIN
FRAGBRGRC
HUNIDN INDIRL
ITA
JPN
KOR
LTU
MEX
MLT
NLD
POL
PRT
ROU
RUS
SVK
SVN
SWE
TUR
TWN
USA
−4
−2
02
4So
urce
Cou
ntry
Inte
rmed
iate
Goo
d Pe
netr
atio
n
Source Country Value Chain Length
China Manufacturing Industry 16
AUS
AUT BGR
BRA
CAN
CZE
DNK
ESP
EST
FIN
FRA
GBRGRC
HUN
IDN
INDIRL
ITA JPN
KOR
LTU
MEX
MLT
NLD
POL
PRT
ROU
RUS
SVK
SVN
SWETUR
TWN
USA
−1
01
23
Sour
ce C
ount
ry In
term
edia
te G
ood
Pene
trat
ion
Source Country Value Chain Length
Germany Manufacturing Industry 16
AUS
AUT
BGR
BRACAN CZE
DEU
DNK
ESP
EST
FINFRA
GBR
GRC
HUN
IDN
IND
IRL
ITA
JPNKOR
LTU
MLTNLD
POLPRT
ROU
RUS
SVK
SVN
SWE
TUR
TWNUSA−4
−2
02
4So
urce
Cou
ntry
Inte
rmed
iate
Goo
d Pe
netr
atio
n
Source Country Value Chain Length
Mexico Manufacturing Industry 16
AUS
AUT BGR
BRACAN
CZE
DEU
DNK
ESPEST
FIN
FRAGBR
GRCHUNIDN IND
IRL
ITA
JPNKOR
LTU MEX
MLT
NLD
POL
PRT
ROU
RUS
SVKSVN
SWE
TUR
TWN
−4
−2
02
4So
urce
Cou
ntry
Inte
rmed
iate
Goo
d Pe
netr
atio
n
1.4 1.6 1.8 2.2 2.42 1.4 1.6 1.8 2.2 2.42
1.4 1.6 1.8 2.2 2.42 1.4 1.6 1.8 2.2 2.42
Source Country Value Chain Length
United States Manufacturing Industry 16
Note: Machinery industry 13 refers to WIOD industry code 13 ‘machinery nec’ (which corresponds to NACE industry 29). Manufacturing industry 16 refers to
WIOD industry code 16 ‘manufacturing nec’ (which corresponds to NACE industry 34135). The graph plots the share of machinery industry 13 from each source
country used by the manufacturing industry 16 in the United States, China, Germany and Mexico.
Source: Kidder and Dollar (2018).

Global value chains and employment in developing economies • 73
Figure 3.6 plots the FS index against provincial GDP per capita in 2012.
Findings suggest that the increase in China’s domestic value added in exports arose from an expansion of fabrication activ-ities in provinces such as Guangdong, Jiangsu, and Zhejiang. Moreover, there is a negative relationship between specializa-tion in fabrication activities and the GDP per capita of Chinese provinces (bottom panel of Figure 3.6). However, there is a clear sub-national variation in domestic value added from activities in exports. Richer provinces increasingly specialized in higher value added activities including R&D and sales and marketing, partic-ularly Beijing, Tianjin, and Shanghai (top and middle panels of Figure 3.6). The changing nature of global value chain activities that the economy performs therefore has skill implications.
5. GVCs, technological change, and labor markets
Technology is advancing rapidly, and innovations are increasingly disrupting production patterns around the world. Recent World Bank research shows that the increasing adoption of industrial automation, data exchange, advanced robotics, smart factories, the Internet of Things, and 3D printing – referred to as “Indus-try 4.0”, or the fourth industrial revolution – are transforming the manufacturing process and altering our world of work (Hall-ward-Driemeier and Nayyar 2017).
The introduction of these new technologies in production in developing countries often takes place through GVCs, where lead firms disseminate technology to their suppliers (Rodrik, 2018). As discussed throughout this report, these technolog-ical advancements are also shaping global value chains, and ultimately the domestic implications of GVC participation. Pol-icymakers in many developing countries engaged in GVCs are concerned about the impact of Industry 4.0, such as automation and digitization, on manufacturing assembly jobs and skills, and ultimately the welfare of their citizens.
Innovation will always be disruptive, and for the most part, Industry 4.0 can bring new opportunities for developing coun-tries to engage in and achieve the benefits of GVC participation. Digital technologies are reducing entry costs into manufactur-ing by reducing the impact of distance. 3-D printing may lower transport costs, lessen the importance of achieving economies of scale for manufacturers, and make it easier to manufacture high-quality products. New technologies in the production pro-cess can boost productivity, drive down costs, and support the speed of technological diffusion and catch-up. E-commerce platforms allow small-scale producers to sell goods directly to consumers, both domestically and for export. The information revolution has provided new opportunities for developing coun-tries to go beyond traditional services exports, such as tourism and transport, to export modern services. Many ICT-enabled professional services – which can be developed without a man-ufacturing core – can be exported electronically and also be a source of innovation or technology diffusion (Nayyar 2017).
FIGURE 3.6 Specialization by Chinese provinces and functions, 2012
0.50
1.00
1.50
2.00
2.50
0 20,000 40,000Regional GDP per capita (in yuan)
Regional GDP per capita (in yuan)
Regional GDP per capita (in yuan)
60,000 80,000
R&D activitiesFS index
FS index
FS index
TianjinJiangxi
ShanghaiJiangsu
Zhejiang
LiaoningGuangdong
Shandong
Yunnan HainanXinjiang
Guangxi
Fujian
JilinHeilongjiang
ChongqingNingxiaHebei
ShaanxiShanxi
HenanQinghai
Gansu
AnhuiSichuan
GuizhouTibet Inner Mongolia
Beijing
0.40
0.60
0.80
1.00
1.20
1.40
0 20,000 40,000 60,000 80,000
TianjinJiangxi
Shanghai
Jiangsu
Zhejiang
LiaoningGuangdong
Shandong
Yunnan
Hainan
Xinjiang
Guangxi
Fujian
JilinHeilongjiang
Chongqing
NingxiaHebeiShaanxiShanxi
Henan
Qinghai
GansuAnhuiSichuan
Guizhou
Tibet
Inner Mongolia
Beijing
Fabrication
Sales and marketing
0.50
1.00
1.50
2.00
0 20,000 40,000 60,000 80,000
TianjinJiangxi
Shanghai
Jiangsu
Zhejiang
LiaoningGuangdong
Shandong
Yunnan
Hainan
Xinjiang
GuangxiJilin
Heilongjiang
Chongqing
Ningxia
HebeiShaanxiShanxiHenanQinghai
Gansu
AnhuiSichuan
Guizhou
Tibet
Inner Mongolia
Beijing
Fujian
Note: The functional specialization (FS) index measures the income share
of the function in exports in a province relative to the income share of the
function in exports in all Chinese provinces. If the FS index is above one,
the province is said to be specialized in that function.
Source: Chen et al. (2018).

74 • Technological innovation, supply chain trade, and workers in a globalized world
Industry 4.0 also poses risks for developing countries, many of which would be felt within labor markets. Looking ahead, to the degree that new technologies associated with Industry 4.0 may be labor-saving, the concern is that robotics will replace low-skilled assembly jobs in developing countries. FoxConn recently replaced 60,000 Chinese factory workers with industrial robots (Wakefield 2016). In addition to being a risk of job loss for some countries, Industry 4.0 may also be one of missed opportunities for other countries. Robotics, 3-D printing, and other advances raise the possibility of “re-shoring” of routine activities from labor-abundant developing economies back to developed econ-omies. For instance, there is a concern that the expected migra-tion of labor-intensive activities from China to poorer economies with lower labor costs, such as those in Sub-Saharan Africa, might not happen; a re-shoring of manufacturing activity from developing back to developed countries may take place instead.
How are technological advancements within GVC trade affecting jobs and skills in developing countries? A recent study by Bertulfo, Gentile, and de Vries (2019) provides analytical evi-dence on this question, focusing specifically on the impact of the acceleration of technological progress within GVCs on jobs. The authors apply a structural decomposition method to examine the drivers of the changes in GVC jobs in 12 developing Asian economies between 2005 and 2015 using regional input output tables and labor force survey data.2 GVC jobs are defined as the jobs in a country linked to participation in global production of a particular set of products (Timmer et al. 2014; Meng, Peters, and Wang 2015). GVC jobs are further disaggregated by skill type (low, medium, high skilled) and business activity (R&D, pro-duction, logistics / sales / marketing, administration / back office, and headquarter workers).
The decomposition of the change of employment is presented in the top panel of Figure 3.7. The total change in employment in each economy can be separated into changes due to: (i) shifts within GVCs, resulting from changes within the production struc-ture of the GVC of a specific final product; (ii) shifts between GVCs, resulting from changes in consumer demand for differ-ent products; or (iii) shifts due to changes in global demand for goods and services, which is separated between domestic or foreign demand (ADB 2018). For example, if consumers increase their demand for services and lower their demand for manufac-tured goods, then employment would rise in services sectors and decline in manufacturing (shifts between GVCs). And if income increases in either the domestic or foreign economies, then employment will rise to meet the higher demand for goods (shifts due to changes in demand driven by income growth).
Shifts within GVCs are further separated into: (i) technology within GVCs, or changes in employment associated with changes in efficiency within a specific GVC; (ii) task relocation, or changes in employment as the location changes for one or more produc-tion tasks; and (iii) country-level efficiency, or changes in employ-ment from efficiency changes in an economy that participates in GVCs (ADB 2018). Technological progress is measured as a change in the efficiency units of labor, which is determined by the technical production requirements in terms of intermediate
inputs. Increased efficiency in a GVC will, ceteris paribus, lead to lower demand for jobs in a particular skill type or activity. For example, if machines replace workers in some of the produc-tion tasks in the supply chain, then this will lower the number of GVC jobs, all else equal (technology within GVCs). On the other hand, if garment manufactures decide to outsource some jobs to another economy, then the number of jobs is unchanged, but fewer workers are employed in the outsourcing economy, and more in the receiving economy (task relocation). Efficiency is also allowed to vary across economies. If productivity in an economy catches up to the productivity leader then fewer jobs would also be needed to produce the same amount of output (country-level efficiency).
The results of the structural decomposition are presented in the bottom panel of Figure 3.7. For each economy, the figure plots the percentage change in GVC jobs due to each of the sep-arate effects, holding all else equal. Summary across all effects give the total percent change in GVC jobs at the country level.
The study finds that technology within GVCs, or changes in efficiency within a specific GVC, is associated with a decrease in the levels of employment across all sectors in developing Asia. For example, increases in efficiency would have reduced GVC jobs by about 50 percent in developing Asia, holding all else equal. The estimated effect is smaller in services than in agricul-ture and manufacturing. Efficiency gains within economies has also negatively affected employment levels. For example, GVC jobs would have been lower by about 20 percent holding all else equal in developing Asia.
Nevertheless, the adverse effects of changing production technologies and efficiencies on employment have been offset by increased consumer demand. Demand for goods and ser-vices from a new Asian middle class in particular has increased employment levels. In developing Asia, for example, the increase in employment associated with own-country income is 80 per-cent, versus 8 per cent due to increased income from the rest of the world. The findings also suggest that the domestic consump-tion expenditures in large emerging economies such as China and India will generate new demand for labor for the global economy. The impact on employment of task relocation between economies that participate in GVCs is smaller and mixed.
The interaction of GVC expansion and technological change has distributional consequences. The results of Bertulfo, Gen-tile, and de Vries (2019) suggest that technological change in GVCs has been skill biased in developing Asian economies. The authors separate employment into routine and non-routine occupations, to understand how technology is impacting the skill profile of GVC-related jobs. Routine tasks include occupa-tions such as craft and related trade workers, plant and machine operators, or clerical support workers. Nonroutine tasks include services and sales workers, managers, professionals, or techni-cians. Job losses due to the implementation of technology along GVCs have been associated with a decline in both routine and nonroutine employment levels. However, the share of nonroutine (cognitive) employment has increased, meaning these types of occupations are becoming relatively more important in GVCs.

Global value chains and employment in developing economies • 75
Using a similar methodology and country coverage but for the periods 2000-2011, de Vries et al. (2016) look at changes in GVC jobs by business activities due to technological change. The results suggest that technological change within GVCs had a big effect on the relative demand for higher value added and more skill-intensive activities, such as R&D and headquarter jobs. For example, improvements in GVC technology lowered demand for production workers by about 55 million workers in China, but hardly affected demand for R&D jobs. This is suggestive evidence of technological change being to the benefit of more knowledge-intensive activities, as well as changing the sectoral profile. While automation will likely reduce the number of tradi-tional manufacturing jobs, new service jobs will also be created within the chain. The skills required for workers in these positions is less industry-specific, and more related to learning the soft-ware programs and basic computer skills (Frederick 2018).
Recent advances in automation have also sparked concerns over the impact on jobs within global value chains, particularly assembly. For example, a recent study by Chang et al. (2016) estimate that as many as 88% of Cambodian, 86% of Vietnam-ese and 64% of Indonesian wage workers could face possible replacement by automation. Nevertheless, tradable goods such as textiles, garments, and footwear continue to be labor inten-sive and do not feature much automation yet (Box 3.4).
6. Policy considerations for strengthening the labor-GVC relationship
The evidence above illustrates how integration and upgrading in GVCs has implications for labor markets in developing coun-tries. Policy can support the relationship between labor and GVC
FIGURE 3.7 Decomposing changes in labor demand
BangladeshIndia
IndonesiaMalaysia
PhilippinesChina
Republic of KoreaChinese Taipei
ThailandViet Nam
Developing Asia
% -80 -40 0 40 80 -60 -40 -20 0 20 40 0 20 40 60 80 100
First level Second level
Technology within a GVCCountry-level efficiency
Task relocation Income from own countryIncome from the rest of the world
Change inEmployment
Own country
Between GVC
Technology
Task relocation
Country-level efficiency Rest of the world
Within GVC Income
Note: Because manufacturing excludes the industry subsectors electricity, gas and water supply and construction, “all sectors” is larger than the sum of agricul-
ture, manufacturing and services. Developing Asia in the decomposition analysis includes Bangladesh, China, India, Indonesia, the Republic of Korea, Malaysia,
Mongolia, the Philippines, Sri Lanka, Chinese Taipei, Thailand, and Viet Nam.
Source: Bertulfo, Gentile, and de Vries (2019) and ADB (2018).

76 • Technological innovation, supply chain trade, and workers in a globalized world
participation in different ways. This chapter considers policies that (i) support participation of developing countries in GVCs, (ii) foster positive spillovers from GVC participation, (iii) induce upgrading to higher value added tasks within GVCs, and (iv) mediate negative effects, such as increased inequality.
First, to the extent the GVC participation supports better jobs and higher wages, policies that support developing coun-tries to participate in GVCs can support these outcomes. Tagli-oni and Winkler (2016) provide a thorough review of policies that can foster GVC participation of developing countries. Key
BOX 3.4Automation in the apparel value chain
Automation in the apparel industry is complex. Automat-ing a production process typically occurs because: (1) it is expensive to hire people to do the job; (2) the product has the potential to be contaminated if handled; or (3) the task is repetitive with minimal changes. Apparel, particularly the sewing segment, does not meet these requirements. There has historically been a pool of low cost labor from a global perspective, contamination is not an issue, and whereas the task is repetitive, it changes often. For these reasons, there has been minimal demand to automate most parts of the apparel supply chain.
Recent advances in automation have led to assessments that the apparel sector could be vulnerable to disruptive change. One report concludes that the broader textiles, clothing and footwear industry faced higher automation risks than workers in automotive and auto parts; electron-ics and electrical parts; business process outsourcing; and retail value chains (Chang et al. 2016). ASEAN nations could be in a precarious situation, according to this analysis.
The first robotic, automated production line for apparel could be operational by the end of 2018 with larger-scale implementation further ahead (Stacey and Nicolaou, 2017). Softwear Automation produces a clothes-making robot called “Sewbot.” The system was being installed in a facil-ity in the United States with the expectation of producing 1.2 million t-shirts per year at a price that is competitive with manufacturing and shipping the same material in low-wage locations (Peters, 2017). Large-volume buyers such as Walmart have expressed interest in the technology, part-nering with Softwear on trial projects (Stacey and Nicolaou, 2017). In the case of the Sewbot for t-shirts, its developers claim that one operator overseeing a t-shirt line can carry out the tasks of 10 operators in approximately half the time (Barrie, 2017). There have been similar advancements in related industries, such as footwear, in which companies such as Adidas have used computerized knitting technolo-gies for shoe mesh at facilities in Europe and North America (Emont, 2018). In the longer-term, firms from other indus-tries that have been more modular and automated for decades may also move into the apparel industry and bring production model knowledge that creates new oppor-tunities for automation that have not yet been seriously
considered. Flextronics is an example of a company in elec-tronics that is now rapidly pursuing how to use their operat-ing model in industries such as footwear.
There are, however, reasons to believe that the spread of automation in the apparel industry will not be widespread in the immediate future. The Sewbot is designed primarily for t-shirts with possible expansion to jeans. T-shirts are relatively simple to produce, with production consisting of 13 separate tasks, from quality inspection to heat transfer to collar and label attachment to steaming and hemming. Jeans, on the other hand, involve some 30-40 operations, while a dress shirt with pockets has 78 steps, or six times the number of operations to make a t-shirt (Barrie, 2017). Moreover, Sewbot’s executives believe the technology is ill-suited for more complex designs and concede that low-cost locations such as Bangladesh are likely to still have signifi-cant competitive advantages (Bain, 2018; Peters, 2017).
Another limitation is that these machines are expensive and are often only purchased by multinational enterprises (MNEs) that serve global buyers from various destinations around the world. They do this to ensure products are the same and because their production volumes are high enough to warrant the capital expenditures.
A final critical element that makes robotic automation more difficult in apparel is the fact that fabrics are flexible (drape, soft). This makes them difficult to handle through automation because tension needs to be applied in various degrees depending on the desired aesthetics of the prod-uct. The look and feel are key drivers of apparel purchasing, so if these important elements are compromised by auto-mation, they are far less likely to be used. Similarly, given the high cost of investment, apparel manufacturers will be hesitant to purchase machinery until it is proven to be a reliable replacement for human workers. There are nascent technologies that might enable firms to address some of the challenges associated with handling soft materials. Yet even with these developments, Crystal Group, the largest clothing manufacturer in the world, has expanded produc-tion in Bangladesh and Viet Nam, with its CEO specifically stating that robots could not compete with humans (Bain, 2018).Source: Frederick (2018).

Global value chains and employment in developing economies • 77
areas include trade policy, trade infrastructure, and labor market flexibility.
A country’s trade policy shapes the amount and type of for-eign investment and, thus, influences the potential of GVC inte-gration to influence labor markets. Open trade regimes may be more likely to attract foreign investors than inward-oriented regimes, since they are less constrained by the size and efficiency of the local market (Crespo and Fontoura 2007). Foreign investors might also be more export-oriented in an open setting, increas-ing chances for local suppliers to become exporters, too. More-over, foreign investors in an open trade setting are globally more integrated and therefore adopt the newest technologies (Meyer and Sinani 2009). Others, however, argue that foreign investors in an outward-oriented trade setting might focus more strongly on international distribution and marketing, while foreign firms in an inward-oriented policy regime might bring newer technologies to the host countries (Crespo and Fontoura 2007).
Connective trade infrastructure, firm capabilities, and devel-oping standards also influence GVC participation. Improving trade facilitation and developing more competitive trade logistics sectors to compete effectively in an environment that requires seamless importing and exporting are key recommendations for strengthening GVC participation (Taglioni and Winkler 2016).
Higher labor market flexibility – in absolute terms as well as rel-ative to the level in the foreign investor’s home country – is also shown to have a positive effect on the chances of securing initial foreign investment (Javorcik and Spatareanu 2005).
Second, how GVC participation and labor markets inter-act can also be influenced by policy. Different structural con-ditions, endowments, and policies may play a role in mediating the trade-labor relationship and fostering the positive spillovers that can occur. The literature confirms that education and skills influence the share of human capital in firms and are particularly important for expanding trade integration and spillovers from FDI in developing countries (Farole and Winkler 2014). Meyer and Sinani (2009) show evidence that the share of workers with tertiary education significantly affects FDI spillovers. This relationship takes a U-shaped form, that is, only below or above certain thresh-old levels of human capital does the extent of spillovers increase (Meyer and Sinani 2009). Tytell and Yudaeva (2007) find for Roma-nia that productivity spillovers from foreign direct investment (FDI) in manufacturing are significantly lower in regions with a low share of education. Farole and Winkler (2014) confirm for a sample of 78 low- and middle-income countries that a country’s government spending on education as a percentage of GDP has a strongly positive productivity effect. Kummritz, Taglioni, and Winkler (2017) measure the positive impact of skills building on the value-added gains from GVC integration as a seller in a sample of 61 countries. A higher expected number of years of schooling (Barro and Lee 2013), the share of workers with a secondary degree, or higher, in the total workforce (WDI 2018), as well as better educational quality (WEF 2018) all show positive interaction terms with GVC integration.
Trade policy also affects domestic firms. Local firms in an open trade regime are more exposed to competitive pressures through
international trade, which prepares them to better absorb FDI spillovers. Overall, studies confirm that FDI spillovers are larger in countries that are more open towards trade (Meyer and Sinani 2009; Du, Harrison, and Jefferson, 2011; Havranek and Irsova 2011).
Labor market regulations may also influence the effect of GVC integration on domestic firms through various channels. Labor market regulations, and, in particular, wage constraints, can affect skills in a firm, and hence their absorptive capacity (Hale and Long 2011). Overly rigid labor markets can reduce the likelihood of labor turnover and GVC spillovers. Conversely, overly flexible labor mar-kets may generate frequent labor turnover, which reduces the time for domestic workers to acquire skills and knowledge from foreign firms. Kummritz, Taglioni, and Winkler (2017) find that labor free-dom tends to increase the value-added gains from GVC integra-tion as a buyer and seller. Thus, the policy environment can medi-ate better labor market outcomes from GVC participation.
Third, policies can influence the activities that countries under-take in GVCs. If the nature of GVC participation matters for the types of jobs it supports, then policies can support better types of GVC participation. As noted by Shepherd and Stone (2012), policies that are designed to help firms — in a non-distortionary way — to move through GVCs to positions of higher value added are likely to help promote the beneficial labor market effects of GVC participation. Education and training, as well as infrastructure development, and backbone services sectors can also help firms to successfully internationalize in higher value added activities. Human capital, for example, may influence the quality and avail-ability of workers.
However, better conditions for workers within GVCs does not necessarily follow from greater GVC participation (Milberg and Winkler 2011). Social upgrading can be fostered by labor reg-ulations, such as those for occupational safety, health and envi-ronment standards in GVC sites. For example, Hollweg and Kanz (2018) use firm-level data from the ILO-IFC Better Work Viet Nam program to assess the relationship between transparency on working conditions and firm compliance in the apparel sector in Viet Nam between 2010 and 2018. The authors find that while continued participation in the Better Work Viet Nam program has the strongest effect on changes in firm compliance with labor standards over time, the public disclosure of firms’ names that fail to comply with critical labor issues is also associated with increase compliance. The effects are stronger in some compliance points including occupational health and safety, work time, and child labor.
Fourth, if GVCs tend to be associated with greater inequality by increasing the relative demand for skilled labor in develop-ing countries, then policy has an important role to pay in ensur-ing that the gains from trade are shared evenly (see Chapter 2). Complementary policies are likely to play a vital role. As noted by Shepherd and Stone (2012), GVCs could have stronger effects on inequality in the absence of education and training policies designed to promote workforce and human capital development. Well-functioning labor markets are also important, because inte-grating into GVCs generates faster growth and transformation, and require economy-wide adjustment (see Chapter 2).

78 • Technological innovation, supply chain trade, and workers in a globalized world
7. Conclusions
Today, significant parts of the developing world are deeply involved in GVCs. The unbundling of production is expected to have significant implications for labor markets – where jobs go, who gets them, and what type of jobs they are (Farole 2015). The labor market impacts of GVC participation, as well as the impact that future megatrends will have on labor markets, are a principal concern to policymakers in developing countries.
The chapter focused on nationwide implications of GVC inte-gration for workers in developing countries, from the perspec-tive of nationwide jobs and wages, nationwide spillovers, and the relative demand for skilled versus unskilled labor. It also analyzed the potential implications of new technologies for GVCs from the perspective of labor markets.
The chapter showed that, while GVC participation has been important for jobs and wages, it also has had distributional con-sequences for where jobs go and the types of jobs available. GVC integration has supported jobs and earnings, as well as
other development impacts that operate through labor mar-kets. Job and wage gains have been achieved not only within the exporting sector, but indirectly through linkages of exporting firms to domestic, input-supplying firms. Employment and wage gains have been biased towards more skilled workers, which contrasts with the predictions of trade theory. The skill-biased nature of GVC trade is also associated with increased complexity of global supply chains as well as increased use of skill-intensive inputs, notably services. New emerging trends, including auto-mation and digitization, may further determine how developing countries will be affected by GVC trade in the future.
Policies also play an important role in mediating the relation-ship between GVCs and employment in developing countries. These include policies that support (i) participation of develop-ing countries in GVCs, (ii) fostering positive spillovers from GVC participation, (iii) upgrading to higher value-added tasks within GVCs, and (iv) mediating negative effects from winners, such as skilled versus unskilled labor.

Global value chains and employment in developing economies • 79
Notes
1. Note that the estimates are likely upward biased as exporting firms in
particular are likely to have higher import content than non-exporting
firms and higher productivity and current input-output based tables
are not able to differentiate between the two.
2. Bangladesh, China, India, Indonesia, the Republic of Korea, Malaysia,
Mongolia, the Philippines, Sri Lanka, Chinese Taipei, Thailand, and
Viet Nam.
References
ADB (2018). Asian Development Outlook 2018: How Technology Affects
Jobs. Manila: Asian Development Bank.
Acemoglu, D., D. Autor, D. Dorn, and G. H. Hanson (2016). “Import
Competition and the Great US Employment Sag of the 2000s.” Jour-
nal of Labor Economics 34(1): 141-98.
Ahmed (2013). “Global Value Chains, Economic Upgrading, and Gender
in the Call Center Industry.” In C. Staritz and J. G. Reis (Eds.), Global
Value Chains, Economic Upgrading and Gender: Case studies of the
horticulture, tourism and call center industries (2013). Washington,
DC: World Bank.
Autor, D. H., D. Dorn, and G. H. Hanson (2013). “The China Syndrome:
Local labor market effects of import competition in the United
States.” American Economic Review 103(6): 2121-68.
Bain, M. (2018). “The World’s Largest Clothing Maker Isn’t Betting on Auto-
mation Replacing Cheap Human Labor.” Quartz. Available at: https://
qz.com/1169397/crystal-group-is-investing-in-low-wage-labor-not-
robots-after-its-ipo/
Bamber, P., and C. Staritz (2016). The Gender Dimensions of Global
Value Chains. Geneva: International Center for Trade and Sustainable
Development.
Banga, K. (2016). “Impact of Global Value Chains on Employment in
India.” Journal of Economic Integration 31(3): 631-73.
Barrie, L. (2017). “Sewbots Pave the Way for the Apparel Factory of the
Future.” Just-Style. Available at: https://www.just-style.com/anal-
ysis/sewbots-pave-the-way-for-the-apparel-factory-of-the-future_
id130877.aspx.
Barrientos, S., G. Gereffi, and A. Rossi (2010). “Economic and Social
Upgrading in Global Production Networks: Developing a framework
for analysis.” Capturing the Gains Working Paper 2010/-3, University
of Manchester, United Kingdom.
Bernard, A. B., J. B. Jensen, and P. K. Schott (2006). “Survival of the
Best Fit: Exposure to low-wage countries and the (uneven) growth of
U.S. manufacturing plants.” Journal of International Economics 68(1):
219-37.
Bertulfo, D., E. Gentile, and G. de Vries (2019). “The Employment Effects
of Technological Innovation and Participation in Global Value Chains:
Evidence from Asia.” Economics Working Paper Series No. 572,
Asian Development Bank, Manila.
Bloom, N., M. Draca, and J. Van Reenen (2016). “Trade Induced Tech-
nical Change? The impact of Chinese imports on innovation, IT and
productivity.” The Review of Economic Studies 83(1): 87-117.
Boeler, E. A., A. Moxnes, and K. H. Ulltveit-Moe (2015). “R&D, Interna-
tional Sourcing, and the Joint Impact on Firm Performance.” American
Economic Review 105(12): 3704-39.
Boffa, M., G. Santoni, and D. Taglioni (2018). “From China with Love.”
Mimeo, World Bank, Washington, DC.
Bustos, P. (2011). “Trade Liberalization, Exports and Technology Upgrad-
ing: Evidence on the impact of MERCOSUR on Argentinian firms.”
American Economic Review 101(1): 304-40.
Calì, M., J. Francois, C. H. Hollweg, M. Manchin, D. A. Oberdabernig, H.
Rojas-Romagosa, S. Rubinova, and P. Tomberger (2016). “The Labor
Content of Exports Database.” Policy Research Working Paper No.
7615, World Bank Group, Washington, DC.

80 • Technological innovation, supply chain trade, and workers in a globalized world
Calì, M., and C. H. Hollweg (2016). “How Much Labor Do South African
Exports Contain?” Policy Research Working Paper No. 8037, World
Bank Group, Washington, DC.
Chang, J.-H., G. Rynhart, and P. Huynh (2016). ASEAN in Transformation:
Textiles, clothing and footwear: Refashioning the future. Geneva: Inter-
national Labor Organization (ILO), Bureau for Employers’ Activities.
Chen, Q., Y. Gao, J. Pei, G. de Vries, and F. Wang (2018). “Formerly Assem-
bled, But Now Designed in China? Assessing the domestic value-added
of activities in gross exports.” GGDC Research Memorandum 180, Uni-
versity of Groningen, Groningen, Netherlands.
Crespo, N., and M. Fontoura (2007). “Determinant Factors of FDI Spill-
overs: What do we really know?” World Development 35(3): 410-25.
Crinò, R. (2012). “Service Offshoring and the Skill Composition of Labour
Demand.” Oxford Bulletin of Economics and Statistics 74(1): 20-57.
de Vries, G., Q. Chen, R. Hasan, and Z. Li (2016). “Skills and Activity
Upgrading in Global Value Chains: Trends and drivers for Asia.” Eco-
nomics Working Paper Series No. 496, Asian Development Bank,
Manila.
Du, L., A. Harrison, and G. Jefferson (2011). “FDI Spillovers and Industrial
Policy: The role of tariffs and tax holidays.” NBER Working Paper No.
16767, National Bureau of Economic Research, Cambridge, MA.
Emont, J. (2018). “The Robots are Coming for Garment Workers: That’s
good for the US, bad for poor countries.” Washington Street Journal.
Available at: www.wsj.com/articles/the-robots-are-coming-for-garment-
workers-thats-good-for-the-u-s-bad-for-poor-countries-1518797631.
Farole, T. (2015). Factory South Africa? SACU in Global Value Chains. World
Bank: Washington, DC.
Farole, T., C. H. Hollweg, and D. Winkler (2018). “Trade in Global Value
Chains: An Assessment of Labor Market Implications.” Mimeo, World
Bank, Washington, DC.
Farole, T., and V. Pathikonda (2017). “The Capabilities Driving Participation
in Global Value Chains.” Journal of International Commerce, Econom-
ics and Policy 8(1): 1750006.
Farole, T., and D. Winkler (2014). “The Role of Mediating Factors for FDI
Spillovers in Developing Countries: Evidence from a global dataset.” In
T. Farole and D. Winkler (Eds.), Making Foreign Direct Investment Work
for Sub-Saharan Africa: Local Spillovers and Competitiveness in Global
Value Chains. Washington, DC: World Bank.
Fernandez-Stark, K., P. Bamber, and G. Gereffi (2010). “Workforce Devel-
opment in Chile’s Offshore Services Value Chain.” Center on Globaliza-
tion, Governance and Competitiveness, Duke University, Durham, NC.
Frederick, S. (2018). “Apparel Skills Mapping and Functional Upgrading in
Cambodia: Jobs diagnostic.” Mimeo, World Bank, Washington, DC.
Fukase, E. (2013). “Export Liberalization, Job Creation and the Skill Pre-
mium: Evidence from the US-Vietnam Bilateral Trade Agreement.”
Policy Research Working Paper No. 6419, World Bank, Washington, DC.
Goldberg, P. K., A. K. Khandelwal, N. Pavcnik, and P. Topalova (2010).
“Imported Intermediate Inputs and Domestic Product Growth: Evidence
from India.” The Quarterly Journal of Economics 125(4): 1727-67.
Gyeke-Dako, A., A. D. Oduro, F. E. Turkson, P. T. Baffour, and E. N. Abbey
(2017). “Ghana’s Participation in Global Value Chains: The employment
effects.” R4D Working Paper No. 2017/05, World Trade Institute, Uni-
versity of Bern, Switzerland.
Hale, G., and C. Long (2011). “Did Foreign Direct Investment Put an
Upward Pressure on Wages in China?” IMF Economic Review 59:
404-30.
Hallward-Driemeier, M., and G. Nayyar (2017). Trouble in the Making? The
future of manufacturing-led development. Washington, DC: World
Bank.
Halpern, L., M. Koren, and A. Szeidl (2015). “Imported Inputs and Produc-
tivity.” American Economic Review 105(12): 3660-703.
Havranek, T., and Z. Irsova (2011). “Estimating Vertical Spillovers from FDI:
Why results vary and what the true effect is.” Journal of International
Economics 85: 234-44.
Helpman, E., O. Itskhoki, and S. Redding (2010). “Inequality and Unem-
ployment in a Global Economy.” Econometrica 78(4): 1239-83.
Hollweg, C. H. (2017). “How Do Exports Support Labor in Vietnam?”
Mimeo, World Bank, Washington, DC.
Hollweg, C. H., and M. Kanz (2018). “Firm Compliance and Public Disclo-
sure in Vietnam.” Mimeo, World Bank, Washington, DC.
Iberahim, H. (2013). “Vertical Integration into Global Value Chains and Its
Effects on Skill Development.” IEEE Business Engineering and Industrial
Applications Colloquium: 28-33.
Javorcik, B., and M. Spatareanu (2005). “Do Foreign Investors Care about
Labor Market Regulations?” Review of World Economics 141(3):
375-403.
Kee, H. L., and H. Tang (2015). “Domestic Value Added in Exports: Theory
and firm evidence from China.” Policy Research Working Paper No.
7491, World Bank Group, Washington, DC.
Kidder, M., and D. Dollar (2018). “The Effect of Production Fragmentation
on Skills Reallocation: Is it felt equally across levels of development?”
Mimeo, The Research Institute of Global Value Chains, Beijing.
Kumar, R. (2017). “Global Value Chains: A way to create more, better and
inclusive jobs.” Jobs Development Blog, World Bank, Washington, DC.
Kummritz, V., and B. Quast (2017). “Global value chains in develop-
ing economies.” Vox EU. Available at: https://voxeu.org/article/
globa-value-chains-developing-economies.
Kummritz, V., D. Taglioni, and D. Winkler (2017). “Economic Upgrading
through Global Value Chain Participation Which Policies Increase the
Value Added Gains?” Policy Research Working Paper No. 8007, World
Bank, Washington, DC.
Lanz, R., and A. Maurer (2015). “Services and Global Value Chains: Some
evidence on servicification of manufacturing and services networks.”
Working Paper ERSD-2015003, World Trade Organization, Geneva.
Lopez-Acevedo, G., and R. Robertson (2016). Stitches to Riches? Apparel
Employment, Trade, and Economic Development in South Asia. Wash-
ington, DC: World Bank.
MacGarvie, M. (2006). “Do Firms Learn from International Trade?” Review
of Economics and Statistics 88(1): 46-60.
McCaig, B. (2011). “Exporting Out of Poverty: Provincial poverty in Viet-
nam and US market access.” Journal of International Economics 85(1):
102-13.
Meng, B., G. Peters, and Z. Wang (2015). “Tracing CO2 Emissions in Global
Value Chains.” Discussion Paper No. 486, Institute of Developing Econ-
omies, Japan External Trade Organization, Tokyo.
Meng, B., H. Xiao, and J. Ye (2018). “A Global Value Chain Based Structure
Decomposition Analysis on the Change of Employment.” Mimeo.

Global value chains and employment in developing economies • 81
Meyer, K., and E. Sinani (2009). “When and Where Does Foreign Direct
Investment Generate Positive Spillovers? A meta-analysis.” Journal of
International Business Studies 40(7): 1075-94.
Milberg, W., and D. Winkler (2011). “Economic and Social Upgrading in
Global Production Networks: Problems of theory and measurement.”
International Labour Review 150(3-4): 341-65.
Mion, G., and L. Zhu (2013). “Import Competition from and Offshoring to
China: A curse or blessing for firms?” Journal of International Econom-
ics 89(1): 202-15.
Nayyar, G. (2017). “The Future of Manufacturing-Led Development in
Rwanda.” Mimeo, World Bank, Washington, DC.
Peters, A. (2017). “This T-shirt Sewing Robot Could Radically Shift the Apparel
Industry.” Fast Company. Available at: www.fastcompany.com/40454692/
this-t-shirt-sewing-robot-could-radically-shift-the-apparel-industry.
Rodrik, D. (2018). “New Technologies, Global Value Chains, and Develop-
ing Economies.” NBER Working Paper No. 25164, National Bureau of
Economic Research, Cambridge, MA.
Shepherd, B., and S. Stone (2012). “Global Production Networks and
Employment: A developing country perspective.” Working Paper TAD/
TC/WP(2012)29, Trade and Agriculture Directorate, Trade Committee ,
Organisation for Economic Co-operation and Development, Paris.
Shingal, A. (2015). “Labour Market Effects of Integration into GVCs: Review
of literature.” R4D Working Paper 2015/10, World Trade Institute, Uni-
versity of Bern, Switzerland.
Stacey, K., and A. Nicolaou (2017). “Stitched Up by Robots: The threat
to emerging economies.” Financial Times. Available at: www.ft.com/
content/9f146ab6-621c-11e7-91a7-502f7ee26895.
Taglioni, D., and D. Winkler (2016). Making Global Value Chains Work for
Development. Washington, DC: World Bank.
Timmer, M. P., A. A. Erumban, B. Los, R. Stehrer, and G. J. de Vries (2014).
“Slicing Up Global Value Chains.” Journal of Economic Perspectives
28(2): 99-118.
Tytell, I., and K. Yudaeva (2007). “The Role of FDI in Eastern Europe and
New Independent States: New channels for the spillover effect.” In K.
Liebscher, J. Christl, P. Mooslechner and D. Ritzberger-Grünwald (Eds.),
Foreign Direct Investment in Europe: A changing landscape, Edward
Elgar, Cheltenham, UK and Northampton, MA, USA.
Wakefield, J. (2016). “Foxconn replaces ‘60,000 factory workers with
robots.” BBC News. Available at: https://www.bbc.com/news/
technology-36376966.
Wang, W., S.-J. Wei, X. Yu, and K. Zhu (2017). “Characterizing Global Value
Chains: Production length and upstreamness.” NBER Working Paper
No. 23261, National Bureau of Economic Research, Cambridge, MA.


83
CHAPTER 4Technological progress, diffusion, and opportunities for developing countries: lessons from China*
Satoshi Inomata (IDE-JETRO) and Daria Taglioni (World Bank Group)
ABSTRACT
The nature of technology used in products plays a major role in determining the governance structure of value chains and the benefits of participation for developing countries. Standardization through breaking production into modules with a high degree of functional autonomy (limited mutual interference between modules) can dramatically reduce the amount of research and development (R&D), learning by doing, and the number of complementary skills needed to produce a good. This greatly increases opportunities for developing country firms to participate in formerly capi-tal-intensive industries through reducing entry costs into global value chains. However, widespread access to stan-dardized products with little ability to modify technical features can lead to an excessive supply of homogeneous
products in a local market, resulting in intense price com-petition and limited technology transfer. By contrast, tech-nology that facilitates scope for product modification and greater interaction with technology owners can help boost technology transfer and product upgrading by develop-ing country firms. The chapter illustrates this interaction between changes in technology and opportunities for developing countries through developments in the automo-tive and mobile phone handset industries, with a particular reference to China’s growth experience. It also finds that automation is likely to have only a limited impact on devel-oping countries’ opportunities to participate in value chains through the offshoring of production by high-income coun-tries, at least in the short term.
• Policies for helping domestically owned firms become technologically standalone – what some might refer to as “techno-nationalism” – do not necessarily help countries move into higher value-added production within GVCs. Instead, policymakers should encourage firms to be full partners in global technology ecosystems and to pursue open source innovation solutions.
• Automation might become a threat to developing country employment in the long term if consumption does not increase fast enough to generate sufficient additional labor demand to offset the labor-saving impact of technological change. In the short term, however, automation will not dramatically reduce the attractiveness of low-wage destinations, especially for labor-intensive tasks that require human dexterity, such as in the apparel industry.
• While automation does not pose immediate risks, governments need to develop a comprehensive digital strategy to maximize the gains from GVCs.
* This chapter draws from background studies and ongoing research collaboration with the following researchers: Chiara Criscuolo, Yoshihiro Hashiguchi,
Keiko Ito, Jonathan Timmis, Ke Ding, Shiro Hioki, Mai Fujita, Tim Sturgeon, Eric Thun, Yuqing Xing, Satoshi Nakano, Kazuhiko Nishimura and Jiyoung Kim.

84 • Technological innovation, supply chain trade, and workers in a globalized world
1. Introduction
An increasing number of developing countries is rec-ognizing that participation in global value chains (GVCs) is an important prerequisite for economic development. At the same time, however, they fear
that the prospects for value chain upgrading is limited, because once they join a value chain their production activities become “locked in” to the lower value-added segments of global pro-duction systems. Added to these concerns, they fear that new labor-saving technologies, such as robotization and automation in manufacturing, could erode the previous attractiveness of a cheap labor force as a source of comparative advantage. The analysis presented in this chapter shows that joining and upgrad-ing in GVCs is still possible, provided that firms’ strategies and policy interventions adapt themselves to the new and evolving technology environment.
Standardization, modularity and digitalization have made even complex technologies progressively more “diffusable” over the years, and this represents a new opportunity for firms from developing countries to join and move up the value chain. Stan-dardization and modularity tend to increase as a technologies and products mature, managers try to reduce uncertainty and lower costs, and best practices get codified in the supply base. Today digital technologies enable standardization and modular-ity in increasingly complex features, products, and transactions. The greater spillover resulting from standardization and modu-larity allows faster diffusion of technology. The digitalization of many complex industrial productions enables even more firms and countries to leapfrog to more advanced technology. We use case study evidence from the automotive and mobile phone industries to support this thesis. We show that more standard-ization, or less complexity, of both products and production processes in value chains that are typically technology-intensive, such as the automotive and mobile phone ones lowered the entry costs into complex, technology intensive, products. Stan-dardization has dramatically reduced the amount of R&D, learn-ing by doing, and the number of complementary skills needed to produce a car or a phone handset.
Modularization and standardization lower the entry costs to product upgrading, but this does not translate automatically into technological advancement for the manufacturers. To move up to high value-added segments of technologically advanced value chains requires learning additional and complementary skills, even though they may be unrelated to some parts of man-ufacturing activities (e.g. marketing, sales, etc.). Our discussion on the success and upgrading of the Chinese smartphone indus-try offers an example of the strategies that have allowed some firms to leverage technological progress to upgrade, get closer to the global technology frontier, and become global brands.
In this chapter we also conclude that the need to graduate from labor-intensive production is not urgent. We show that automation reduces some of the incentives for GVCs to relocate to lower wage countries: the rising stock of industrial robots in high-income countries over the period 2003-2015 appears to be
mildly associated with lower foreign direct investment (FDI) flows from richer to poorer countries. Yet, automation is not going to dramatically reduce the attractiveness of low-wage destinations in the near term, especially for labor-intensive tasks that require human dexterity. In the apparel industry, for example, soft mate-rials like fabrics are difficult to handle through automation com-pared to solid materials such as metal or wooden objects, and sewing/stitching can still be out of the reach of robots’ hands (see the evidence in Section 4.) And even in highly automatized industries such as electronics, human fingers are still needed for the assembly of devices made of thousands of tiny components. This is, for example, the case for smartphones, as discussed in interviews with manufacturers. A bigger challenge for GVC new-comers is rather to be competitive vis-à-vis existing production clusters and countries with high density of supply chains. These induce to lower costs for various support functions and services, beyond automation, and the density of supply chains supports responsiveness.
The rest of the chapter is organized as follows. In Section 2, we discuss the role of the GVC power relations in determining the way that technological progress creates opportunities for new entrants. In Section 3, we illustrate how two specific technologi-cal and business innovations, i.e. production modularization and platforms (a digital evolution of modularization), have played a fundamental role in opening up opportunities for new entrants in technology-intensive industries such as automotive and mobile phones. Section 4 discusses what strategies have allowed new manufacturers to leverage the opportunities from production modularization and platforms to upgrade because entry per se does not translate into immediate technological progress for these entrants. Then, Section 5 discusses one area of great public concern recently: robots and automation. Section 6 presents some policy implications from the discussion.
2. Technological progress and value chain dynamics
The extent to which technological progress will disrupt the present configuration of supply chains and open them to new players depends, in part, on the form of GVC power relations. Inomata (2017) employs the analytical framework developed by Gereffi, Humphrey, and Sturgeon (2005) to show how power relations between buyers and suppliers, as determined by the nature of transactions and the capabilities in the supply base, affect opportunities for new participants in GVCs. Gereffi et al. (ibid.) define five forms of GVC power relations: market-type, modular-type, relational-type, captive-type, and hierarchy-type (see Annex), and among them the modular-type GVCs are par-ticularly interesting for our discussion. A “module” generally refers to a composite of subcomponents grouped by the type of function assumed in the final product. Each module has a high degree of functional autonomy (namely, the mutual interference between modules is small), while the standardized architec-ture of a module’s interface makes it easy to combine multiple

Technological progress, diffusion, and opportunities for developing countries: lessons from China • 85
modules. Modularization can be employed in manufacturing of complex products, where production processes are simpli-fied and partitioned. In modular types of production, knowl-edge-intensive segments (such as the harmonization of core components) are limited to only a few stages of the production process.
Accordingly, modularization reduces technological barri-ers to entry. It lowers the amount of R&D and learning-by-do-ing necessary to integrate into skill- and capital-intensive value chains (Sturgeon and Thun, 2019, and Xing, 2018). Chesebrough and Kusunoki (2001) further note that modularization also tends to reduce product uniqueness – a feature associated with high value added – which they refer to as “the modularity trap”. Firms adopting the same modules basically produce very similar prod-ucts. This undermines firms’ profitability, mainly due to the high levels of competition. Section 2 will discuss this in more detail.
Therefore, adoption of advanced modules alone does not generate technological progress in manufacturers. Modulariza-tion helps to move into more complex value chains. But, in order to capture more value and increase profit margins, firms also need to learn to manage more complex processes (i.e. a pro-cess where a higher number of complementary skills is needed), and to master more complex tasks (i.e. tasks with some features that makes them unique). The smile curve shows there compe-tences need to be developed to escape the modularity trap: the right-hand side (downstream) edge of the curve, where local firms capture value through branding and product ownership. This requires developing expertise in business functions such as design and marketing. These are capabilities very different from production skills, as are the features of the ecosystem and institutions that support them. These topics will be the subject of Section 3.
3. Opportunities from modularization and platforms: examples from the car and mobile phone industries
3.1 Automotive industry: the modularization of carsManufacturers in the automotive industry tend to show hierar-chical power relations. A car is an extremely complex system containing over 15,000 different components, including key components that are often design-specific and difficult to sub-stitute. During the assembly stage, the parts must be carefully aligned with one another in harmony, and the risk of interfer-ence between parts is not uncommon. For example, the “com-puterization” of modern cars has increased the risk that the air-conditioning system will interfere with electronic-intensive modules, which need to be located nearby within a narrow space between the engine and the instrument panel. Because of the high degree of manufacturing complexity, the automo-tive industry is highly prone to vertical integration and therefore to adopting a GVC power relation of the hierarchical type. This ensures a holistic and systematic coordination of every aspect of production from start to finish.1
However, developments in design schemes have spurred changes that have increased modularity in the auto industry. Large scale modularization in the automotive sector is already two decades old (Takeishi and Fujimoto, 2001).2 Here however, we focus on a few recent examples. In 2013, Nissan introduced a design scheme called the “common module family” into the production lines of several key models. The scheme’s objective was to reconfigure the production system so as to reduce costs yet also maintain the variety of product line-ups. This was pur-sued through the modularization of products, which increased the proportion of standardized common components that can be shared among different models, while also reducing costs through bulk purchases of common inputs. Even before the introduction of Nissan’s scheme, Volkswagen devised the “modular transverse matrix platform” to develop a wide range of different products, including its standard models, such as the Golf, as well as luxury cars, such as Audi. Toyota later adopted the “Toyota new global architecture” for Prius in 2015, while Hyundai Motors, aided by its fully-automated assembly system, engaged in the large-scale outsourcing of its main car components, including the cockpit and chassis (Nikkei Busi-ness, 2013).
The implementation of modularization schemes has opened up new opportunities for firms from developing countries. As discussed earlier, modularization simplifies the production of a complex product by reducing knowledge-intensive seg-ments of production (such as the harmonization of car compo-nents), with the effect of substantially lowering technological barriers to market entry. For example, Shenyang Aerospace Mitsubishi Motors China ran a joint business with a US auto-parts supplier, Delphi, to sell engines, transmissions, and other core system components to local car manufacturers in China (Oshika et al., 2009). Engines and transmission systems were generally produced in-house. However, digital technology now makes it possible to pre-adjust the components to the specifi-cations of a customer’s individual car models with the help of electronic control units (ECUs).3 Local manufacturers were thus able to enter the low-end Chinese car market without the need to develop sophisticated in-house technology. Firms such as Chery, BYD, and Geely were able to produce inexpensive, small cars that meet the needs of first-time car buyers. Between 1995 and 2010, domestic firms increased their share of the Chinese car market by 31.9 percent (Brandt and Thun, 2016). Obviously, the lower barriers to entry generated by opening up access to platform technology were only partly responsible for this spectacular rise in market share. Market structure and compe-tition, ownership, and the mode of foreign entry are also cru-cially important in determining the scope for innovation and upgrading.
The gradual transformation of the automotive industry’s value chains from the hierarchical-type to the modular-type was associated with an increased ability to codify transactions.4 Codification has enabled firms to unbundle tasks (design, fab-rication, assembly, and marketing), and for competition to take place in specific segments of production, rather than at the

86 • Technological innovation, supply chain trade, and workers in a globalized world
level of the whole industry, as traditionally envisaged in classi-cal theories. As a result, the automotive industry changed from a vertically-integrated production system to one where value chains operate in a more open environment, thus increas-ing opportunities for emerging companies in developing countries.5
3.2 Electronic equipment industry: from modularization to the emergence of platforms and platform leadersThe electronic equipment industry covers a wide range of products, from personal computers (PCs) to mobile commu-nication devices. Typically, the industry’s supply chains are characterized by long supply lines that connect global buyers with electronic hardware manufacturers and assemblers. Global buyers are manufacturers of final consumer products, such as Apple, Hewlett-Packard, Toshiba, NEC, Samsung, and LG, that organize and preside over their own global produc-tion networks and tend to be located in traditional knowledge clusters. Suppliers tend to be dispersed nationally, region-ally, and globally.6 The long supply lines are the result of the delinking of innovation, design, heavy engineering, and standard-setting from production and assembly (a GVC pat-tern common in technologically-intensive industries).7 This, together with the standardization of many information-com-munication technology (ICT) processes, including important ones,8 led to a modular type of power relations for electronic equipment GVCs.
At the turn of the new millennium, platforms and platform leaders emerged as dominant new players in the electronics equipment GVCs.9 A “platform” is defined as “a set of common components, modules, or parts from which a stream of deriva-tive products can be efficiently created and launched” by “con-straining the linkages among the other components” (Baldwin and Woodard, 2009). Platforms are built on core technology modules which define the fundamental technical parameters of the products manufactured through the platform. A large-scale integrated circuit, which often determines the performance level of the final product in which it is embedded, provides a good example of a core technology module. A platform leader is a firm that controls core technology modules, and therefore governs the final product’s functions and performance. Such companies are still predominantly from rich countries. Yet, over the years, platform leaders from developing countries have also emerged. Particularly notable is the emergence of MediaTek as one of five dominant global players in mobile phone processors applica-tions, and the associated dominance in China’s mobile-phone market. We will discuss their role in what follows.
The advent of platforms has significantly destabilized the tra-ditional set-up of electronic equipment GVCs. The mobile phone industry in China illustrates well the potential for disruption by platforms. By integrating most of the mobile phone’s function-alities, platform solutions (sometimes referred to as “reference designs”) have lowered the cost and time required by manufac-turers to design low-end mobile phones. This has allowed Chi-nese brands, especially producers of imitative products, known
as Shanzhai, to capture significant market shares despite having low expertise in core aspects of mobile phones technology. These brands grew from a share of less than 5 percent of the domestic mobile-phone market in 1999 to more than 50 percent by 2003 (see Figure 4.1). Their business model consisted in cater-ing the domestic markets with low-priced handsets, which they were able to produce at low cost by leveraging the platforms’ digital technology.
The modularization of the final products’ architecture is what makes platforms effective in allowing newcomers to the GVCs. A platform is a complete module on its own that does not require surrounding components to have any product-specific attributes, except those regarding connection. Accordingly, any parts sup-pliers that have adopted the platform’s interface can enter the market. Correspondingly, this tends to invite a massive entry of producers into the industry. In the case of China’s mobile-phone industry, the marketing strategy of MediaTek, the chip vendor from Chinese Taipei mentioned earlier that came into the inte-grated circuit chip market in China. Shiu and Imai (2009) argue that the company boosted their influence in the industry by devising a unique marketing strategy. Alongside the production and sales of chipsets, they also offered an assembly blueprint for mobile phone terminals as a package bundle. The blueprint pro-vided a thorough how-to guideline for producing mobile phones that embody its chipsets, such as the layout of parts configu-ration and electrical wiring, and even included a list of recom-mended parts suppliers.10
The turnkey solution of MediaTek’s platform, however, turned out to be a double-edged sword.11 While it enabled local manufacturers with limited knowledge and experience to enter the mobile handset market, it also became difficult for them to differentiate their final products, and little tech-nology and know-how was transferred to the manufactures of the low-cost handsets. There are two reasons for this. First, as part of its marketing strategy, MediaTek decided to disclose only about 20 percent of its software source code, leaving the remaining 80% “black-boxed”. This meant that users of their platform ecosystem were bound to produce products whose designs were highly subordinate to the platform’s interface specification. The second factor was that the plat-form invited massive entry of producers into the market, as discussed earlier. This resulted in excessive supply of homo-geneous goods for those manufacturers using the platform, as well as market fragmentation, severe price competition and low profit margins. Under these conditions, producers had very limited room for expenses in R&D or innovation that could have encouraged upgrading.12 The GVC power rela-tions of the industry was also affected. As China experienced an excess supply of undifferentiated mobile-phone terminals, the industry’s value chains went from the modular type to the market type.13

Technological progress, diffusion, and opportunities for developing countries: lessons from China • 87
4. Upgrading options
4.1 Surviving the price wars: options for firms in developing countriesWhat are the options for firms in developing countries to avoid excessive price competition at the low end and upgrade their value chains? The previous section illustrates two examples showing that the introduction of new technologies can disrupt the existing form of supply chains and stimulate market entry of emerging firms in GVCs, but can also lead to an excessive supply of undifferentiated products. This significantly reduces the profitability of the industry, leading to a high level of market fragmentation, falling prices, and little scope for innovation and upgrading. Given this background, what are the options for firms in developing countries? Can excess capacity and falling prices be avoided? What are good approaches to upgrading the position of emerging market firms in high technology areas?
Some local manufacturers have upgraded their own value chains through a commitment to active learning, enabled by open platforms and a shift in consumer demand. Ding and Hioki (2017) illustrate how technological transfer and value-chain upgrading happened in the Chinese mobile phone industry over the course of the last 15 years. As described earlier, in the early 2000s, the mobile-phone industry in China left little room for upgrading, dominated as it was by the “shanzhai sector”. In recent years, however, Chinese companies in the industry have achieved remarkable growth (Table 4.1) and some of them have rapidly achieved international brand status in the global
smartphone market. Furthermore, the domestic market posi-tions of Chinese firms have also changed significantly (Table 4.2). From 2010 onward, Chinese products gained market share in products with mid-range prices, while still keeping their abso-lute advantages in the low price market. Some Chinese firms even began to enter the high-end segment of the smartphone market.
These trends were triggered, in part, by changes in con-sumer preferences regarding technology features. MediaTek maintained its advantage during the 3G era, yet it was not able to keep its dominant position when 4G was introduced.15 Qual-comm, as the world’s largest owner of 3G and 4G technology patents, increased its share of China’s smartphone-baseband IC market. Its shipment share in China’s 4G market accounted for more than 50% in 2015. Four Chinese companies in the top ten list in Table 4.1. primarily adopted Qualcomm’s platforms: Xiaomi (70% of all models, as of 2015), OPPO (70%), VIVO (60%), and ZTE (50%). The high demand for Qualcomm’s 4G technol-ogy was primarily driven by the dramatic increase in consumer demand for products of greater quality, functionality, and better data transmission. The increase in internet users interested in accessing communication platforms (WeChat, Taobao, and Didi) along with the upgrading of preferences that is consistent with a wealthier society, led to a surge in the demand for mid-range and high-end products. In particular, consumers demanded handsets with 4G technology, for their ability to provide faster and more stable transmission. Qualcomm’s strategy was to focus on these middle-range and high-end segments of the market by
FIGURE 4.1 The mobile-phone market in China prior to the smartphone
1999 2000 2001 2002 2003 2004 2005 2006 2007 Q30%
10%
20%
30%
40%
50%
60%
70%
100%
90%
80%
Foreign Brands Local Brands(Authorized)
Estimated Share of Local BrandsIncluding Unauthorized Market
Note: Because of the lack of coverage of unauthorized makers’ shipment, the share of local brands is biased downward. The broken line represents a rough
estimate of the share of local brands including unauthorized makers.
Source: Imai and Shiu (2011), compiled from estimates by MII, CCID, and Pday Research Center.
2007 China market share
Foreign brands Top 5 local brands
Nokia 28.9 Lenovo 6.5
Motorola 18.8 Nigbo-Bird 4.3
Samsung 11.1 Amoi 3.2
Sony-Ericsson 5.5 ZTE 2.3
LG 3.1 Konka 1.8
Top 5 foreign Share
67.4 Top 5 local Share
18.1

88 • Technological innovation, supply chain trade, and workers in a globalized world
serving a few emerging local firms with production capabilities that can accommodate the technological profiles of Qualcomm’s platform. This is in a sharp contrast with MediaTek’s strategy of providing turnkey solutions to numerous undifferentiated manu-facturers with minimum production capabilities.
Qualcomm also adopted an open platform approach and became highly proactive in developing new products and resolv-ing problems jointly with its customers. This is because deep-ening technological complexities now entails much closer col-laboration between platform vendors and mobile phone makers as well as the suppliers of other relevant components (ampli-fier and antenna, etc.). Furthermore, the life cycle of a mobile phone became much shorter (from 2 years in the 2/3G era to 6 months in the 4G era) while the expected time span for investing in research and development of IC chipsets became consider-ably longer. Platform vendors must therefore predict the future market trend two or three years in advance of the release of a
new model, and keep continuous communication with their cus-tomers to learn about end-consumers’ demand and preferences.
Reducing product modularity by opening the platform source codes to its users, allowed Qualcomm to offer them the possibil-ity to undertake significant product differentiation on their own. It is reported that Qualcomm has opened approximately 80% of its hardware driver source code, compared to only 20% by MediaTek, as pointed out earlier. Under certain circumstances, the company even allows its customers to adjust the platform’s design parameters (such as radio frequency specifications). Qual-comm offers regular support to its platform users and assists them in conducting co-marketing, often jointly holding product release conferences or introducing them to overseas carriers. In this way, the company constantly exchanges technological and marketing information with its customers. Such interactions are highly relevant for developing the competitive advantages of local manufacturers.16
TABLE 4.2 Market share of local smartphone brands in China
2014 Q4 2015 Q3
Share of totalShare of local brands in each
segment
Share of local top 3 Share of total
Share of local brands in each
segment
Share of local top 3
High-end (>500$)
16% Information unavailable
4.2% 13.5% Information unavailable
9.4%
Mid-range (250-500$)
20.4% 76.5% 44.6% 24.8% 81.9% 58.8%
Low-end (<250$)
63.6% 100% 45.4% 61.7% 100% 48%
Source: Ding and Hioki (2018), compiled from data by GFK market research.
TABLE 4.1 Shipments of major smartphone makers in the global market, million units
Vendors 2011 2012 2013 2014 2015 2016 2017
1 Samsung 95 198 299 308 320 310 316
2 Apple 93 136 153 193 232 216 216
3 Huawei 17 31 52 75 108 139 153
4 OPPO N/A 5 18 31 45 95 118
5 VIVO N/A 3 12 30 44 82 95
6 Xiaomi N/A 7 19 65 73 58 92
7 LG 19 26 48 59 60 N/A 56
8 ZTE 17 31 42 45 51 57 46
9 Lenovo 4 23 45 N/A 45 50 39
10 Gionee N/A N/A N/A N/A N/A N/A 24
Note: N/A means the relevant information is not available.
Source: Ding and Hioki (2018), compiled from data by IHS iSuppli, a market research firm.

Technological progress, diffusion, and opportunities for developing countries: lessons from China • 89
Qualcomm also provided its customers with various oppor-tunities to cooperate with global suppliers, which further helped to accelerate the upgrading of the Chinese mobile phone indus-try. For example, Xiaomi collaborated with Biel Crystal (for cover glass), OPPO with Texas Instruments (for power chips), VIVO with Sony (for a front dual camera) and ArcSoft (for the camera software).
In summary, over time technological innovation and the strat-egies of major firms have driven dramatic changes in the partic-ipation of domestic firms in the Chinese mobile phone indus-try. MediaTek from Chinese Taipei enabled local firms to enter the market by providing a highly standardized platform that gave a turnkey solution for those without sufficient knowledge and experience to manufacture high-tech mobile phone termi-nals. However, the lower technological barrier to entry caused an excessive supply of undifferentiated products in the low-end market, leading to intense price competition. Referring back to the GVC typology, MediaTek’s platform transformed the indus-try’s value chains from the modular type to the market type. Subsequently, Qualcomm’s higher level of commitment and col-laboration with customers (through opening up most of the plat-form’s software source code, technical assistance, and joint prod-uct development or product promotion) enabled local firms that had accumulated the minimum expertise to accommodate Qual-comm’s technological profiles to upgrade their final products. Thus, Qualcomm’s platform further changed power relations of this value chain into the relational type, in line with the increas-ing complexity of final product characteristics.17 These develop-ments required continuous efforts by local emerging companies to learn through active interactions with more advanced firms.
4.2 Implications of market shifts from feature phones to smartphonesSo far, we have focused on the impact of disruptive technology embedded in key hardware components (such as IC chipsets). However, disruption of value chains also can be driven by soft-ware evolution. Sturgeon and Thun (2019) show how the smart-phone market provides an opportunity to assess how companies can upgrade in manufacturing GVCs following disruptive techno-logical change. The introduction of smartphones in 2007 opened up opportunities for upgrading by Chinese firms. With its iPhone handset, launched in 2007, Apple established a platform with a partly open architecture, the Apple iOS. Third-party developers can access the platform, and design tools and sell applications (apps) on Apple’s online store, but governance of the resulting ecosystem is closed (Parker et al., 2016). Partly in response to the iPhone, Google launched the Android OS for mobile handsets one year later. In contrast to iOS, Android has an open technol-ogy architecture and largely open governance. The Android OS was licensed for free and its “source code” published through the Android Open Source Project for all to use or modify as needed. As the leading internet search company, with revenues coming mainly from online ad placement fees, Google wanted more people to access the internet (and thus the Google search engine). The expectation was that continued growth in the use of
Google’s search engine would create more revenue than would fees from Android licenses.
The impact of Android on the mobile telecom value chain was profound, as it caused the composition of the handset industry to shift dramatically. By 2016, all operating systems that pre-dated the Apple iOS were reduced to single-digit market shares (see Figure 4.2, left-hand panel). A parallel shift also occurred in the market of phone manufacturers. The profits for handset sales were almost entirely taken by two firms: Apple, with 75 percent, and Samsung, with 25 percent (Reisinger, 2016). Incumbents (producers of pre-smartphone-era feature phones) collapsed from a 60 percent market share to less than 10 percent. In fact, of all the incumbent firms, only Samsung was able to make the tran-sition to Android (and to the smartphone market) successfully (see Figure 4.2, right-hand panel). At the same time, a plethora of new firms, mostly Chinese, emerged.
The same pattern seen in previous waves of technological progress was observed for smartphones. With the availability of highly-integrated chip sets linked to an open-source operating system, Google’s Android lowered the barriers to entry for new firms with lower capabilities, and also reduced product distinc-tiveness and the value-added from manufacturing handsets. The two leading brands, Samsung and Apple, which covered 35 per-cent of the market in 2016, had relatively stable market shares. The remainder of the market was very fragmented and unsta-ble. In particular, firms outside of the top five, which account for nearly half of the world market, were subject to high volatility and short spells (Table 4.3). This is typical of the so-called “modular-ity trap” (Chesbrough and Kusunoki, 2001). Only handset makers with significant software development capabilities were able to differentiate themselves and achieve stable market share. This evolution was unlike the pre-smartphone era, described in Stur-geon and Linden, 2011. At the time, the top five firms, includ-ing industry pioneers Nokia and Motorola, dominated for many years with relatively stable market shares.
Global manufacturing of mobile handsets moved mostly to China, driven by both supply and demand factors. In 2016, China accounted for more than three-quarters of global production (HIS Markit Data). China remains the main assembly location for all top firms, with the exception of the two brands from the Republic of Korea, namely Samsung and LG.18 A key attractive-ness of China as assembly location is the fact that it accounts for about one-third of total global demand, representing the largest mobile phone market worldwide. Moreover, a number of Chi-nese brands, including Huawei, Xiaomi and Oppo, have emerged as increasingly popular, first among Chinese consumers, and increasingly in foreign markets (HIS Markit Data; Xing, 2018).
Chinese smartphone producers are upgrading through build-ing their own brands and being strategic on what components to build. This is different from the traditional view that firms upgrade along a predetermined sequence of manufacturing tasks. They are no longer participating only as suppliers of global brands or producers of low-cost undifferentiated devices. Rather, they succeeded in unseating the market leaders, Samsung and Apple, from the Chinese domestic market by focusing on customer

90 • Technological innovation, supply chain trade, and workers in a globalized world
orientation, and by growing their design and marketing capabili-ties (Brandt and Thun, 2010, 2011, 2016; Thun, 2018; Xing, 2018). By building their brands, these firms moved from their original focus on cost-conscious customers, and increasingly toward mid-range consumers demanding value for money (Brandt and Thun, 2010 and 2016, refer to this progression as the “fight for the middle”). In so doing, they managed to upgrade their position in the mobile phone value chain, serving the Chinese market first, and then becoming increasingly successful in other markets (see Figure 4.3). As a result, by 2017, Chinese brands had captured 87 percent of the domestic market.
Successful Chinese firms also rely on knowledge-intensive intermediates and globally available technology. None of the top Chinese brands (Huawei, Oppo, Vivo and Xiaomi) has core technological capacity in-house. These firms rely on GVCs for technology and develop products that depend on interopera-bility and compatibility with global markets. Successful Chinese brands have not indigenized production in China. They have a
truly global R&D footprint, where countries globally attract tasks in which there is local expertise. Moreover, all major handset producers mostly source their inputs from the same technology suppliers. Key technology suppliers include mostly firms from developed countries such as Google, Samsung, Qualcomm, Broadcom, and leading semiconductor companies ARM and NXP.
As shown above, the smartphone market makes the case that, following disruptive technological change, one key reason for Chinese firms’ upgrading was the strong connectivity to global technology ecosystems. Growing own design and mar-keting capabilities allowed Chinese firms to respond rapidly to changes in market demand and consumer taste. Their reliance on GVCs allowed them to develop products that are interoper-able and compatible with global markets. Incidentally, the local presence of foreign firms enhanced the mutually beneficial rela-tionship between foreign core technology providers and local manufacturers. Domestically-owned firms had better and faster
FIGURE 4.2 Shift from feature phones to smartphones
2008 2009 2010 2011 2012 2013 2014 20150%
10%
20%
30%
40%
50%
60%
70%
100%
90%
80%
Android (Google)
Windows Mobile
iOS
Blackberry(RIM)
OthersSymbian(Nokia**)
2003 2004 2005 2006 2007 2008 2009 2010 2011 2012 2013 20140%
10%
20%
30%
40%
50%
60%
70%
100%
90%
80%
Feature phoneincumbents***
Samsung (Rep. of Korea)
Others**
LG (Rep. of Korea)
Other major Chinese brands*
Apple (USA)
Lenovo (China)
Xiaomi (China)
Huawei (China)
Android introduced
iPhone introduced
Source: Sturgeon and Thun (2019), and HIS Markit Data.
Notes: Based on unit sales to end users. *Others include Linex (open source)
WebOs (Hewlett Packard and others), and Bada (Samsung). ** Symbian, orig-
inally developed by a UK-based software company and compatible only with
(UK-based) ARM processors, pushed the hardest by Nokia but also used in
keyboard-based “smartphones” made by Motorola and Sony Ericsson.
Source : Gartner Newsroom Press Releases (Various Years).
Notes: Based on unit sales to end users. Data are indicative only since not
all firms were identified in all years. From 2003-2008 only the top five firms
were identified. In subsequent years the top ten were identified. *Unspecified
Chinese brands identified in the data in various years include ZTE, TCL, and
Yulong. **Brands identified in the data in various years include HTC (Chinese
Taipei), BenQ (Chinese Taipei), and RIM (Canada) are included the remainder
“Others” category. ***Feature phone incumbents include Nokia (Finland),
Motorola (USA), Sony-Ericsson (Japan-Sweden), and Siemens (Germany).
Source : Gartner Newsroom Press Releases (Various Years).

Technological progress, diffusion, and opportunities for developing countries: lessons from China • 91
access to technology inputs that boosted the competitiveness of their products, and owners of core technology benefited from expanding their sales in a large and growing Chinese market.
The importance of connectivity to key players is also demon-strated through network analysis. Criscuolo et al. (2017) apply network theory to an examination of foreign peer effects on firm-level total factor productivity (TFP). Based on Chinese
TABLE 4.3 Top five mobile handset brand market share in five-year intervals (millions of units)
Feature phone era (through 2007)
2003 2007
Company Home country Sales Market share Company Home country Sales Market share
Nokia Finland 180,672 35 Nokia Finland 435,453 38
Motorola United States 75,177 15 Motorola United States 164,307 14
Samsung Republic of Korea 54,475 11 Samsung Republic of Korea 154,541 13
Siemens Germany 43,754 8 Sony Ericsson Japan/Germany 101,358 9
LG Republic of Korea 26,214 5 LG Republic of Korea 78,576 7
Others 139,696 27 Others 218,604 19
TOTAL 519,989 100 TOTAL 1,152,840 100
Smart phone era (after 2007)
2011 2016
Company Home country Sales Market share Company Home country Sales Market share
Nokia Finland 422,478 24 Samsung Republic of Korea 306,447 21
Samsung Republic of Korea 313,904 18 Apple United States 216,064 14
Apple United States 89,263 5 Huawei China 132,825 9
LG Republic of Korea 86,371 5 Oppo China 85,300 6
ZTE China 56,882 3 Vivo China 72,409 5
Others 805,666 45 Others 682,314 46
TOTAL 1,774,564 100 TOTAL 1,495,358 100
Source: Sturgeon and Thun (unpublished), using HIS Markit Data.
FIGURE 4.3 Emergence of Chinese smartphone brands, in the domestic and foreign markets, percentTop manufacturers’ market shares in the Chinese market, 2017 Chinese brands’ market share in foreign markets, 2017
25
20
15
10
5
0Huawei OPPO Vivo Xiaomi Apple Samsung
100
80
60
40
20
0China India Bangladash Russia US World
Source: Xing (2018).

92 • Technological innovation, supply chain trade, and workers in a globalized world
FIGURE 4.4 TFP elasticities of Chinese firms with respect to centrality index and average productivity of their buyers/sellers(a) Comparison among firms with different levels of initial productivity (b) Comparison among firms with different sizes
(Percentage) (Percentage)
1st quantile 2nd quantile
Less productive
Network centrality Productivity of buyers/sellers
More productive
3rd quantile 4th quantile
2.5
2.0
1.5
1.0
0.5
0.0
-0.5
-1.0
-1.5
-2.0
0.8
0.6
0.4
0.2
0.0
-0.2
-0.4
-0.6
-0.8
Network centrality Productivity of buyers/sellers
1st quantile 2nd quantile
Smaller Larger
3rd quantile 4th quantile
Source: Criscuolo et al. (2018).
BOX 4.1“Value chain migration” — Can it be another scenario for surviving price wars?
In the face of increasing competition and attrition in home markets, some small-scale Chinese firms established new value chains with other developing countries by tapping into the uncultivated low-end markets at destination. Fujita (2017) presents the case of motorcycle industry in Viet Nam.
Prior to the entry of Chinese firms, the motorcycle indus-try in Viet Nam had been dominated by a handful of Japa-nese- and Chinese Taipei-invested manufacturers producing sophisticated yet expensive models that were far beyond the reach of the majority of the population. In this context, Chinese firms, faced with saturated consumer demand in the home market, saw Viet Nam, a low-income country with only expensive models available, to be a promising outlet for their low-priced Chinese products.
The penetration of Chinese firms into the motorcycle industry in Viet Nam started with the massive export of fin-ished vehicles. However, in 2002, the Vietnamese govern-ment enforced a measure against the imports of assembled vehicles and implemented high local content rules. As a result, firms’ market entry mode in Viet Nam shifted from vehicle exports to component exports, and then to FDI, giving rise to a new form of China’s GVCs serving the low-end market in Viet Nam.
Particularly notable was the performance of Chinese-in-vested parts suppliers who teamed up with Vietnamese assemblers. They capitalized on the competitive advantages
attributed to their local partners; namely, the knowledge of the local demand profiles and the capacity to handle indi-vidual dealers scattered around the country. The latter property was especially important because low-priced motorcycles mainly catered to consumers in rural provinces. Business statistics reveal that these teams of Chinese parts suppliers and Vietnamese assemblers collectively outper-formed Lifan, a big Chinese-invested motorcycle manufac-turer which entered the Vietnamese market with its own brand name.
While this “value chain migration” strategy provided a quick route for small-scale Chinese firms to escape from intense competition at home, there is a problem of sus-tainability in the targeted low-end market at destination. Indeed, with rapidly rising incomes in Viet Nam, the market for low-priced motorcycles in the country nearly disap-peared by the early 2010s, only a decade after its emer-gence. The teams of Chinese suppliers and local assemblers failed to keep up product development in order to meet changes in consumer demand, primarily due to the lack of the technology required to upgrade their products. In the end, the entire market is dominated by five foreign-invested manufacturers from Japan, Chinese Taipei and Italy, collec-tively accounting for a 98% share, including Honda’s 63% (Nguyen Thi Thu Ha and Ho 2013).Source: Fujita (2017)

Technological progress, diffusion, and opportunities for developing countries: lessons from China • 93
and Japanese firm-level microdata as well as multi-country input-output tables, the study investigates the relationship between firm performance and the position of firm operation within the GVCs. The GVC position of firm operation is deter-mined by two factors: network centrality, which represents particular firm’s interconnectedness with other players in the network, and (weighted) average productivity of its buyers/sell-ers, which indicates the relative importance of the firm’s peers. TFP elasticities with respect to these two factors define over-all peer effects on the firm in question. Their estimation results for China, presented in Figure 4.4, reveal that firms that are ini-tially (i.e. at the beginning point of observation) less productive or smaller are likely to improve their productivity faster than others when they are connected to the key players in the pro-duction networks.19 This implies that, for small emerging com-panies in developing countries, “to whom to be connected” in the international production networks is highly relevant, at least in the long run, when we consider the impact of technological progress on economic development (see Box 4.1).20
The question that remains unanswered is whether firms from other countries can replicate the positive experience of these Chinese firms. Are firms from smaller countries precluded this opportunity? And does automation of production even pre-vent initial entry based on low wages? The next section will discuss the impact of automation on offshore potential of low cost-locations.
5. Is automation reducing the offshoring potential of low-cost locations?
Historically, new technologies and changing trade patterns have tended to widen the circle of countries benefiting from expanding production. As countries’ costs rise, production tends to move into more capital-intensive goods, with the more labor-intensive tasks moving to lower-cost locations offshore. This “flying geese” model21 of industrialization and trade has been observed for several decades, as the more labor-inten-sive tasks have shifted from developed economies to the newly industrialized economies of East Asia and China. The question now is whether automation in established manufacturing cen-ters may reverse this process by reducing offshoring.
There is an increasing amount of anecdotal evidence on how increased automation has already enabled some leading firms to reshore labor-intensive manufacturing activities back to high-income economies. Foxconn, the world’s largest contract electronics manufacturer best known for manufacturing Apple’s iPhone, has recently announced it will spend $40 million at a new factory in Pennsylvania, using advanced robots and creat-ing 500 jobs (Lewis 2014). Adidas, the German sporting goods company, has established “Speedfactories” in Ansbach, Ger-many, and Atlanta, which will use computerized knitting, robotic cutting, and 3-D printing almost exclusively to produce athletic footwear (Assembly 2012; Bloomberg 2012; Economist 2017a, 2017b; Financial Times 2016).
China too is rapidly automating production through robot-ization to address declining wage competitiveness. Standard Chartered Global Research (2016) found that 48 percent of 290 manufacturers surveyed in the Pearl River Delta would consider automation or streamlining processes as a response to labor shortages; less than a third would consider moving capacity either inland or out of China. Some high-profile firms are already substituting a substantial number of workers with industrial robots. For example, Foxconn, producing Apple and Samsung products in China’s Jiangsu province, recently replaced 60,000 factory workers with industrial robots (South China Morning Post 2016). If China moves into more sophis-ticated exports while automating and retaining market share of the less sophisticated exports, then the expected en masse migration of manufacturing jobs may not occur.
More systematic evidence on robots and reduced offshor-ing, as manifested in FDI flows from high-income countries to low- and middle-income countries, has emerged recently. Based on firm-level data for 3,313 manufacturing companies across seven European countries, Kinkel, Jager and Zanker (2015) find that firms using industrial robots in their manufac-turing processes are less likely to offshore production activities outside Europe. Hallward-Driemeier and Nayyar (2018) find a non-linear relationship between the intensity of robot use22 in high-income countries (HICs) and FDI from HICs to low/medi-um-income countries (LMICs) between 2003 and 2015. For some time, the increasing intensity of industrial robots moved together with flows of FDI from HICs to LMICs. This is consis-tent with the literature which argues that many of the tasks that are suitable for automation are also suitable for offshoring (Autor, Dorn and Hanson 2015). For instance, routine tasks that follow explicit codifiable procedures are well suited to auto-mation because they can be computerized, and well suited to offshoring because they can be performed at a distance with-out substantial loss of quality (Autor, Levy and Murnane, 2003). The non-linearity – whereby beyond a threshold level of robot intensity there is a negative association between robot use in HICs and FDI flows from HICs to LMICs – reflects the fact that the scale of use may be a significant factor in making robots economically attractive.
The relationship between robots and offshoring, however, varies across sectors. Hallward-Driemeier and Nayyar (2018) show that the use of robots in high-income countries has increased steadily over the past two decades, with the steep-est increases in motor vehicles and other transport equipment, and electrical machinery and electronics23 (see Figure 4.5). As automation increases, penetration rates are starting to increase even in other manufacturing and services industries, such as logistics and food production. However, the textiles and apparel sector still remains amongst the least automated, especially apparel. A lower rate of robot intensity in this sector is associated with rates of new FDI from high income to low- and middle-income countries that are greater than those of highly automated industries such as automotive and electronics (see Figure 4.6). Data on FDI (not reported here)

94 • Technological innovation, supply chain trade, and workers in a globalized world
also suggests that some FDI may have migrated from China to LMICs in Asia and Africa, and from higher- to lower-income countries in the Europe and Central Asia region (Hallward-Drie-meier and Nayyar 2017).
6. Policy implications
This chapter draws several lessons on how to achieve upgrad-ing to move closer to the global technological frontier, largely based on the experience of China’s automotive and electrical equipment industries.24 The successful firms depend on access to constantly evolving global technology and knowledge-inten-sive intermediates. A number of Chinese smartphone manufac-turers, for example, have succeeded in entering and upgrading in GVCs by leveraging global technology ecosystems and by responding rapidly to changes in market demands and con-sumer tastes.
Technological progress triggered these changes. Modu-larization of product architecture offered a new entry point to GVCs for small-scale firms in developing countries. The import-ant message of our study, however, is that entry into GVCs alone does not translate automatically into technological upgrad-ing. To move up to high value-added tasks in technologically advanced value chains requires additional and complementary efforts by local actors.
Here, the development of mutually beneficial relationships between foreign core technology providers and local manufac-turers is the key. Local firms have better (and faster) access to technology inputs that boost the competitiveness of their prod-ucts, and the owners of core technology benefit from expand-ing their sales in large and growing markets. The ability of gov-ernments in developing countries to nurture such relationships depends on their ability to reform the domestic investment envi-ronment in a manner to stimulate and rationalize technological transfer/sharing by advanced firms within a sequence of local supply chains.
One important aspect of the reform is building capabilities of local manufacturers. Manufacturing can no longer thrive with unskilled workers alone, and many tradable services are skill intensive. Recourse to industrial polices to stimulate GVCs, how-ever, can have unintended consequences. Some incentives may take the form of implicit or explicit subsidies, and lead to trade tensions. Weaker bargaining power of governments, compared to large lead firms in GVCs, also means that there is the risk that incentives result in sizeable transfers of rents to the firms, reduc-ing the social dividend of being in GVCs.
Another important dimension of domestic reform is the development of legal/institutional bases. Creating an attractive investment environment is a multi-faceted task. Policy-planners have to consider various domestic factors that might affect firms’ investment decisions: physical infrastructure, trade policies,
FIGURE 4.5 Operational stock of robots in high-income countries, 1993-2015
All other manufacturing branches
Motor vehicles and other transport equipment
Industrial machinery
Electrical/electronics
Metals and metal products
Glass, ceramics, stone, mineral products
Rubber and Plastics
Other chemical products n.e.c.
Pharmaceuticals, cosmetics
Paper
Wood and Furniture
Textiles
Food and Beverages
0
200,000
400,000
600,000
800,000
1,000,000
1,200,00019
9319
9419
9519
9619
9719
9819
9920
0020
0120
0220
0320
0420
0520
0620
0720
0820
0920
1020
1120
1220
1320
1420
15Source: Hallward-Driemeier and Nayyar (2018), using International Federation of Robotics Database.

Technological progress, diffusion, and opportunities for developing countries: lessons from China • 95
competition policies, wage levels, workers’ educational attain-ment, and so on. Among them, increasing attention is being paid to the role of the legal system in facilitating capital inflows, especially into developing economies. Even though the issue is not touched in the preceding argument, it is worth shedding a light on this important aspect of globalization.
Nunn (2007), for example, introduces the concept “con-tract-intensive” products, which rely on production processes with complicated interactions between clients and suppliers at various stages of a production sequence. Such a product attri-bute is especially salient in industries with a high degree of market differentiation, for example airplanes or special indus-trial machinery. Accordingly, the countries with well-established legal systems and high-quality institutions are considered to have comparative advantages in producing this type of prod-uct, just in the same way that countries with an abundant cheap labor force are more competitive in producing labor-intensive
products. And most importantly, the study also shows that “con-tract-intensive” products are often skill-intensive as well, and hence likely to be of high value-added.
Closely related to this issue is the evidence that patent laws in offshore destinations influence global firms’ innovation decisions. Bilir and Sakamoto (2018), using detailed data on US patent grants/citations and US multinational firms’ affiliate R&D investment, show that the presence of imitation risk from potential rivals at offshore destinations can drive leading mul-tinational firms to innovate selectively. They do so by shifting development resources toward relatively short-lived products that are difficult to imitate before they become obsolete. Here, by reducing imitation risk, patent reforms at offshore destina-tion facilitates innovation by multinational firms, but at the same time also increase the average economic lifespan of the prod-ucts they seek to develop. This implies that a policy reform of intellectual property rights in less developed countries affects
FIGURE 4.6 Robot stock in electronics and automotive relative to apparel in high-income countries (ratio) vs FDI flows from high-income to middle- and lower-income countries in electronics and automotive relative to apparel (ratio), 2003-15(a) Number of FDI Projects
Electronics and automotive products Textiles, apparel and leather products
500
1 000
1 500
2 000
2 500
3 000
3 500
02003 2005 2007 2009 2011 2013 2015
5 000
10 000
15 000
20 000
25 000
30 000
0
2003
2004
2005
2006
2007
2008
2009
2010
2011
2012
2013
2014
2015
(b) Stock of Industrial Robots
Electronics and automotive products Textiles, apparel and leather products
200
400
600
800
1 000
1 200
1 400
0
2003
2004
2005
2006
2007
2008
2009
2010
2011
2012
2013
2014
2015
100 000
200 000
300 000
400 000
500 000
600 000
700 000
0
2003
2004
2005
2006
2007
2008
2009
2010
2011
2012
2013
2014
2015
Source: Hallward-Driemeier and Nayyar (2018), using International Federation of Robotics Database.

96 • Technological innovation, supply chain trade, and workers in a globalized world
not only the level of innovation but also the type of innovation associated with offshoring activities, encouraging the develop-ment of technology with more sustainable economic values.
In conclusion, putting a foot in the door (of new industries) is not enough to thrive in GVCs. The examples of China and earlier developers show that developing through GVCs is a decades long journey that requires a reform effort sustained over time. While international connectivity is a key for entering GVCs, domestic governance matters for upgrading therein. Local gov-ernments need to offer well developed domestic legal systems, and guarantee the rule of law and high quality institutions. Good governance is crucial for attracting high value-added segments of global supply chains, where technological transfer/sharing between global firms and local suppliers is considered more solid and sustainable.
Industrial policy can have unintended consequences, and therefore should be carefully crafted. Policies for helping domestically-owned firms to become technologically standalone – what some might refer to as “techno-nationalism” – do not necessarily deliver the expected results. The world’s most pow-erful technology companies, both from emerging and advanced countries, work with global suppliers and even with competitors in “open innovation” environments. Hence, the advice to policy-makers seeking to upgrade toward the global technology fron-tier is to prioritize measures that encourage firms to be full part-ners in global technology ecosystems, rather than champions of domestic technology, or of so-called techno-nationalism.
Finally, while automation does not pose immediate risks to shut the door to labor intensive exports from developing coun-tries, governments need to develop a comprehensive digital strategy. Our economies are increasingly sitting on a digital foundation, one that is generating high-speed growth and dis-ruptive change. The employment and investment of tomorrow will be data intensive. Value in a knowledge economy is created by innovative ideas and data. As economies and firms from dif-ferent countries grow similar in size, international trade will inten-sify. But trade may tilt away from physical goods and towards data. Importantly, the digitally-powered, knowledge-intensive GVCs that are emerging and are likely to dominate the future have a strong potential for inclusion. Moreover, they can contrib-ute to expand markets for small businesses beyond traditional geographies. They can also expand financial inclusion, as data on e-commerce can be used as collateral, and smartphones link up the bottom half of world incomes to these opportunities.

Technological progress, diffusion, and opportunities for developing countries: lessons from China • 97
Gereffi, Humphrey, and Sturgeon (2005) set out a typology of five global value chains (GVCs) on the basis of the structure of power relations between the contracting parties.
Market-type GVCProducing a commodity of a generic nature does not require any specific investment in production facilities for a particular trans-action, so both customers and suppliers have countless choices for alternative partners. They are connected mainly through open spot-market transactions in a shoulder-to-shoulder relationship. Also, the procurement of a generic commodity will not neces-sitate an exchange of detailed product specification between contractors because the key information is mostly reduced to the preset price of the product that can be found in a book of catalogs. The transaction cost for changing business partners is almost negligible, leaving the value chains in a constant state of flux because of their high price elasticity.
Modular-type GVCIn business management or industrial engineering the word “module” generally refers to a composite of subcomponents grouped by the types of functions that are assumed in making up the final product. The possibility of different combinations of dif-ferentiated modules enables producers to design multiple vari-ants of a product. By the same token, if a complex transaction can be accommodated in the supply base by adjusting the com-bination of multipurpose equipment, the supplier will not have to incur transaction-specific investment (no hold-up problem) and is thus able to spread the equipment’s use across a wide range of potential clients. Even though the information to be delivered between the contractors may be considerable (say, for producing a complex product), the relative easiness to codify transactions, as presumed in this type of GVC power relations, compresses the volume of interventions, and the supplier is able to take overall control of the production process. This implies that the transac-tion cost for changing business partners remains relatively low.
Relational-type GVCWhen the manufacturing process involves specialized equip-ment (for example, the mold for a product of a particular shape), transactions become asset-specific, and the contracting par-ties become mutually dependent. The equipment for a specific purpose has limited scope for alternative uses, so its productiv-ity will drop considerably when it is applied in other contexts. Accordingly, the service suppliers (the holders of the specialized equipment) are not motivated to look for other potential clients. But it is also difficult, or at least costly, for the client to expect the same level of performance from other third suppliers with-out these specialized facilities. As a result, both parties have little incentive to search for alternative business relations. Further, reinvestment in the specialized equipment for raising productiv-ity deepens the asset-specificity of the transaction, thus trapping the parties in even more mutually dependent relationships.
Captive-type GVCThis type of transaction assumes an overwhelming disparity in power exercise among the parties, as seen in the business rela-tions between a lead firm of global brands and its subcontracting local small companies. Service suppliers are expected to follow the client’s instructions word for word and are subject to strict surveillance on product quality and delivery times. Unlike sup-pliers in the market-type GVC, the captive service suppliers have neither sufficient productive capacity to enjoy the scale of mass production, nor the specialized production facilities needed to claim its uniqueness, as attributed to the suppliers in the rela-tional-type GVC. The availability of only mediocre production capability greatly narrows their opportunities to look for alterna-tive business relations, imposing a captive position toward their clients.
Hierarchy-type GVCThis type of GVC generally refers to the relations within a verti-cally integrated firm, as with multinational corporations.
ANNEX 4.1Typology of global value chains25

98 • Technological innovation, supply chain trade, and workers in a globalized world
Notes
1. Sturgeon and Thun (2019) note that there are three reasons for the rel-
atively short supply lines in the automotive industry. First, motor vehi-
cles comprise several heavy, bulky and sometimes easily damaged
components (engines, large metal parts, seats and painted items)
that increase shipping costs. Second, the adoption of low-inventory,
just-in-time assembly techniques and high product variety (vehicles
can have dozens or hundreds of options) increase the motivation to
locate module and sub-subsystem assembly close to or even adjacent
to final assembly. Third, many countries, including the United States,
China, Brazil, India, South Africa, and many others, have long-stand-
ing policies, both explicit and implied, that have encouraged FDI and
high local content levels — and more recently, R&D and engineering
investments—in return for market access. Because of their relatively
recent importance in the industry, this has meant a wave of FDI by
suppliers to provide local content.
2. “It is two German automakers, Volkswagen and Mercedes-Benz (pres-
ently DaimlerChrysler), that geared up the auto industry’s modulariza-
tion in the mid-1990s. Their new assembly plants, which started pro-
duction in 1996 and 1997, introduced modularization on a large scale,
specifically at Volkswagen’s plants in Resende (Brazil), Boleslav (Czech
Republic), and Mosel (former East Germany), and Mercedes-Benz’s
plants in Vance (U.S.) and Hambach (France)”. Source: Takeishi and
Fujimoto, 2001.
3. Shenyang Aerospace Mitsubishi Motors designed engines and trans-
missions, and then Delphi took charge of ECU adjustment to custom-
ize these system components according to the individual designs of
customers’ vehicles (Oshika et al., 2009). The company codified the
harmonization expertise and encapsulated it in a chip as a set of dig-
ital information, whereby potential conflicts among parts arising from
variations in car bodies can be mediated through a mere parameter
adjustment of ECUs.
4. This is consistent with the 3Cs model of Gereffi et al. (ibid.).
5. The modularization of car architecture has also invited new entrants
from other industries. Panasonic’s subsidiary Automotive & Industrial
Systems develops system component packages in three areas: cock-
pit systems (displays, gauges, and car navigation devices); drive-as-
sist systems (sensors, cameras, and LEDs); and power management
systems (compressors and charge controls). Panasonic’s technological
know-how from manufacturing electrical equipment is fully applied to
and embodied in the car production schemes (Nikkei Business, 2013).
6. Suppliers are located in places as diverse as the United States,
Mexico, Brazil, Viet Nam, Malaysia, India, China, and various locations
in Europe. On the ICT services side, countries such as India, Philip-
pines, and Ukraine provide routine software coding and the provision
of remote ICT-enabled services.
7. There are two main reasons for the delinking of production from
design and innovation activities. First, the deep technical, manage-
ment, and financial expertise needed to develop and launch new
products and alter the technological trajectory and evolution of
knowledge-intensive industries takes a long time to develop and
therefore tends to be place-specific. Second, because of fragmenta-
tion in GVCs, traditional design clusters have been able to maintain,
and even strengthen, their roles in GVCs, thanks to the fact that first-
tier suppliers have co-located with lead firms.
8. From the beginning, the industry has had close links with the devel-
opment of military technology; hence, the standardization of its major
product lines was advanced under strong military influence. Product
standardization was further facilitated by the introduction of com-
puter-aided design systems, which allowed information on product
designs and specifications to be digitized and stored for repeated use
in the industry. In addition, the Information Technology Agreement,
a high-level plurilateral free-trade agreement, was adopted by many
countries including emerging economies, and thus became another
important driver of standardization and modularization of the indus-
try’s value chains.
9. Platforms can exist at all levels of a value chain and in all industries,
and are ideal to help latecomers to join capital- and skill-intensive
value chains. Platforms provide a wide range of functionalities and
flexibility. As such, platforms have played a key role in disrupting var-
ious industries, from consumer electronics such as LCD TVs to special
industrial machinery such as numerically-controlled machine tools.
In the PC industry, the most prominent example is “Win-tel”, which
is a coinage from Microsoft’s operating system Windows and chip
designer/vender Intel.
10. According to Shiu and Imai (ibid.), sales promotion through blueprint
bundling is known to have originated in the business model of US/
European chip vendors who sought marketing opportunities in China.
However, the production guidelines in the blueprints of the US and
European vendors covered only basic aspects of terminal assembly.
Lacking detailed explanations, these blueprints were not sufficiently
user-friendly for Chinese manufacturers with limited experience in
the production of high-tech equipment such as mobile phones. In
contrast, MediaTek from Chinese Taipei provided full guidelines for
every aspect of assembly tasks, even covering multimedia functions
for music/video playback, and offered a package with a considerably
cheaper license fee than those of US/European rivals. As a result,
MediaTek contributed to Chinese manufacturers’ ability to produce
at low cost while still providing highly appealing products for local
consumers.
11. In a general equilibrium perspective, the price competition benefits
downstream users, especially final consumers. Here, we consider
costs and benefits only from the viewpoint of mobile phone produc-
ers in relation to their development potentials.
12. The case of MediaTek illustrates how a platform leader can use its
leadership position to impose a closed system of governance on the
resulting ecosystem (as opposed to allowing it to be open source).
When this happens, the platform leader can impose structural con-
straints on the design and specification of other auxiliary components,
with the effect that suppliers and other firms in the platform ecosys-
tem may be forced to produce products whose designs are highly
subordinate to the platform’s interface specification. The platform
leader can also completely “black-box” the interior of the platform
module itself, which gives it potentially an overwhelming power to
influence the way supply chains are organized in the industry.
13. To capture consumers’ attention, local manufacturers rushed to intro-
duce multiple models with very similar functionalities. As a result, the
market was flooded with undifferentiated products and the industry’s

Technological progress, diffusion, and opportunities for developing countries: lessons from China • 99
profitability declined significantly. The emergence of MediaTek pro-
vided local manufacturers with the opportunity to produce high-tech
mobile-phone terminals, but also induced the side-effect of rapid
commoditization of the industry. Commoditization of mobile phones
into undifferentiated products significantly lowered the complexity of
transactions between parties.
14. As discussed in the text, the value chain of the shanzai sector is typi-
cally arm’s length, prone to feature numerous undifferentiated prod-
ucts, i.e. characterized by a highly disintegrated market, with dozens
of independent firms specializing in the same narrow and low-value
added segments of production and competing with each other
harshly on prices.
15. The “G”s of 3G and 4G stand for a generation of mobile phone tech-
nology, and hence the terminals with 4G generally assume higher per-
formance than those with 3G in terms of data transmission speed and
reliability. For the previous generations, 1G was analogue technology,
which turned into digital technology from 2G. Today, we are now
talking about 5G, which is considered to have a significant impact on
the way of our life. Compared to the earlier technologies, 5G realizes
greater speed, lower latency, and simultaneous connection to larger
number of devices. Such features brought a wider prospect for the
high level of applications in the areas of Internet of Things, remote
services, self-driving systems, virtual/augmented realities, and so on.
16. Also, Qualcomm’s unique patent licensing model, based on a rev-
enue-sharing scheme, provided its own incentive to care about the
performance of its customers, thus making further motivation to
closely collaborate with them.
17. Ding and Hioki (2017) do not consider this form of new value chains
as relational since it does not involve asset-specific transactions. How-
ever, one might consider that the human/organizational relationships
developed through collaboration are specific (intangible) assets, as
frequently observed in Japanese firms’ practices in keiretsu networks.
18. These two firms together assemble about 22 percent of their hand-
sets in the Republic of Korea, and rely on Viet Nam and Indonesia as
secondary sources to China. Only HTC, from Chinese Taipei, and a
relatively minor player, produces entirely at home. India and Brazil are
significant assembly locations for many brands, in part to meet strong
local content requirements in these large markets.
19. Note that this finding was also captured by the earlier work of
Santoni and Taglioni (2016). Also, the demonstrated empiri-
cal result is consistent with Criscuolo and Timmis’s (2017) based
on large-scale multi-country firm-level data collected from the
ORBIS. Although the ORBIS data include Japanese and Chinese
firms, the coverage of these Asian firms is not large in the analysis
by Criscuolo and Timmis (2017) mainly because the value added
information is not available for many Asian firms. Therefore, the
firm-level data used by Criscuolo and Timmis (2017) cover more
European firms than Asian firms such as Japanese and Chinese firms.
In Nakano, Nishimura, and Kim (2018), a parallel approach is pro-
jected to address the issue of technological diffusion by employing
a general equilibrium framework, again using input-output accounts.
The technological diffusion is considered to transform the input sub-
stitution structure as prompted by the change in relative prices of
products. Such “structural propagation” was quantified by using a
system of various cost functions whose parameters were estimated via
two timely-distant input-output accounts and deflators.
20. Fujita (2017) presents a case of the motorcycle industry in Viet Nam
in which Chinese suppliers chose to engage in the relations with local
Vietnamese manufacturers without strong technological bases. See
Box 4.1 for the motivation of the strategy and its consequences.
21. The well-known theories of Vernon’s “product life-cycle” and Aka-
matsu’s “flying geese” depict a process in which technologies orig-
inating in advanced economies become obsolete and are passed
on to less-developed countries, thereby promoting their economic
development.
22. Measured as the stock of industrial robots per 1000 persons
employed.
23. This sector-level data obfuscates the fact that certain tasks even in
these highly automated sectors will continue to be labor-intensive.
24. Even though these two industries are highly prominent in GVCs, it
is also interesting and worthwhile to consider how representative
they are in terms of their development experience vis-à-vis other
industries, especially those relevant for developing countries such as
apparels or agro-business. This will be the topic of future research.
25. This annex is reprinted from GVC Development Report 2017, chapter 1.

100 • Technological innovation, supply chain trade, and workers in a globalized world
References
Assembly. 2012. “Automation Profiles: Robots Help Philips Shave Assem-
bly Costs.” Assembly Magazine, June 1.
Autor David H., David Dorn & Gordon H. Hanson, 2016. “The China Shock:
Learning from Labor-Market Adjustment to Large Changes in Trade,”
Annual Review of Economics, Annual Reviews, vol. 8(1), pages 205-240,
October.
Autor, David H., Frank Levy, and Richard J. Murnane. 2003. “The Skill
Content of Recent Technological Change: An Empirical Exploration.”
Quarterly Journal of Economics 118(4): 1279–1333.
Baldwin, C.Y. and Woodard, C.J.: The architecture of platforms: a unified
view. In: Gawer, A. (ed.) Platforms, Markets and Innovation, pp. 19--44.
Edward Elgar Publishing (2009)
Bilir, L.K, and Y. Sakamoto. 2018. “Patent Laws and Innovation Selection in
the Global Firm.” a paper presented at the conference of The Japan
Society of International Economics, held 13-14 October, Nishinomiya,
Japan.
Brandt, L., J. Van Biesebroeck and Y. Zhang (2008), ‘Creative accounting or
creative destruction?”
Brandt, L. & E. Thun. 2010. “The Fight for the Middle: Upgrading, Compe-
tition, and Industrial Development in China,” World Development, vol.
38, no. 11, November.
Brandt, L. & E. Thun. 2011. “Going Mobile in China: Shifting Value Chains
and Upgrading in the Mobile Telecom Sector,” International Journal of
Technological Learning, Innovation and Development, Vol. 4, No.1/2/3.
Brandt, L. & E. Thun, 2016. “Constructing a Ladder for Growth: Policy, Mar-
kets, and Industrial Upgrading in China,” World Development, Elsevier,
vol. 80(C), pages 78-95.
Bloomberg. 2012. “China No Match for Dutch Plants as Philips Shavers Come
Home.” Bloomberg Technology, January 19. http:// www.bloomberg.com/
news/articles/2012-01-19/china-no-match- for-dutch-plants-as-philips-
shavers-come-home-1-.
Chesbrough, H. and K. Kusunoki, (2001) ‘The modularity trap: innovation,
technology phase shifts and the resulting limits of virtual organiza-
tions’, in I. Nonaka and D. Teece (Eds.) Managing Industrial Knowledge,
London: Sage.
Criscuolo, C., Y. Hashiguchi, K. Ito, and J. Timmis. 2018. “Changing Struc-
ture of Global Value Chains and Domestic Firms’ Productivity: Evidence
from Japanese and Chinese Firm-Level Data.” A background paper for
Global Value Chain Development Report 2017: Measuring and Analyz-
ing the Impact of GVCs on Economic Development. The World Bank
Group.
Criscuolo, C. and J. Timmis (2017a) The Changing Structure of GVCs: Are
Central Hubs Key for Productivity? A Background Paper for the 2017
Conference of the Global Forum on Productivity, June 26-27, Budapest.
Criscuolo, C., and J. Timmis (2017b) The Relationship between Global
Value Chains and Productivity, International Productivity Monitor, 32:
61-83.
Ding, K., and S. Hioki. 2018. “The role of a technological platform in facil-
itating innovation in the global value chain : a case study of China’s
mobile phone industry.” IDE Discussion Paper Series No. 692. Institute
of Developing Economies, JETRO.
Economist. 2017a. “3D Printers Will Change Manufacturing.” June 29.
Economist. 2017b. “3D Printers Start to Build Factories of the Future.” June
29.
Financial Times. 2016. “Robot Revolution Helps Adidas Bring Shoemaking
Back to Germany.” June 8.
Fujita, M. 2018. “How suppliers penetrate overseas market: Internationaliza-
tion of Chinese firms from the value chain perspective.” IDE Discussion
Paper Series No. 727. Institute of Developing Economies, JETRO.
Gereffi, G., J. Humphrey, and T. Sturgeon. 2005. “The Governance of Global
Value Chains.” Review of International Political Economy 12 (1): 78–104.
Hallward-Driemeier, M., and Gaurav Nayyar. 2018. Have Robots Grounded
the Flying Geese: Evidence from Greenfield FDI in Manufacturing. World
Bank, Washington D.C.
Hallward-Driemeier, M., and Gaurav Nayyar. 2017. Trouble in the Making?
The Future of Manufacturing-Led Development. World Bank, Washing-
ton D.C.
Kinkel, Steffen., A. Jager, and Christoph Zanker. 2015. “The effects of robot
use in European manufacturing companies on production off-shoring
outside the EU”. June. 22nd International Annual EurOMA Conference,
At Neuchâtel, Switzerland.
Imai K., Shiu J.M. (2011) Value Chain Creation and Reorganization: The
Growth Path of China’s Mobile Phone Handset Industry. In: Kawakami
M., Sturgeon T.J. (eds) The Dynamics of Local Learning in Global Value
Chains. IDE-JETRO Series. Palgrave Macmillan, London. https://link.
springer.com/chapter/10.1057/9780230281783_3
Inomata, S. 2017. “Impact of new technologies on the organization of
global value chains (1): dynamic transformations within global value
chain typology.” IDE Discussion Paper Series No.682. Institute of Devel-
oping Economies, JETRO.
Lewis, Colin. 2014. “Robots Are Starting to Make Offshoring Less Attrac-
tive.” Harvard Business Review. May 12.
Nakano, S., K. Nishimura, and J. Kim. 2018. “Multi-Sectoral Value Chain in
a Bilateral General Equilibrium.” IDE Discussion Paper Series No. 691.
Institute of Developing Economies, JETRO.
Nguyen Thi Thu Ha, and Chenger Ted Ho. 2013. “Localization Strategy of
Motorcycle Industry in Vietnam.” Presentation at the International Con-
ference on Social Science and Business, Chinese Taipei, January 2013.
Nikkei Business. 2013. Nihonkeizai-shinbun shuppan-sha, 22 July 2013.
Nunn, N. 2007. “Relationship-Specificity, Incomplete Contracts, and the
Pattern of Trade.” Quarterly Journal of Economics 122 (2): 569–600.
Parker, G.G., M.W. Van Alstyne and S.P. Choudary (2016), ‘Platform Revolu-
tion: How Networked Markets Are Transforming the Economy and How
to Make Them Work for You’, WW Norton & Company.
Oshika, T., R. Inoue, J. Oh, S. Orihashi. 2009. “Automotive industry: com-
parison of Asian industries based on architecture analysis.” in Shintaku.
J., and T. Amano eds., Global Strategy of Manufacturing Management:
Industrial Geography in Asia. Yuhikaku, Japan: 163-84.
Santoni, G. and D. Taglioni (2015), “Networks and structural integration in
global value chains” in Amador, J. and F. di Mauro (eds.), The Age of
Global Value Chains: Maps and Policy Issues, pp. 68-84, Centre for Eco-
nomic Policy Research, voxEU eBook.
Shiu, K., and K. Imai. 2009. “Mobile phone industry: the transformation of
architecture and competition structure in Chinese markets.” in Shintaku.
J., and T. Amano eds., Global Strategy of Manufacturing Management:
Industrial Geography in Asia. Yuhikaku, Japan: 111-35.

Technological progress, diffusion, and opportunities for developing countries: lessons from China • 101
South China Morning Post. 2015. “Rise of the Robots: 60,000 Workers
Culled from Just One Factory as China’s Struggling Electronics Hub
Turns to Artificial Intelligence.” September 21.
Standard Chartered Global Research. 2016. “Global Supply Chains: New
Directions.” Special Report, Standard Chartered Global Research,
London.
Sturgeon T.J., Linden G. (2011) Learning and Earning in Global Value Chains:
Lessons in Supplier Competence Building in East Asia. In: Kawakami
M., Sturgeon T.J. (eds) The Dynamics of Local Learning in Global Value
Chains. IDE-JETRO Series. Palgrave Macmillan, London
Thun, Eric and Sturgeon, Tim (2019) When Global Technology Meets Local
Standards: Reassessing the China’s Mobile Telecom Policy in the Age of
Platform Innovation. In: Rawski, Thomas and Brandt, Loren, (eds.) Policy,
Regulation and Innovation in China’s Electricity and Telecom Industries.
Cambridge University Press. ISBN 978-1108703697 (Accepted)
Takeishi, Akira and Takahiro Fujimoto. (2001) “Modularization in the Auto
Industry: Interlinked Multiple Hierarchies of Product, Production, and
Supplier Systems, first draft”
Xing, Y., and Y. He, 2018. “Domestic Value Added of Chinese Brand Mobile
Phones,” GRIPS Discussion Papers 18-09, National Graduate Institute
for Policy Studies.


103
CHAPTER 5
Understanding Supply Chain 4.0 and its potential impact on global value chainsMichael J. Ferrantino (World Bank Group) and Emine Elcin Koten (World Bank Group)*
ABSTRACT
The reorganization of supply chains using advanced technol-ogies, such as the Internet of Things (IoT), big data analytics, and autonomous robotics, is transforming the model of supply chain management from a linear one, in which instructions flow from supplier to producer to distributor to consumer, and back, to a more integrated model in which information flows in an omnidirectional manner to the supply chain. While e-commerce is uniquely suited to many of these techniques, they also hold the promise of improving efficiency in brick-and-mortar stores. These technologies are generating enor-mous benefits through reducing costs, making production
more responsive to consumer demand, boosting employment (employment in supply chain sectors where such technologies are most likely to be applied has grown much more rapidly than in other supply chain sectors and in the economy as a whole) and saving consumers’ time. The impact of these tech-nologies on the length of supply chains is uncertain: they may reduce the length of supply chains by encouraging the reshor-ing of manufacturing production to high-income economies, thus reducing opportunities for developing countries to par-ticipate in GVCs, or they may strengthen GVCs by reducing coordination and matching costs.
• Digital technologies are transforming supply chain management from a linear model in which instructions flow from supplier to producer to distributor to consumer, and back, to a more integrated model in which information flows in multiple directions (sometimes referred to as Supply Chain 4.0).
• Digital technologies offer huge benefits in terms of inclusive patterns of growth, innovation and entrepreneurial opportunities
• The impact of new digital technologies on GVCs is uncertain: they may reduce the length of supply chains by encouraging the reshoring of manufacturing production, thus reducing opportunities for developing countries to participate in GVCs, or they may strengthen GVCs by reducing coordination and matching costs.
* We are grateful for helpful comments by Gary Hufbauer, Satoshi Inomata, Kalina Manova, William Shaw, Emmanuelle Ganne, and Lauren Deason. All
errors and omissions remain the responsibility of the authors.

104 • Technological innovation, supply chain trade, and workers in a globalized world
1. Introduction
“Supply Chain 4.0” is the re-organization of supply chains – design and planning, production, dis-tribution, consumption, and reverse logistics – using technologies that are known as “Industry
4.0”. These technologies, which emerged in the 21st century, are largely implemented by firms that are at the frontier of supply chain management in high-income countries. Though, as we will argue, this classification is somewhat artificial, it does in fact capture certain prevailing ideas about what firms need to do, and are doing, in order to maintain competitive supply chains.
1.1 Supply Chain 4.0 is here alreadyWhile much of the literature we will review is forward-looking, and indeed has emerged only in the last two or three years, almost all of the technologies we discuss are being imple-mented today, at least by firms at the frontier of supply chain management, which by and large are in high-income countries.1 With only one or two exceptions, everything described in this
chapter is already being applied in actual supply chains, or is at least being piloted. While the literature includes many ideas for emergent technologies that might be available by 2030 (for example, vast fleets of self-driving delivery vehicles, or the “smart mirror” in the local clothing store that supposedly will allow you to virtually try on clothes just by scanning their bar codes), this argument does not depend on the deployment of technologies that do not really exist yet. The diffusion of already existing Supply Chain 4.0 technologies will already have a substantial impact.
When we say that Supply Chain 4.0 is here, we mean that it is here at the frontier of supply applications and being more widely adopted, not that it is universal. Even in high-income countries, the principles of Supply Chain 4.02 are unequally applied. Advanced supply management techniques are more likely to be observed in sectors such as electronics where earlier waves of management techniques took hold first, or in big-box retailers such as Walmart. As recently as February 2018, supply chain problems caused two-thirds of the 900 Kentucky Fried Chicken restaurants in the United Kingdom to close because they had run out of chicken.3
FIGURE 5.1 US employment by sector, supply chain sectors, manufacturing, transportation, post office and other, percent change (2011-2016)
-5
0
5
10
15
20
25
30
35
40
45
Who
lesale
Elec
tronic
Mark
ets,
etc.
Gener
al M
erch
andise
Store
s
Misc
ellan
eous
Store
Ret
ailer
s
Nonsto
re R
etail
ers
Courier
s and
Mes
seng
ers
Ware
hous
ing an
d Storag
e
Spec
ialty
store
retai
lers
Mer
chan
t who
lesale
rs
Gener
al Tr
ansp
ortatio
n
Posta
l Ser
vice
Man
ufactu
ring
Total
supply
chain
secto
rs
Total
US e
cono
my
Supply-chainsectors Aggregates
S

Understanding Supply Chain 4.0 and its potential impact on global value chains • 105
1.2 It transforms business models, making supply more customer-drivenWhile Supply Chain 4.0 involves the deployment of such contem-porary tools as the Internet of Things (IoT), big data analytics, autonomous robotics, and the like, it is not really about any of these things. It is about transforming the model of supply chain management from a linear model in which instructions flow from supplier to producer to distributor to consumer, and back, to a more integrated model in which information flows in an omnidi-rectional manner to the supply chain. While lead firms are increas-ingly analyzing this information through “supply chain control towers,” the end effect of this development could be making the goods economy more responsive to consumer demand.
1.3 E-Commerce is ideally, but not uniquely, suited for Supply Chain 4.0The ability to capture data in e-commerce empowers many of the data-driven methods we will discuss. In particular, older technologies (electronic data interchange) were already gather-ing large amounts of information in business-to-business (B2B) e-commerce, which can be used to improve supply chain perfor-mance. At the same time, most of the developments discussed here can be used to improve the performance of traditional brick-and-mortar stores, where the large majority of retailing still takes place, as well as in an e-commerce setting.
1.4 It generates jobs, which substitute for household labor and promote human well beingIn an exercise using U.S. data gathered in the Occupational Employment Statistics of the Bureau of Labor Statistics, this study shows that employment in the most dynamic parts of the supply chain has grown at a rate substantially exceeding that of the overall economy since 2011. These sectors include warehousing and storage (used by all retailers, Walmart as well as Amazon), couriers and messengers (the sector including UPS and Federal Express, commonly known as “express carriers”), and non-store retailers (particularly electronic shopping and mail-order houses, the sector inhabited by Amazon and eBay) (see Figure 5.1). Most of the jobs being created involve moving goods around either in warehouses or delivery vehicles and have many of the character-istics of factory work. Though robots are used in many of these applications, they appear, at present, to be complementary with human labor.
Most importantly, e-commerce, powered by Supply Chain 4.0, involves a great substitution of market labor for household shop-ping time. Traditional shopping is a time-consuming and, for many, tedious activity. Because household time is an intrinsically scarce resource, Supply Chain 4.0 is already having profound impacts on human well-being. However, time saved as a result of e-commerce also has increased employment in the transpor-tation and material moving occupations. As shown in Figure 5.2, men account for 42 percent of the time spent shopping, while women account for 58 percent, whereas men account 82 per-cent of employees in transportation and warehousing jobs, while women account for 18 percent. As discussed further in section vi
below, these workers, concentrated primarily in warehouses and express delivery companies, are paid to do the picking, packing, and driving that would otherwise be done by household shop-pers in the absence of e-commerce.
1.5 It can transform the operation of global value chainsWhether conceived of as an advanced management practice, or simply as a cluster of technologies to be deployed by advanced management practices, Supply Chain 4.0 provides substantial opportunities for firms to enhance productivity, profitability, product quality, and performance in international trade. Because Supply Chain 4.0 diffuses at an unequal rate, it can also influence the size distribution of firms within industries as well as income distribution across countries. The enhanced ability to track both physical and financial information also has implications for activ-ities of government which depend on highly disaggregated firm data, such as tax enforcement and monitoring of rules of origin in international trade.
2. The impact of Supply Chain 4.0 on firms
2.1 Technologies and management strategiesOne way to approach Supply Chain 4.0 is to treat it as simply the application of Industry 4.04 to the supply chain.5 And a common way to approach Industry 4.0 is to treat it as simply a bundle of technologies that have emerged, or are emerging, in the 21st century (see Figure 5.3). Then the task might be simply to map the technologies in Industry 4.0 to each of the steps of
FIGURE 5.2 Shopping and e-commerce occupations, gender division (2017)
Men Women
Percentages
0
20
40
60
80
100
Time spent purchasing goods and services
Transportation and material
moving occupations,employment
Source: BLS American Time Use Survey, BLS Current Population Survey, and
authors’ calculations.

106 • Technological innovation, supply chain trade, and workers in a globalized world
the supply chain – design and planning, production, distribution, and consumption.
While each of the “industrial revolutions” is generally char-acterized by a cluster of typical technologies, the list of these technologies varies from one author to another. Cirera et al. (2017) identify 17 technologies that are said to characterize Industry 4.0 (see Figure 5.4), which are referenced two or more times in a corpus of underlying sources, of which the most fre-quently mentioned are the IoT; big data analytics; 3D printing; advanced (autonomous) robotics; sensor-using smart factories6; augmented reality7; artificial intelligence8; and cloud computing9. Pfohl et al. (2015) identify over 50 technologies associated with Industry 4.0, mind-mapped to such underlying attributes as “dig-italization” (which applies to everything), “mobility”, “modular-ization,” “network collaboration,” “autonomization”, “transpar-ency,” and “socialization”.
It is tempting, as noted above, to attempt to understand Supply Chain 4.0 as the application of Industry 4.0 to supply chains, and then to map each of the stages of the supply chain (planning and design, production, distribution, consumption, reverse logistics) to one or more of the iconic technologies said to be typical of Industry 4.0: the IoT, cloud computing, artificial intelligence, etc. The difficulty immediately arises that the appli-cation of technologies to sets of problems is fluid, and it takes a
long time to determine what the most successful technologies will be in any given area. For example, during 1880-1920 it was not at all obvious how three available forms of energy, steam, electricity and gasoline, were to be applied to two areas of activity, factories and motor vehicles. Eventually a consensus emerged that factories ought to be run by electricity and motor vehicles by gasoline, but not before every other combination of power and activity had been experimented with extensively, and with some success (Freeman and Soete 1997 75-80, 139-140).
Fortunately, there is a more fruitful way to approach the prob-lem, because the broad functional outline of how Industry 4.0 affects supply chains is already apparent.
Supply Chain 4.0 fundamentally changes the way informa-tion flows through the supply chain. Traditional supply chains link suppliers to customers in a linear manner, with each firm sourcing inputs from suppliers and in turn delivering its products to customers (Figure 5.5). The planning process of each firm is designed to ensure that deliveries are coordinated with the cus-tomers’ sourcing activities, and that sourcing activities are coor-dinated with the suppliers’ delivery activities, and that returns of unwanted or unneeded products are accounted for (PWC 2016b). The processes by which this is done have been codified in the Supply-Chain Operations Reference (SCOR) model, originally developed in 1996 by the management consulting firm PRTM
FIGURE 5.3 The currently fashionable model of Industry 4.0 is over-simplified, but it reflects current thinking about what’s happening now (2018)
Source: https://www.hammelscale.com/industry-4-0/
Mechanization, steam power, weaving loom
Mass production,assembly line,electrical energy
Automation, computers and electronics
Cyber Physical Systems,internet of things, networks

Understanding Supply Chain 4.0 and its potential impact on global value chains • 107
(now part of PriceWaterhouseCooper) and AMR Research (now part of Gartner) (Lambert 2008, p. 305), and are now part of a de facto standard strategic, management, and process improve-ment methodology for supply chain management. The ideas behind SCOR, and their implementation, have been important for the development of global value chains and for supply coor-dination among networks of firms.
As successful as this method of supply chain management has been, it has limitations. Flows of information tend to primarily link each firm to its immediate suppliers and customers, not to firms further down the chain. In supply chains with multiple links, this leads to delays in the processing of information. In particu-lar, changes in the system flowing from changes in final demand, which are often unpredictable, become distorted as they pass upstream, analogous to the old child’s game in which a message whispered from one player to another becomes more and more different from its original content. Even with a lead firm acting as “impresario” of a network of firms, one actor is unlikely to have full information about everything that is going on in the supply chain. Managers at Walmart, planning for the fall apparel season, are in some sense leaders of their global supply chains (USITC 2011, 3-33 ff). But they are unlikely to actually know what is hap-pening in button and zipper factories in Bangladesh which are part of their supply chain. That information is held by middlemen. Firms in Singapore, which ship small screws to manufacturers of
disk drives in Thailand, which are in turn shipped to assemblers of laptop computers in China, cannot see changes in consumer demand visible to Best Buy, a retailer in the United States (Hirat-suka 2005). The term Supply Chain 4.0 can be usefully applied to an integrated supply chain ecosystem, in which information flows in all directions, analytics enable adjustment throughout the supply chain, and response takes place in real time (PWC 2016b) (see Figure 5.6).10 To rapidly assess and respond to changes in
FIGURE 5.4 Industry 4 0 technologies, by relative emphasis in recent studies
0 1 2 3 4 5 6 7 8 9 10
Number of references
Internet of Things
Big data analytics
3D printing
Advanced (autonomous) robotics
Smart sensors
Augmented reality
Cloud computing
Energy storage
AI or machine learning
Nanotechnology
Synthetic biology
Simulation
Human-machines interface
Mobile devices
Cyber security
Quantam computing
Horizontal and vertical integration
Source: Graphic from Hallward-Driemeier and Nayyar (2017).
FIGURE 5.5 Traditional supply chain model
Supplier Production Distribution Customer/Consumer
Plan Plan Plan
Order andconfirm
Order andconfirm
Order andconfirm
Source: PWC 2016b.

108 • Technological innovation, supply chain trade, and workers in a globalized world
customer demand, tracking and tracing throughout the supply chain is enabled through sensing technologies underlying the Internet of Things (IoT), including radio frequency identification (RFID), Bluetooth, and GSM (global system for mobile commu-nication), which links maritime transport to satellites. In par-ticular, changes in customer demand can be rapidly assessed and responded to. This technology has had a wide uptake. According to a recent PwC study on the rise of Industry 4.0, a third of the more than 2,000 respondents say their companies have started to digitize their supply chains, and fully 72 percent expect to have done so five years from now (PWC 2016a, p. 11).
2.2 Big data and supply chain analytics – running scenarios from a supply chain control towerNew technologies gather prodigious amounts of data. In the last decade, the cost of bandwidth has decreased by a factor
of nearly 40 times, processing costs have declined almost 60 times, and many of the sensors used in IoT technology cost no more than 60 cents (CGI 2016). These data are only useful if they can be reduced to information useful for making deci-sions in real time that create business value. Big data analytics thus are about using data to drive useful business intelligence, answering the questions, “What just happened?”, “Why did it happen?”, and “What are we going to do next?”. Specific appli-cations of big data analytics include early warning algorithms (are we about to run out of something or hit a bottleneck? Did prices we care about just rise?), predictive algorithms (what is demand likely to look like next spring, or five years from now?), stock-keeping unit (SKU) rationalization (the decision about the optimal set of products, or SKUs, to offer to consumers at any given time), channel assessment (the decision about the optimal way to get product to end market, e.g. e-commerce/
FIGURE 5.6 Integrated supply chain ecosystem
Distribution
ProductionSupplier
Customer/Consumer
Supply chaincontrol tower
Plan
Order andconfirm
Order a
nd
confir
m
Order and
confirmOrder
and
confi
rm
Plan
Plan
Plan
Track and trace
Qualityand status
Quality
and st
atus
Qualityand status
Quality
and st
atus
Trac
k an
d t
race
Source: PWC 2016b.

Understanding Supply Chain 4.0 and its potential impact on global value chains • 109
distributors/company-owned outlets/large and small retailers/mail-order/etc.), and dashboards (user-friendly quick visualiza-tion in “supply chain control centers”). The ability to collect and analyze data gathered in the whole supply chain makes it possi-ble to “run scenarios within the platform” (PWC 2016b), where the platform is conceived of as an overarching software solution within the supply chain control center.
The desire to collect and distribute data rapidly across a supply chain explains much of the recent enthusiasm for block-chain technologies in the context of supply chains (Petersen et al. 2017). Blockchain is a distributed ledger technology that allows multiple parties to maintain copies of the same informa-tion in different locations, either in an open manner or requiring individual entities’ permission to access the network. Blockchain protocols encode information such as numbers or programs, time-stamp them, and enter them as a block into a continu-ous chain of previous blocks linked to the same transaction (Niforos, Ramachandran and Reherman, 2017). Such attributes make blockchain attractive for supply chain management, as well as for other uses such as fintech, cryptocurrencies, smart contracts, and security. Blockchain technology also has poten-tial application in port logistics, improving tracking and trac-ing of containers and coordination among the diverse actors in ports such as carriers, ship agents, terminal operators, insur-ers, customs agents, financial institutions and inland transport (Weernink et al., 2017). While there is a great deal of hype about blockchain and supply chains at the present moment, pilot proj-ects involving establishing origin of Australian oats, preventing counterfeiting of Italian wine, combating fraud in diamond mar-kets, and tracing the provenance of geological samples have demonstrated proof-of-concept (Petersen et al. 2017). It should be noted that many of these coordination functions can be per-formed by combinations of technologies that do not involve blockchain.
2.3 Smart factories/fractal factories/M2M communications/driverless programmable vehiclesImproved data gathering within the IoT, combined with analyt-ics, enables process optimization within the factory as well, in order to enable timely business decisions. The application of Supply Chain 4.0 within manufacturing facilities is sometimes referred to as the “smart factory” (Pfohl et al. 2015). Embedded data collection units, using both automatic identification and data collection and radio-frequency identification (RFID) tech-nologies, can be embedded in most pieces of factory equip-ment. The information can be passed from machine to machine (M2M) and handed to a supply chain control tower for deci-sion making. Autonomous robotics simply refers to the control and reprogramming of robotics using bilateral and multilateral machine communication. Intra-logistics within factories includes the use of driverless vehicles to move materials based on exter-nally-provided information.
One of the most important features of the Smart Factory is the ability to do predictive maintenance. The use of sensors to identify maintenance needs in advance of potential breakdowns
reduces maintenance costs. (CGI 2017) For example, Microsoft and CGI developed a smart-sensor based solution for a com-pany that maintains more than 1.2 million elevators worldwide. Information from the sensors is made available to service tech-nicians and their supervisors through cloud-based dashboards. Manyika et al. (2015) estimate that predictive maintenance using IoT can reduce maintenance costs of factory equipment by 10-40 percent and reduce equipment downtime by up to 50 percent. Similarly, the use of predictive analytics and IoT can have a big impact on energy maintenance, both by using energy consumption data to detect potential equipment failures and by continuously modifying equipment settings and process param-eters in real time (CGI 2017).
2.4 Smart logistics and the warehouse of the futureSmart logistics encompasses not only scheduling of transport, but also activities within the warehouse. It is within the ware-house that many of the most profound changes are already taking place. As noted above, one of the big changes is that the warehouse and the customer become more visible to each other, so that customer final purchases trigger not only prod-uct moves from the warehouse but also product moves from the manufacturer to the warehouse.
In e-commerce, the Internet makes the warehouse visible to the customer. A familiar example of this is the notice one encounters at Amazon.com, “Only three left! Hurry!”, which can be used to influence both consumer behavior and trigger re-stocking. At Taobao.com, the giant Chinese e-commerce platform, customers are presented with both inventory and sales data for products. Alibaba is another platform that func-tions as the architect of an increasing complex eco-system, that includes designers/entrepreneurs, marketers, payments, financ-ing (credit) logistics suppliers, integration of on- and offline retail, supply chains and manufacturing, all of which are com-plementary players in the eco-system interacting on the net-work, in rapid-response, data-driven, algorithm-guided mode (Spence, 2018).
The predictive maintenance techniques discussed above can reach into the warehouse as well, which can similarly optimize delivery of spare parts to factories. Indeed, with a flexible 3D printer, spare parts can be produced in the warehouse, trig-gered by demand. Some analysts project that 3D printers, which can be placed in any environment including delivery trucks, may make warehouses obsolete.
A traditional warehouse involves a good deal of “pick and pack” activity. Employees search around in the warehouse for products that have been ordered, take them off the shelves, and pack them. If the warehouse serves several firms, the packing may involve selecting packing materials marked with the logo of a particular firm. Clearly knowing where the products are located in a large warehouse, and moving through the warehouse in a time-minimizing manner, can speed up delivery time substan-tially and reduce errors. Within the warehouse, autonomous logistics and robotic transport can be employed to substantially improve pick-and-pack performance. Other technologies can be

110 • Technological innovation, supply chain trade, and workers in a globalized world
used as well. Here’s one example of the use of augmented reality in a warehouse:
“DHL recently conducted tests on an augmented reality system at a warehouse in the Netherlands owned by Ricoh, the Japanese imaging and electronics company. Equipped with smart glasses containing software from Ubimax, employees navigated through the warehouse along optimized routes via the glasses’ graphics display, enabling them to find the right quantity of the right item much more efficiently, and with reduced training time. Over the three weeks of the test, 10 order pickers succeeded in fulfilling 9,000 separate orders by picking more than 20,000 items. The resulting productivity improvements and reduction in errors increased the overall picking efficiency by 25 percent” (PWC 2016b, p. 22).”
This example highlights a feature of many Supply Chain 4.0 technologies which will be important for understanding their employment effect. The use of new technology and human labor are often complements, rather than substitutes, especially in conditions where e-commerce is substantially increasing demand for certain goods. Rugaber (2018) reports that the online retailer Boxed in Edison, New Jersey opened up an automated ware-house in Union, New Jersey. Demand for goods was such that the firm ended up employing more humans, adding a third shift, as well as more robots. The new jobs are less physically demand-ing as well. Rather than taking thousands of steps a day loading items onto carts, employees can stand at stations as conveyor belts bring goods to them.11
2.5 E-Commerce is ideally, but not uniquely, suited for Supply Chain 4.0As we have seen, many of the tools of Supply Chain 4.0 can be applied to traditional store-based retailing. The expan-sion of e-commerce, however, allows additional ways in which new technologies can be implemented. One obvious feature of B2C-commerce is that the process of purchasing involves electronic data entry on the part of the consumer. This enables information to be captured, preferences to be assessed, and strategies to target the consumer to be implemented, such as the ubiquitous pop-ups which now follow one around the Inter-net after having viewed a product in a given category.
Although most of the popular discussion of e-commerce is on B2C, nearly 90 percent of e-commerce is in fact busi-ness-to-business (B2B) (UNCTAD 2017, from which Table 5.1). This means by definition that it consists of links in supply chains – whether transactions between parts suppliers and assem-blers, between distribution centers and retailers, or online purchases of services which in many cases support the supply chain. B2B commerce can be implemented either through websites, much like B2C e-commerce, or through electronic data interchange (EDI). EDI is a mature technology12 through which the computer systems of the buyer and seller are directly connected using a common record format.13 As an example of the pervasiveness of EDI, the United Kingdom’s Office of National Statistics finds that a majority of all e-commerce in the U.K. consisted of B2B e-commerce conducted through EDI, as opposed to over websites that resemble B2C e-commerce (Table 5.2).
TABLE 5.1 Top 10 economies by total, B2B and B2C e-commerce, 2015, unless otherwise indicated
Total B2B B2C
Economy $ billion Share in GDP (%) $ billion Share in total e-commerce (%) $ billion
1 United States 7,055 39 6,443 91 612
2 Japan 2,495 60 2,382 96 114
3 China 1,991 18 1,374 69 617
4 Republic of Korea 1,161 84 1,113 96 48
5 Germany (2014) 1,037 27 944 91 93
6 United Kingdom 845 30 645 76 200
7 France (2014) 661 23 588 89 73
8 Canada (2014) 470 26 422 90 48
9 Spain 242 20 217 90 25
10 Australia 216 16 188 87 28
Total for top 10 16,174 34 14,317 89 1,857
World 25,293 - 22,389 - 2,904
Source: UNCTAD Information Technology Report 2017.

Understanding Supply Chain 4.0 and its potential impact on global value chains • 111
Transactions between businesses which take place without EDI involve multiple processes of transmission and re-copying of data. A customer creates an order manually, perhaps using a computer. The order is transmitted by telephone or fax. It is manually keyed into the vendor’s computer system. When the order is fulfilled an invoice is created manually (with or without the aid of a computer). The invoice is sent back to the cus-tomer, who enters the data on the invoice manually.
Each of these steps in the process is time-consuming. More-over, each step is a place at which error can be introduced into the system, leading not only to slow order fulfilment but to lack of fulfilment or mis-fulfilment. An EDI system causes an order created electronically by the customer to be instantly duplicated without error in the vendor’s computer system, and the invoice to be similarly electronically duplicated in the cus-tomer’s computer system.
Besides saving time and labor, and reducing errors, EDI enables a large amount of data capture about customer behavior. Thus, data captured in EDI can be the basis for supply chain analytics using either big data or “small data” techniques. One study of manufacturers in the Czech Repub-lic finds that firms using EDI were also more likely to adopt advanced techniques of inventory management, such as con-signment stocks, buffer stocks, and safety stocks14 (Vrbová et al 2016). The same study reports that sectors with above-av-erage use of EDI include auto parts, electronics, engineering industries, plastics, retailing and textiles. These are all sectors associated around the world with well-organized value chains, showing the use of EDI-driven data capture and analysis in value chains.
3. The impact of Supply Chain 4.0 on consumers – customer fulfilment increasingly resembles magic
In a traditional consumer supply chain, the final step is an in-store retail establishment. Consumers frequently experience the frustration of goods being out of stock, either goods that are usually on the shelves but are not there on the day the con-sumer is in the store, or goods that the consumer would like to buy and knows that they exist, but that the store does not carry. In such cases, the remedies are familiar. Do you have any more in the back room? May I speak to a manager? For a particularly vigorous consumer inquiry, the manager might be prevailed upon to call another store in the chain, or a regional warehouse or distribution center. By this time, the consumer may well have given up and not made the purchase at all, or gone to a competitor.
Applications of IoT are increasingly used to facilitate the management strategies of “customer-managed inventory” (CMI) or “vendor-managed inventory” (VMI). These strategies represent a revolution in supply chain management of compa-rable importance to the “just-in-time” revolution in manufac-turing pioneered at Toyota and other companies in the 1960s. In such models, information is initially provided by a customer, for example by scanning a bar code associated with a purchase, and then transmitted up the supply chain to the warehouse/dis-tribution center.15 Technologies such as RFID tags then transmit information to the distribution center so that orders can be ful-filled. The information involved is mediated by EDI (see above under e-commerce). Since demand still cannot be fully forecast, models of inventory management such as scan-based trading or consignment distribute the risk between suppliers and retail-ers by enabling retailers to take physical possession of inven-tory while suppliers retain ownership, so that the sale between the supplier and retailer does not actually take place until the final consumer checks out at the register. More complex ver-sions of this transaction are possible.
By mediating a series of linkages between retailers, ware-houses, manufacturers, and suppliers of inputs to manufac-turing, EDI-driven CMI minimizes forecasting errors along the supply chain. As a hypothetical example, a consumer checking out of an AT&T store in California with a newly purchased Sam-sung smartphone may, by the single act of purchase, trigger a chain of information going all the way back to a company that supplies Samsung with touch screens relatively quickly, with tight linkages between the “supply chain control towers” of Samsung and AT&T.
Future developments in in-store retailing, enabled by IoT technology, will enhance both the customer experience and the ability of stores to pursue advanced management strate-gies (Gregory, 2015). Using their cell phones, customers may be able to scan barcodes on items to obtain product information or identify other colors or sizes available on the retailer’s web-site. VIP customers may be offered virtual coupons on enter-ing the store. Smart mirrors may allow customers to “try on”
TABLE 5.2 The United Kingdom reported that about 50 percent of e-commerce in 2017 was electronic data interchange B2B
Mode SectorValue in 2015(billion UK £)
Grand Total(%)
All modes Total 560 100
of which B2B 400 71.4
of which B2C 160 28.6
Electronic Data Interchange (EDI) Total (B2B)* 281 50 2
Website Total 279 49 8
of which B2B 119 21.3
of which B2C 160 28.6
Source: UK Office for National Statistics.
* EDI can be explained as an automated transaction between businesses and
therefore EDI sales are classed as business-to-business sales.

112 • Technological innovation, supply chain trade, and workers in a globalized world
different clothing virtually. This experience, which immerses the customer in a retail environment with the aid of both mobile and in-store devices, may be known as the Internet of Me. From the management standpoint, smart price tags can be changed in real time based on demand or other needs, and “smart shelves” in store could detect low inventory, thus providing further sup-port for CMI and VMI strategies. Of course, many of these same principles apply in markets for intermediate goods – B2B mar-kets. In these markets, the ability to use analytics and advanced supply chain management to improve performance is in many ways more advanced than in business-to-consumer (B2C) mar-kets, especially in sectors such as electronics, apparel, and motor vehicles where sophisticated supply chain methods have been in existence for an extended period of time. This is also discussed in the section on e-commerce.
4. The impact of Supply Chain 4.0 on workers
4.1 Physical labor in warehousing and driving substitutes for household timeIn an important recent contribution, Mandel (2017) demon-strates that U.S. sectors involved in supply chain activities associated with e-commerce have generated a significant amount of employment over the last decade – over twice as much as the reduction in employment in store-based retailing occurring at the same time. Moreover, the jobs involved are reasonably well-paying, and to some extent look like the old factory jobs in manufacturing which became less numerous during the period 1979-2010.
Specifically, Mandel finds that from December 2007 to June 2017, e-commerce jobs in fulfilment centers and e-commerce companies rose by 400,000, substantially exceeding the 140,000 decline in brick-and-mortar retail jobs. On a country by country basis, fulfilment center jobs pay 31 percent more than brick-and-mortar retail jobs in the same area.
Data from the American Time Use Survey (BLS) imply that in 2016, Americans age 15 and over spent 1.2 billion hours per week driving to the mall, finding a parking place, wander-ing around the aisles, checking out, and driving home. The number of hours spent by each such individual shopping per week declined from 4.9 in 2005 to 4.4 in 2012, recovering slightly to 4.5 in 2016. Due to online shopping, in the years between 2006 and 2012 each individual over age 15 spent 6 minutes fewer a day in the purchase of goods and services, which adds up to 11.8 billion leisure hours a year to spend on something else (see Figure 5.7). At the same time, the brick-and-mortar share of retail sales declined from 98 percent to 92 percent.
Thus, e-commerce is a mechanism for translating unpaid household shopping time (which has valuable alternate uses) to paid market time. Instead of consumers spending time shopping, workers in warehouses and on delivery trucks are picking goods off warehouse shelves and bringing them to the consumer’s front door. Since time is a scarce resource,
particularly in an affluent society, the implications of e-com-merce for social welfare are potentially profound. This includes implications for the gender distribution of labor. A reasonable hypothesis is that a further examination of the American Time Use Survey would reveal that the hours spent in shopping activities are disproportionately female, while the employ-ment in supply chain activities are likely to be relatively more those of male mail workers. We leave this hypothesis for future examination.
4.2 Overall trends in supply chain employment
DataWe analyze a group of sectors particularly involved in the dis-tribution of goods, including wholesaling (both traditional and electronic), retailing (both store-based and non-store based), couriers and messengers, and warehousing and storage (Table 5.3). We call the aggregate of these data the “supply chain sectors.’ We then use data from the Occupational Employ-ment Statistics (OES) of the U.S. Bureau of Labor Statistics to track sector-level employment as well as employment in individ-ual occupations in each sector. For contrast, we compare the results with trends in manufacturing and in the U.S. economy as a whole.
We focus on the period from 2011-2016. Even though it is a very recent period, it corresponds roughly to the period during which the discussion of “Industry 4.0” (and thus, eventually, “Supply Chain 4.0”) crept into the public awareness. This is a shorter period of time than covered in Mandel (2017). Moreover, we have a greater focus on the occupational composition of employment.
FIGURE 5.7 Hours spent per day shopping in the U S (2002-2018)
0
0.2
0.4
0.6
0.8
1.0
1.2
2002 2004 2006 2008 2010 2012 2014 2016 2018
Total Men Women
Source: BLS American Time Use Survey.

Understanding Supply Chain 4.0 and its potential impact on global value chains • 113
Supply chain sectors associated with e-commerce expe-rienced rapid employment growth from 2011 to 2016. While employment growth in U.S. supply chain sectors as a whole (8.7 percent) was below that of overall employment (9.2 percent), employment growth was much higher in the subcomponents of warehousing and storage (28.9 percent), non-store retailers (20.3 percent), and couriers and messengers (16.0 percent). Within the subcategory of non-store retailers, employment in the category of electronic shopping and mail-order houses, which approaches most closely the usual conception of e-commerce, grew even more rapidly at 41 percent.16 The time profile of employment increase shows that while jobs in the “couriers and messengers” sector grew steadily throughout the period, those at non-store retailers experienced an acceleration after 2013, while in ware-housing and storage the acceleration kicked in after 2014 (Figure 5.8). In terms of absolute job gains in the supply chain sectors, these were mainly in specialty stores – that is, stores that spe-cialize in one type of merchandise such as food, apparel, elec-tronics, cars, or sporting goods (Figure 5.9). Such stores account
for substantially more activity than general merchandise stores. Among the rapidly growing supply chain sectors, the largest job gains have been in warehousing and storage.
Types of employment increasing in supply chain sectors The dominant category of employment that has expanded in the current supply chain boom is “transportation and mate-rial moving operations.” Over 2011-2016, these occupations accounted for an increase in employment of over 350,000 in warehouses and courier services (Figures 5.10 and 5.11). These types of jobs involve a combination of physical and mental activ-ity comparable to that of Industry 2.0, but less strenuous because of the effects of mechanization.
Among e-commerce firms proper (electronic shopping and mail-order houses), the greatest absolute growth in employment has been in office and administrative support occupations, with the second largest absolute growth (and largest percentage change growth) being in business and financial operations occu-pations) (see Figure 5.12). Among specialty stores, employment in many of the back-office occupations has declined, and the gains have come in customer-facing occupations – sales and related occupations, and health care practitioners and technical occu-pations (see Figure 5.13). The gain in health care workers can be attributed to a single category of specialty stores, pharmacies. Companies such as Walgreens and CVS are increasingly offer-ing vaccinations and other basic health care services hands-on in their retail establishments, which carry many of the same items available in food stores and general merchandise retailers.
5. The impact of Supply Chain 4.0 on GVCs
Supply Chain 4.0 can be seen either as an advanced manage-ment practice, or as a cluster of technologies more likely to be adopted as the result of advanced management practices. As shown by recent survey-based research, improvement of man-agement practices – such as may be associated with adoption of Supply Chain 4.0 – is likely to enhance productivity and prof-itability, lead to higher-quality outputs produced using high-er-quality inputs (Bloom, Manova, Sun, Van Reenen and Yu 2018). Supply Chain 4.0 is designed to enhance key management com-petencies, such as effective target setting, collecting and ana-lyzing data to monitor progress towards these targets, inventory management, coordination of targets/progress across produc-tion stages, and worker supervision and incentives.
Supply Chain 4.0 technologies may enable firms to reduce the number of stages in supply chains by reshoring routine labor-in-tensive activities in developing countries back to the developed countries. These technologies make undertaking some produc-tion stages in high-wage countries more profitable by reducing the amount of labor required, thus weakening the incentive for firms to locate in low-wage countries and reducing the impor-tance of low labor costs in determining comparative advantage, providing instead an advantage to integrating multiple stages of production at a single automated location (Dachs et al. 2017).
TABLE 5.3 Sectors of employment defined as U.S. “supply chain sectors”
Total supply chain sectors:
423 Merchant Wholesalers (durable & non-durable goods)
425 Wholesale Electronic Markets and Agents and Brokers
441-8 & 451 Specialty Store Retailers
of which motor vehicles and parts dealers; furniture and home furnishings; electronics and appliance;
building materials and garden equipment and suppliers; food and beverage;
health and personal care; gasoline stations; clothing and accessories;
sporting goods, hobby, book and music
452 General Merchandise Stores
453 Miscellaneous Store Retailers (e.g. dollar stores)
454 Non-store Retailers
of which Electronic Shopping and Mail Order Houses
493 Warehousing and Storage
481-4 General Transportation
of which Air, rail, water, and truck transportation
491 Postal Service
492 Couriers and Messengers
For comparison:
31-33 Total manufacturing
Total supply chain sectors
Total U.S. economy
Note: Sectors of employment defined using the Occupational Employment
Statistics (OES) data from BLS from 2011-2016.

114 • Technological innovation, supply chain trade, and workers in a globalized world
FIGURE 5.8 Employment growth in U S supply chain sectors and overall economy, index, 2011 = 100
100
105
110
115
120
125
130
135
140
145
150
2011 2012 2013 2014 2015 2016
Warehousing and Storage
Nonstore Retailers
Couriers and Messengers
Total US economy
Total supply chain sectors
Specialty store retailers
Wholesale Electronic Markets and Agents and Brokers
General Merchandise Stores
Manufacturing
Miscellaneous Store Retailers
Merchant wholesalers
General Transportation
FIGURE 5.9 Absolute changes in U S employment, supply chain sectors, and transportation (2011-2016)
0
100,000
-100,000
200,000
300,000
400,000
500,000
600,000
700,000
800,000
900,000
1,000,000
Spec
ialty
store
retai
lers
Ware
hous
ing an
d Storag
e
Mer
chan
t who
lesale
rs
Gener
al M
erch
andise
Store
s
Gener
al Tr
ansp
ortatio
n
Nonsto
re R
etail
ers
Courier
s and
Mes
seng
ers
Who
lesale
Elec
tronic
Mark
ets
and A
gents
and B
roke
rs
Misc
ellan
eous
Store
Ret
ailer
s

Understanding Supply Chain 4.0 and its potential impact on global value chains • 115
FIGURE 5.10 Warehousing and storage – changes in employment in selected occupations (2011-2016)
0
20,000
40,000
60,000
80,000
100,000
120,000
140,000
160,000
180,000
200,000
0
5%
10%
15%
20%
25%
30%
35%
35%
Transportation and material
moving occupations
Office and administrative
support occupations
Production occupations
Management occupations
Installation maintenance,
and repair occupations
Sales and related
occupations
Business and financialoperations
occupations
Computer and
mathematicaloccupations
Gross change Percent change
FIGURE 5.11 Couriers and messengers – changes in employment in selected occupations (2011-2016)
-100,000
-50,000
0
50,000
100,000
150,000
200,000
-60%
-40%
-20%
0%
20%
40%
60%
Office and administrative
support occupations
Transportation and material
moving occupations
Management occupations
Computer and
mathematicaloccupations
Installation maintenance,
and repair occupations
Gross change Percent change

116 • Technological innovation, supply chain trade, and workers in a globalized world
FIGURE 5.12 Electronic shopping and mail order houses – changes in employment in selected occupations (2011-2016)
Gross change Percent change
0
5,000
10,000
15,000
20,000
25,000
30,000
35,000
40,000
0
20%
40%
60%
80%
100%
120%
Office and administrative
support occupations
Sales and related
occupations
Transportation and material
moving occupations
Management occupations
Computer and
mathematicaloccupations
Business and financialoperations
occupations
Production occupations
Healthcare practitioners and technical occupations
FIGURE 5.13 Specialty stores – changes in employment in selected occupations (2011-2016)
Gross change Percent change
-15,000
-10,000
-5,000
0
5,000
10,000
15,000
20,000
-50%
50%
0%
100%
150%
200%
250%
300%
Sales
and re
lated
occup
ations
Office a
nd ad
ministr
ative
support
occup
ations
Tran
sporta
tion a
nd m
ateria
l
moving o
ccup
ations
Instal
lation,
mainte
nanc
e,
and re
pair o
ccup
ations
Man
agem
ent o
ccup
ation
Produc
tion o
ccup
ation
Health
care
prac
titione
rs
and te
chnic
al occ
upati
ons
Busine
ss an
d finan
cial
operati
ons o
ccup
ations
Arts, d
esign,
ente
rtainm
ent,
sports
and m
edia
occup
ations
Computer
and m
athem
atica
l
occup
ations

Understanding Supply Chain 4.0 and its potential impact on global value chains • 117
It has been argued that 3-D printing works in this way. Accord-ing to one estimate it is expected that 3-D printing will disrupt between 4.6 percent and 14.9 percent of global trade flows (Arvis et al. 2017). By shortening GVCs, 3-D printing may eliminate the productivity benefits associated with international trade in manu-factured goods by reducing the need for unskilled labor-intensive tasks. On the other hand, 3-D printing has actually been associ-ated with increased trade in at least one sector – hearing aids – where the technology has been rapidly adopted (Freund, Mulab-dic and Ruta 2018).
The new digital technologies are driving a revolution in the way firms are shaping the organization of their production processes. For example, in 2016, Adidas opened a fully-automated shoe fac-tory using 3-D technology and robotics in Germany. The goal was to individualize its products and react more promptly to consumer needs by bringing manufacturing closer to its clients and speed-ing up delivery. The number of workers required in this factory is a fraction of the number of people working in emerging economies in the production of the same sportswear (Backer and Flaig 2017). Thus, this form of innovation may slow the growth of GVCs and increase the importance of skills development.
The reshoring of production by high-income countries could reduce demand for the products of manufacturing exporters and stifle the potential entry of newcomers into manufacturing GVCs (Hallward-Driemeier and Nayyar 2017). The higher and more spe-cific investments in advanced production technology are, the greater the possibility to integrate manufacturing operations at one focal plant, favoring reshoring (Dachs et al. 2017). A report by Citigroup and the University of Oxford’s Oxford Martin School finds that 70 percent of Citi institutional clients surveyed believe that automation will encourage companies to move their man-ufacturing closer to home, with North America having the most to gain from automation, followed by Europe and Japan. By con-trast, the authors estimated that China, Association of Southeast Asian Nations (ASEAN) member countries, and Latin America have the most to lose from automation (Citigroup 2016). Hence, the increased use of labor-saving technologies will change the patterns of comparative advantage of manufacturing in the global market.
On the other hand, developments in the technologies such as IoT, big data and cloud computing can strengthen the current structure of GVCs by reducing the costs of tracking and monitor-ing the components of production, thus lowering coordination and matching costs. A survey of 152 decision-makers in auto-motive, aerospace, electronics, and industrial equipment manu-facturing companies in Germany, France, and the U.S. finds that the biggest benefit of cloud computing is to reduce the cost of optimizing infrastructure (48.3 percent of respondents), followed closely by efficient collaboration across geographies (47.7 per-cent) and the ability to respond quickly to business demands (38.4 percent) (the Microsoft Discrete Manufacturing Cloud Computing Survey, Microsoft Corporation 2011).
The degree of adoption and diffusion of Supply Chain 4.0 processes is likely to vary across both firms and countries. As a result, in the medium run it could give rise both to more industrial
concentration in sectors where it is important, and to increased income inequality across countries. Countries with higher internet penetration, firms and countries with greater digital entrepreneurial skills, and firms which have mastered previous generations of supply management practices (such as the SCOR model of the 1990s) are likely to have advantages in adopting Supply Chain 4.0 methods.
Conversely, attempts by developing countries to promote entry into new manufacturing sectors, particularly using strategies promoting domestic firms with subsidies, incentives, and special zones, might not take into account whether key players in the supply chain are using the most advanced technologies, and thus be at a competitive disadvantage relative to strategies which successfully attract FDI from firms which have mastered Supply Chain 4.0.
Differences in the rate of diffusion and adoption of Supply Chain 4.0 may not necessarily have negative impacts for poverty alleviation or income growth of people with lower incomes in developing countries. It depends on how the gains from the new management practices are distributed along the supply chain. For example, in some cases the application of advanced supply man-agement practices to an agriculturally-based supply chain origi-nating in developing countries could enable additional steps of food processing in those countries, while in other cases they could lead to increased export of raw materials. In the case of increased export, whether farmers capture any of the gains may depend on whether improved (likely foreign) management of the overall supply chain induces farmers to produce higher-quality produce at higher prices, or to have higher rejection rates. The effects of Supply Chain 4.0 on poverty and shared prosperity are thus likely to be contingent on a variety of local circumstances.
Another potential impact of Supply Chain 4.0 relates to the interactions between firms and governments. Improved supply chain management can lead to increased traceability of goods and financial information. This could make it easier for firms engaged in international trade to satisfy rules of origin by providing a com-prehensive audit trail, and it could make it easier for governments to monitor some types of tax evasion.
6. Conclusion
It is dangerous to take a snapshot of recent history, whether of technologies, institutions, or economic trends, and project it very far in the future. Current developments in supply chains appear to be employment-generating, but this could reverse if developments in robotics advance in certain directions. The technology could evolve in entirely unpredictable ways. Or, more pessimistically, its diffusion could stall, limiting the application of Supply Chain 4.0 to already high-income countries and becom-ing another contributor to global income divergence, which may already be the case with Industry 4.0. Concerns about consumer privacy could easily cause governments to act to forestall some of the developments discussed here. For the present, though, jobs are being created in supply chains, and advances in supply chains are creating benefits for consumers. This can be taken as at least a small cause of optimism.

118 • Technological innovation, supply chain trade, and workers in a globalized world
Notes
1. Or, likely as not, in China, though this chapter does not attempt to
document that specifically.
2. Six principles of Industry 4.0 are: 1) Interoperability: the ability for
plant equipment (i.e., workpiece carriers, assembly stations and prod-
ucts), humans or smart factories to connect and communicate with
each other via the IoT and the Internet of Services; 2) Virtualization: a
virtual copy of the smart factory created by linking sensor data (from
monitoring physical processes) with virtual plant models and simula-
tion analytics; 3) Decentralization: the ability of cyber-physical systems
within smart factories to make decisions on their own; 4) Real-time
capability: the capability to collect and analyze data and provide the
derived insights immediately; 5) Service orientation: offering of ser-
vices (of cyber-physical systems, humans or smart factories) via the
Internet of Services; and 6) Modularity: flexible adaptation of smart
factories to changing requirements by replacing or expanding indi-
vidual models.
3. Available at: https://www.usatoday.com/story/money/2018/02/19/
kfc-chicken-shortage-u-k-restaurants-close-amid-delivery-mis-
haps/350698002/,February 19, 2018.
4. The term “Industry 4.0” is of German origin. It arises from the German
Government’s High Tech 2020 strategy, an initiative launched in
2011 and conducted through the Ministry of Education and Research
(BMBF) and the Ministry for Economic Affairs and Energy (BMWI)
(European Commission 2017). As popularized, Industry 4.0 refers to
the most recent in a sequence of “industrial revolutions” in historical
time (e.g. Hallward-Driemeyer and Nayyar 2018, 40-41).
5. The definition by analogy to Industry 4.0 corresponds to the most
common usage of “Supply Chain 4.0”, e.g. Alicke et al. 2016, Asthana
2018. To our knowledge, nobody has attempted to provide histori-
cally-based definitions of “Supply Chain 1.0,” “Supply Chain 2.0” or
“Supply Chain 3.0.”
6. A “smart factory” is a highly digitized and connected production facil-
ity of the type associated with Industry 4.0. The idea of a “smart fac-
tory” is still in its infancy and does not refer to a tightly standardized
specification of operations.
7. “Augmented reality” refers to a technology that superimposes a
computer-generated image on a user’s view of the real world, thus
providing a composite view. It includes as a subcategory “virtual real-
ity,” displays of information of a “3D” or “real” character mediated by
such hardware as special headsets or gloves.
8. “Artificial intelligence” (AI) refers to the theory and development of
computer systems able to perform tasks that normally require human
intelligence, such as visual perception, speech recognition, deci-
sion-making, and translation between languages. It is closely related
to the concept of “machine learning,” i.e. computer systems that
improve their performance with accumulated experience.
9. “Cloud computing” denotes the practice of using a network of
remote servers hosted on the Internet to store, manage, and process
data, rather than a local server or a personal computer.
10. Figures 5.5 and 5.6 portray a linear supply chain where goods are
moved from one location to another sequentially – a structure often
referred to as a “snake” supply chain. “Snakes” are contrasted with
“spider” supply chains, in which parts and components are brought
from dispersed locations to be assembled at a common location (cf.
Hiratsuka 2005). The concept of a supply chain control tower applies
equally well to “snake” and “spider” type supply chains. In a more
elaborate chain, in which some lead firm orders major assemblies
from Tier I suppliers, which in turn order sub-assemblies from Tier II
suppliers, and so on, the flow of material may resemble a combination
of “spiders” and “snakes”. In such a complex supply chain, it might
make sense for each Tier I supplier to have its own supply chain con-
trol tower, with information being further aggregated at the level of
the lead firm.
11. Not every development in robotics is complementary to human labor.
The development of prototype robots that can pick goods from
shelves could lead to robots that would easily replace some workers.
However, the dexterous movements of the human hand and arm have
proved difficult to replicate mechanically. This replicates the expe-
rience of the first Industrial Revolution, in which there was approx-
imately an 80-year gap between the development of mechanical
spinning and the invention of the sewing machine (which still needed
dexterous human labor). Gordon (2016) reports that in advanced
robotics competitions, robots still have difficulty opening doorknobs.
12. International organizations began developing record formats for EDI
as early as the 1960s (UN/CEFACT et al 2017). By the 1980s the use of
EDI for firm-to-firm transactions, both nationally and across borders,
was widespread.
13. The connection for EDI can either be a direct physical (hardwired)
connection, or implemented over the Internet, or, more recently, take
the form of a cloud-based solution.
14. According to Vrbová et al. (2016) in consignment stock the vendor,
instead of the buyer, is in charge of managing the buyer’s inventory
and triggering replenishment orders; in buffer stock the placement
takes place at a particular critical stage of supply chain; and in safety
stock it is stored in the final stage of the supply chain.
15. This paper will use the older term “warehouse” and the more modern
term “distribution center” interchangeably, as synonyms. Increas-
ing use of “distribution center” in place of “warehouse” is associ-
ated with the spread of more advanced techniques of supply chain
management.
16. Besides e-commerce, “non-store retailers” includes such firms as
direct sales (i.e. door-to-door or house parties) and vending machines.

Understanding Supply Chain 4.0 and its potential impact on global value chains • 119
References
Alicke, Knut, Jürgen Rachor, and Andreas Seyfert (2016), Supply Chain 4.0
– The Next-Generation Digital Supply Chain. McKinsey & Co. Supply
Chain Management Practice (June).
Arvis, Jean-Francois, Paul E. Kent, Ben Shepherd, and Rajiv Nair (2017),
Additive Manufacturing and the Diffusion of 3D Printing: Impact on
International Trade. Unpublished manuscript, World Bank, Washington,
DC.
Asthana, Rahul (2018), Making Sense of Supply Chain 4.0. https://www.
industryweek.com/supply-chain/making-sense-supply-chain-40
(November 2).
Bloom, Nicholas, Kalina Manova, John Van Reenen, Stephen Teng Sun,
and Zhihong Yu (2018), Managing Trade: Evidence from China and
the United States. National Bureau of Economics Working Paper No.
24718, June.
Ciera, Xavier, and William F. Maloney (2018), The Innovation Paradox:
Developing Country Capabilities and the Unrealized Promise of Techno-
logical Catch-Up. Washington, DC: World Bank.
Citigroup (2016), Technology at Work v2.0: The Future Is Not What It Used
to Be. Citi GPS: Global Perspectives & Solutions, Joint Report with
Oxford Martin School.
CGI (2017), Industry 4.0: Making Your Business More Competitive. CGI
Group Inc.
Dachs, Bernhard, Steffen Kinkel, and Angela Jäger (2017), Bringing it All
Back Home? Backshoring of Manufacturing Activities and the Adoption
of Industry 4.0 Technologies.
De Backer, Koen, and Dorothee Flaig (2017). The Future of Global Value
Chains.
Freund, Caroline, Alen Mulabdic (2018), Is 3-D Printing A Threat to Global
Trade? The Trade Affects You Didn’t Hear About. World Bank. Prelimi-
nary: processed.
Freeman, Christopher and Luc Soete (1997), The Economics of Industrial
Organization. 3rd Edition, London and New York: Routledge.
Garbee, Elizabeth (2016), This Is Not the Fourth Industrial Revolution. Slate.
com, January 29, http://www.slate.com/articles/technology/future_
tense/2016/01/the_world_economic_forum_is_wrong_this_isn_t_the_
fourth_industrial_revolution.html
Gereffi, Gary, John Humphrey, and Timothy Sturgeon (2005), The Gover-
nance of Global Value Chains. Review of International Political Econ-
omy. 12(1), pp.78-104.
Gregory, Jonathan (2015), The Internet of Things: Revolutionizing the Retail
Industry. AccentureStrategy.
Gordon, Robert J. (2017), The Rise and Fall of American Growth: The U.S.
Standard of Living Since the Civil War (The Princeton Economic History
of the Western World). Princeton: Princeton University Press.
Hackius, Niels, and Petersen, Moritz (2017), Blockchain in Logistics and
Supply Chain: Trick or Treat?. In Proceedings of the Hamburg Interna-
tional Conference of Logistics (HICL), pp. 3-18, epubli.
Hallward-Driemeier, Mary, and Gaurav Nayyar (2017). Trouble in the
Making? The Future of Manufacturing-Led Development. Washington,
DC: World Bank.
Hiratsuka, Daisuke (2013), Vertical Intra-Regional Production Networks in
East Asia: A Case Study of Hard Disk Drive Industry. IDE Working Paper.
Lambert, Douglas M. (2008) Supply Chain Management: Processes, Part-
nerships, Performance. 3rd Edition. Sarasota, Florida: Supply Chain
Management Institute.
Mandel, Michael (2017). How Ecommerce Creates Jobs and Reduces
Income Inequality. Washington, DC: Progressive Policy Institute,
September.
Manyika, James, Michael Chui, Peter Bisson, Jonathan Woetzel, Richard
Dobbs, JacquesBughin, and Dan Aharon (2015), The Internet of Things:
Mapping the Value Beyond the Hype. McKinsey Global Institute 3.
Microsoft Corporation (2011), Digital Infrastructure, Cloud Computing
Transforming Fragmented Manufacturing Industry Value Chain Accord-
ing to Microsoft Study. Hannover, Germany. https:// news.microsoft.
com/2011/04/03/digital-infrastructure-cloud-computing-transform-
ing-fragmented-manufacturing-industry-value-chain-according-to-mi-
crosoft-study/.
Niforos, Marina, Vijaya Ramachandran and Thomas Rehermann (2017),
Blockchain: Opportunities for Private Enterprise in Emerging Markets.
Washington, DC: International Finance Corporation, World Bank Group.
Petersen, Moritz, Niels Hackius, and Birgit von See (2017), Mapping the
Sea of Opportunities: Blockchain in Supply Chain and Logistics. Work-
ing Paper.
Pfohl, Hans-Christian, Burak Yahsi and Tamer Kurnaz (2017), The Impact of
Industry 4.0 on the Supply Chain. Proceedings of the Hamburg Interna-
tional Conference of Logistics (HICL) – 20.
PWC (2016a), Industry 4.0: Building the Digital Enterprise. PriceWater-
houseCoopers LLP.
PWC (2016b), Industry 4.0; How Digitization Makes the Supply Chain More
Efficient, Agile, and Customer-Focused. PriceWaterhouseCooper LLP.
Rugaber, Christopher S. (2017), Robots and Automation Likely to Create
More Jobs in E-Commerce. Associated Press, reprinted in Inc. Brand
View, October 30.
Spence, Mike (2018), Jobs, Digital Technology and Structural change, GVC
Conference. Beijing, March 2018.
UN/CEFACT – ITDP (United Nations Centre for Trade Facilitation and Elec-
tronic Business) and World Economic Forum (2017), Paperless Trading:
How Does It impact The Trade System?. UN/CEFACT – ITPD/Paperless
Trade – Po051, Final Draft.
USITC (2011), The Economic Effects of Significant U.S. Import Restraints.
Seventh Update 2011. Special Topic: Global Supply Chain. Publication
4253. Washington, DC: U.S. International Trade Commission.
Vrbová, Petra, Jiří Alina and Václav Cempirek (2016), Usage of EDI (Elec-
tronic Data Interchange) in the Czech Republic. Paper for the 10th Inter-
national Days of Statistics and Economics, Prague, September 8-10.
Weernink, Marissa Oude, Willem van den Engh, Mattia Fransisconi and
Frida Thorborg (2017), The Blockchain Potential for Port Logistics.


121
CHAPTER 6
The digital economy, GVCs and SMEsBy Emmanuelle Ganne (WTO) and Kathryn Lundquist (WTO)
ABSTRACT
Although small and medium-sized enterprises (SMEs) repre-sent the vast majority of firms worldwide, their participation in international trade remains limited relative to their share of overall economic activity and employment as compared to large firms. The rise of the digital economy could, however, open a range of new opportunities for small firms to play a more active role in global value chains (GVCs). This chapter reviews evidence of SME participation in international trade and production networks and looks at how the digitalization of our economies is already affecting, or could affect future, SME contributions to GVCs. New research by Lanz et al. (2018) finds evidence that digitally-connected SMEs in devel-oping countries tend to import a higher share of their inputs than non-digitally-connected firms. Additionally, it is shown
that this positive digital effect is greater for SMEs than it is for large firms. The chapter reviews the various opportuni-ties that the digital economy opens for SMEs, especially in terms of cost reductions and the emergence of new busi-ness models, but also discusses policy measures that could be taken to promote SME participation in GVCs. Indeed, sig-nificant challenges remain for SMEs to enter GVCs, some of which are exacerbated by the new digital economy. A holis-tic approach that combines investment in ICT infrastructure and human capital with trade policy measures and measures to improve the business environment, access to finance and logistics, and promote innovation and R&D is necessary. Improving the availability of data would also help to better understand and integrate SMEs in GVCs.
• Although small and medium-sized enterprises (SMEs) represent the vast majority of firms worldwide, their participation in international trade remains limited relative to their share of overall economic activity and employment as compared to large firms.
• The rise of the digital economy could, however, open a range of new opportunities for small firms to play a more active role in global value chains (GVCs).
• New research finds that when a manufacturing SME has a website, this facilitates its participation in GVCs and trade. In particular, such SMEs are more likely to use foreign inputs for production and export their output. Further, information and communication technology (ICT) connectivity is found to be more important for small firms than for large ones in whether or not a firm participates in trade.
• However, SMEs continue to face important challenges when integrating into GVCs. A holistic approach that combines investment in ICT infrastructure and human capital with trade policy measures and with measures to improve the business environment and access to finance and logistics, and promote innovation and R&D, is necessary.
• Improving the availability of data would also help to better understand and integrate SMEs in GVCs.
122 • Technological innovation, supply chain trade, and workers in a globalized world
1. Introduction
Global value chains (GVCs) are often considered the lead story of trade in the modern world, with an estimated 80 per cent of global trade taking place through them (UNCTAD, 2013). At the same time,
a growing understanding of the importance of small and medi-um-sized enterprises (SMEs) to the global economy, and their roles within the digital economy, has been emerging. However, SMEs have been shown to participate less in international trade, including GVC trade, than large businesses despite being the largest firm segment by numbers in the world. Given the sub-stantial changes that the internet and digital technologies that leverage the internet to store and process data (sometimes referred to as Industry 4.0) have made or are making to the global economy, the following questions arise: how has the digi-tal economy changed the landscape for SMEs? What are the new opportunities and challenges they face when it comes to partici-pating in GVCs in the digital era? And what policy changes could be made to support these firms?
SMEs are estimated to account for between 80-99 per cent of firms in any given country as well as between 60-70 per cent of global employment (WTO, 2016; IFC, 2013). They also have a higher rate of sales growth than large firms (Cusolito et al., 2016). This implies a substantial share of any nation’s economy is sup-ported by SMEs. However, a more precise estimate of SMEs’ con-tribution to GDP is hampered by the lack of a standard definition for what, exactly, constitutes an SME. Definitions for small firms range from those solely based on number of employees and rev-enue generated (the European Union defines SMEs as firms with up to 250 employees and turnover of no more than 50 million euros), to one dependent on the industry of operation (in China, SMEs can include firms of up to 3,000 employees and total rev-enues up to 300 million yen, depending on the industry).1 These differences in definition make certain comparisons more chal-lenging and must be considered when drawing conclusions.
Regardless of the nebulous way SMEs are defined, they are not well represented in international trade and GVCs (WTO, 2016). This is in spite of the fact that the international fragmen-tation of production would seem to have increased the oppor-tunities for SMEs, given that production is broken into smaller, more specialized pieces. Yet SMEs face a number of size-related constraints, from limitations related to quantity of production, to in-house administrative resources, that prevent many of them from achieving the full potential of GVC participation (Cusolito et al., 2016).
Given the positive effects GVCs have been shown to bring, it is worth considering how to include more small firms in global production networks. For example, participation in GVCs is asso-ciated with increased productivity, the export of more sophisti-cated (and frequently higher value) products, and a more diver-sified national export basket. Additionally, GVCs have been demonstrated to be a pathway for economic development for countries (Kowalski et al., 2015).
The internet and digital technologies that leverage the inter-net to collect, store and process data, such as artificial intelli-gence (AI), the Internet of Things (IOT) and blockchain, open new opportunities for SMEs, not only for market entry, but also for participation in GVCs and international trade (WTO, 2018). This is particularly true in the services sector where SMEs are most likely to engage in trade (ABAC, 2018).
Given the pervasiveness of SMEs throughout the global econ-omy, the substantial role of GVCs for international trade and the changes ICT is bringing through the new digital economy, further consideration ought to be given to how digital technology could be altering SME GVC participation. Firms of all sizes inherently seek to maximize profits, be it through the use of digital tech-nology or sales via international exports. Given the potential for digital technology to reduce fixed trade costs, it is import-ant to understand how technological change affects SME deci-sion-making with regards to both imports and exports. This chap-ter explores SME participation, and lack thereof, in international trade, including GVCs; discusses how digital technologies can help SMEs integrate into GVCs; considers the various constraints that restrict SMEs’ ability to embrace new technologies and par-ticipate in global production networks; investigates how the digi-tal economy has re-shaped international trade for SMEs as well as its potential effects on SMEs in GVCs; and lastly looks into ways the policy environment could be changed to better support SME access to GVCs in the context of the digital economy.
2. SME participation in international trade and GVCs
In theory, global value chains open new prospects for SMEs to participate in international trade. The international fragmenta-tion of production increases the opportunities for SMEs to spe-cialize in niche markets and narrow activities at various stages of the production chain. Nevertheless, in spite of the key economic role played by SMEs in terms of economic output, participation of SMEs in global value chains remains low compared to that of large firms.
2.1 SMEs, international trade and GVCs: direct vs. indirect participationSMEs can join global value chains by exporting intermediate goods or services directly (direct forward participation) or by sup-plying inputs to a local firm or multinational company – indirect exports (indirect forward participation). These forms of integra-tion into GVCs are not necessarily exclusive. Some SMEs export both directly and indirectly, highlighting the potential comple-mentarity of these foreign market entry modes (Nguyen et al., 2012). SMEs can also participate in GVCs by importing products as inputs into their own production processes (direct backward participation) or sourcing products from local firms that use imported inputs (see Figure 6.1).2 Forward linkages represent the seller’s perspective, or supply side, while backward linkages rep-resent the buyer’s perspective, or sourcing side, of GVCs.

The digital economy, GVCs and SMEs • 123
The extent to which SMEs participate in GVCs is, however, dif-ficult to assess thoroughly. The availability of international trade data by enterprise size remains limited, making analysis rather difficult and often partial. Most studies rely on a mix of enter-prise surveys, case studies, and administrative data, with all the compromises that such approaches entail in terms of incomplete country coverage, different time series, inconsistent definitions
of SMEs, etc. In addition, while GVC trade is usually understood as trade in intermediates, available data sets do not necessarily distinguish between direct exports of final products and direct exports of intermediates. An analysis of data on gross direct exports can, however, provide some indication of SME forward participation in global value chains as such exports, which cover both final and intermediate products, necessarily represent an upper bound.
Keeping these limitations in mind, firm-level evidence reveals that despite SMEs making up the vast majority of firms in both developed and developing countries, SME direct and indirect participation in GVCs remains limited relative to their share of overall activity and employment compared to large firms.
Direct participation in GVCs: a “big firm story”?While in most OECD economies SMEs account for 99 per
cent of all firms, around two-thirds of total employment and over half of business sector value-added, their contribution to over-all exports is much lower than their economic weight in terms of value creation and employment, with only a handful of excep-tions (OECD, 2018c) (see Figure 6.2). In countries such as France, Germany, Slovakia and Sweden, SMEs account for only 30 to 40 per cent of gross exports, well below their contribution to value creation and employment. Not only is SME participation in direct exports low compared to their economic weight, only a fraction of SMEs export at all. This is a distinct difference between large and small firms, given that the majority of large businesses are also international exporters. Evidence from OECD countries shows that only 5 to 40 per cent of SMEs export, while more
FIGURE 6.1 How SMEs can benefit from GVCs
Direct or indirect forward participation
Direct or indirect backward participation
= direct imports of inputsor indirect imports througha domestic firm
Wider access to:• more sophisticated and competitively priced imports• new technologies• inputs that may not be accessible domestically
= direct exports of intermediateproducts or indirect exportsthrough a domestic firm
Possibility to focus onspecific segments of theproduction chain (no needto master the entireproduction process).
Tech transfers from lead firms
Source: Adapted from López González (2017).
FIGURE 6.2 SME export activity, value added and employment shares (2015 or latest available year, as a percentage)(Percentage)
MEX
KORFR
ADEU IRL
SVK
FINSWE
GBRROU
POLHUN
BGRAUT
GRC ISR ESPDNK ITA CZE TU
RHRV
PRTNOR
SVN
LTU
BELEST LU
XNLD LV
ACHE ISL
0
10
20
30
40
50
60
70
80
90
100
% of exports % of value added % of business employment
Source: Figure 1.20 of OECD (2018c).

124 • Technological innovation, supply chain trade, and workers in a globalized world
than 80 per cent of large firms do (see Figure 6.3). Other studies confirm these numbers. Mayer and Ottaviano (2007) showed, for example, that 1, 5, and 10 per cent of companies account for no less than 40, 70, and 80 per cent, respectively, of Europe’s aggre-gate exports. These numbers would tend to support the view that direct insertion into GVCs via exports is “a big firm story” (Cusolito et al., 2016).
However, these numbers hide considerable heterogene-ity across firm size classes. The smaller the company, the less export-oriented it is (see Figure 6.4). Only a marginal number of micro companies export, while the participation of medium-sized companies in exports and imports approaches that of large busi-nesses. Participation in exports remains, to a large extent, a big firm story in developed economies, except in some niche markets.3
The situation is not much different in developing economies, with rough estimates of SME contribution to GDP significantly larger than their relative contribution to international trade, and estimates of SME contribution to international trade being only a fraction of large firms’ contribution. SMEs in developing countries are thought to provide about 45 per cent on average of a coun-try’s GDP (WTO, 2016), but SMEs’ exports represent on average just 7.6 per cent of total manufacturing sales, compared to 14.1 per cent in the case of large manufacturing firms (WTO, 2016).4 Recent World Bank micro firm surveys in selected least developed coun-tries (LDCs) confirm the low level of participation of micro firms (i.e., firms of less than five employees) in international trade. Micro firms engaged in exports represented only 6 per cent of surveyed firms in Congo in 2013, around 3 per cent in Ethiopia (2011 data), and less than one per cent in Myanmar (2014 data).
SMEs’ contribution to GDP and exports also varies signifi-cantly across developing regions. Although SME contribution to GDP is estimated to be relatively high throughout the world,
ranging from an estimated 22 per cent in the Middle East to 70 per cent in some African countries (ITC, 2015a), SMEs’ exports are significantly less. For example, SME exports account for 28 per cent of overall exports in developing Europe, 16 per cent in the Middle East, 8.7 per cent in developing Asia, and only 3 per cent in Africa. As in the case of developed economies, big firms account for the bulk of exports. Cebeci et al. (2012) find that the top 5 per cent of firms account, on average, for 80 per cent of exports in low-income countries.
However, while GVC direct participation would seem to be above all a big firm story when considering gross exports, studies that examine exports of intermediates seem to show a more nuanced picture. Evidence from Southeast Asia reveals, for example, that SME exports of intermediates in Thailand represent a bigger share of their overall exports than for large firms – 16 per cent of SME exports are sold to firms abroad for further processing, while only 6 per cent of large firms’ exports are (López González, 2017). This finding reflects the opportuni-ties that global value chains open for SMEs to integrate into the global economy by specializing in segments of production and supply of intermediates, rather than having to master the entire production process of finished products. Opportunities in this respect might be even bigger in the services sector. In Viet Nam, for example, the share of SME exports used by other countries to produce other exports increases from 5 per cent when only man-ufacturing is considered, to 26 per cent when service firms are included (López González, 2017). While these numbers cannot be generalized, they provide an interesting new perspective on SME GVC participation in Southeast Asia.
Another way for SMEs to benefit from GVCs is through imports of intermediate goods (backward participation), which matter for competitiveness (Lopez-Gonzalez, 2016 and 2017). It
FIGURE 6.3 Industrial firms engaged in exports (2015 or latest available year, as a percentage of total firm size by size class)
EST DEUDNK
LUX
AUTCAN
SVN BEL
LVA
PRT
NLD ITA USA GBRNOR
ESP POLFIN BGR
SWE
HUN IRLLT
UROU
HRVSV
KFR
AGRC
CZE
SMEs Large enterprises
0
10
20
30
40
50
60
70
80
90
100
Source: Figure 1.21 of OECD (2018c).

The digital economy, GVCs and SMEs • 125
has been shown that firms that use more imported products are more productive as they can draw on cheaper and more sophis-ticated inputs as well as benefit from innovation and new tech-nologies embodied in imports (Bas and Strauss-Kahn, 2014 and 2015). According to WTO estimates, GVC participation by SMEs in the manufacturing sector in developing countries is mainly driven by upstream links (backward participation), with SMEs importing inputs needed in their manufacturing process from abroad (Lanz et al., 2018; WTO, 2016). This is particularly true in countries where companies engage extensively in processing trade. Processing trade allows a firm to conduct intermediate stages of production and assembly on behalf of a foreign party. The firm receives the blueprints and imports all, or part of, the raw and auxiliary materials, parts and components, accessories, and packaging materials from abroad, and re-exports the fin-ished products after processing or assembly. Engaging in pro-cessing trade requires less technological know-how and working capital needs – although it may require having certain automated processes in place to ensure quality control and supply reliability, which may or may not be borne by the foreign party. Evidence from China shows that processing trade allows less productive and financially constrained firms to participate in GVCs when they would not have been able to otherwise (Manova and Yu, 2016). Such firms tend to be SMEs.
Among the factors often put forward to explain why SMEs’ direct participation in GVCs is lower compared to that of large firms is the fact that engaging in international markets can be costly. Lacking economies of scale, SMEs face higher fixed costs than larger companies and are disproportionately affected by costs associated with the import and export process (WTO,
2016). A simpler route for SMEs to engage in GVCs is often to start by exporting indirectly, through a local firm.
2.2 Indirect participation in GVCsSmaller firms often participate in global value chains indirectly by supplying intermediates to other local firms – domestic or foreign-owned – that export (indirect forward participation). The enterprise then behaves like an “indirect exporter” by con-tributing to the production of goods and services exported by other domestic companies. Likewise, the fixed costs associated with direct importing may lead many SMEs to source inputs from local enterprises that use imported products (indirect backward participation). Evidence on indirect participation of SMEs in GVCs is scarce and difficult to collect due to lack of data on value-added at the firm level. Only a few studies have examined SME indirect participation in GVCs, either as suppli-ers (forward participation) or as importers of inputs (backward participation).
Studies that analyze the role of SMEs as suppliers reveal that focusing only on direct exports significantly underesti-mates the role played by SMEs in GVCs. In an often-quoted study, Slaughter (2013) showed, for example, that US multina-tional companies typically purchase more than US$3 billion in inputs a year from more than 6,000 U.S. SMEs, which rep-resents almost 25 per cent of the total inputs purchased by those firms. Other estimates from the US International Trade Commission (USITC) (2010) find that in 2007 the export share of US SMEs rose from 28 per cent (in gross exports) to more than 40 per cent (in value-added terms) when indirect exports were considered. Calculations using the TiVA database
FIGURE 6.4 Percentage of industrial firms that are exporting and importing by enterprise size (number of employees), 2013 or latest year
17
9
38
58
66
20
12
40
62
70
0
10
20
30
40
50
60
70
80
Total 0-9 10-49 50-249 250+
Exports Imports
Source: WTO (2016).

126 • Technological innovation, supply chain trade, and workers in a globalized world
developed by the OECD and the World Trade Organization show that including the contribution of upstream SME suppli-ers significantly increases the share of SMEs in total exports of domestic value added. In the Slovak Republic, for example, SMEs account for only 34 per cent of gross domestic exports, but for 56 per cent of the total value added in the country’s exports when upstream suppliers are considered (OECD, 2018c) (see Figure 6.5).
Indirect exports of SMEs are particularly significant in sec-tors where GVCs play an important role and where scale matters, such as in the automobile and transport equipment manufacturing sector (OECD, 2018b; WTO, 2016), and for inde-pendent SMEs (i.e., those not owned by a larger domestic firm or foreign firm – OECD, 2018c). Evidence shows that SMEs tend to channel their indirect exports through large firms rather than through other SMEs (Cusolito et al., 2016).
While evidence based on indirect exports shows a higher level of integration of SMEs in GVCs in OECD countries, indi-rect exports appear to play a lesser role in developing coun-tries. Using data from World Bank Enterprise Surveys, the WTO estimated that indirect exports of manufacturing SMEs from developing countries were 2.4 per cent of total sales on aver-age, or one-third the estimated share of direct exports. Such results, however, hide significant differences across regions, within regions, and at the product level. While SME indirect participation in exports is estimated at more than 9 per cent of total sales in developing Europe, it accounts for 2.4 per cent in the Middle East and only 1 per cent in Africa (WTO, 2016). At the country level, a recent study carried out in Chile reveals that three times as many SMEs engage in indirect exports compared
to direct exports (6.5 per cent vs 2.2 per cent). However, despite there being more SMEs that engage in indirect exports, overall SME participation in GVCs is small and they remain largely dom-inated by large companies. In the case of Chile, the gap is strik-ing: more than 46 per cent of large companies engage in direct exports, while only 9 per cent of SMEs export, including both direct and indirect exports. The situation at the product level varies, however. Indeed, the share of indirect exports of SMEs in total sales outpaces that of large firms in some specific sectors, such as certain types of machinery, publishing and printing, and in paper and paper products manufacturing (WTO, 2016). Ser-vices SMEs were also found to participate more in indirect exports than direct exports. Overall, however, backward and forward GVC participation of SMEs in developing countries remains low (see Figure 6.6).
The role played by indirect forward participation of SMEs, espe-cially in developed countries, would tend to suggest that indirect participation serves to a certain extent as a substitute for direct participation in GVCs. The question then arises as to whether such indirect participation benefits firms and impacts their performance in the same way as direct participation. Assessing the relative impact of direct versus indirect participation on firms’ performance is an issue that requires further attention from researchers. Like-wise, studies that distinguish between direct and indirect partici-pation usually focus on exports. It would be equally interesting to examine SMEs’ participation in GVCs through indirect backward participation. Indeed, like in the case of direct exports, the high fixed costs associated with direct imports may lead many SMEs to source inputs from local companies that use imported intermedi-ates rather than to import directly.
FIGURE 6.5 Direct and indirect exporting activity of SMEs in OECD countries, 2014As a percentage of gross export
SMEs' share in gross exports SMEs' share in value added exports
0%
10%
20%
30%
40%
50%
60%
70%
AUT BEL CZE DEU DNK ESP FIN FRA GBR HUN ITA MEX NLD POL PRT ROU SVK SVN SWE TUR USA
Source: OECD (2018a).

The digital economy, GVCs and SMEs • 127
2.3 Constraints on SME participation in global value chainsTwo key challenges persist in limiting SME GVC integration: the challenge of informality5 and the relative resource advantage that large firms have over SMEs.
Global value chains operate in the formal sector, but it is esti-mated that around 80 to 90 per cent of SMEs worldwide are infor-mal (IFC, 2012). Informality is pervasive in the developing world. The majority of firms in many developing countries are informal (Andrade et al. 2015; Bruhn and McKenzie 2014; Cusolito et al. 2016). In Brazil, for example, nearly two-thirds of businesses, 40 per cent of GDP and 35 per cent of employees are informal (Ulys-seay, 2015). Similarly, in Sri Lanka only one-fifth of firms operat-ing without paid workers are registered and even among firms employing paid workers, more than half are unregistered with one or more pertinent agencies (de Mel, McKenzie, and Wood-ruff 2013). Overall, the ILO estimates that the informal economy comprises more than half of the global labor force (ILO web-site6), with most informal workers in developing countries being women.7 Informal firms tend to be much smaller than formal firms (La Porta and Shleifer, 2014). In fact, the large majority of infor-mal firms – up to 90 per cent in Sri Lanka for example – are small, subsistence enterprises with no paid employees.
Various factors have been found to play a determining role in explaining the size of the informal sector, including the tax burden (e.g. Cebula, 1997; Giles and Tedds, 2002); financial market development (Straub, 2005); and institutional quality, regulatory burden and quality of the legal system (Friedman et al., 2000; Johnson et al. 2000; Botero et al., 2004; Dabla-Norris et al., 2005).
High levels of informality can affect growth and productiv-ity of a country and hold back inclusion into GVCs. Informality can generate inefficiencies in the production process, as infor-mal firms may choose to limit their growth to avoid detection (Farazi, 2014) and tend to use less advanced production technol-ogies (Perry et al., 2007). Corruption is also often a side-effect of informality, and even where it is not, recent work looking at Chinese firms has shown corruption to have a larger negative impact on the productivity of SMEs than on the productivity of large firms (Lu et al., 2018). Informal firms also face greater diffi-culties accessing finance, which can result in sub-optimal levels of investment in research and development, physical capital, and training (Farazi, 2014). Informality is a binding constraint to integrating into global value chains, but it is also a constraint for firms operating in the formal sector. A study by the Independent
FIGURE 6.6 SMEs in developing economies: backward and forward participation in GVCs
0 10 20 30 40 50
Use of foreign inputs in manufacturing (backward participation)
Dire
ct a
nd in
dire
ct e
xpor
ts (F
orw
ard
part
icip
atio
n)
60 70 80 90 1000
10
20
30
40
50
60
70
80
90
100
Hig
h G
VCpa
rtic
ipat
ion
Hig
h ba
ckw
ard
GVC
part
icip
atio
n
Hig
h fo
rwar
d G
VCpa
rtic
ipat
ion
Low
GVC
part
icip
atio
n
Note: Each square represents the average GVC participation of SMEs in a given developing country.
Source: WTO estimates based on World Bank Enterprise Surveys (Figure B.19 of WTO (2016)).

128 • Technological innovation, supply chain trade, and workers in a globalized world
Evaluation Group, a World Bank institution, finds that about 32 per cent of formal firms with 10–99 employees in a sample of develop-ing countries report informality as one of the top five constraints they face in doing business (cited in Cusolito et al., 2016).
Other factors commonly cited to explain the difficulties faced by SMEs, in particular those from developing countries, to integrate in global value chains range from limited resources and access to finance, to the difficulty some SMEs face in meeting product and quality standards. Noted constraints that affect SMEs include lack of knowledge about foreign markets as well as missing in-house skills such as marketing; insufficient knowledge of cumbersome trade regulations and border procedures; and poor physical and ICT infrastructure that limits distribution and operational support (ADB, 2015; Cusolito et al., 2016; ITC, 2015b; WTO, 2016).
Can the rise of technologies based on the internet and the remodeling of economic activity that accompanies it open new opportunities for smaller firms to more actively participate in global production networks? Can the digital economy help small traders integrate into global value chains? Evidence suggests that the potential could be significant.
3. Digital technologies can boost SME trade and GVC participation
Digital technologies continue to make substantial changes to the economy with cascading implications for international trade. For small firms, the internet has increased access to international markets, with the WTO finding that on average 97 per cent of internet-enabled small businesses export (WTO, 2016). Compa-nies also acknowledge the importance of new internet-enabled technologies. For example, a study of 600 European SMEs found that more than 70 per cent of those surveyed not only consider that they benefit from the ongoing process of digitalization, but also that digitalization makes it easier to integrate foreign cus-tomers and suppliers into their own value chains (Abel-Koch, 2016). Additionally, a joint OECD and World Bank study (Cusolito et al., 2016) finds that the use of the internet reduces SME export-ing costs, thereby increasing export participation, and that SMEs are more likely to be involved in technologically-enabled trade than traditional trade. At the same time, there are also many factors limiting SME participation in GVCs in the context of the digital economy. For example, it has become clear that internet access is now often a requirement for joining many GVCs (ADB, 2015) and that the ICT level of operation is one of the key attri-butes that multinational corporations assess when they want to enter a business relationship with SMEs (APEC, 2014). However, few studies have looked directly at the impact the new digital-ly-based economy is having on SME participation in GVCs.
3.1 The impact of digital connectivity on SME GVC participationRecent work by Lanz et al. (2018) has looked more closely into the differences between ICT-enabled SMEs and large firms in devel-oping countries with regards to trade, as well as the relationship of
being digitally connected with GVC participation. Evidence backs the theory that these digital changes can support SME participa-tion in GVCs, particularly import-based (backward-linked) GVCs. This is an important insight given that limited SME participation in GVCs continues to restrain participation in international trade. However, the importance of the divide between firms with access to the internet and those without is underscored by this research.
Using World Bank Enterprise Survey data, the authors demon-strate that, for firms, having a website (a proxy for being ICT-en-abled) in a developing country has a larger predicted impact on both an SME’s share of imported inputs for production and on an SME’s share of direct exports, than it does for large firms. An ICT-enabled small firm of 2 employees would have a predicted share of imported inputs that is 10 percentage points higher than a firm of the same size that is not ICT-enabled. Similarly, a firm of 12 employees would have a predicted share 8 percentage points higher. This is significantly greater than the estimated dif-ference for larger firms. In the case of firms of 50 employees, the predicted effect of being ICT-enabled on the share of imported inputs, versus for firms that are not connected, is only 5 percent-age points and for firms of 100 employees it is only 3 percent-age points (see Figure 6.7). For total exports, the effect of being ICT-enabled is highest for firms with between 15 and 25 employ-ees, with a steep decline as the number of employees grows (see Figure 6.8). In both cases, being ICT-enabled shows a stronger result for SMEs’ participation in trade than for large firms, mean-ing the impact of being digitally-enabled is significantly greater for small firms than for large ones. This is in line with evidence that small businesses with a website were almost four times more likely to export than those without (Oxford Economics, 2017).
The study also considers country-level digital connectivity and its effects on participation in trade by firm size. Using the number of fixed broadband subscriptions in a country to proxy digital con-nectedness, the paper again demonstrates that for developing countries, increased digital connectivity seems to increase small firms’ share of imported inputs used for production more than for large firms. Or, in other words, a small firm’s participation in back-ward-linked GVCs will benefit more than a large firm’s if a country has better digital connectivity. Similarly, for total exports, the find-ings suggest that more broadband subscriptions at the country level leads to a greater positive effect on SME exports than for large firms. These findings imply that large firms have established other non-ICT enabled means of communication with overseas suppliers and customers, such as analogue telephones or in-per-son traveling, that might not be so easily available to SMEs.
3.2 How can digital technology support SME trade?There are many reasons why access to digital technologies can increase SMEs’ participation in trade. Internet access can reduce barriers and costs to trade for all firms (but especially for ser-vices SMEs (Cusolito et al., 2016)) as well as increase access to foreign markets through online sales and e-commerce. The rise of smartphones has also allowed leapfrogging of some capital- and/or infrastructure-intensive technology, especially by firms in developing countries. Additionally, the digital economy itself

The digital economy, GVCs and SMEs • 129
is creating new opportunities by increasing the number of par-ticipants in international trade, as well as creating new business models that affect the structure of supply chains, including being “born global.” For example, there are new services on offer, including programming or logistics, that require only the neces-sary technical skills and being ICT-enabled (ITC, 2015a). Online sales are also making smaller “just-in-time” purchases more common than large advanced orders, a development that could benefit SMEs (AliResearch, 2017). Only SMEs with resources and managers willing to adopt these new technologies are in the posi-tion to take advantage of these opportunities (ITC, 2015a). All of these topics will be explored further in this section.
Cost-reducing properties of digital technologyEntering international markets is difficult and costly, dispropor-tionally affecting small firms that face a host of constraints as discussed earlier, including higher relative fixed costs than larger companies, insufficient R&D and skills training, and insufficient knowledge of foreign markets and regulations. However, digital technologies can ease a number of these constraints and reduce SME expenditures in a range of areas, from market research to operational support (see Figure 6.9). New websites and digital processing tools can bring services to SMEs that were formerly unaffordable. The following will look more closely at the ways dig-ital technology supports SMEs.
In terms of market research and general marketing, the inter-net provides access to a wide variety of information, including information related to potential consumers or national regulatory compliance and how to trade across borders. Online marketing has also been shown to be important for SMEs, with digital access reducing estimated marketing costs by 57 per cent according
to AMTC (2018). Online reviews can also be a powerful tool to attract potential customers from anywhere in the world (Oxford Economics, 2017) and new adwords, or other targeted advertis-ing, can help firms with limited resources reach new consumers (AMTC, 2018). In fact, marketing for both SME manufacturing and services firms is projected to have the largest savings in export related costs in a digital environment (AMTC, 2018).
Additionally, online and mobile banking or finance (which may even be provided through e-commerce platforms), as well as new financing tools like online crowdfunding, can supplement tradi-tional finance for SMEs. For example, services such as Alibaba’s e-Credit Line, or IndiaMart’s Payment Protection insurance, can be important trade finance resources for small companies. Block-chain could also open new opportunities for SMEs to access trade finance by making it easier for small companies to build a credit history as well as by opening up the possibility for small firms and producers to make transactions on a peer-to-peer basis without the need to secure traditional trade finance or even to go through banks (Ganne, 2018).
Besides reducing financial costs, online access to information also has significant time saving benefits by reducing the need for some in-person interactions, such as with banking. This has been shown to save SMEs up to 29 per cent of the time previously required (AMTC, 2018). Related to time saving, regional SME net-working platforms have also been created to bring information together in one place and to facilitate networking among SME suppliers (see Box 6.1). To expand these benefits, the World SME Forum has proposed plans to create eWSF,8 a global equivalent to regional networks such as ConnectAmericas. This can result in significant savings related to export activities and benefit SMEs in the international market.
FIGURE 6.7 Effect of being ICT-enabled on the predicted share of imported inputs for production
Pred
icte
d ef
fect
on
the
shar
e of
impo
rted
inpu
ts
Number of employees2
0
5%
10%
15%
12 50 100
Note: Figure marks represent the estimated range for the predicted effect of
being ICT-enabled on a firm’s imports for inputs.
Source: WTO estimates based on WB Enterprise Survey Data.
FIGURE 6.8 Effect of being ICT-enabled on the predicted share of exports out of total sales
Pred
icte
d ef
fect
on
the
shar
e of
tota
l exp
orts
Number of employees2
0
2%
4%
8%
15 45 100
6%
255
Note: Figure marks represent the estimated range for the predicted effect of
being ICT-enabled on a firm’s total exports.
Source: WTO estimates based on WB Enterprise Survey Data.

130 • Technological innovation, supply chain trade, and workers in a globalized world
FIGURE 6.9 Ways the digital economy can reduce SME business costs
Export value chain Impact of digital
Details Digital scenarioTraditional scenario
• Desktop research• Digital market research tools
(e.g. online surveys)• Reduced need for travel
• Limited transparency• Time intensive paper based
approach• Dedicated brokers
• Product comparison sites • Single window view into
market
• Time intensive paper based approach
• Dedicated consultant
• Physical delivery of goods to the foreign market
• Product delivery and channels through which sales occur
• Manual management of supply chains
• Automated and digitalised supply chain management (e.g. Internet of Things)
Market research
Operationalsupport
Distribution
Insuranceand
financing
Regulatorycompliance
• Identification and quantification of foreign business opportunities• Obtaining information and a rigorous understanding of the target market
• Labour intensive: dedicated staff, market research agency, potential field trip• Potential travel to market
• Procurement of local advertising space in foreign, market (e.g. newspaper, radio & TV ads)
• Special IT equipment (e.g. servers, office software)• Communication services • Dedicated travel agents
• Digital advertising channels (search engine optimisation, display, social, video)• Leveraging market platforms
• Cloud computing and software• Voice over IP• Online travel services
• Digital financial products
• National single window
• Limited information on causes of inefficiencies
• Targeting of customers in the foreign market through advertising• Dissemination of promotional material through various advertising channels
• Access to product shipment insurance for and securing funding for export ventures• Obtaining information on and procuring to insurance and securing loans
• Regulation, rules and laws in the foreign market the MSME has to comply with• Costs of complying with foreign regulation such as filing documents and legal costs
• Day to day operations of the business e.g. processing orders, back offices tasks• IT heavy tasks such as database management, accounting, communication
Marketing
Source: Alphabeta framework (from AMTC, 2018).
BOX 6.1ConnectAmericas, an online network for businesses in the Americas
Online networks for businesses are an important tool pro-vided through the internet for SMEs to connect to inter-national markets. ConnectAmericas, a business network initiative by the Inter-American Development Bank (IDB) with the support of Google, DHL, Visa and Alibaba, seeks to promote international trade and investment by SMEs in the Americas through its platform. Two examples illustrate its usefulness to small digital businesses working to enter international markets. The first is Rodrigo Olivares and his online engineering training services and the second is GlamST, a virtual makeup application founded by Carolina Bañales and Augustina Sartori.
After registering on ConnectAmericas, Mr. Olivares quickly received verification of his company by Connect-Americas. Mr. Olivares next indicated his desire to expand his training services beyond his Chilean base. Within a short amount of time he was contacted online by his now
partner from Curaçao regarding a potential business rela-tionship. Following a Skype conversation, they agreed to work together, with the new partner in Curaçao using his established business to actively promote and advertise Mr. Olivares’ training services.
GlamST was created by two telematics engineers, Caro-lina Bañales and Augustina Sartori, to enhance the customer experience, both online and in-store, for retail cosmetics brands through a virtual makeup application they devel-oped. ConnectAmericas provided GlamST with a way to research and verify potential business clients for the app. Further, Ms. Bañales noted that ConnectAmericas provides resources via their platform for accessing start-up capital as well as client and product development tools.
Source: https://connectamericas.com/video/rodrigo-olivares-did-business
-3-days-thanks-connectamericas

The digital economy, GVCs and SMEs • 131
Digital technologies can also help reduce regulatory compli-ance costs by making information available online. For example, government tax compliance regulations or export requirements can now often be found on the internet and necessary informa-tion can sometimes be submitted via e-documentation. This is important for SMEs, a majority of which were found to outsource customs-related regulatory compliance in a recent ITC survey (ITC, 2017a). Recognizing the potential for the internet to facilitate SMEs’ access to information for international trade, the ITC with the WTO and UNCTAD has developed the Global Trade Helpdesk (GTH) as a one-stop shop (see Box 6.2). New technologies like blockchain can also contribute to greater transparency, making it easier to trace supply chains and prove product origins (Ganne, 2018). It is estimated that manufacturing SMEs can see as much as a 40 per cent reduction in compliance costs and a halving of the time required to comply thanks to digital technologies, while services SMEs can see the costs eliminated entirely (AMTC, 2018).
Other cost reducing services are available as well, particularly with regard to distribution services. Digital logistics that leverage IoT and artificial intelligence now permit much closer tracking of shipments and inventory, allowing firms to better assess their production and demand (AMTC, 2018; WTR, 2018. See also chapter 5). Additionally, recruitment websites make it easier to list and fill vacancies and price comparison sites can significantly reduce firm expenditures on their required goods and services. Cloud technologies can also reduce a firm’s expenses on hardware, software, web hosting and the associ-ated administrative costs (AMTC, 2018). These services are used by “lean start-ups” to lower their fixed costs, thereby increasing com-petitiveness in the fast-changing digital environment (OECD, 2017a).
Related to distribution services, studies have also shown that small and financially constrained firms rely heavily on intermedia-tion services (Ahn, 2011; Chan, 2015) and often do not have direct export market access (Felbermayr, 2011). This is especially true when market access costs are high, leading to trade intermedi-ation services taking a larger revenue share from exporters than would be predicted by standard trade models (Schroder, 2003). Digital technology can work to reduce the distortion posed by
intermediaries by reducing the costs of international trade, espe-cially with regards to logistics services.
At a basic level, digital technology has been crucial in lowering the cost of operational support needed for business generally, but especially for cross-border initiatives. Email, voice over internet pro-tocol (VOIP) systems and online video conferencing now mean that firms can be in touch at reasonable cost, especially internationally. Further, the use of machine learning to provide real-time translation is also bringing down language barriers.
Altogether, these reduced business and trade costs have the potential to be relatively more beneficial for SMEs, especially SMEs in the services sector, than for large firms with regards to international markets. This is even more true for SMEs in developing countries where the relative burden has been noted to be the highest (WTO, 2018). In fact, it is estimated that digital technologies can lower SME export costs by as much as 82 per cent and reduce foreign market operating costs by up to 59 per cent (AMTC, 2018). Digital technolo-gies have lowered the cost to internationalize, thereby widening the scope for SME participation in international trade and GVCs (OECD, 2018b; WTO, 2018). It is estimated that the rise of digital technol-ogies such as IoT, artificial intelligence, 3D printing and blockchain could lower trade costs by another 10.5 per cent over the next 15 years, with such decline especially benefiting SMEs and firms from developing countries, provided appropriate complementary policies are put in place (WTR, 2018).
E-commerce as an enabler or alternative to GVC participationAccess to online sales platforms has been a very important development for SMEs, especially as it relates to GVCs and inter-national supply. Lendle et al. (2014) shows, in a sample of 18 countries, that between 88 to 100 per cent of eBay sellers are merchandise exporters, compared to only ten per cent of small firms operating through traditional non-platform methods. Fur-ther, SMEs participating in e-commerce tend to remain export-ers longer than those in purely traditional markets (ITC, 2016) and growth of e-commerce yields productivity gains of 6 to 15 per cent for SMEs (ABAC, 2018). Although SMEs with access to
BOX 6.2The Global Trade Helpdesk, international trade information in one location
The Global Trade Helpdesk (GTH) is a joint ITC, UNCTAD, WTO initiative that aims to improve the quality, transparency and accessibility of trade-related information by providing a unique entry point to existing trade-related information. The GTH specifically targets SMEs who often do not have the resources to access fee-based information.
The beta version of the GTH was launched at the 11th WTO Ministerial Conference in 2017. The GTH integrates comprehensive information from various sources on market requirements, including customs tariffs, taxes, rules of origin,
non-tariff measures, and notifications of WTO Members; export/import procedures (e.g. pre-shipment formalities, certification and inspection processes, transport documents); business opportunities (market prices, company directory, upcoming events); and policy outlook (trade statistics, export potential analysis, trade agreements).
In the coming years, the GTH will be translated to all six official United Nations languages to be accessible to people around the world.Source: www.helpmetrade.org

132 • Technological innovation, supply chain trade, and workers in a globalized world
e-commerce may not immediately participate in GVCs, SMEs often enter international trade and supply chains as e-commerce importers before becoming exporters and suppliers themselves (cited in Lanz et al., 2018).
In general, small firms that use e-commerce also have more access to international markets and supply chain demand. For example, SMEs are able to reach 30 different economies on average using online platforms (ARTNeT, 2018). On top of this, e-commerce has changed supply chains more fundamentally via the noted trend for firms to retain a reduced inventory and instead purchase high frequency, small volume shipments online (see chapter 5 and AliResearch, 2017). SMEs might be able to take advantage of this change given their potential for greater busi-ness agility and the evolving need for smaller quantities.
An estimated 90 per cent of e-commerce transactions are B2B (ITC, 2017a), thereby implying underlying value chain transac-tions. Although the majority of e-commerce consists of domestic transactions, cross-border retail e-commerce is expected to grow at twice the rate of domestic e-commerce, potentially boosting international trade (ARTNeT, 2018). E-commerce and digital plat-forms have also been crucial for facilitating international trade by SMEs, and e-commerce in general is becoming increasingly inter-national (ITC, 2017a). Thus, e-commerce can be an alternative to participation in GVCs by SMEs through multinational companies. Depending on the business model employed by a given producer or manufacturer, SMEs may search online for inputs meeting their criteria rather than having a formal agreement with a supplier, thereby creating potential opportunities for firms of any size.
Online sales platforms, and e-commerce generally, have also been shown to provide more inclusive environments for SMEs through anonymity given that firms might otherwise be dis-criminated against based on size or ownership if operating in a traditional market (WTO, 2016; WTO, 2018). For example, wom-en-owned businesses are frequently better represented in online platforms than offline, with the share of women-owned online firms double the share of offline firms (ITC, 2017a). In China, 49.4 per cent of Alibaba’s active online storeowners are female, and Etsy reports that more than 80 per cent of its retailers are women (AliResearch, 2017; TechCo, 2015; additionally, see Box 3.1 in Chapter 3). However, despite the possibility for e-commerce to open new doors for SMEs, large firms conduct the vast majority of e-commerce transactions (see Figure 6.10).
New business structures and opportunities Digital technologies can indirectly increase SME trade by ways other than reducing costs. The scaling up of small firms, including the “born global” phenomenon, sometimes referred to as “micro-multinationals” (Cusolito et al., 2016), is one important way that SMEs can enter international markets and value chains. Micromul-tinationals achieve scale without mass, which has typically been required to expand abroad in the past (OECD, 2017a). Although born global firms can start from any size, given the short time span for expansion they frequently are SMEs.
Separately, fully digital products and their creation services, such as electronic games, smartphone applications, or even software
generally are also areas that SMEs can take advantage of. SMEs can join GVCs as independent service contractors for digital products that may be exported indirectly over the web. Besides online and mobile apps, online content creators in general have also sprung up as ways small businesses, even individuals, are employed. The employment share of SMEs in the ICT sector in OECD countries grew from 3.8 per cent to 4.7 per cent between 2010 and 2016, and SMEs’ share of value added in this sector increased in nearly all OECD countries, with the most substantial increases in publishing activities and telecommunications (OECD, 2018c).
The opportunities opened by digital technologies are multi-faceted, and some studies estimate that digitalizing MSMEs is the largest contributor to kick-starting virtuous cycles, especially for firms engaging in cross-border trade (ABAC, 2018).
3.3 Digital challenges for SMEs to enter GVCs The digital economy, and ICT generally, are significant enablers for SME participation in GVCs. However, challenges related to SME participation remain. SMEs lag in terms of digital technology adoption for a variety of reasons, from cost of implementation to management (OECD, 2017a). Moreover, large firms have imple-mented a wide range of technologies with a diverse set of require-ments (see chapter 5 for a discussion on company use of advanced supply management techniques). As a result, the ability to interact effectively with these technologies has now frequently become a precondition in big industries for other firms to become suppliers, thereby becoming a requirement for certain types of GVC par-ticipation and potentially excluding some suppliers (see Box 6.3). Without the required capital and skills, firms can be left farther and farther behind when it comes to GVC participation.
In addition to the difference between small and large firm adoption of digital technologies, the “digital divide” between developed and developing countries is also a prominent issue for the new digital economy. Developing countries often have a lower level of internet access, and the internet that is available may have a lower bandwidth than that in developed countries. Because of this reduced accessibility, there is also often a deficit of internet and related technical skills, posing additional barriers for SMEs. LDCs in particular often lack the necessary infrastructure for their SMEs to access the internet. Additionally, e-commerce platforms may not have expanded to certain developing countries, especially LDCs, given low demand, lack of online financial infrastructure, and liability concerns (Lanz et al., 2018). Lastly, an issue that affects all online firms, but developing country firms, is visibility. Although a firm may have a website, if the firm lacks the skills required to market the business both online and offline, potential customers will not know of the service or product’s availability (AMTC, 2018).
Even with digital capabilities, firms still face significant barriers to participate in the digital economy, such as with access to pay-ment systems and online sales platforms (AMTC, 2018). Further, e-commerce platform requirements can often be challenging for SMEs to comply with and are sometimes labelled as “gatekeep-ers.” These barriers include membership requirements, such as the use of specific logistics suppliers; the requirement to deliver prod-ucts to purchasers within tight timeframes; and a return policy that

The digital economy, GVCs and SMEs • 133
is often more accommodating than the seller’s default (ARTNeT, 2018). Additionally, developing country firms in particular note the high costs associated with many of these platforms, including sales commission charges that range from 15 to 40 per cent of the sale depending on the seller’s location (WTO, 2018). A new technology, blockchain, could help to remedy some of these challenges. The technology is already being used to implement peer-to-peer mar-ketplaces that operate without the need for a central actor (such as OpenBazaar). However, such initiatives remain, for the time being, very limited in scope, and it is difficult to tell whether they will offer real benefits compared to existing platforms (Ganne, 2018).
Separately, a recent study by the OECD (2017) also notes that the digital economy has led to increased complexity, changes in required skills and business models, and a “winner-take-all” envi-ronment whereby the leading player can often dominate a market at the global level. Firms may be locked out of markets by the “instant upscale” effect of winner-take-all firms that seize the market.
As with all change, the digital economy has had, and will con-tinue to have, significant disruptive effects on traditional mar-kets. All of these issues have implications for SMEs and their par-ticipation in digitally facilitated trade and changing GVCs.
4. How to promote SME participation in GVCs?
Reaping the benefits of digital trade is not automatic. While the rise of the internet has opened new opportunities for SMEs to participate in global value chains, challenges remain that relate both to access and use of digital technologies, and to the broader ecosystem in which SMEs evolve. SMEs continue to face significant constraints in terms of connectivity and level of dig-ital skills, especially in developing countries, and market barri-ers and inefficiencies in the business environment continue to disproportionately affect them. Increasing SME participation in
FIGURE 6.10 Proportion of small and big firms selling online in 2014 and 2015(Per cent)
0 20 40 60 80 100
Singapore (2014)Republic of Korea (2014)
Belarus (2015)Indonesia (2014)Mauritius (2013)
Ireland (2015)Norway (2015)Sweden (2015)
Denmark (2015)Germany (2015)Belgium (2015)
Netherlands (2015) Czech Republic (2015)
United Kingdom (2015)Slovenia (2015)
France (2015)Qatar (2015)
Croatia (2015)Lithuania (2015)Portugal (2015)Finland (2015)
Spain (2015)Malta (2015)
Serbia (2014)Austria (2015)
Slovakia (2015)Estonia (2015)
Hungary (2015)United Arab Emirates (2013)
Turkey (2015)Poland (2015)
Italy (2015)Luxembourg (2015)
Kazakhstan (2014)Latvia (2015)
Bulgaria (2015)Cyprus (2015)
Romania (2015)Greece (2015)
Thailand (2013)Azerbaijan (2014)
Republic of North Macedonia (2015)
Small enterprises (10-49 employees) Large enterprises (+250 employees)
Source: (UNCTAD, 2017) based on World Bank data.

134 • Technological innovation, supply chain trade, and workers in a globalized world
global value chains requires more than simply the technology. It requires a conducive business environment that allows SMEs to seize the opportunities that the digital economy opens.
4.1 Improving SMEs’ access and use of digital technologiesSMEs’ access and use of digital technologies remains constrained by various factors ranging from the most basic, such as access to a steady supply of electricity in many developing countries, to the more complex, such as a lack of high speed internet cables (ITC, 2016; Darsinouei, 2017; Lanz et al., 2018). The development of an efficient ICT infrastructure is essential to access global mar-kets (BIAC et al., 2016; OECD, 2017a; OECD, 2017b), and when it comes to e-commerce, the most important technological require-ment remains basic access to the internet. E-commerce can only develop if the internet is present (Fernandes et al., 2017). It is therefore vital that governments provide their business sector, and in particular SMEs, with affordable, high-quality internet infrastructure. Mobile technology is also very important for busi-nesses, in particular in developing countries, and government should support both mobile infrastructure and efforts to create mobile-friendly, paperless e-government systems (ABAC, 2018). Key policy aspects include the mobilization of investment in ICT infrastructure, both public and private, as well as the creation of a regulatory environment that provides for sound competition in the telecommunications sector (Lanz et al., 2018).
However, improving access to the internet and mobile technology is, on its own, not sufficient to support integration of SMEs in inter-national production networks if they are not aware of the opportuni-ties that the digital economy opens and if they lack the digital skills required to participate in such networks. Awareness among SMEs of how to participate in the digital economy, and how to benefit from the opportunities that digital technologies offer, remains relatively limited (OECD, 2018c). In middle-income countries, many SMEs have internet access but they often have limited understanding or capabil-ity to leverage the internet as part of their business plan (Cusolito et al., 2016). Further, the gap in technological adoption by SMEs relative to large firms remains in part because of other missing components such as insufficient R&D, human resources, and organizational and process innovation (OECD, 2018c). The lack of technical digital skills
is regularly pointed out as one of the key impediments to SME par-ticipation in e-commerce activities and global value chains more gen-erally. In a recent ITC survey of 2,200 SMEs in 111 countries, the lack of technical skills was ranked second out of all reported challenges for e-commerce participation, behind online visibility. In fact, insuffi-cient knowledge of online marketing tools, or technical skills, was one of the key reasons put forward to explain the lack of online visibility for these firms. Improving online visibility requires more than simply having a webpage or access to an online platform; it requires specific digital skills to master online marketing techniques (ITC, 2017a).
To promote SME participation in global value chains, policy makers need to ensure that SMEs and workers have the digital skills and knowledge to use ICT technologies efficiently in the different business functions involved in international trade, from market research, to product development, sourcing, production, sale, and after-sale services, and actively support the develop-ment of ICT (and mobile) infrastructure.
4.2 Other policy measures to support SME trade and integration into GVCsEven when connected online, SMEs face a host of other barri-ers that can prevent them from joining GVCs or participating in international trade in the new digital economy. Many of these are ongoing obstacles, such as informality or access to finance and logistics. However, some have become even more relevant in the digital age. For example, de minimis import thresholds are par-ticularly important given the increase in small shipments that has come with e-commerce. Closer inspection of these peripheral issues can provide an indication of ways to improve SME partici-pation in GVCs and international trade.
Trade policy Trade policy can have important simplifying effects on cross-border trade, which can increase the use of GVCs. For example, de minimis policies that set thresholds under which shipments are not required to pay duties can reduce the tariff accumulating impact on trade, or, in other words, reduce the effect of adding the tariff cost of every border crossing to the final product price (ITC, 2017a). This not only makes it less expensive to import intermediate products, but
BOX 6.3Connecting SMEs to the digital supply chain – challenges for the European automotive industry
A challenge for SMEs to integrate as suppliers into the Euro-pean automotive industry in the digital economy arose with the industry’s adoption of automated electronic data inter-change (EDI) systems (see chapter 5 for a more in-depth description of EDI). Large automobile manufacturers insisted on compliance with their selected EDI standards to avoid complications and errors. However, these systems often required large upfront investment that acted as barriers to entry for SMEs. The development of WebEDI, a method of conducting EDI through an internet browser rather than
specific EDI software reduced the ICT burden for suppliers, but there were hidden costs related to data entry errors and employee time requirements on the part of the supplier.
Although the digital economy has created many oppor-tunities for SMEs to become suppliers, issues relating to integration and specification requirements – not only of the manufactured product but also with the delivery systems themselves – will continue to pose challenges for SMEs that tend to have relatively smaller resources for compliance.Source: EC (2012).
The digital economy, GVCs and SMEs • 135
also can make exports more competitive by reducing the final mark-up price required for profitability. De minimis thresholds vary considerably from one country to another, ranging from none (meaning all imports require a customs duty regardless of value) to 1,000 USD.10 Low de minimis thresholds pose particular barri-ers for SMEs involved in ecommerce, which may have frequent low volume shipments of sometimes low-value articles that still might be required to pay customs duties (Suominen, 2017). Import tar-iffs in general apply a cost to GVC participation, and areas with low average import tariffs, such as Southeast Asia, are much more integrated in manufacturing GVCs compared with areas that have high average import tariffs, such as South Asia. Greater use of for-eign inputs has been shown to have a positive impact on the level of sophistication and diversification of exports. This suggests that policies that reduce import tariffs and facilitate border procedures are likely to help SME integration into GVCs (Cusolito et al., 2016). Indeed, complicated customs procedures have been shown to be especially harmful to SMEs (WTO, 2016).
Beyond tariff reductions and trade facilitation measures, deep-ening trade integration is positively correlated with value chain activity. In a recent study, the ITC finds that increasing the number of trade provisions covered by trade agreements leads to more value chain integration between firms of all sizes in the participating countries, with small firms benefiting the most (ITC, 2017a). Integrat-ing investment provisions in a preferential trade agreement rather than in a separate bilateral investment treaty was also found to increase the level of domestic value added in exports (ITC, 2017b).
Finally, significant barriers remain in the services sector, which affects SMEs disproportionately (WTO, 2016). Further liberalization of trade in services, in particular of services that allow companies to connect to global value chains, such as ICT and logistics, could act as important enablers of SME GVC participation.
Logistics and cost of deliveryFor physical goods, a key issue for trade participation by SMEs is the cost of delivery. In a survey conducted by the ITC (2017a), SME respondents noted their main trade challenges were costly postal and courier delivery services. Other logistics difficulties for SMEs include the costs of shipment warehousing. These issues are par-ticularly important for developing countries where the share of logistics costs in final prices is estimated at 26 per cent, almost twice the share for developed countries (ITC, 2017a). While some of these issues can be addressed at a regulatory level by further opening services sectors, others require proactive investment measures. Indeed, a large part of the logistics challenge faced by SMEs is linked to infrastructure. Without developed ports, roads, and cargo-handling facilities, shipping costs are more expensive (Cusolito et al., 2016). For example, it has been estimated that it is cheaper to ship goods across the Pacific or Atlantic oceans than it is to ship within the ASEAN region (ARTNeT, 2018).
Promoting innovation and R&DParticipation in international trade and innovation are closely linked. Firms that innovate tend to engage more actively in international trade (Tian et al, 2017) and firms that participate
in international trade have been found to be more innovative (WTO, 2016). Promoting participation in international trade and innovation are two sides of the same coin that should be pur-sued in tandem. Although few SMEs have the resources to invest in R&D, those that do can contribute significantly to innovation (ADB, 2015). Firm R&D spending is closely linked with manager’s education and experience (Gao, 2015; OECD, 2007) and can be supported by investment in areas such as technical skills or pro-tection of IP. Further, as previously mentioned, SME participation can be limited by system incompatibility or lack of R&D (OECD, 2007), all of which supports the idea that more R&D by SMEs can contribute to greater internationalization and GVC participation.
Improving the business environmentInconsistencies and uncertainties in regulation are detrimental to businesses, whatever their size, but they affect SMEs more than large businesses. Indeed, SMEs’ limited resources make it more difficult for them to follow and deal with regulatory changes. As a result, they often incur relatively higher costs to gain market share (OECD, 2017a). A complex, inconsistent and unstable regulatory environment can hold SMEs back (see Box 6.4). Regulatory costs and administrative burdens can also prevent SMEs from partic-ipating in formal sector activities, thereby also preventing them from expanding their operations internationally (OECD, 2017a).
When it comes to digital trade, particular consideration ought to be given to laws and regulations that relate to the flow of data, consumer protection, and the recognition of digital documents and signatures. Although countries may unilaterally enact many reforms to improve the trading environment, especially in the area of digital trade, other measures related to data privacy rules and standards, data movement, and recognition of e-contracts may require international cooperation (ARTNeT, 2018; Lanz et al., 2018).
Finally, there is no sound business environment without sound competition. The rise of the internet has raised new issues in this respect. The “network effect” has enabled some internet com-panies to expand rapidly, often using a subsidized fee model whereby they price user access below their own business costs to gain market share. As a result, smaller firms cannot compete in, or may be priced out of, the market entirely (ITC, 2017a).
Improving access to financeIt is well-established that SMEs are less able to access finance than large firms, be it for trade or other costs. In fact, it is esti-mated that the gap in available credit for formal SMEs is around 1 trillion US dollars, and more than half of formal SMEs in emerg-ing markets do not have adequate access to financial institutions (Salman et al., 2017). For trade finance in particular, the WTO has found that over half of SME requests are rejected, compared to only 7 per cent of large firm requests (WTO, 2018). Much of SMEs’ lack of access to trade finance stems from the cost of SME eval-uation by established lenders using traditional means like credit histories. However, new technologies such as Blockchain that enhance traceability (Ganne, 2018) or Alibaba’s e-Credit Line that takes advantage of its large store of transactions history to deter-mine credit-worthiness, could help SMEs access trade finance.

136 • Technological innovation, supply chain trade, and workers in a globalized world
Further, lack of finance is the primary barrier to SME formal-ization in developing countries (OECD, 2017a). Without access to finance, SMEs are constrained not only in their ability to export, but also to increase their business generally, thereby making GVC access and even formalization substantially more difficult.
Improving the quality of dataAs the previous sections have shown, lack of data and informa-tion about SME operations represents an important barrier to better understanding and integrating SMEs into GVCs. Without good information on SMEs, it is difficult to know where to target policies, or whether a particular action has been effective. In this vein, efforts are being made to develop the Trade in Value Added (TiVA) database for improved GVC analysis, with initia-tives to include firm size breakouts in future editions. However, the number of economies it contains are still limited, and devel-oping countries, particularly low-income countries, are not well represented. In general, efforts are underway to sensitize coun-tries to break down their statistical information by firm size, as recommended by the OECD Expert Group on Extended Sup-ply-Use tables that was created in 2014 (see chapter 8). Overall, better information on firm operations within a country, including the size of the firms, the industries they participate in, and the value and volume of trade they conduct (including whether the trade is direct or indirect) are all crucial pieces of information to understand the basics of SMEs and value chain participation.
5. Conclusions
The international fragmentation of production that has remod-eled international trade over the last decades should have made it easier for small companies to participate in global supply chains, by allowing them to focus on niche markets and narrow segments of international production chains. However, evidence suggests that participation of SMEs in global value chains remains limited relative to their share of overall economic activity and employ-ment, especially in developing countries.
This could be changing, however, as the rise of the digital econ-omy is reducing information search costs, facilitating exchanges, and providing new marketing, finance and networking opportunities. New research by Lanz et al. (2018) reveals that in developing coun-tries, access to digital technology appears to have a positive effect on SME participation in backward-linked GVCs as well as on total exports by SMEs. This is in line with other research that has shown the cost-reducing effects that digital technology can have on busi-ness operations, such as improved access to information or access to online services. Additionally, e-commerce provides new ways for firms of all sizes to access global markets, both for buying and selling intermediate or final products. Lastly, the digital economy has cre-ated new business structures that make it possible for small firms to scale up in ways previously unattainable, such as the “born global” phenomenon, which can lead to increased SME international trade and GVC participation.
Despite new avenues, such as online platforms that SMEs can now use to access international markets and GVCs via the digital economy, barriers continue to hinder SME access. There are a number of ways policies, and the trading environment, can be changed to better sup-port SMEs in the new digital economy. If internet access is available then an online purchase may be made, but without appropriate ship-ping logistics, straightforward customs formalities and processes, a favorable business and regulatory environment and access to finance a firm will be unable to complete the transaction.
Overall, reducing barriers to digital trade will require a holis-tic approach. Even though digital technologies can facilitate SMEs’ integration into GVCs, they are only one element of the ecosystem required for an SME to reach full trading potential and the develop-ment of coherent national strategies is essential. On a policy level, better data is also required in order to understand where the trading difficulties are in a given economy. Availability of data by firm size is critical to allow policy makers to better target their actions and effec-tively support SMEs’ integration into GVCs. Increased availability and quality of data, and further analysis of direct vs indirect backward participation and of the impact of direct versus indirect participation on firms’ performance would help to better understand and integrate SMEs into GVCs.
BOX 6.4Regulation can hold SMEs back
Regulatory standardization not only benefits cross-border goods trade, but also international trade in digital services. Pegaxis, a Singapore-based property management service plat-form that connects property managers with providers of ser-vices such as landscaping or building maintenance, has encoun-tered difficulties expanding to new markets in the region. For example, Pegaxis is concerned at potential data server local-ization requirements. These would impose costly burdens on the firm, which already has a cloud-based business model using servers across the globe. Server localization requires switch-ing to a new provider with potentially less experience in the
business of cloud computing, uncertain quality and reliability, and different operating procedures and infrastructure that may require changes within Pegaxis. Additionally, proposals by countries like Indonesia to require within-country incorporation reduce the geographical benefits of an online business model and impose time and financial costs. Uncertainties about liabil-ity are also a concern for Pegaxis, such as regarding who would be considered at fault for defamatory reviews left on their web-site. This highlights how regulatory consistency, especially in the digital age, can benefit SMEs seeking to operate internationally.Source: EC (2012).

The digital economy, GVCs and SMEs • 137
Notes
1. http://blogs.worldbank.org/psd/a-universal-definition-of-small-enter-
prise-a-procrustean-bed-for-smes
2. The terms forward and backward participation are also often referred
to as “forward linkages” and “backward linkages”.
3. In Germany, for example, SMEs hold between 70 and 90 per cent of
global market shares in some specialized manufacturing segments,
and SME merchandise exports in textile, apparel and wood manu-
facturing represented more than 60 per cent of total exports across
twelve OECD countries in 2015 (OECD, 2018b).
4. This is based on data from World Bank Enterprise Surveys for over
25,000 SMEs in the manufacturing industry in developing economies.
The World Bank Enterprise Surveys collect data from key manufac-
turing and service sectors in every region of the world. The surveys
are conducted according to the global sampling methodology which
uses stratified random sampling to minimize measurement error
and to yield data that are comparable across economies. The sam-
pling methodology generates a sample representative of the whole
non-agricultural private economy, including services industries, and
generates large enough sample sizes for selected industries to con-
duct statistically robust analyses with levels of precision at a minimum
of 7.5 per cent for 90 per cent confidence intervals. Years covered
differ from country to country.
5. A commonly used definition of informality (or informal economy)
in the literature is the one proposed by Schneider et al. (2010) who
define the informal economy as comprising market-based legal pro-
duction of goods and services deliberately concealed from public
authorities to avoid paying taxes, social security contributions, and
meeting legal obligations/requirements and market standards.
6. https://www.ilo.org/global/topics/employment-promotion/infor-
mal-economy/lang--en/index.htm
7. The share of women in informal employment in developing coun-
tries according to the latest available data was 4.6 percentage points
higher than that of men including agricultural workers and 7.8 per-
centage points higher without (ILO, 2018). In some sub-Saharan Afri-
can countries, the gender gap between the formal and the informal
sector even exceeds 20 per cent (ILO, 2018).
8. eWSF is intended to be a global platform for SMEs to capture GVC
and B2B opportunities. Although the site is still in development, the
goal is to develop modular pieces to come online as each part is cre-
ated. http://www.worldsmeforum.org/wp-content/uploads/2016/12/
EceIdilKasap_CACCI_Nov24.pdf
9. Born global firms are generally defined as those that achieve 25
per cent foreign sales out of their total sales within their first 3 years
(Nordas, 2015).
10. For a list of de minimis levels as of 28 March 2018 please see https://
global-express.org/assets/files/Customs%20Committee/de-minimis/
GEA%20overview%20on%20de%20minimis_28%20March%202018.
pdf.
References
Abel-Koch, J. (2016), “SMEs’ value chains are becoming more international
– Europe remains key”, KfW Research, Research Paper No. 137, 16
August 2016.
Aliresearch. (2017), “Inclusive Growth and E-commerce: China’s Experi-
ence,” April 2017.
Ahn, J., Khandelwal, A., and Wie, S. (2010), “The Role of Intermediaries
in Facilitating Trade,” National Bureau of Economic Research, Working
Paper 15706, Cambridge: Massachusetts.
Andrade, Gustavo Henrique, Miriam Bruhn, and David McKenzie. 2015.
“A Helping Hand or the Long Arm of Law? Experimental Evidence on
What Governments Can Do to Formalize Firms.” World Bank Economic
Review 30 (1): 24–54.
APEC (2014), “Integrating SMEs into Global Value Chains: Policy Principles
and Best Practices”, APEC Policy Support Unit, Issues Paper No. 6, May
2014.
APEC Business Advisory Council (ABAC) (2018), Realizing the Untapped
Potential of MSMEs in APEC: Practical Recommendations for Enhancing
Cross-Border Trade, University of Southern California, Marshall School
of Business: Los Angeles.
Asian Development Bank (ADB) (2015), Integrating SMEs into Global Value
Chains: Challenges and Policy Actions in Asia, 2015, Manila: ADB.
Asia Pacific MSME Trade Coalition (AMTC) (2018), Micro-Revolution: The
New Stakeholders of Trade in APAC, AMTC: Singapore.
Bas, M. and V. Strauss-Kahn (2015), “Input-trade Liberalisation, export
prices and quality upgrading”, Journal of International Economics,
95(2): 250-262.
Bas, M. and V. Strauss-Kahn (2014), “Does importing more inputs raise
exports? Firm-level evidence from France”, Review of World Econom-
ics, 150(2): 241-275.
BIAC, B20 China, World SME Forum, SME Finance Forum (2016), Financing
Growth; SMEs in Global Value Chains.
Botero, J., S. Djankov, R. La Porta, F. Lopez-de-Silanes, and A. Shleifer
(2004), “The Regulation of Labor,” Quarterly Journal of Economics, Vol.
119, No. 4, pp. 1339–82.
Bruhn, Miriam, and David McKenzie (2014), “Entry Regulations and the For-
malization of Microenterprises in Developing Countries,” World Bank
Research Observer 29 (2): 186–201.
Cebeci, T., Fernandes, A. M,. Freund, C. and Pierola, M. D. (2012),
“Exporter Dynamics Database”, Policy Research Working Paper 6229,
World Bank, Washington, DC.
Cebula, R. (1997), “An Empirical Analysis of the Impact of Government Tax
and Auditing Policies on the Size of the Underground Economy: The
Case of the United States, 1973–94,” American Journal of Economics
and Sociology, Vol. 56, pp. 73–186.
Chan, J. (2015), “Trade Intermediation, Financial Frictions, and the Gains
from Trade,” Stanford Institute for Economic Policy Research, Working
Paper 15-009.
Cusolito, A. P., Safadi, R. and Tagioni, D. (2016), Inclusive Global Value
Chains – Policy Options for Small and Medium Enterprises and Low-In-
come Countries, OECD/World Bank.
Dabla-Norris, E., Gradstein, M., Inchauste, G. (2005), “What Causes Firms
to Hide Output? The Determinants of Informality”, IMF Working Paper
WP/05/160, International Monetary Fund.

138 • Technological innovation, supply chain trade, and workers in a globalized world
Darsinouei, A. E. (2017), Understanding E-Commerce Issues in Trade
Agreements: A Development Perspective Towards MC11 and Beyond,
Geneva: CUTS International.
de Mel, S., McKenzie, D., and Woodrufff, C. (2013), “The Demand for, and
Consequences of, Formalization among Informal Firms in Sri Lanka,”
American Economic Journal: Applied Economics.
European Commission (EC), (2012), Integrating Automotive, Connecting
SMEs to the Digital Supply Chain, Brussels: EU.
Farazi, S. (2014), “Informal Firms and Financial Inclusion: Status and Deter-
minants”, Policy Research Working Paper No. 6778, World Bank, Wash-
ington, D.C.: World Bank.
Felbermayr, G. and Jung B. (2011), “Trade Intermediation and the Orga-
nization of Exporters,” Review of International Economics, 19(4),
pp.634-648.
Fernandes, A. M., Mattoo, A., Nguyen, H., & Schiffbauer, M. (2017), “The
Internet and Chinese Exports in the Pre-Alibaba Era”, Policy Research
Working Papers.
Friedman, E., S. Johnson, D. Kaufman, and P. Zoido-Lobatón (2000),
“Dodging the Grabbing Hand: The Determinants of Unofficial Activity
in 69 Countries,” Journal of Public Economics, Vol. 76, pp. 459–92.
Ganne, E. (2018), “Can Blockchain Revolutionize International Trade”,
Geneva: WTO.
Gao, Y., Hafsi, T., (2015) “R & D spending among Chinese SMEs: the role of
business owners’ characteristics”, Management Decision, Vol. 53 Issue:
8, pp.1714-1735.
Giles, D., and L. Tedds (2002), “Taxes and the Canadian Underground
Economy,” Canadian Tax Paper No. 106 (Toronto: Canadian Tax
Foundation).
Harvie, C., Narjoko, D., and Oum, S. (2010), “Firm Characteristic Determi-
nants of SME Participation in Production Networks”, ERIA- Discussion
Paper Series, No. 2010–11, October.
Harvie, C., Narjoko, D., and Oum, S. (2015), Economic Integration in East
Asia: Production Networks and Small and Medium Enterprises, Rout-
ledge, London and New York.
International Finance Corporation (IFC) (2012), Enterprise Finance Gap
Database, World Bank, Washington DC.
International Finance Corporation (IFC) (2013), IFC Jobs Study: Assessing
Private Sector Contributions to Job Creation and Poverty Reduction,
World Bank, Washington DC.
International Labour Organization (ILO) (2018), Women and men in the
informal economy: A statistical picture, third edition (Geneva).
International Trade Centre (ITC) (2017a), New Pathways to E-Commerce – A
Global MSME Competitiveness Survey, September 2017, Geneva: ITC.
International Trade Centre (ITC) (2017b), SME Competitiveness Outlook
2017, Geneva: ITC.
International Trade Center (ITC) (2016), “Bringing SMEs onto the e-Com-
merce Highway,”
Geneva: ITC.
International Trade Centre (ITC) (2015a), SME Competitiveness Outlook:
Connect, Compete and Change for Inclusive Growth, Geneva: ITC.
International Trade Centre (ITC) (2015b), “How companies experience
non-tariff measures – Survey-based evidence from developing coun-
tries”, ITC technical paper.
Johnson, S., D. Kaufmann, J. McMillan and C. Woodruff (2000), “Why Do
Firms Hide? Bribes and Unofficial Activity after Communism,” Journal
of Public Economics, Vol. 76, pp. 495–520.
Kowalski, P., Lopez Gonzalez, J., Ragoussis, A. and Ugarte, C. (2015), “Par-
ticipation of Developing Countries in Global Value Chains: Implications
for Trade and Trade-Related Policies”, OECD Trade Policy Papers, No.
179, OECD Publishing, Paris,
Lanz, R., Lundquist, K., Mansio, G., Maurer, A., and Teh R. (2018), “E-com-
merce and developing country-SME participation in global value
chains”, Background paper.
La Porta, R., and Shleifer, A. (2014), “Informality and Development”, NBER
Working Paper No. 20205, June 2014.
Lendle, A. and Olarreaga, M. (2014), “Can Online Markets Make Trade More
Inclusive?” Discussion Paper No. 349, Washington DC: Inter-American
Development Bank.
López González, J. (2017), “Mapping the participation of ASEAN small-
and medium- sized enterprises in global value chains”, OECD Trade
Policy Papers, No. 203, OECD Publishing, Paris.
Lopez-Gonzalez, J. (2016), “Using Foreign Factors to Enhance Domestic
Export Performance: A Focus on Southeast Asia”, OECD Trade Policy
Papers, No. 191, OECD Publishing, Paris.
Lu, J. Meng, B., Zhang, H., and Wei, S. (2018), “Corruption, Import Liber-
alization, and Productivity in China: A Firm-Level Analysis,” Background
paper.
Manova, Kalina & Yu, Zhihong (2016), “How firms export: Processing vs.
ordinary trade with financial frictions,” Journal of International Econom-
ics, Elsevier, vol. 100(C), pages 120-137.
Mayer, T., and Ottaviano, G. (2007), The Happy Few: The Internationali-
sation of European Firms: New Facts Based on Firm-Level Evidence,
Brussels: Bruegel Blueprint Series.
Nguyen, D. C., Nguyen, N. A., Li, H. A. and Nguyen, T. P. M. (2012), “Inno-
vation and Choice of Exporting Modes under Globalization”, in Hahn,
C. H. and Narjoko, D.A. (eds), Dynamics of Firm Selection Process in
Globalized Economies, ERIA Research Project Report 2011, No. 3.
Organization for Economic Co-operation and Development (OECD)
(2018a), “Accounting for firm heterogeneity in global value chains:
The role of Small and Medium Sized Enterprises”, STD/CSSP/
WPTGS(2018)5.
Organization for Economic Co-operation and Development (OECD)
(2018b), “Fostering greater SME participation in a globally integrated
economy”, Discussion Paper, SME Ministerial Conference 22-23 Feb-
ruary 2018.
Organization for Economic Co-operation and Development (OECD)
(2018c), “SME and Entrepreneurship Outlook”, Room Document,
OECD Working Party on SMEs and Entrepreneurs (WPSMEE), 10-11
October 2018.
Organization for Economic Co-operation and Development (OECD)
(2017a), “Enhancing the Contributions of SMEs in a Global and Digi-
talized Economy”, Meeting of the OECD Council at Ministerial Level,
Paris, 7-8 June 2017.
Organization for Economic Co-operation and Development (OECD)
(2017b), Small, Medium, Strong. Trends in SME Performance and Busi-
ness Conditions, OECD Publishing, Paris.

The digital economy, GVCs and SMEs • 139
Organization for Economic Co-operation and Development (OECD) (2007),
“Enhancing the Role of SMEs in Global Value Chains”, Proceedings of
OECD global conference. 31 May–1 June 2007, Tokyo.
Oxford Economics (2017), SME Strategies for Success: A Global Study
that Reveals the Key Drivers of Success for SMEs in 2017 and Beyond,
Oxford Economics, Oxford.
Perry, G., Maloney, W. F., Arias, O. S., Fajnzylber, P., Mason, A. D., and
Saavedra-Chanduvi, J. (2007), Informality: Exit and Exclusion, World
Bank, Washington DC.
Salman Alibhai, Simon Bell, and Gillette Conner, “What’s happening in the
missing middle? Lessons from financing SMEs,” World Bank Group:
Washington DC.
Schneider, F., Buehn, A. and Montenegro, C. E. (2010) “Shadow Econo-
mies All over the World, New Estimates for 162 Countries from 1999
to 2007”, Policy Research Working Paper 5356, World Bank, Wash-
ington DC.
Schröder, P., Trabold, H., and Trübswetter, P (2003), “Intermediation in For-
eign Trade: When do Exporters Rely on Intermediaries?”
Slaughter, M. J. (2013) American Companies and Global Supply Networks:
Driving US Economic Growth and Jobs by Connecting with the World,
Washington DC: Business Roundtable with the United States Council
for International Business and the United States Council Foundation.
Straub, S. (2005), “Informal Sector: The Credit Market Channel,” Journal of
Development Economics (forthcoming).
Suominen, K. (2017), “The Silver Bullet for Fueling Small Business Exports
in the Ecommerce Era: A plurilateral on De Minimis,” April 2017.
Tech.Co (2015), “The Story of Etsy’s Success is the Story of the Success of
Women Entrepreneurs,” May 13, 2015.
Tian, W., Yu, M., Zhang, R. (2017), “International trade and firm innovation:
patterns and evidence from the Chinese Employer-Employee Survey
data”, China Economic Journal, Volume 10, 2017, Issue 1.
Ulysseay, G. (2015), “Firms, Informality and Development: Theory and evi-
dence from Brazil”, Rede de economia aplicada (REAP) Working Paper
76, March 2015.
United States International Trade Commission (USITC) (2010) Small and
Medium-Sized Enterprises: Characteristics and Performance, Publica-
tion No. 4189, Washington DC: USITC.
United Nations Conference on Trade and Development (UNCTAD) (2017),
Information Economy Report 2017: Digitalization, Trade and Develop-
ment, Geneva: UNCTAD.
United Nations Conference on Trade and Development (UNCTAD) (2013),
World Investment Report 2013: Global Value Chains, Investment and
Trade for Development, New York and Geneva: UN.
World Trade Organization (WTO) (2016), World Trade Report 2016: Level-
ling the Playing Field for SMEs, Geneva: WTO.
World Trade Organization (WTO) (2018), World Trade Report 2018: The
Future of World Trade, How Digital Technologies are Transforming
Global Commerce, Geneva: WTO.


141
CHAPTER 7
ABSTRACT
Global value chains make it easier for developing countries to move away from export reliance on unprocessed primary products to become exporters of manufactures and services. Global value chains (GVCs) allow countries to specialize in a particular activity and join a global production network. As a developing country moves from export of primary products to export of manufactures and services via GVCs, the ratio of domestic value added to gross export value tends to fall. Many developing country policy-makers worry about this trend and aspire to increase their value added contribution to exports. There are a number of reasons why this objective
is not good policy. It may seem like simple math that a higher domestic value added share means more total value added exported and hence more GDP. But that simple idea ignores the reality that imported goods and services are a key sup-port to a country’s competitiveness. The chapter documents this via the history of the successful East Asian industrializers as well as more recent evidence from Association of South-east Asian Nations (ASEAN) economies. If a country artifi-cially replaces key inputs with inferior domestic versions, the end result is likely to be fewer gross exports and less, not more, total value added exports.
Should high domestic value added in exports be an objective of policy?David Dollar (Brookings Institution), Bilal Khan (RCGVC-UIBE), and Jiansuo Pei (SITE-UIBE)
• In almost all countries, developed and developing alike, the share of domestic value added in exports has tended to trend downwards recently. This reflects the expansion of global value chains.
• Many developing countries worry about this phenomenon and aspire to increase their value-added contribution to exports. This objective should be approached cautiously. Imported goods and services are a key support to a country’s competitiveness. If a country artificially replaces key inputs with inferior domestic versions, the result is likely to be fewer gross exports and fewer, not more, total value-added exports.
• China’s recent experience is often given as an important counter-example, since its domestic value-added ratio has been rising over the past decade, but our research indicates that this trend is primarily the result of technological advances in China.
• Consequently, the Chinese ratio can be expected to peak and later decline if China further opens up and follows in the steps of other earlier Asian industrializers, such as Japan and the Republic of Korea.

142 • Technological innovation, supply chain trade, and workers in a globalized world
1. Introduction
G lobal value chains make it easier for developing countries to move away from export reliance on unprocessed primary products to become exporters of manufactures and services. Before the develop-
ment of GVCs, a country had to master the production of a whole product in order to export it. GVCs allow countries to specialize in a particular activity and join a global production network. As a developing country moves from export of primary products to export of manufactures and services via GVCs, the ratio of domestic value added to gross export value tends to fall. Devel-oping countries often start out at the end of value chains, with labor-intensive assembly of parts produced elsewhere. For some individual products the ratio of domestic value added to gross export value can be very small, maybe only a few percentage points. The gross exports from the country can be very large, but this is an artifact of the position in the value chain. The country’s value added contribution to the export is much smaller. Many developing countries worry about this phenomenon and aspire to increase their value added contribution to exports. There are a number of reasons why this objective should be approached cautiously. It may seem like simple math that a higher domes-tic value added share means more total value added exported and hence more GDP. But that simple idea ignores the reality that imported goods and services are a key support to a coun-try’s competitiveness. If a country artificially replaces key inputs with inferior domestic versions, the end result is likely to be fewer gross exports and less, not more, total value added exports.
In this chapter we examine this issue. Section 2 looks at the historical experience of the successful East Asian industrializers, Japan, the Republic of Korea, and Chinese Taipei. Section 3 then focuses on the more recent experience of ASEAN economies as well as general literature on the issue of domestic value added content of exports. Section 4 looks at policy measures that econ-omies can consider in order to move up the technological ladder. In general, artificially trying to boost domestic content is going to be a losing strategy. Countries would do better to focus on human capital development, support to R&D, intellectual prop-erty rights protection, and opening up remaining closed sectors of the economy, especially services.
2. The decline of domestic value added in exports in Japan, the Republic of Korea, and Chinese Taipei
After two decades of dedicated work among international economists in measuring international fragmentation, a consen-sus has more or less formed, that the trend of domestic value added in exports is declining. Starting from autarky, when the economy opens to trade, there are several reasons why the domestic content of exports would begin to decline. Opening up to imports of intermediate goods and services means that a country’s producers have access to the most competitive inputs
and will make use of some of them. The decline in the share of domestic value added in exports in many cases is also the result of structural change in the export basket. Economies that open up after an autarkic period often start by exporting primary products, which tend to be relatively homogeneous worldwide. Manufactures produced in closed economies are low-quality and find few markets. Over time, however, with openness to imported inputs, a competitive manufacturing sector may emerge. China, Mexico, and Viet Nam are all examples of economies that initially exported primary products after opening up, but soon moved to manufacturing exports. That structural shift will tend to reduce the domestic content share of overall exports because that share is generally higher for primary products and lower for manu-factures. So, in general, we observe a declining domestic value added ratio over time. Further, this indicator does not have direct welfare implication, so it is not appropriate to formulate policies around pursuing a higher domestic content ratio in exports.
In this section we examine historical data for three indus-trializing economies in East Asia to study the development of domestic content in exports. We proceed in three steps of analy-sis, namely the aggregate trend for the total economy, the trend for manufacturing products, and the trend for the electronics industry, a high-tech sector.1
2.1 The case of JapanFor Japan, annual input-output tables date back to 1973. It is evi-dent that the domestic content in overall exports has declined, decreasing roughly 0.12 points from 1973 through 2014 (Figure 7.1). Several factors may account for this decline. It can be seen that the domestic value-added ratio (DVAR) in manufactures is always below that of total exports, reflecting differences between
FIGURE 7.1 Domestic value added in Japanese exports
00.10.20.30.40.50.60.70.80.91.0
1970 1975 1980 1985 1990 1995 2000 2005 2010 2015 2020
Aggregate Manufacture Electronics
Source: Authors’ calculation based on Japan’s national IO table.

Should high domestic value added in exports be an objective of policy? • 143
manufactures and primary products. The latter have relatively few intermediate inputs, and hence few imported inputs. The structural shift away from primary exports towards manufactured exports would pull down the DVAR in overall exports. In addition, various waves of trade liberalization gave Japanese producers better access to imported goods and services for production.
Clearly, this decline trend is more pronounced for manufac-tured products, as well as for the high-tech electronics sector, especially after 1990 when Japan’s serious trade liberalization accelerated. The general pattern is similar, while the ratio for manufacturing products and electronics are much lower than the aggregate. In addition, they decrease 0.19 and 0.15, respec-tively, comparing with 0.12 for the aggregate value. Arguably, the expanding international production fragmentation is well observed in Japan’s case. It is also notable that electronics is the most high-technology sector, and here Japan’s domestic value added in less than 40% of the gross export value in the most recent year. Thus, success in the high-tech sector goes hand-in-hand with extensive use of imported inputs and services.
2.2 The case of the Republic of KoreaFor the Republic of Korea, annual input-output tables date back to 1985. It is observed that the aggregate ratio of the domestic content in exports declined, with most of the change since 1995 (Figure 7.2). Between 1995 and 2014 the ratio dropped roughly 0.15. Next, we observed that the decline was similar for manu-factured products; while the general pattern is similar, the ratio for manufacturing products is much lower than the aggregate. DVAR for aggregate exports was about 0.55 in the most recent year, compared to less than 0.40 for manufactures. The trend for the electronics sector is similar.
As in Japan’s case, several factors may account for the decline in the ratio of domestic value added to export value, such as the continuing trade liberalization, international production frag-mentation, and structural shift from primary exports to manufac-tures. As with Japan, the DVAR in electronics is particularly low. The Republic of Korea has very successfully developed its own brands in televisions and smartphones, yet the DVAR in elec-tronics has generally been below 40%. The Republic of Korea’s success results from combining domestic value added with imported components and services.
2.3 The case of Chinese TaipeiFor Chinese Taipei, annual input-output tables date back to 1960s, and the domestic content of exports peaked in 1969 with a ratio of roughly 79 percent (Figure 7.3). Domestic content has fallen sharply over time, reaching 48 percent in 2011. Hence, the overall decline was around 30 percentage points (comparing with the world aver-age ratio of value added to exports falling by roughly 10 percent-age points, as reported in Johnson and Noguera, 2016), which is remarkable. Different from its Asian peers such as Japan and the Republic of Korea, Chinese Taipei is a typical small open economy. Given the growth of international production fragmentation, along with Chinese Taipei’s steady trade liberalization, it is expected that the ratio of domestic content to exports would see a sharp decline.
As a strategy for the developing regions to integrate into the world economy, joining global production is one of the shortcuts. This is particularly true for small open economies. In this way, the domestic industry structure is no longer a prerequisite for produc-ing internationally competitive products, as they can specialize in some particular stage of production, e.g. processing and assembly activities.
FIGURE 7.2 Domestic value added in Korean exports
0
0.1
0.2
0.3
0.4
0.5
0.6
0.7
0.8
1980 1985 1990 1995 2000 2005 2010 2015 2020
Aggregate Manufacture Electronics
Source: Authors’ calculation based on the Republic of Korea’s national IO table.
FIGURE 7.3 Domestic value added in exports of Chinese Taipei
00.10.20.30.40.50.60.70.80.9
1960 1970 1980 1990 2000 2010 2020
Aggregate Manufacture Electronics
Source: Authors’ calculation based on Chinese Taipei’s IO table.

144 • Technological innovation, supply chain trade, and workers in a globalized world
3. Developing countries’ experience of joining GVCs
This section will analyze the recent experiences of develop-ing countries by comparing the domestic value-added (DVA) in exports and its implications for the labor market. In the last few decades, we have noticed that many developing countries have been joining at the lower end of the value chain and have been able to increase their gross exports, achieve higher GDP per capita growth, and generate employment opportunities despite the reduction in DVA in gross exports. However, the policymakers in some of these economies are now targeting to increase the DVA in gross exports by using tariff and non-tariff barriers to imported inputs. They believe that the best way to utilize the exporting activity for development is by increasing the DVA content in gross exports as it will create more and better job opportunities for domestic workers, given everything else remains constant.
Figure 7.4 compares the ASEAN exports in 1995 and 2011. From 1995 to 2011, DVA share in exports dropped from 71% to 67%, though, it can be seen that the absolute value of exports increased many folds. Much of this increase has been attributed to increase in the intermediate exports i.e. exports related to the GVCs. This tremendous increase in gross exports also led to remarkable growth in jobs. Using empirical evidence, Lopez-Gonzalez (2016) has shown that the foreign value-added, in form of intermediate imports as well as services, plays a sig-nificantly positive role in enhancing the employment as well as productivity (value-added per worker) in the ASEAN countries.
Intuitively, importing better quality intermediates as well as ser-vices, increases the competitiveness of the domestic firms in the international market and leads to higher demand for the product as well as employees in exporting sector.
There is no single strategy that works for every economy. Each country has to realize the economic activity that can be integrated into the GVCs. Figure 7.5 shows backward and for-ward GVC linkages for Asian economies in 1995 and 2011. Viet Nam, for example, has increased the backward linkages, that is, the use of imported goods and services in its production of exports. Viet Nam has primarily participated at the produc-tion and assembly stage of manufacturing sector (light man-ufacturing, electrical equipment, electronics etc.) in the GVCs. Viet Nam’s DVA share in gross exports fell from 79.1% to 63.7% during this period. During the same period, GDP per capita in Viet Nam increased from $288 in 1995 to more than $1500 in 2011. Viet Nam has been able to shift a significant proportion of workers from the relatively less productive agricultural sector to the more productive manufacturing and services sectors. This remarkable progress has been achieved by embracing trade and investment openness by signing a Bilateral Trade Agreement with USA in 2002 and joining the WTO in 2007. These agree-ments encouraged Viet Nam to reduce the import tariffs and improve infrastructure to attract foreign direct investment (FDI). These policies resulted in importing better quality inputs as well as related services and focusing on the stage of production (pri-marily assembling and processing) where the Vietnamese firms/workers have comparative advantage. In 2017, nearly a third of
FIGURE 7.4 Enjoying a smaller share of bigger pie, ASEAN exportsValue added content of exports (share) Value added content of exports (Value in billion USD)
71.4% 66.6%
28.6% 33.4%
0
20
40
60
80
100
120
1995 2011
224.5
798.689.8
401
0
200
400
600
800
1,000
1,200
1,400
1995 2011
Domestic Foreign Domestic Foreign
Source: Lopez-Gonzalez (2016).

Should high domestic value added in exports be an objective of policy? • 145
the Viet Nam’s exports as well as imports consisted of electrical and electronics equipment despite having a shortage of skilled workers in the labor force. This has been possible only by joining the GVCs in electronics and electrical equipment.
In contrast, Indonesia has not seen much change in backward linkages since 1995 as its specialization lies in natural resources and hence, it has strengthened its forward linkages since then. Indonesia joined the global value chains in relatively upstream industries. Indonesia’s GDP per capita has also grown three times during the same period, though, this phenomenal growth has come through forward linkages in GVC participation. We can also notice that most of the other countries in ASEAN followed a similar pattern of achieving higher growth in GDP per capita as well as exports related to the GVCs.
Figure 7.6 shows that the share of foreign value added in gross exports of the domestic economy is not only increasing through importing more intermediate products but also through utilizing foreign services in exports. These foreign service pro-viders, being much more efficient than the domestic providers, also play a significant role in enhancing the competitiveness of the exports. It must be emphasized that different economies in ASEAN entered at different stages of GVCs and specialized in different industries (or possibly within the same industry but at different stages of production) based on the comparative advan-tage of the domestic economy. Most of the ASEAN economies have integrated well into the regional as well as global value chains depending on the relative comparative advantage of the domestic economy. This integration helped these economies to achieve much higher GDP growth and create millions of job opportunities for their workers and helped a significant propor-tion of the population to lift out of poverty.
In order to highlight the implications of directly targeting the DVA in exports as a national policy for development, we can compare Bangladesh and Pakistan’s approach towards the exports in the textile and clothing sector. The biggest exports of both countries have been textiles and clothing. In 1990, Ban-gladesh’s exports ($1.09 bn) were a third of Pakistan’s exports ($3.5 bn) in textiles and clothing. Since then, Pakistan, being a cotton producer, incentivized the textile producers to use the local inputs and export the finished products. Bangladesh, mostly importing the raw materials for textile and clothing, focused more on the trade reforms and opening up the economy to foreign investors. Bangladesh integrated its textile and cloth-ing sector in the global value chains, sourcing most of the raw material from abroad and exporting readymade garments to the developed world. This helped Bangladesh to slowly convert its comparative advantage in clothing into competitive advantage over time by using better quality inputs as well as foreign ser-vices by collaborating with the leading garments manufacturers. In 2016, Pakistan’s textile and clothing exports ($12.4 bn) were less than half of Bangladesh’s exports ($28.3 bn).2 Using John-son (2018), we can calculate the DVA in the Textile and Clothing sector for these two economies in 2014.3 Bangladesh’s DVA in the Textile and Clothing sector was 64.5% as compared to 80.3% for Pakistan.4 It can be seen that Bangladesh’s exports have risen much faster as compared to Pakistan despite having lower DVA in exports. As the labor costs are rising in China, many garment producers might look for opportunities abroad to relocate their plants. Bangladesh, being well integrated into the GVCs in tex-tile and clothing, the second biggest exporter of garments and offering lower wages, will be the first choice of these firms to relocate. The textile and garment sector in Bangladesh has also
FIGURE 7.5 GVC participation in Factory Asia
0
10
20
30
40
50
Singap
ore
Mala
ysia
Thail
and
Cambodia
Viet N
am
Philli
ppines
Indone
sia
Brune
i Darr
ussa
lm
Chines
e Taip
ei
Repub
lic o
f Kore
a
China
Hong K
ong, C
hina
Japan
Backward 1995 Forward 1995
Source: Lopez-Gonzalez (2016).

146 • Technological innovation, supply chain trade, and workers in a globalized world
helped to achieve twice the female labor force participation rate as that of India and Pakistan as nearly 85% workers are females in this sector. Bangladesh’s GDP per capita also surpassed Paki-stan’s GDP per capita in 2017.
Another good example of the contrast between global inte-gration and import substitution comes from the auto sector in Malaysia and Thailand, neighboring countries at similar stages of development. Malaysia tried to develop an indigenous auto industry and a national champion brand through protectionist policies, whereas Thailand strove to join GVCs around existing brands by attracting FDI from Japanese and American compa-nies. Thailand’s strategy enabled it to integrate into successful value chains and become a significant exporter of auto value added, primarily via parts. Malaysia’s effort did not produce a globally competitive car and eventually had to be abandoned (Wad 2009).
All the examples discussed above suggest that participation and integration into the GVCs help the economies to improve their trade competitiveness, achieve higher GDP per capita growth and improve female labor force participation despite fall-ing DVA in gross exports. Global technological advancement as well as falling trading costs have resulted in the fragmentation of production across borders. This reduction in trade costs helps the firms to exploit the comparative advantage of each country in the specific stage of production and hence, there is a reduc-tion in DVA in gross exports. The only country that has been able to buck the trend of global decline in DVA in gross exports despite increasing GDP per capita as well as rising exports has been China. China has been able to increase the DVA in exports
as well as achieve higher GDP growth rate since joining WTO. Tang et al. (2018) have suggested that the substantial improve-ment in technology in China, along with falling trade costs, have been the reason for the rising DVA in gross exports recently. China has also invested hugely in improving human capital in the last two decades to complement the advanced technology adoption by Chinese firms. Though, as we can see from the experiences of the Republic of Korea and Japan, this might be a short-lived phenomenon. Once the Chinese economy catches up in technology with other economies and achieves the maximum DVA in exports, rising labor costs and stringent environmental standards might push the firms to outsource the low value added segment in production to the other regions in the world to main-tain competitiveness by the exporting firms.
The regional experiences within China provide some addi-tional perspective on the relationship between DVA and level of development. Across Chinese provinces there is an inverted-U shape relationship in which DVA tends to rise with per capita GDP and then decline beyond a certain threshold (Figure 7.7). In general, the richest provinces in China have low ratios of domes-tic value added to exports. Beijing and Shanghai have particu-larly low ratios. But the export powerhouse of Guangdong also has a low domestic value-added ratio, and hence a high ratio of imported inputs. This is consistent with the view that export success requires access to the best inputs in terms of manu-factured parts and supporting services. As more Chinese prov-inces develop in the direction of the already successful ones, the national ratio of domestic value added to gross exports is likely to fall.
FIGURE 7.6 Service content of exports in Factory Asia
0
10
20
30
40
50
60
70
80
90
Singap
ore
Mala
ysia
Thail
and
Cambodia
Viet N
am
Philli
ppines
Indone
sia
Brune
i Darr
ussa
lm
Hong K
ong, C
hina
Japan
Chines
e Taip
eiChin
a
Repub
lic o
f Kore
a
Domestic service content 1995 Foreign service content 1995
Source: Lopez-Gonzalez (2016).

Should high domestic value added in exports be an objective of policy? • 147
These results have also been supported by the empirical anal-ysis for other developing countries in the literature. Using the manufacturing firms’ data from Indonesia, Amiti and Konings (2007) find that a 10% reduction in import (input) tariffs would lead to 12% productivity gains for the importing firms, at least twice as high as gains from reducing the output (final goods) tariffs. Interestingly, Goldberg et al. (2010) show that removing (or lowering) the import tariffs on newer inputs also assists the domestic firms to introduce newer products. They show that the lower input tariffs accounts for an average of 31 percent of the newer products introduced by domestic firms in India. Kugler and Verhoogen (2012) study the impact of quality of inputs and outputs on the plant size, in terms of employment, for Colom-bian manufacturing sector. They found that the more productive plants use higher-quality imported inputs as indicated by com-paring the price of domestic input in the same category by the same plant. They also showed that there is positive correlation between the quality of inputs and the plant size and the price of the output, an indicator of quality of the product. Since reducing
the import tariffs on intermediates will help the firms to import higher quality inputs, it will also help to increase the employ-ment in the plant, along with improving the quality of the output, irrespective of the firm being an exporting firm or producing for the domestic market. These results from the existing literature suggest that adding tariffs on the imported inputs will not only adversely affect the quality, employment and number of products of the firms in exporting sector but also of the domestic firms.
4. Policies for technological upgrading
Technological upgrading is an important part of the convergence process. Developing countries that are integrated into the global economy generally have had more rapid total factor productivity growth – our best way to measure technological advance – than the already developed economies. Developed economies are at the frontier and have to invent new technologies, which is costly and difficult. Developing countries can absorb already existing
FIGURE 7.7 Relationship between per capita GDP and the provincial VA rate of exportsIntra-provincial VA rate of export: %
Guizhou
Gansu
YunnanGuangxi
Anhui
Jiangxi
Sichuan
Henan
Hainan
QinghaiHunan
Shanxi
XinjiangHeilongjiang
Ningxia
Hebei
Shaanxi
Hubei
Chongqing
Jilin ShandongFujian
Guangdong
Liaoning
ZhejiangJiangsu
Shanghai
Beijing
25
35
45
55
65
75
85
8 8.2 8.4 8.6 8.8
LN(GDP per capita)
9 9.2 9.4 9.6 9.8
InnerMong
Tianjin
Source: Li et al. (2018).

148 • Technological innovation, supply chain trade, and workers in a globalized world
technologies through direct foreign investment and learning. As they progress, it is natural for developing countries to begin spending resources on inventing new technologies so the more advanced developing economies are both absorbing existing technologies and innovating new ones.
We have seen earlier in this chapter that, at certain stages of development, technological advance goes hand-in-hand with higher domestic value added content of exports. We see the causality here running from technological advance to GVC structure, not from domestic content to technological advance. The reason for this conclusion is that, for Japan, the Republic of Korea, and Chinese Taipei, as well as for the other technologi-cally advanced economies such as Germany and the U.S., the clear trend is for DVAR to fall. The most advanced technological economies are all extremely open, capitalist economies. Firms are choosing in competitive markets which inputs – goods and services – to source locally and which to source internationally. The result in all of these economies is more international sourc-ing over time.
We conclude from these patterns that it is reasonable for a developing economy to aspire to more rapid technological advance, which will contribute to higher living standards both directly and indirectly (because technological advance raises the return to investment and encourages capital accumulation). In certain periods, this may lead to an increase in the DVAR, but in the long run it is likely to lead to declines in DVAR as has been witnessed in all of the advanced economies. It is an easy mistake for developing countries to see the causality going the other way. If all else were equal, then increasing DVAR would mean more total value added and typically higher productiv-ity. The problem with this thinking is all else will not be equal.
Firms in competitive economies source goods and services internationally if they are superior in quality and/or lower cost. If a country artificially induces firms to source locally, it will reduce their competitiveness and lead to less total value added and productivity. From a policy point of view then, developing countries should encourage technological advance but remain indifferent to whether inputs are sourced locally or internation-ally. That is a choice best left to the firm. There are policies that countries can use to encourage technological innovation, such as support for STEM (science, technology, engineering, and mathematics) education, subsidies to R&D, intellectual prop-erty rights (IPR) protection, and openness to foreign trade and investment.
The leading countries in the world producing STEM gradu-ates are now China and India. In 2016 China produced almost 5 million STEM graduates (undergraduate and graduate com-bined), and India, nearly 3 million (Figure 7.8). This was far in excess of the 568,000 graduated in the U.S. Russia, Iran, and Indonesia also produced significant STEM graduates. This increasing pool of technical labor in emerging markets naturally encourages hi-tech industries to expand there, including the establishment of research centers. Aside from quantity of grad-uates, there is also the important issue of quality. Most of the top research universities in the world are in the U.S. and West-ern Europe, but Chinese and Indian universities are starting to climb the ranks. In 2018, 43 of the top 100 research universities in the world were in the U.S., followed by Continental Europe, Australia and Canada (Figure 7.9). China came next. The highest ranked universities from China were Peking University (#27) and Tsinghua University (#30). No Indian university has yet cracked the top 100.
FIGURE 7.8 Countries with the most STEM graduates (2016)
0 1,000,000 2,000,000 3,000,000 4,000,000 5,000,000
Japan
Indonesia
Iran
Russia
United States
India
China
Source: http://blogs-images.forbes.com/niallmccarthy/files/2017/02/20170202_STEM.jpg

Should high domestic value added in exports be an objective of policy? • 149
Emerging markets in general still spend very little on research and development. India, despite its success in certain hi-tech areas, spends only about half a percent of GDP on R&D. In fact, most emerging markets do not even report consistent data on R&D because it is such a small part of their economies. China is the notable exception. As recently as 2001 China spent less than 1% of GDP on R&D, but that figure has been climbing steadily in recent years and in 2015 China spent more than 2% (Figure 7.10). The advanced economies generally spend between 2 and 3% of GDP on R&D, and China has now joined that club. In both China and the U.S., about one-fifth of R&D is financed by the government, with the rest primarily coming from industry. This reveals that it is difficult for the government to have much direct effect on R&D. Subsidies, usually in the form on tax breaks, play some role. But, in general, R&D is based on corporate deci-sions which are influenced by availability of technical labor and other aspects of the policy environment.
One of the most important aspects of the policy environment for R&D is intellectual property rights protection. Since the vast major-ity of R&D funding comes from industry, it is aimed at developing commercial innovations – new technologies for providing goods and services. The logic of IPR protection is to provide a temporary monopoly for the innovator. This is necessary to create a financial incentive to innovate. If innovations could be instantly copied, then there would be no incentive for R&D. On the other hand, once inno-vations exist it is socially optimal for them to diffuse, and for that reason IPR protection tends to be temporary and imperfect, allow-ing reasonable offshoots to develop quickly. One of the striking
differences between the advanced economies and emerging mar-kets is in the quality of IPR protection. All of the top innovative economies score very highly on an index of IPR protection from the Intellectual Property Rights Alliance (Figure 7.11). Emerging markets such as Argentina, Brazil, China, India, Indonesia, and South Africa lag well behind. For countries like China that have made progress with the inputs of innovation, such as STEM graduates and R&D spending, improving IPR protection should be a key priority in order to get the greatest innovation output from the effort.
The most technologically advanced countries have seen their DVARs decline in recent years as they make proportionally more use of imported inputs. These economies also tend to have large shares of services in their exported value added. This rising service share reflects two factors: first, there is growing service content embodied in manufactured products, such as software in automobiles and appliances; second, as value chains become more fragmented, services such as finance, telecom, and trans-port are increasingly important in managing value chains. Given these trends, it is not surprising that the most technologically advanced countries tend to be very open to trade and invest-ment in services. In these sectors trade and investment tend to go together because it is hard to trade most services without an investment presence.
The OECD calculates a direct investment restrictiveness index for whole economies and for particular sectors. The advanced economies that make up the OECD are open in virtually all sec-tors. Emerging markets, on the other hand, tend to be fairly open in manufacturing but still somewhat closed in services such
FIGURE 7.9 Top 100 world research universities, by area (2018)
0 5 10 15 20 25 30 35 40 45 50
United States
Continental Europe
United Kingdom
Australia
Canada
China
Japan
Singapore
Source: The Times Higher Education World University Rankings 2018.

150 • Technological innovation, supply chain trade, and workers in a globalized world
as telecom and finance (Figure 7.12). This is particularly true for China, which overall is the most closed among major emerging markets. Countries such as India and Indonesia are not as closed as China, but far from OECD levels. Argentina, Brazil, and South Africa all tend to be more open. In the case of China, there is
firm-level evidence that the closed service sectors have low pro-ductivity levels and growth rates. Hence, the protected strategy consigns China to poor-quality services that then make it more difficult for other sectors, including manufacturing, to reach international quality.
FIGURE 7.11 IPR protection index (2018)
0
1
2
3
4
5
6
7
8
9
Argentina Brazil China India Indonesia South Africa U.S. Netherlands Japan
Source: https://www.internationalpropertyrightsindex.org/
FIGURE 7.10 R&D as a share of GDP (2015)
0
0.5
1
1.5
2
2.5
3
3.5
India China Netherlands Germany United States Japan
Source: World Bank (2018).

Should high domestic value added in exports be an objective of policy? • 151
Concerns that China is not as open as other major economies have been compounded by the Made in China 2025 program. This plan, from the Ministry of Industry and Information Technol-ogy (MIIT), aims to transform China into a hi-tech powerhouse and focuses on ten industries:• Artificial intelligence and quantum computing• Automated machine tools and robotics• Aerospace• Maritime equipment• Modern rail transport equipment• Self-driving and new energy vehicles• Power equipment• Agricultural equipment• New materials• Biopharma and advanced medicine
MIIT’s plans call for rising domestic content for these sectors. Other Chinese officials emphasize that these are indicative, not mandatory targets. Mandatory domestic content requirements would be a WTO violation. The IMF discussed these issues with Chinese authorities during the 2018 Article IV consultation: “The authorities stressed that their plan to develop strategic sectors would be market-based…. The authorities clarified that the gov-ernment did not set mandatory targets for domestic content…. They emphasized that domestic and foreign companies would be treated equally in China’s effort to update ins industrial sector, noting that industrial policies needed to be market-ori-ented.” (p. 22)
Still the Made in China 2025 program, along with China’s ongoing investment restrictions, have created some confusion about the direction of policy. China is likely to get the most out of its impressive investment in STEM students and R&D if it opens the remaining sectors of the economy and continues to improve IPR protection. If, alternatively, it tries to artificially pump up the domestic content of favored sectors, that is likely to be a recipe for slow technological advance and ongoing trade conflicts.
Every economy in the world has an opportunity to join GVCs irrespective of the type of human and physical capital available in the economy. If the domestic economy has relatively higher skilled workers like Singapore or Hong Kong, China, they will join the GVCs at higher value-added segment like designing or high-end services (like marketing, financial etc.). On the contrary, if the economy has relatively more unskilled workers, it would join the GVCs in lower value added segments like assembly and pack-aging. Even if the economy joins at the lower value-added seg-ment, it still helps the economy to generate more and better job opportunities for the unskilled workers. Every country needs to assess how skilled (or unskilled) the workforce is, which region it is located in and what comparative advantage it can exploit to join the GVCs in a specific sector. Once it is integrated, to enhance the value-addition (or move up the value-chain), follow-ing the Chinese example, the domestic economy needs to invest in upskilling workers, R&D and technology adoption by firms, as well as supporting ICT and physical infrastructure by convert-ing comparative advantage into competitive advantage. If the
FIGURE 7.12 FDI restrictiveness index for manufacturing, telecom, and financial services (2018)(0= open, 1= closed)
0 0.1 0.2 0.3 0.4 0.5 0.6 0.7 0.8
Finanserv
Telecomms
MfgOECD
South Africa
India
Indonesia
China
Brazil
Argentina
Source: https://stats.oecd.org/Index.aspx?datasetcode=FDIINDEX#

152 • Technological innovation, supply chain trade, and workers in a globalized world
economy tries to increase the DVA in exports by artificially sup-porting the inputs/intermediates by using tariffs and non-tariff measures, it will increase the cost of production and make the product less competitive in the international market, resulting
in reduced demand for the product as well as workers in the exporting sector and will also affect the productivity and quality of the domestic firms as well, adversely affecting the welfare in the society.

Should high domestic value added in exports be an objective of policy? • 153
Notes1. It is common practice to present the aggregate trend for domestic
content in exports, and then for manufacturing as most trade take
place in this sector. Following Johnson and Noguera (2016), the total
economy is grouped into four categories, Agriculture, Forestry, and
Fishing, Non-Manufacturing Industrial Production, Manufacturing,
and Services.
2. Though, this difference in policy is not the only reason for poor
exporting performance by Pakistan but one of the primary reasons.
During the same period, Pakistan experienced many security issues
and crippling power outages.
3. We are using 2014 as it is the latest year in GTAP (version 10) data-
base, recording the data for these two economies
4. The aggregate DVA for Bangladesh (67.6%) is also lower as compared
to Pakistan (82.6%) despite having higher total exports as well.
References
Amiti, Mary, and Jozef Konings (2007), “Trade Liberalization, Intermediate
Inputs, and Productivity: Evidence from Indonesia,” American Eco-
nomic Review 97 (5): 1611–38.
Bas, M. and V. Strauss-Kahn (2014), Does importing more inputs raise
exports? Firm-level evidence from France, Review of World Economics,
Vol. 150(2), pp.241-275.
Bas, M. and V. Strauss-Kahn (2015), Input-trade Liberalisation, export prices
and quality upgrading, Journal of International Economics, Vol. 95(2),
250-262.
Caesar B. Cororaton and David Orden, (2008) Pakistan’s cotton and textile
economy: Intersectoral linkages and effects on rural and urban poverty
No 158, Research reports, International Food Policy Research Institute
(IFPRI)
Claire Hollweg, Daria Taglioni, Tania Smith (2017) Viet Nam at Crossroads:
Engaging in the Next Generation of Global Value Chains
Dollar, D. (1992), Outward-oriented developing economies really do grow
more rapidly: Evidence from 95 LDCs, 1976-85. Economic Development
and Cultural Change 40 (3): 523-544.
Eaton J. and S. Kortum (2002), Technology, Geography and Trade, Econo-
metrica, Vol. 70(5), pp 1741-1779.
Goldberg, Pinelopi K., Amit K. Khandelwal, Nina Pavcnik, and Petia Topalova
(2010), “Imported Intermediate Inputs and Domestic Product Growth:
Evidence from India,” Quarterly Journal of Economics 125 (4): 1727–67.
International Monetary Fund. 2018. Article IV Consultation.
Johnson (2018), Measuring Global Value Chains, Annual Review of Eco-
nomics, forthcoming.
Kugler, Maurice and Eric Verhoogen (2012), “Prices, Plant Size, and Product
Quality,” Review of Economic Studies, vol. 79(1), pages 307-339.
Kummritz, V. (2014), Global Value Chains: Benefiting the Domestic Econ-
omy, IHEID Working Papers, 02-2015, Economics Section, The Gradu-
ate Institute of International Studies.
Levchenko, A.A. (2007), Institutional Quality and International Trade,
Review of Economic Studies, Oxford University Press, Vol. 74(3), pp.
791-819.
Li, S., J. He, H. Zhang, and L. Zhu (2018). “Should High Ratio of Value
Added to Gross Export Value Be an Objective of Policy – Based on
China’s Provincial Level Data,” working paper, Development Research
Center, Beijing.
Lopez-Acevedo, Gladys; Robertson, Raymond. (2016) Stitches to Riches? :
Apparel Employment, Trade, and Economic Development in South
Asia. Directions in Development--Poverty;. Washington, DC: World
Bank. https://openknowledge.worldbank.org/handle/10986/23961
License: CC BY 3.0 IGO.
Lopez Gonzalez, J. (2016), Using Foreign Factors to Enhance Domestic
Export Performance: A Focus on Southeast Asia, OECD Trade Policy
Papers, No. 191, OECD Publishing, Paris.
Melitz, M.J. (2003), The Impact of trade on aggregate industry productivity
and intra-industry reallocations, Econometrica 71, 1695-1725.
OECD. 2014. OECD International Direct Investment Statistics 2014, OECD
Publishing, Paris, http://dx.doi.org/10.1787/idis-2014-en
R. Johnson and G. Noguera (2016). A Portrait of Trade in Value Added over
Four Decades. NBER Working Paper No. 22974.
Region’s Input-Output Tables for the Republic of Korea, Japan, and Chinese
Taipei, various years.
Tang, Heiwai; Qi, Steffan; Lai Edwin (2018) Global Sourcing and Domestic
Value Added in Exports Working paper
Wad, P. 2009. “The Automobile Industry of Southeast Asia: Malaysia and
Thailand,” Journal of the Asia Pacific Economy, Volume 14, Issue 2.
The World Bank. 2018. World Development Indicators 2018.
U.S. Chamber of Commerce. 2017. Made in China 2025: Global Ambitions
Built on Local Protections.
World Integrated Trade Solution


155
CHAPTER 8
Improving the accounting frameworks for analyses of global value chainsNadim Ahmad (OECD)
ABSTRACT
The use of global input-output tables, and the creation of Trade in Value-Added (TiVA) statistics, has greatly improved our understanding of the fragmentation of global production through value chains. However, their application requires a number of assumptions that, in practice, typically understate the degree of interconnectedness. TiVA estimates implicitly assume identical production functions across firms within an industry, when in reality production functions differ consid-erably. Typically, larger (and foreign-owned) firms tend to be more trade oriented than smaller (and domestically-owned) firms. As a result, TiVA statistics underestimate the import
content of exports for the economy as a whole, a key indica-tor characterizing global production. Moreover, TiVA analyses are based on basic price concepts, which provide an appro-priate view of production through value chains, but are less well equipped to analyse consumption, particularly as they exclude significant distribution margins (in particular retail and wholesale activities, often including marketing activities and brands), which add value at the end of the chain. This can distort analyses using “smile curves”, which show the distance from final demand of different sectors within value chains, and in turn understate the scale of jobs supported by trade.
• Trade in Value-Added (TiVA) statistics have greatly improved our understanding of GVCs, but they use assumptions that generate typically downward biases in measures of GVC integration, and they give little information regarding the investment strand of GVCs.
• Efforts to mainstream key characteristics of different types of firms in the production of tomorrow’s TiVA models, through extended supply-use tables, should be prioritized, to improve not only their relevance, but also their quality.
• Efforts to complement TiVA estimates currently based on basic prices with estimates based on market prices should also be initiated, not only to ease interpretability, but also to highlight the significant role played by distributors and to better understand the role played by intellectual property. Market-based approaches, for example, reveal that 9 million jobs are sustained in the United States through sales of imports.

156 • Technological innovation, supply chain trade, and workers in a globalized world
1. Introduction
The proliferation and development of global input-out-put tables in recent years has significantly transformed our ability to interpret global production. But import-ant though such initiatives have been, it is important to
recall that they are analytical tools, requiring implicit and explicit assumptions on the detailed interactions of consumers and pro-ducers, and indeed, in their current form are silent on many driv-ers of globalization, such as the role of multinationals, and on impacts, for example with respect to “inclusive globalization”.
Trade in Value-Added (TiVA) estimates, derived through the construction of a global input-output table, implicitly assume that all firms within a given sector have the same production function (input-output technical coefficients), import intensity and export intensity.
This of course has never been true. We know for example that larger firms will typically have different production functions to smaller firms, because of economies of scale, and also higher labor productivity. And these firms will also typically be more export- and, indeed, import-orientated than their smaller coun-terparts (reflecting in part the disproportionate costs of trade faced by smaller firms compared to larger firms). The same gen-eralizations hold true for foreign-owned enterprises, or enter-prises with affiliates abroad, compared to purely domestic firms; for example, the foreign content of exports by foreign-owned firms in the other transport equipment sector in the United States is twice that of domestically-owned firms.
That is not, of course, to say that the underlying conceptual basis for TiVA is incorrect. If, for example, global input-output tables were compiled at the firm level, with appropriate break-downs to reflect the specific products and the (often differential) prices paid by consumers (as well as differences in transportation costs), then the corresponding results would accurately reflect the underlying reality they seek to measure. But, for many prac-tical reasons1, this is some way off what happens in practice. Fur-ther, the inability to capture this heterogeneity in current TiVA measures is increasingly compounded by additional complexi-ties, notably the increased scope for multi-nationals (MNEs) to maximize global profits by recording intra-firm transactions in knowledge-based services in a way that is most advantageous to the firm. In practice this means that these types of intrafirm trans-actions can be recorded explicitly as cross-border trade or (and so outside of the TiVA system) as primary income flows.
But this is not the only area where there are challenges with the use of current TiVA statistics. Because inter-country input-output tables value transactions at basic, and not market, prices, many of the related TiVA analyses reveal only part of the story. For example the US domestic value-added content of its exports of textiles and clothing, in free-on-board (F.O.B.) prices, was around 20% in 2016 using market prices, compared to 3% using the pure basic prices approach. The basic price approach also limits the scope to reveal additional dependencies related to globalization, for example jobs sustained in retailers through sales of imports.
This chapter highlights the importance of developing exten-sions to current TiVA frameworks (Section 2) that are better able to capture firm heterogeneity, and, in turn, better high-light the importance of multinational enterprises (MNEs) within GVCs. It also explores the development of a complementary accounting framework in “market” prices and tries to illustrate the insights that can be gained through such an approach (Section 3). In the United States the sale of imports generated an additional 840 billion USD of US value-added in 2016, sup-porting 9.0 million jobs.
2. Accounting frameworks for global value chains: extended supply-use tables
2.1 Overview The increasing international fragmentation of production that has occurred in recent decades driven by technological progress, reductions in trade costs, improved access to resources and mar-kets, trade policy reforms, and indeed cost factors in emerging economies, has challenged our conventional wisdom on how we look at and interpret globalization. For example, traditional mea-sures of trade record gross flows of goods and services each and every time they cross borders, leading to what many describe as a “multiple” counting of trade, which may lead to misguided policy measures in a wide range of policy areas. In response to this, the international statistics community has begun to develop new measures of trade on a value added basis, for example the OECD-WTO TiVA database, WIOD, APEC-TIVA and the Euro-pean FIGARO initiative.
But important though such initiatives are, they are only able to respond to one aspect of the globalization debate. Significant attention, for example, is focused on the role of multinationals in this new landscape, and, on this, with the exception of recent exploratory initiatives2, current available, and in particular offi-cial, statistics that follow the TiVA approach are silent. Of particu-lar relevance in this context is the ability of multinationals to shift intellectual property products, such as software and R&D, from one economic territory to another, raising broader questions on the ability of GDP to accurately describe “meaningful” economic activity, with concomitant impacts on other macro-economic sta-tistics, including TiVA. For example, TiVA measures purport to show how (in which industries) and where (in which territories) value is generated in the production of a good or service. The simple relocation of an intellectual property product from one economic territory to another3 can radically alter that view.
In addition, the policy debate in recent years has increasingly focused on what has become referred to as “inclusive global-ization”, i.e. the growing realization that the benefits of global-ization may not have accrued to all members of society equally, even if only as a process of transition. The challenges of inclusive globalization require that the impacts on people (in other words, workers) are also captured in our statistics. This requires infor-mation on skills, occupations, and compensation paid to these categories of workers.

Improving the accounting frameworks for analyses of global value chains • 157
2.2 Improved accounting frameworks for GVC analyses More fundamentally, there is a growing appreciation that the sta-tistical compilation tools and accounting frameworks designed and developed over the last 60 years in various manifestations of the System of National Accounts (SNA), despite their significant advances, may reflect a world that no longer exists.
In the early days of the SNA, the rest of the world was recorded as a separate institutional sector to and from which goods were sold and bought; and such a view was largely suf-ficient. But over the years as global production chains and inter-connectedness grew, there was a growing realization that addi-tional information was needed to properly navigate around the economic landscape, which resulted in the development of new areas of statistics, such as foreign direct investment measures and data collections focusing on inward and outward activities of foreign affiliates statistics (FATS). More recently new data col-lections, or rather compilations, have focused on linking trade and business registers to provide insights on which firms in which sectors engage in imports and exports (referred to as Trade by Enterprise Characteristics).
These more recent innovations have significantly improved our collective understanding of trade, and indeed investment, but they are still to a large extent only a partial solution to the statistical challenges presented by globalization.
The development of TiVA type statistics is certainly a step forward in this area, but these too suffer from the stove-pipe approach. TiVA estimates, derived through the construction of a global input-output table, implicitly assume that all firms within a given sector have the same production function (input-out-put technical coefficients), import intensity and export intensity.
This of course has never been true. We know for example that larger firms will typically have different production functions than smaller firms (because of economies of scale) as well as higher labor productivity. And these firms will also typically be more export- and, indeed, import-orientated than their smaller coun-terparts (reflecting in part the disproportionate costs of trade faced by smaller firms compared to larger firms).
The same generalizations hold true for foreign-owned enter-prises, or enterprises with affiliates abroad, compared to purely domestic firms; indeed in many countries MNEs account for the lion’s share of overall trade (Figure 8.1). But TiVA estimates, rely-ing as they do on national Supply-Use and Input-Output tables, cannot reflect these heterogeneities; meaning that key mea-sures, such as the import content of exports are typically down-ward biased.
Moreover, the very process of globalization has increased the scale of these heterogeneities, driving coach and horses through the assumption of homogeneity within sectors. As firms within sectors increasingly specialize in specific tasks in the production process, they also suck in greater imports from the upstream part of the value chain and have greater export orientation. In addition globalization has itself led to an increased prevalence of (once rare) categories of firms such as Factoryless Producers and Processers, where recent changes in the accounting system fur-ther weaken the case for assumptions of homogeneity in techni-cal coefficients. For example, all other things being equal, a pro-cessing firm in one sector will have significantly less (recorded) imports than a non-processing firm producing the same final product. Similarly, a Factoryless Producer will be allocated to the distribution sector (with limited intermediate consumption of
FIGURE 8.1 Foreign-owned firms across economies (2011)
0%
10%
20%30%
40%50%
60%70%
80%
90%
Austri
a
Czech
Rep
ublic
Estonia
Finlan
dFr
ance
German
y
Hungary Ita
ly
Luxe
mbourg
Polan
d
Portu
gal
Slova
k Rep
ublic
Swed
en
United
King
dom
Foreign controlled as % of firms % exports % imports
Note: Foreign-owned firms are defined according to FATS/AMNE 50% thresholds.
Source: OECD Trade by Enterprise Characteristics.

158 • Technological innovation, supply chain trade, and workers in a globalized world
goods) but the same firm that chooses to buy the material goods used by the processing firms will be allocated to the manufactur-ing sector (with significant intermediate consumption of goods).
The ability of national (and international) Supply-Use and Input-Output tables, based on industrial groupings alone, to describe how demand and supply relationships are related has therefore become more difficult. Typically, in confronting the problem of heterogeneity, the conventional approach has been to provide more detail by aggregating firms at lower levels of the industrial classification system, for example 3 or 4 digit group-ings as opposed to two digit groupings, subject to confidenti-ality restrictions being preserved. But this approach may not be optimal, neither in terms of reducing heterogeneity within aggre-gations (and in a way that best responds to the policy drivers) nor necessarily in terms of processing burdens.
That is not to say that industrial classification systems are completely obsolete. It would serve little purpose for example to devise an optimal system that did not retain some means of classifying firms on the basis of their activity, (e.g. manufacturing versus services) if only because these remain the key prisms that users look through when analyzing production. But it does serve to highlight that other approaches to tackling heterogeneity can, and should, be considered.
Arguably a more radical approach is needed. Such an approach requires that the role of foreign affiliates in the economic territory, which is significant in many economies, Figure 8.2, and affiliates abroad are captured explicitly (and visibly) in the core accounts and in the development of GVC-related (i.e. TiVA) indicators. It also requires improved information on the trade relationships of categories of firms (for example exporter and non-exporter). Equally important is the need to fully articulate income flows in
and out of the economy and, in particular, from which category of firms (e.g. industrial sector) these arise.
In this sense it is important to note that value added essen-tially reflects two main components4 – (i) operating surplus (including mixed income), or compensation for capital, and (ii) compensation for employment. While the latter component largely reflects the direct benefits that accrue and “stick” within the economy through production5 the case is not so clear for the former, where foreign affiliates are concerned.
In perfect markets the operating surplus generated by foreign affiliates is equivalent to the return on produced “tangible” and “intangible” capital and also non-produced assets used in pro-duction6. While the National Accounts of countries attribute the ownership of this capital to the affiliated enterprise, the ultimate beneficiary of the operating surplus is not necessarily the affili-ate but its parent. This has raised questions – often in emerging economies but also in developed economies – about the actual benefits of foreign MNEs to the host economy. Indeed, more recently it has begun to raise questions about the meaningful-ness of GDP itself as a tool for macro-ecomomic policy making.
Particularly important in this regard are transactions in intan-gible assets: those recognised as produced in the SNA (such as research and development, software, etc.), non-produced (such as brands) and also other knowledge-based capital (such as organizational capital, e.g. management competencies). Often, in international trade in services statistics, payments for the use of these produced and non-produced assets are recorded as purchases (intermediate consumption) by one affiliated enter-prise from another. But often they are not, and instead they are implicitly recorded under primary income payments (such as investment income, or reinvested earnings in the Balance of
FIGURE 8.2 Value Added at Factor Cost of Foreign Affiliates – share of national total, 2014 (ISIC B-N, ex K)
0%
10%
20%
30%
40%
50%
60%
Hungary
Luxe
mbourg
Slova
k Rep
ublic
Czech
Rep
ublic
Estonia
Polan
dLa
tvia
United
King
dom
Belgium
Nethe
rland
s
Norway
Swed
en
Austri
a
Slove
nia
Portu
gal
German
y
Finlan
d
Denmark
Spain
Fran
ceIta
ly
Greec
e
Source: OECD AMNE database.

Improving the accounting frameworks for analyses of global value chains • 159
Payments). In the former case, the value added of the affiliate using the assets is lower, as the value added generated through ownership of the asset appears on the accounts of the affiliate that owns it. In the latter case, however, the value added of the affiliate using the asset is higher (as there is no intermediate consumption) with the “ultimate” beneficiary (the owning affiliate) recording no value added but instead recieving primary income from the using affiliate. In both cases, however, the ultimate “income” generated by the asset ends up on the books of the owner (at least in theory, as even the very notion of the ultimate onwer is a complex issue).
Furthermore, the distinction between the two scenarios above is often clouded by (a) the ability of the statistical information system to record the flows and (b) transfer pricing and tax incen-tives of MNEs. Indeed, in some countries where foreign affiliates generate significant value added and repatriate significant prof-its back to parent companies the policy focus has switched from GDP to GNI, and indeed in some countries, such as Ireland, to new accounting concepts7.
This is not however an issue singularly related to knowl-edge-based assets. Transfer pricing is also prevalent in trans-actions related to goods. Moreover, notwithstanding these issues, significant income flows generated by an affiliate can be repatriated to parents via other means, for example as interest payments.
The tool advocated in the SNA for ensuring coherence across various data sources to assure alignment of GDP estimates cre-ated by the income, expenditure and production approach is supply-use tables, the same underlying core statistical input required for TiVA estimates. As shown in this chapter, through (in principle) simple extensions to conventional supply-use tables, Extended Supply-Use Tables (ESUT) provide the ideal basis for bringing together these various domains into a single, integrated economic accounting framework that puts the measurement of the “global” at the heart of the “national”.
2.3 National examples of extended supply-use tablesIt is important to stress that the recognition that greater hetero-geneity (disaggregation of firms) within national supply-use and input-output tables is not of course new. It stands to reason that more detailed tables will produce better results. Indeed Chap-ter 14 of the 2008 SNA provides a presentation of Supply-Use tables that differentiate production on the basis of market output, non-market output and production for own-final use. Historically and certainly prior to the explosion in GVCs, capturing hetero-geneity was typically achieved through more detailed splits of industries. What has changed in recent years is the greater appre-ciation that a focus on the industries of firms is not necessarily best nor indeed optimal. Indeed, in 2011, even before the OECD-WTO released their first TiVA database in January 2013, it had become clear that a new approach to heterogeneity was needed, in particular one that focused on the role of MNEs.8
These earlier discussions, and indeed the first release of TiVA, highlighted the importance of looking anew at national statistics compilation systems, with the OECD moving, in 2014, to create a new expert group of countries that would begin to develop what have become known as ESUTs; in other words accounting tools for a coherent view of trade, investment, income and production (for a detailed exposition of the accounting framework of ESUTs see Ahmad 2018). What follows below are national examples9 illustrat-ing the potential (and indeed actual for China and Mexico, whose extended tables are already integrated into the OECD-WTO TiVA database) impact of improved heterogeneity on TiVA estimates.
Results for ChinaChina has worked to develop extended supply-use tables that differentiate between three categories of firms – exporters oper-ating within the Customs Processing regime, other exporters, and non-exporters. Figure 8.3 below reveals significantly dif-ferent movements in the trend of the foreign content of China’s
FIGURE 8.3 Foreign value-added content of China’s exports
0
10
20
30
40
1995 2000 2005 2008 2009 2010 2011
With split for processing firms (ESUT)
Without split for processing firms
Source: OECD-WTO TiVA (May 2013 version).

160 • Technological innovation, supply chain trade, and workers in a globalized world
exports over the last two decades when comparing esti-mates based on extended SUTs (referred to as ICIO) and pure national tables without a breakdown (referred to as national).
Results for MexicoMexico (Instituto Nacional de Estadística y Geografía – INEGI) have produced a categorization of firms referred to as global manufacturers10 that: a) import the majority of their purchases (imports account for at least 2/3 of their export value); b) produce only for exports; and c) are controlled by a foreign owner. These global firms were responsible for 55% of total
imported intermediate consumption and for 71% of gross exports of the Mexican manufacturing sector in 2008. Almost by definition the import content of Mexico’s global manufac-turing (GM) firms is significantly higher than comparable firms in the same sector. This can have a significant difference on highly policy relevant indicators, for example, on measures of the US content of Mexico’s exports (Figure 8.4), where one-quarter of the exports by GM firms in the motor vehicle sector reflect upstream US contributions, compared to around half that amount for non-GM firms; this relationship is seen across most activities.
FIGURE 8.5 Foreign content of US exports, % (2011) (selected industries)
0
5
10
15
20
25
30
Computer,electronic and optical products
Electrical machinery
Motor vehicles Other transportequipment
Total economy
Non-MNE
Domestic MNE
Foreign MNE
Source: Based on the US Extended SUT.
FIGURE 8.4 US value added content of Mexico’s exports % (2011)
Domestically owned
Global manufacturers
0%5%
10%15%20%25%30%35%40%
Food
Texti
les
Wood
Paper
Petro
leum
Chemica
ls
Rubber
and p
lastic
s
Non-met
als
Met
als
Met
al pro
ducts
Mac
hiner
y n.e.
c
Computer
and el
ectro
nics
Electri
cal e
quipmen
t
Moto
r veh
icles
Other
tran
sport
equip
ment
Other
man
ufactu
ring
Source: Based on Mexico’s Extended SUT.

Improving the accounting frameworks for analyses of global value chains • 161
Results for the United StatesThe United States (Bureau of Economic Analysis) has developed Extended SUTs with a three-way classification of firms reflecting ownership structures, that differentiate between foreign-owned affiliates operating in the US, domestically-owned MNEs, and domestically-owned firms with no affiliates abroad.11 Results for the United States also reveal significant differences between the foreign content of exports across categories of firms defined by ownership structure. At the whole economy level the foreign con-tent of US exports by foreign-owned firms is almost twice that of domestically-owned non-MNEs. This partly reflects compositional effects, but the foreign content is higher across nearly all activities (Figure 8.5)
Results for Costa Rica A similar picture of strong heterogeneity emerges for Costa Rica, whose ESUT differentiates between firms operating from free trade zones (referred to as RE in Figure 8.6) and firms operating outside of foreign trade zones (FTZs) (referred to as RD). The results show that RE firms have a higher import content of exports than RD firms across a range of important export activities.
Results for CanadaResults from a recent collaboration between the OECD and Statistics Canada reveal that the impact of compiling ESUT esti-mates for the business sector, accounting for either ownership or trading status, was an increase in the overall foreign value added content of Canada’s exports of 4 percentage points. Figure 8.7, which shows that foreign-owned firms are responsible for a lower share of exports in value-added terms than in gross terms, high-lights this higher propensity to import by foreign-owned firms, and, of course, the importance of capturing improved firm het-erogeneity in national SUTs.
Results for Nordic countriesIn a recent collaboration between 5 Nordic countries (Denmark, Finland, Iceland, Norway and Sweden) and the OECD, the OECD developed extended SUTs with three variants of firm breakdown: • By size class: micro, small, medium and large, further broken
down by whether the micro, small and medium firms were independent or part of a larger enterprise group.
• By trading status: non-traders, two-way traders, importers and exporters
FIGURE 8.6 Foreign content of Costa Rica’s exports, % (2012)
Total RE RD
0%
10%
20%
30%
40%
50%
60%
70%
Agricult
ure
Mini
ng
Food p
roduc
ts
Texti
les an
d appare
l
Wood an
d pap
er
Chemica
ls an
d mine
rals
Met
als an
d met
al pro
ducts
Mac
hiner
y
Electri
cal e
quipmen
t
Tran
sport
equip
ment
Who
lesale
, ret
ail, h
otels
& resta
uran
ts
Tran
sport
and te
lecoms
Finan
ce an
d insu
rance
Busine
ss se
rvice
s
Finan
cial m
anag
emen
t
Office s
upport
activ
ities
Other
servi
ces
Source: Based on Mexico’s Extended SUT.

162 • Technological innovation, supply chain trade, and workers in a globalized world
FIGURE 8.7 Share of gross and value-added exports by ownership status, % (2010), Canada
Agricult
ure,f
orestr
y,
fishin
g and hu
nting
Mini
ng an
d oil
and g
as ex
tracti
onUtili
ties
Constru
ction
Man
ufactu
ring
Who
lesale
trad
e
Retail
trad
e
Tran
sporta
tion
and w
areho
using
Inform
ation a
nd
cultu
ral in
dustri
es
Finan
ce,in
suran
ce
and re
al es
tate
Other
priv
ate se
rvice
s
Total
bus
iness
secto
r
0.1
0
0.2
0.3
0.4
0.5
0.6
0.7
0.8
0.9
1.0
Foreign value-added exports
Foreign gross exports
Domestic value-added exports
Domestic gross exports
Source: OECD/Statistics Canada.
FIGURE 8.8 Exports in gross and value-added terms, % (2013), by ownership structure
0%10%20%30%40%50%60%70%80%90%
100%
Gross exports Value added of exports
Gross exports Value added of exports
Gross exports Value added of exports
Gross exports Value added of exports
Denmark Finland Norway Sweden
Non-MNEs Non-MNEs, direct exports
Non-MNEs, indirect exports via other non-MNEs Non-MNEs, indirect exports via domestic MNEsNon-MNEs, indirect exports via foreign-owned MNEs Domestic MNEs
Foreign-owned MNEs
Source: Nordic Countries in global value chains, 2017.

Improving the accounting frameworks for analyses of global value chains • 163
• By ownership status: non-MNEs, domestic MNEs and foreign MNEs.Highlights from this collaboration are presented below as Fig-
ures 8.8-10. Figure 8.8 reveals the significant upstream integration of non-MNEs across all countries, compared to integration seen looking purely at gross trade relationships. Of particular note is the fact that in all countries bar Sweden this integration is primarily channeled via domestic MNEs; in Sweden the main link is through
foreign-owned MNEs, in large part reflecting scale. Figure 8.9 presents a similar picture showing the higher integration of smaller firms in GVCs when seen in value-added terms, through their upstream integration as suppliers to larger exporting firms. Figure 8.10 presents information on jobs sustained through inte-gration in GVCs. A significant insight from this presentation is the fact that even within firms that have no direct exports, around one in six of all jobs in these firms are dependent on foreign markets.
FIGURE 8.9 Exports in gross and value-added terms, % (2013), by size class
Gross exports Value added of exports
Gross exports Value added of exports
Gross exports Value added of exports
Gross exports Value added of exports
Independent - Micro Dependent - SmallIndependent - Small Dependent - Medium
Independent - Medium LargeDependent - Micro
0%
10%
20%
30%
40%
50%
60%
70%80%
90%
100%
Denmark Finland Norway Sweden
Source: Nordic Countries in global value chains, 2017.
FIGURE 8.10 Jobs embodied in exports, % of total (2013), by trading status
0%10%20%30%40%50%60%70%
Expo
rter
s
Impo
rter
s
Two-
way
trad
ers
Non
-Tra
ders
Expo
rter
s
Impo
rter
s
Two-
way
trad
ers
Non
-Tra
ders
Expo
rter
s
Impo
rter
s
Two-
way
trad
ers
Non
-Tra
ders
Expo
rter
s
Impo
rter
s
Two-
way
trad
ers
Non
-Tra
ders
Denmark Finland Norway Sweden
Direct exports Indirect exports
Source: Nordic Countries in global value chains, 2017.

164 • Technological innovation, supply chain trade, and workers in a globalized world
2.4 Concluding commentsThe statistical challenges of globalization are profound, and it has become increasingly clear in recent years that conventional approaches used to understand how economies work can no longer rely solely on national statistics. Increasingly, in order to understand how economies work and how to target and create industrial policies focusing on competitiveness, it is necessary to see the whole. National statistics build pictures based on interrelationships between producers and consumers and the rest of the world. But these relationships, particularly those with the rest of the world, have become increasingly more complex, and, as such, there is an increasing need to consider global production within a global accounting framework. This implies a departure from the traditional role of international organi-zations as compilers of internationally comparable national statistics, such as national input-output or supply-use tables. Instead, it requires that they bring together these national tables to create a global table.
Although TiVA estimates have been able to shed important light on our understanding of international trade and its rela-tion to activity and competitiveness, in particular the impor-tance of recognizing the importance of imports to exports, and, so, the hitherto hidden costs of protectionism as well as the benefits of trade liberalization, particularly in services, they do not reveal the full picture. With significant shares of exports being driven by foreign affiliates, TiVA estimates have also revealed the importance of going beyond just value added towards income, in order to capture flows outside of conven-tional international trade statistics, such as the repatriation of profits related to the use of non-produced knowledge-based assets (e.g. brands) and, indeed, the repatriation of profits related to the use of produced knowledge-based assets (e.g. software) that are (often incorrectly) not recorded as receipts from exports of services.
The emergence of global value chains therefore also raises arguably profound questions about the way national statistics are currently compiled. In the same way that international orga-nizations increasingly need to think “national” in the way they present and compile their statistics, where “national” reflects the single economic territory comprising the “world” or large parts of it, national statistics institutions need to think global.
In other words, in the construction of national statistics greater emphasis is needed on the role of the rest of the world, both as a source of demand and supplier of demand but also with regards to the role of multinationals. This requires a rethink of the way that firms are currently aggregated within statistical information systems, to move beyond the classic aggregation based almost exclusively on industrial classification systems towards more meaningful aggregations that better reflect today’s “global factory”.
Such considerations are also essential not only to better understand the way that global production is today organized but also to better understand how investment drives global value chains, and in particular how that very same investment can lead to difficulties in interpreting trade flows as well as GDP.
Extended Supply-Use tables provide an effective tool to respond to these developments and growing needs. Increas-ing globalization of production raises challenging questions for national statistics. And fundamental and long-standing axioms regarding the nature of production and the way that statistics are necessarily compiled warrant a rethink. Certainly the evidence suggests that long-standing assumptions concerning homoge-neity of firms within industry classifications should be reviewed. The evidence also suggests, particularly for those countries with FATS and TEC data, that an optimal level of aggregation may be achievable without any significant increase in compilation or reporting burden. But, of course, such reconsiderations need also take into account constraints such as burdens and confidentiality.
Supply-Use tables have become the conventional route with which coherent estimates of the national accounts, trade and production are now systematically compiled in many countries and lend themselves as being the ideal way in which to resolve these issues. Extended Supply-Use tables can play a similar role in responding to questions on globalization.
Three final comments, providing a broader perspective, are worth making in this respect. The first concerns the quality of national supply-use tables. In many (most) countries, such tables are derived using a series of assumptions at least in some years, reflecting in part the often different periodic nature of the large number of datasets needed to construct SUTs. Many of these assumptions are based on some underlying view of stability and homogeneity in production functions. As shown, globalization is increasingly undermining the strength of these assumptions. Looking again how the homogeneity is likely to manifest itself across firms and creating SUTs based around these categori-zations of firms can greatly help to mitigate these effects and strengthen these assumptions, which will remain necessary, per-haps indefinitely, across most countries. As such, one important benefit of extended SUTs that should not be overlooked is their ability to improve the quality of the core accounts, and indeed GDP. In the same way they are also ideally placed to be able to significantly improve the interpretability of the accounts, in par-ticular, when the accounts are affected by phenomena related to globalization, such as relocations.
The second comment concerns the potential momentum extended SUTs could provide to the development and improve-ment of statistical business surveys. The evidence shows that significant heterogeneity exists across all categories of firms, and that the conventional stratification variables used in survey sampling (typically activity and size) may be sub-optimal. It may for example be necessary to include additional, but readily avail-able, stratification variables, pertaining for example to ownership (e.g. part of a foreign MNE, domestic MNE, an enterprise group, exporter, non-exporter) in designing tomorrow’s surveys.
The third comes back to the issue of the statistical unit. The current 2008 SNA preference for the establishment should not be a barrier to developing extended SUTs. If for example these can only be developed using a different statistical unit, then countries are strongly encouraged to consider doing so. There is an increasing recognition that the arguments for the current SNA

Improving the accounting frameworks for analyses of global value chains • 165
preference for the establishment have been weakened because of the changing nature of production and indeed because of the changes made in the SNA itself regarding economic ownership. This is further recognized in the 2008 SNA Research Agenda, where explicit references are made for the need to reconsider the establishment preference, taking into account the “basic source information” and changes in the underlying accounting principles of “Input-Output” tables, whose emphasis has moved from a physical perspective to an economic perspective.
3. A new look at trade in value-added and global value chains: a view from the consumption perspective – what the accounting framework doesn’t tell you
3.1 OverviewIn the SNA the recommended price basis for producers, and so, de facto in input-output tables, consumers, is the concept of Basic Price12. In very simple terms this is equivalent to the fac-tory gate price, and so excludes any distribution margin not sub-sumed in the original invoice price of the producer, and that are included in the price paid by the final consumer. Also excluded are any taxes paid or subsidies received on the product sold.
Although superficially benign, the distinction between basic and purchasers prices matters, especially for GVC analysis. Export prices are measured on a free on board (F.O.B.) basis and include any distribution services related to delivery from the factory gate to the port, and organized by the producer, but for input-output tables in basic prices (when these margins are sep-arately invoiced by the producer to the consumer or provided by an intermediary that purchases and then exports the goods) they are removed from the F.O.B. price and are instead re-allocated as separate exports of distribution services (typically recorded as output of transportation services and/or output of the retail/wholesale sector).
On average these margins can be significant13, ranging at around 10 and 15% across countries, and over 30% in Greece, with significant differences by specific product, for example 140% and 216% for textiles and clothing in the United King-dom and Sweden respectively and 310% for pharmaceuticals in Greece (Figures 8.11A and B).
Moreover, with respect to international input-output tables, a focus on the distribution margin provided in delivering a good from the factory gate to the customs frontier understates the size of the problem related to the use of the basic price concept, as global input-output tables will also reallocate (to the distribution sector/product) the distribution margin related to the transpor-tation of the good from one frontier to another, and in turn the final distribution margin related to delivery from the frontier to the final consumer.
In effect input-output tables at basic prices treat distribution services as if they reflected the acquisition of a separate product. The rationale is that this creates an equivalence with prices paid by consumers when they independently organize the distribution
service (and which, by definition, are excluded from the F.O.B. price of the exported product, and indeed the cost, insurance and freight (C.I.F.) price of an imported product). But this con-vention is by no means a panacea.
Larger enterprises within affiliated supply chains for exam-ple are more likely (than independent smaller enterprises say) to include the costs of distribution in the basic price they charge (whether these are produced using in-house services or pur-chased from third parties), and so, in these circumstances, no adjustments will be made to arrive at a basic price estimate, which will be equivalent to the F.O.B. price. So, as can be seen, sometimes the distribution services are included in basic price measures and sometimes they are not, depending on how the original producer chose to invoice them.
But this is not the biggest issue here: the removal of the margin generates an alternative perspective of the value of what is being traded (and Figure 8.11A reveals that this can be sig-nificant) both from the exporting country’s perspective and the importing country’s (exacerbating complications raised by the fact that import prices typically also include international distri-bution margins).
For any given export of a good therefore, because the domes-tic content of distribution services is typically high, the share of domestic content of exports for a given good will be lower when measured on a basic price basis than compared to estimates on a F.O.B basis (although, in theory, for exports of total, whole econ-omy, goods and services, the ratios should align) (see, for example, Figure 8.12). Similarly looking at imports of a particular good into an economy, a basic price measure will show a significantly smaller (often implausibly low) contribution from the distribution and transportation sector, compared to C.I.F measures. Basic price concepts also complicate and hamper analyses of the multiplica-tive impact of tariffs, as, in a basic price format the rates, which are usually applicable to a C.I.F. price, will instead be applied to a lower basic price; this underestimates the overall impact of tariffs.
Figure 8.1314 reveals the impact that different price bases can have in interpreting the decomposition of value in GVCs by looking at the domestic services content of textiles exports. In the United Kingdom and Sweden for example the domestic services content jumps to around 70% compared to around 20% using the basic price concept. On average, across countries the domestic services content of exports increases by around 15 per-centage points.
Of particular interest in this respect is the contribution made by the distribution sector (transport, retail and wholesale) in the overall production of a given product, which is noticeably lower using the basic price concept (with well over half of the increase in domestic services value-added content reflecting distribution services in most countries).
The upshot is that by decoupling the distribution costs involved in transporting a good from the factory gate to the cus-toms frontier from the production costs of the good, the basic price concept creates an arguably downward-biased estimate of the overall contribution of exports of that good to the local economy. Exacerbating this downward bias is the fact that the

166 • Technological innovation, supply chain trade, and workers in a globalized world
FIGURE 8.11 Factory gate to exporting country’s customs frontier, recorded distribution margins (% of basic price of recorded exports)A: By product
0%
10%
20%
30%
40%
50%
60%
70%
Agricult
ure
Fore
stry
Fish
Mini
ng
Food, b
ever
ages
,tobac
co
Texti
les &
cloth
ing
Wood p
roduc
ts
Paper
ing &
reco
rding
Coke &
refin
ed p
etro
leum
Chemica
ls
Pharm
aceu
ticals
Rubber
& p
lastic
Other
non-
metall
ic mine
rals
Basic
metals
Fabric
ated m
etals
Compute
r, elec
tronic
& op
tical
Electri
cal e
quipmen
t
Mac
hiner
y & eq
pt n.e.
c.
Moto
r veh
icles
Other
tran
sport
eqpt
Other
man
ufactu
ring
310 91216120 179
Average across countries Maximum across countriesB: By country
Share of of total exports Minimum across products Maximum across products
0%
10%
20%
30%
40%
50%
60%
70%
Austra
lia
Austri
a
Belgium
Canad
aChil
e
Czech
Rep
.
Denmark
Estonia
Finlan
dFr
ance
Greec
e
Hungary
Irelan
dIta
ly
Rep. o
f Kore
a
Lithu
ania
Latvi
a
Mex
ico
Nethe
rland
s
Portu
gal
Slova
k Rep
.
Slove
nia
Swed
en
Turke
y
United
King
dom
United
State
s
120 140 310 216
Note: Data for Australia refers to 2014, Austria 2012, Belgium 2010, Canada 2013, Chile 2015, Czech Republic 2017, Denmark 2014, Estonia 2014, Finland 2014,
France 2014, Greece 2010, Hungary 2014, Ireland 2011, Italy 2014, Republic of Korea 2010, Lithuania 2014, Latvia 2010, Mexico 2013, Netherlands 2014, Portugal
2013, Slovak Republic 2012, Slovenia 2015, Sweden 2015, Turkey 2012, United Kingdom 2010, United States 2016.
Source: OECD Supply-Use Table database.

Improving the accounting frameworks for analyses of global value chains • 167
basic price of the exported good will include all upstream distri-bution costs incurred in the production of that good, including cross-border distribution costs on intermediate imports used in production. So, in other words, distribution costs incurred in pro-ducing a good for export will be reflected in the basic price of that good when they relate to intermediate parts shipped within the country or imported into the country but, typically, not when they relate to transportation of the goods to the customs frontier.
In addition, the concept proves problematic for notions of international competitiveness, as the basic price concept de facto gives the impression that countries are engaged in signif-icant direct exports of these distribution activities, as any distri-bution costs related to the transport of a good from the factory gate to the customs frontier will be treated as if they were direct exports of separate distribution services. For example, a country may have restrictions on the provision of these services by for-eign operators, as well as high relative prices that are absorbed only through the increased international competitiveness of goods-producing sectors purchasing these distribution services. This country is more likely than not to reveal relatively higher measures of revealed comparative advantages (when measured on the conventional gross basis) in the distribution sector and relatively lower in the goods producing sector, when the com-plete opposite is the more likely scenario.
FIGURE 8.13 Domestic services value-added content of textiles exports (basic versus F O B prices)
Austra
lia
Belgium
Canad
aChil
e
Czech
Rep
ublic
Denmark
Estonia
Fran
ce
Greec
e
Hungary
Irelan
dIta
ly
Rep. o
f Kore
aLa
tvia
Lithu
ania
Mex
ico
Nethe
rland
s
Polan
d
Slova
k Rep
ublic
Slove
nia
Swed
en
Turke
y
United
King
dom
Austri
a
United
State
s0%
10%
20%
30%
40%
50%
60%
70%
80%
Basic F.O.B
Note: Data for Australia are 2014, Austria 2012, Belgium 2010, Canada 2013, Chile 2015, Czech Republic 2017, Denmark 2014, Estonia 2014, France 2014, Greece
2010, Hungary 2014, Ireland 2011. Italy 2014, Republic of Korea 2010, Latvia 2010, Lithuania 2014, Mexico 2013, Netherlands 2014, Poland 2013, Slovak Republic
2012, Slovenia 2015, Sweden 2015, Turkey 2012, United Kingdom 2010, United States 2016.
Source: OECD Supply-Use table database and OECD-WTO TiVA.
FIGURE 8.12 International transportation margins on US imports
0
10
20
30
40
50
60
70
0 0,2 0,4 0,6 0,8 1 1,2
Thou
sand
s of
pro
duct
/cou
ntry
ent
ries
CIF minus FOB margin as a share of CIF price
Source: OECD International Transport and Insurance Costs of Merchandise
Trade.

168 • Technological innovation, supply chain trade, and workers in a globalized world
FIGURE 8.14 Margins on household final consumption, % of basic priceA: By product
Agricult
ure
Fore
stry
Fish
Mini
ng
Food, b
ever
ages
,tobac
co
Texti
les &
cloth
ing
Wood p
roduc
ts
Paper
ing &
reco
rding
Coke &
refin
ed p
etro
leum
Chemica
ls
Pharm
aceu
ticals
Rubber
& p
lastic
Other
non-
metall
ic mine
rals
Basic
metals
Fabric
ated m
etals
Computer
, elec
tronic
& o
ptical
Electri
cal e
quipmen
t
Mac
hiner
y & eq
pt n.e.
c.
Moto
r veh
icles
Other
tran
sport
eqpt
Other
man
ufactu
ring
Average across countries Maximum across countries
0%
100%
200%
300%
400%
500%
600%
B: By country
0%
100%
200%
300%
400%
500%
600%
Share of of total HHFC Minimum across product Maximum across products
Austra
lia
Austri
a
Belgium
Canad
aChil
e
Czech
Rep
.
Denmark
Estonia
Finlan
dFr
ance
Greec
e
Hungary
Irelan
dIta
ly
Rep. o
f Kore
a
Lithu
ania
Latvi
a
Mex
ico
Nethe
rland
s
Portu
gal
Slova
k Rep
.
Slove
nia
Swed
en
Turke
y
United
King
dom
United
State
s
Note: Data for Australia are 2014, Austria 2012, Belgium 2010, Canada 2013, Chile 2015, Czech Republic 2017, Denmark 2014, Estonia 2014, Finland 2014, France
2014, Greece 2010, Hungary 2014, Italy 2014, Republic of Korea 2010, Lithuania 2014, Latvia 2010, Mexico 2013, Netherlands 2014, Portugal 2013, Slovak Repub-
lic 2012, Slovenia 2015, Sweden 2015, Turkey 2012, United Kingdom 2010, United States 2016.
Source: OECD Supply-Use table database and OECD-WTO TiVA.

Improving the accounting frameworks for analyses of global value chains • 169
But it is equally important to note that this is not only an issue for decompositions of exports into their sources of value added. It affects all components of demand. For estimates of intermedi-ate consumption (or rather the coefficients of the Leontief matrix) the effects are mitigated by the fact that the distribution costs will always be captured in the costs of production of a good, whether embodied in the price of any intermediate used in pro-duction or treated as a separate cost. This reflects the fact that intermediate consumption totals are always measured at market prices even if the components are recorded in basic prices.
In other words, Leontief coefficients provide a theoretically correct view of the upstream impact of the production of a given good, but only when the application is to determine the full upstream impact of production as opposed to consumption. All current TiVA estimates align with this production view, but many of the applications are in fact looking at things from a consump-tion perspective. But in basic price Leontief systems, distribution margins provided by an intermediary (such as a retailer) or mar-gins that are not part of an all-inclusive price charged directly by the producer, are stripped out of the consumption (market) price. Not surprisingly, these charges can make a significant difference to the overall price of a good (see Figure 8.14).
For products, taking an average across countries’ margins adds (a low of) 31% to the basic price of printing products and (a high of) 113% for textile and chemical products (and 560% for basic metal products in Denmark). For countries, looking at total consumption of goods in basic prices, margins add a further 41% in Slovakia to 92% in Denmark.
None of that is to say that basic price approaches are with-out merit. Far from it, as they provide the conceptually correct view of the decomposition of costs from a production perspec-tive. Moreover, as described below, they are also significantly easier to calculate from current national accounting systems than decompositions based on market price concepts.
But it is clear that some care is needed in interpretation. As shown above, for analyses of global value chains, taking a per-spective from purchasers’ prices rather than basic prices can present a significantly different picture of GVCs, for example concerning the contribution to the domestic economy of exports of a given product. But the purchaser’s prices concept is perhaps also preferable in the derivation of other conventional analyses and metrics that rely on input-output based indicators. Perhaps chief in this respect concerns analyses of the now well-known Smile Curve, which is looked at in the following section.
3.2 Looking anew at the Smile Curve Although, at least in recent years, there has been an improved understanding of the limits of GVC analyses that look at fragmen-tation of production through the prism of Stan Shih’s Smile Curve, even with these limits it remains an important looking glass.
A greater awareness that conventional statistics concerning fragmentation of production reflect the basic price rather than the market price concept can further help improve our under-standing and limitations of basic price measures.
A simple way to illustrate shortcomings in current measures, and in particular the basic price concept, is to reconsider how they reflect single case studies, indeed case studies that have acted as motivators for much of the work, and new statistics on GVCs, that exists today.
Perhaps the most well-known of these is Dedrick et al.’s sem-inal 2008 work looking at the decomposition of value creation in an iPod (Table 8.1).
As noted in their study, the factory gate price (roughly equivalent to what would be recorded in trade statistics) was less than half the total retail price, and, indeed, Apple’s con-tribution (measured as its gross profit), and compensation for design, marketing and research and development, is com-pletely absent from the factory gate price.
In this sense therefore any attempt to assess the full value chain, including Apple’s contribution, by decomposing only the factory gate price, will be severely compromised as the high-value activities, R&D and design (which are generally positioned at the beginning of the value chain, Figure 8.15) and marketing and distribution (at the end of the chain) are com-pletely absent from the decomposition. This is what is de facto done in decompositions of value using input-output tables at basic prices, because, as noted above, the contribution from distribution services, and very often R&D, marketing and design are shown as separate expenditure items also in basic prices.
An underappreciation of this shortcoming in the basic price concept for GVC analyses of lengths and positions of activities in value chains is widespread in the literature. For example, Degain et al. (2017)’s otherwise excellent paper “Recent trends in global trade and global value chains” provides a decomposition of value added, showing the contribution made by various indus-tries and countries relative to their distance from the consumer and by their relative compensation per hour.
Intuitively, all of their charts plotting relationships for various products (see below Figure 8.16, the example for China’s elec-trical and optical equipment) show distribution activities (clas-sified as industry 20 in the Figure) close to the consumer (with relatively high labor costs), where Degain et al. explain: “Post-fabrication service industries with higher labor compensation per hour – such as wholesale (20) and inland transportation (23) in
TABLE 8.1 Derivation of Apple’s gross margin on 30GB video iPod
Retail Price $299
Distributor Discount (10%) ($30)
Retailer Discount ($45)
Sub-total (estimated wholesale price) $224
Factory Cost $144
Estimated Apple gross profit $80
Source: Dedrick et al, 2008.

170 • Technological innovation, supply chain trade, and workers in a globalized world
FIGURE 8.15 Conceptual framework of the Smile Curve
MarketingKnowledge
R&DKnowledge
ValueAdded
Location 1 Location 2 Location 3 Location 4 Location 5Inputs Markets
Basic and appliedR&D, Design,
Commercialization
Manufacturing,Standardized
services
Marketing, Advertisingand Brand management,
Specialized logistics,After-sales services
Source: Mudambi, 2008.17
FIGURE 8.16 Smile Curve for China’s exports of electrical and optical equipment, 2009 (basic prices)Compensation per hour ($)
Source: Meng Ye and Wei 2017.

Improving the accounting frameworks for analyses of global value chains • 171
the United States, Japan, Germany, and France – were the main beneficiaries in the postfabrication stage of this GVC. China’s ICT goods exported to the United States, Japan, and Germany had to be delivered to their domestic consumers mainly through those countries’ domestic wholesale and transportation service industries.”
However, therein (the bolded text) lies the misunderstanding between the basic price and market price concept. Decomposi-tions of the value of a good purchased as final domestic demand into source industries using input-output tables in basic prices do not capture the:• final contribution made by domestic wholesale and transpor-
tation service providers delivering an import to final domestic consumers;
• international distribution costs involved in shipping the good into the country; nor indeed the
• shipping costs from the factory to the customs frontier of the exporting country. This is why Degain et al. estimate the contribution of the dis-
tribution activities at generally no greater than 20%, while this chapter finds significantly higher estimates (around 40% when the decomposition is for an export, as in Figure 8.13, and signifi-cantly higher when the decomposition relates to the price paid by the final consumer, as in Figure 8.14).
To re-emphasize, what decompositions in basic prices do cap-ture (at least in theory) is the contribution of distribution activ-ities related to transactions in intermediates, before the very last transaction recorded in input-output tables at basic prices. So, for example, they include any distribution activities related to the intermediate consumption of any firm (whether those intermediates were imported, in which case decompositions would include any related international distribution margin, or produced domestically). This is because the production func-tion (input-output coefficients) of any given industry will always show total intermediate consumption at market prices, even if all the separate components are broken down into basic price components. However, these decompositions will not capture any distribution margins related to final demand transactions (whether household final consumption, general government final consumption – although in practice this is not generally an issue as in most countries general government final consumption only records transactions in services – capital formation or, indeed, exports, including exports of intermediates).
This reveals another potential problem with analyses that present the position of these distribution activities within global value chains. In all of these studies distribution activities find themselves positioned very close to the final consumer. This is, of course, an accurate reflection of their overall positions when seen as a whole (i.e. in market prices), as an overall view would include the distribution services provided to final domestic demand (household and government consumption, consumption of non-profit institutions serving households, and capital forma-tion). However, this is not an accurate reflection of the position of these activities when they refer to the provision of distribu-tion services used to service intermediate flows – in other words
it is not an accurate representation of the position of distribu-tion services when decomposing basic prices. Indeed it stands to reason that for very fragmented chains, distribution services would be needed throughout the production process and, so, would be further away from the consumer than retail distribution services (which are almost entirely related to the provision of ser-vices to final demand consumers). It is only because, in practice, estimates of the position of distribution services (i.e. distance to consumer) are calculated for the sector as a whole that results in distribution services appearing close to consumers. This reflects the fact that distribution services provided to final consumers make up the majority of overall distribution services, and, so, swamp results for the overall position of the sector. This some-what intuitive result appears to have led many to conclude that the distribution service component in decompositions of basic prices reflects the final distribution service at the end of the chain – but this is not the case.
3.3 Marketing, design and R&D servicesThus, an aggregated view of the position of the distribution sector in global value chains is unlikely to accurately reflect the position of intermediate services in a given production process when input-output tables used decompositions in basic prices. But, because the remuneration for marketing, design and R&D services is also often bundled within the final distribution margin, our understanding of the contribution of other underlying activ-ities – recorded as distribution activities – may be similarly affected, i.e. their position in global value chains, estimated using input-output tables, may not necessarily align with where they appear in the physical production process.18
This is particularly relevant for the position of high-value tasks such as research and development and design. These should of course appear at the beginning of the production process, but where they appear in input-output based estimates depends greatly on a number of factors. Chiefly these relate to whether these activities are conducted by separate production entities or whether they are conducted within the firm. Further complicat-ing matters is the industrial classification of the firm itself, dis-cussed in more detail below.
If the R&D and design activities are conducted by separate units classified to these specific activities in input-output tables, then input-output based approaches will be able to capture their appropriate position and indeed value contribution within GVCs. However, often these activities are conducted in-house for which there is no observable transaction, and in these cases their con-tribution is included within the value added of the main activity of the firm. For example, a retailer may outsource production of clothing, but the value generated through brand, design, and R&D may instead (and often) appear as distribution margin. Input-output based measures will therefore record (but not sep-arately) the positions of the underlying R&D and design activi-ties in the same position as the firm’s main activity (distribution), which will not typically be at the beginning of the value chain.19 This of course is not an issue unique to these types of tasks; any in-house activity not separately identifiable in input-output

172 • Technological innovation, supply chain trade, and workers in a globalized world
tables is treated in this way (as are secondary activities that are separately identifiable when input-output tables are con-structed on an industry by industry as opposed to product by product basis).
But whilst this is a more generic problem with input-out-put tables, it is perhaps most pertinent when it comes to R&D, design and marketing activities, where in-house production remains significant (certainly when considering the very high distribution margins on exports seen in Figures 8.11A and B). Further exacerbating this is the increasing importance within global value chains of factory-less producers, who outsource physical production whether at home or abroad, but control the overall production process (focusing control on activities such as specification, design, R&D, marketing), which to some extent is a reflection of the upgrading process underpinning GVCs.
Current international standards for the classification of firms (ISIC Rev 4) classify factory-less firms that own no material inter-mediate inputs in the production process to the distribution sector. As such the value added by these factory-less firms will materialize in input-output tables as distribution margins, and, so, are allocated to a separate activity to the good being pro-duced when input-output tables are recorded in basic prices. In other words the value of the goods (whose production and sales are controlled by these firms) will reflect the (contractor’s) factory-gate price but these prices will not include the intellec-tual property, design, brand etc. owned by the factory-less firm. These will instead materialize in the wholesale prices the firm charges to other intermediaries or indeed the final retail price if the factory-less firm sells the products through its own chain of retailers.
Further complicating matters, factory-less firms that own some material intermediate inputs (even if they have no actual role in the physical transformation of those inputs) are classi-fied to the activity of the good being produced. In these cir-cumstances input-output tables should record transactions between the factory-less firm and its contractors following the recommendations for the treatment of goods for processing transactions in the System of National Accounts. But in practice this may not be the case, especially if the value of the material intermediate inputs purchased by the principal is marginal, in which case national accountants may instead choose to record the output of the principal as if it were a distribution service, (i.e. excludes the factory gate price of the good) even if the industry of the principal remains classified to manufacturing.
Following the example of the iPod above therefore, input-output tables that decompose the basic price value of the iPod will not record the contribution from Apple’s R&D, design, brand etc. to the good itself if Apple is classified as a distributor (e.g. as a factory-less firm, in which case the contri-bution will be shown separately under consumption of distri-bution margins) and may not do so in practice even if Apple is classified as a manufacturer. Whatever the classification, any retail margins incurred by final demand consumers, whether charged by independent retailers or Apple stores, will never be included in the decomposition of the basic price. In other
words, decompositions of goods in basic prices (and in particu-lar hi-tech goods) may, in practice, typically significantly under-estimate the contribution of R&D, marketing, design etc. to the production process (as they will instead be recorded as a sepa-rate transaction of “direct” purchases of distribution services).
3.4 A new perspective on the role of importsAnother area, among many, where a purchaser’s price perspec-tive can provide an important complementary view to a basic price concept concerns the role of imports. One highly sensi-tive indicator produced in TiVA-type analysis is the domestic content of a country’s imports, typically used to highlight the potentially counter-productive impact of tariffs as they may affect upstream domestic exporters. In the United States, the US content of its total goods imports amounts to, on average, 6% in recent years (Figure 8.17). But bringing the imports into the country, in turn, generates distribution services, whether the imports are for intermediate consumption, final domestic consumption, or indeed for direct re-exports.20
Conventional input-output approaches, using the basic price concept, de facto decouple and break the link between these costs and the imported good. But a purchasers’ price approach treats the distribution services as integral, revealing, in turn, much higher US “dependencies” (or US “content”) of its imports. Indeed changing the price basis, and decompos-ing the purchasers price value of an imported good reveals that the US content of its total goods imports (or rather the US val-ue-added generated by consumption of imports) amounted to 30%21 of the overall price of those imports (excluding any con-sumption taxes). For imports of textiles, the US content was as high as 50% for consumption by US households and 20% for exports, compared to the 3% shown in TiVA.
Indeed, the total value of distribution margins provided by US domestic operators in taking imports from the customs fron-tier to their next destination (to industries, final consumers, or as re-exports) amounted to close to 900 billion USD dollars in 2016, equivalent to 5% of GDP. In value-added terms, as the distribution sector also requires imports for production, dis-tribution activities added 840 USD billion to US GDP in 2016 on account of transportation and sales of imports, supporting 9 million jobs, including 6.3 million in the wholesale and retail sector, and 1.0 million in the transportation sector, with signifi-cant contributions from upstream industries (0.2 million in man-ufacturing, and 1.6 million in all other activities) (Figure 8.18).
In many other countries the contribution of distribution services (as recorded in official supply-use statistics) to the domestic economy through sales of imports is significantly higher (Figure 8.19). Unsurprisingly, the contribution is larger, the smaller the economy (and the higher the dependency on imports). In Lithuania for example, where gross imports were equivalent to 78% of GDP in 2014, and the value added of the distribution and transportation sectors accounted for 28% of GDP, the domestic value added generated through sales of imports in the economy accounted for 22% of GDP. Of partic-ular interest is the contribution to GDP made via distribution

Improving the accounting frameworks for analyses of global value chains • 173
FIGURE 8.17 US value-added content of imports at the frontier (% of basic price) and as percent of consumer’s price (excluding taxes) (2016)
At the frontier (Basic Price)
Intermediate Consumption (inc margins) HHFC (inc margins) Exports (inc margins)
Total all goods all consumers (inc margins)
Total
goods
Agricult
ure
Mini
ngFo
od
Texti
les
Wood et
c
Paper
etc
Petro
leum et
c
Chemina
ls
Rubber
Other
non m
etals
Fabric
ated m
etals
Met
als
Computer
etc
Electri
cal e
quipmen
t
Mac
hiner
y and
equip
ment
Moto
r veh
icles
Other t
ransp
ort e
quipmen
t
Other
man
ufactu
ring
0%
10%
20%
30%
40%
50%
60%
Note: MHHFC, Household final consumption.
Source: Calculations based on OECD-WTO TiVA and OECD Supply-Use Table database.
FIGURE 8.18 Jobs supported and value added via sales and export of imports in the US, by source (2016)
0
100
200
300
400
500
600
0
1
2
3
4
5
6
7
Import content of distribution
Manufacturing Transportation Other activities Wholesale, retail
Jobs (millions) Value-added (USD billions) (RHS)
Source: Calculations based on OECD-WTO TiVA, OECD Supply-Use Table database and OECD National Accounts.

174 • Technological innovation, supply chain trade, and workers in a globalized world
services related to re-exports, accounting, for example, for over 3% of GDP in the Netherlands. Total persons employed22 (pro-viding distribution and upstream services) are generally higher than shares of GDP, reflecting the lower labor productivity23 seen in the distribution sector compared to other activities in the economy.
None of the above is to say of course that higher import prices, or lower imports, will necessarily reduce the domestic value (direct and upstream) generated by distribution activities nor the jobs supported, as consumers will be able to substitute production with domestically produced equivalents (where these exist). But if the higher import prices occur through, for example, tariff measures, this may reduce the overall purchasing power of consumers (in addition to the potential reduction in competitive-ness of producers, including exporters) which is likely to have a volume effect. This would, in turn, reduce value added gener-ated and jobs sustained through distribution activities related to the sale of imports.
3.5 Developing market-price input-output frameworksDespite all the commentary above, it’s important to reiterate that decompositions of basic price transactions into the origins of their value contribution are not wrong, nor are they without meaning. However, care is needed in their interpretation.
There are a number of areas where care is needed, but key is the fact that they do not provide a view from the purchaser’s per-spective. In this respect therefore, they cannot provide a whole view of the value chain (in particular the distribution, marketing, retail channel at the end of the chain), nor are they necessarily well-equipped to provide insights on the contribution of design, marketing and R&D (for example because they are bundled with distribution services or because they are performed in-house by manufacturers) nor on the actual positions of various activities within value chains.
In addition, basic price decompositions can also introduce asymmetric results for chains that are to all extent and purposes, identical. For example, if a Korean producer used a Japanese
FIGURE 8.19 Domestic value added generated and persons employed through sales of imports, by source of demand % of GDP and persons employed
0
0,05
0,1
0,15
0,2
0,25
Rep. o
f Kore
a
United
State
s
Turke
y
Irelan
dIta
ly
Finlan
d
Austra
liaChil
e
Portu
gal
Hungary
Mex
ico
Denmark
Fran
ce
Swed
en
Canad
a
Czech
Rep
.
United
King
dom
Belgium
Greec
e
Austri
a
Slove
nia
Nethe
rland
sLa
tvia
Estonia
Slova
k Rep
.
Lithu
ania
Persons employed, % of totalOther Exports HHFC IC
Note: Data for Australia are 2014, Austria 2012, Belgium 2010, Canada 2013, Chile 2015, Czech Republic 2017, Denmark 2014, Estonia 2014, Finland 2014, France
2014, Greece 2010, Hungary 2014, Ireland 2011. Italy 2014, Republic of Korea 2010, Lithuania 2014, Latvia 2010, Mexico 2013, Netherlands 2014, Portugal 2013,
Slovak Republic 2012, Slovenia 2015, Sweden 2015, Turkey 2012, United Kingdom 2010, United States 2016.
Source: OECD Supply-Use table database and OECD-WTO TiVA and OECD National Accounts. HHFC: household final consumption. IC: Intermediate
consumption.

Improving the accounting frameworks for analyses of global value chains • 175
shipping company to ship parts to be assembled in China before being shipped and sold to US households, the decomposition of the import price recorded in input-output tables at basic prices in the United States would include all costs incurred up to the point that the goods left the factory gate in China – in other words they would exclude the costs incurred in shipping the goods across the Pacific, which would be treated as a separate import of distribution services by US households from Japan. Typically, the distribution costs involved in shipping the good from the Chinese factory gate to the Chinese frontier (which would also be recorded as a direct import of distribution services by the US) would also be excluded. However, if the same goods were assembled in Mexico, the basic price for the imports into the US would include shipping costs across the Pacific and the distribution costs incurred in China (as, theoretically, these would be included in the intermediate consumption costs of the Mex-ican assembler24). As such, even if the assembly costs in Mexico and China were identical and the shipping route (i.e. Republic of Korea-China-Mexico-US) and costs were also identical, the Japanese content of the US imports would be higher for goods assembled in Mexico compared to the same goods assembled in China.
Perhaps the main shortcoming with the basic price concept, however, is that it breaks the link between the good being sold and the final distribution services that are reliant on it. That is, any upstream domestic distribution services involved in ship-ping a good across borders before it is eventually consumed back in that same country for final consumption will be (at least in theory) recorded in the home-country’s content of its imports. However, the same distribution services used to ship the prod-uct to the country’s frontier before it is finally consumed will not be recorded in the home-country’s content of imports (the dif-ference between the C.I.F. and the basic price), nor (generally) will any domestic distribution services engaged in shipping the good from its frontier to its final domestic consumer (the differ-ence between the purchasers price and the CIF price, ignoring taxes and subsidies). As such, there is a clear case to be made (as in Figure 8.17) for complementary insights based on the pur-chasers’ price.
The perspective necessarily needs to be complementary to, and not as a replacement for, the basic price concept, as a pur-chaser’s price perspective cannot meet all needs. For example, in looking at, say, the multiplicative impact of tariffs on imports, one still needs to have a view of the actual price of the imports and not the actual price paid by the ultimate consumer after dis-tribution margins are included. Even here, however, while the basic price concept is better it is also imperfect, as tariffs are typ-ically imposed on the CIF price and not the basic price, and when they are not CIF prices they are typically the FOB price, and the difference as shown in Figure 8.11 above can be significant.
The idea for a complementary view in this respect is a means of supporting a broader narrative, whether that be on the full upstream impact of exports, the domestic spillover from imports or the positions (and interpretation of positions) of industries within GVCs. Import-export wholesalers, for example, depend
exclusively on their ability to trade internationally but you would not be able to identify this in a standard input-output table at basic prices (which would show they had no imports).
Developing such a complementary view in practice is, how-ever, far from trivial (see Ahmad 2019, forthcoming). It would, in effect, require a very different presentation of the role of distrib-utors in the accounting framework. They would be shown either as providers of intermediate services, resulting in changing the value of output of industries from basic prices to purchasers’ prices (excluding taxes on products), or they would be shown as purchasers of the goods they sold. Thus, the accounts would need to record the value of their output inclusive of the value of the goods that they sell, and not just their margins. Both cases are complex, posing, in turn, difficulties for analyses and indeed in compilation.
4. Conclusions
Basic price approaches to the development of global input-out-put tables provide important insights on the nature of global value chains and have helped transform our understanding on international trade today. However they can be prone to signifi-cant misinterpretation, as shown in many of the studies that use them to infer positions of activities in global value chains. But, as shown above, this is not the only area where misinterpretation can occur; for example through their removal of the distribution margin on goods transported from the factory gate to the cus-toms frontier, they provide a view of trade in goods that is sig-nificantly different to that seen by analysts of trade, which often hampers their take-up, and indeed can impact on analyses (for example in calculations of the impact of tariffs, whose price is typically C.I.F. or F.O.B.).
Perhaps chief in this respect is the application of basic price models to questions that require a consumption perspective (which is, to some extent, at the heart of many of the applications of standard Leontief analyses, which often look at the impact of an increase in final demand on production). But a significant part of the actual consumption price (be that a market price or a CIF price) on which taxes and tariffs are applied includes significant distribu-tion margins, and pure basic price models that treat distributors as providing direct services to customers, break these links.

176 • Technological innovation, supply chain trade, and workers in a globalized world
Notes
1. This chiefly relates to the fact that no statistical information system
in the world actually has this information for all firms (by product
produced and consumer) but even if this were the case, the need to
preserve confidentiality of respondents to statistical business surveys,
would make it impossible to release such firm-level data for public
consumption.
2. http://www.oecd.org/daf/inv/investment-policy/trade-invest-
ment-gvc.htm
3. Albeit a relocation that satisfies the accounting rules regarding eco-
nomic, as opposed to legal, ownership. See the 2008 System of
National Accounts.
4. It also includes taxes and subsidies on production.
5. Not all labor compensation will necessarily stick in the economy, for
example for cross-border workers.
6. Such as land and other intangible assets not recognised as Intellectual
Property Products in the SNA.
7. http://www.cso.ie/en/csolatestnews/pressreleases/2017pressre-
leases/pressstatementmacroeconomicreleasesyear2016andquar-
ter12017/
8. See Ahmad and Araujo 2011 “Measuring Trade in Value-Added
and Income using Firm-Level data”. Available at: http://sitere-
sources.worldbank.org/INTRANETTRADE/Resources/Internal-Train-
ing/287823-1256848879189/6526508-1283456658475/7370147
-1308070299728/7997263-1308070314933/PAPER_8_Ahmad_
Araujo.pdf
9. Where results have been generated using national tables only – in
other words the domestic content of imports is recorded as zero.
10. http://www3.inegi.org.mx/sistemas/tabuladosbasicos/LeerArchivo.
aspx?ct=44462&c=33654&s=est&f=4
11. http://scholar.harvard.edu/files/jorgenson/files/4a.1_paper.pdf
12. See the 2008 System of National Accounts
13. Note that some care is needed in interpreting the margin values pre-
sented here. The varying degree, across countries, of implementation
of the 2008 SNA guidance on merchanting transactions may affect
cross-country comparability and may also explain the very high esti-
mates of margins in some countries. For example in countries with
significant merchanting activities (typically recorded as a distribu-
tion margin) there will be a positive entry for the margin (merchant-
ing service) exported, including under goods transactions, but there
will not be a corresponding value of the exports of the goods being
merchanted (unless the periods when the merchant acquires and sells
the goods differ, in which case margin ratios in the period when the
goods are acquired will be biased upwards as the acquired goods will
appear as a negative export).
14. Note that in industry by industry output tables distribution margins
provided directly by the exporting industry are included in the output
and the value added of the industry. Figure 8.13 assumes that the
additional margins are provided only by the domestic distribution
industry and so will present marginally upward biased estimates of the
additional contribution made by the sector; typically the contribution
made by the distribution sector represents nearly all of the domesti-
cally-produced distribution activity. For example, in the United States
the wholesale and retail sector provided 96% of all output in 2016 in
the corresponding product.
15. However at the same time because of the decoupling, in practice, at
least with current estimates of TiVA, there is an impact on the source
of the distribution services, as, typically, the allocation (before balanc-
ing in a global input-output) to partner country sources of the imports
is based on the partner shares observed for actual direct imports (and
also, often, as part of the balancing process, exports) of these same
services.
16. Dedrick, Kraemer, Linden (2008): “Who Profits from Innovation in
Global Value Chains? A Study of the iPod and notebook PCs”.
17. Mudambi, R. (2008). “Location, Control and Innovation in Knowl-
edge-Intensive Industries”. Journal of Economic Geography, 8(5),
699-725.
18. For example if an Apple store pays explicit cross-border royalties for
the use of intellectual property (such as design, software) to an Apple
subsidiary abroad every time an iPhone is sold, the position of the
intellectual property will appear close to the end of the value chain
using standard input-output estimation methods, despite the fact that
the design and software are fundamentally at the beginning of the
value chain.
19. See also Chen, Los and Timmer (2018), Factor Incomes in Global
Value Chains: The Role of Intangibles, NBER Working Paper, 25242,
which attempts to estimate the underlying contribution made by
intangibles.
20. Of interest with respect to the treatment of re-exports is the consid-
erable margin associated with the distribution services (e.g. handling,
transportation etc.) for re-exports. In the United States, around 200
billion USD of its total 2.3 trillion of imports in 2016 in C.I.F. prices,
reflected re-exports. The handling (transportation etc.) of these
imports for re-export generated 33 billion USD of distribution mar-
gins. In basic price input-output systems that exclude re-exports and
allocate bilateral flows on the basis of their final destination, it is not
possible to separately differentiate this activity from other distribution
services, masking the role of re-exports. Allocations of bilateral flows
on the basis of country of consignment, with a separate distinction for
re-exports, even if only in basic prices may be a better approach for
the construction of global input-output tables.
21. Indeed, this may be an underestimate as the calculations for percent-
ages of “basic prices plus margins” shown here do not account for
international transport margins (which can also be provided by US
transporters). TiVA estimates exclude these costs in the basic price of
the imported good, but the US Supply-Use tables used to generate
the “market” price equivalent estimates use imports at C.I.F. prices.
22. Note that persons employed rather than jobs (as in Figure 8.18) are
shown here as fewer countries provide estimates of jobs by activity
23. Labor productivity measures should preferably be calculated on an
“hours worked” basis. But for the purposes of this paper, persons
employed and jobs are used to better reveal the number of individu-
als dependent on sales of imports.
24. This would be the case whether the Mexican firm actually purchased
the goods from the Korean producer or was merely a contractor, and
so is unaffected by the changes in the 2008 SNA concerning goods
sent abroad for processing.

Improving the accounting frameworks for analyses of global value chains • 177
References
Ahmad, N and S. Araujo (2011) “Measuring Trade in Value-Added and
Income using Firm-Level data”.
Ahmad, N and J. Ribarksy (2014), “Trade in Value Added, Jobs and
Investment”
Ahmad N, (2018), “Accounting for Globalisation: Frameworks for Inte-
grated International Economic Accounts”
Ahmad, N. (2019), “A new look at Trade in Value-Added and Global Value
Chains: A view from the Consumption Perspective” OECD Statistics
Working Paper, forthcoming.
Chen,W, B.Los and M.Timmer (2018), “Factor Incomes in Global Value
Chains: The Role of Intangibles”, NBER Working Paper, 25242,
Dedrick,J, K.Kraemer, and G.Linden (2008): Who Profits from Innovation in
Global Value Chains? A Study of the iPod and notebook PCs.
De La Cruz, J. R.Koopman, Z.Wang and S.Wei (2011) “Estimating Foreign
Value-Added in Mexico’s Manufacturing Exports”
Degain, C, B.Meng and Z.Wang (2017), “Recent trends in global trade and
global value chains”, Global Value Chain Development Report (2017),
Chapter 2
Fetzer, J, T. Howells, L.Z Jones, E.H. Strassner, and Z.Wang (2016) “Estimat-
ing Extended Supply-Use Tables in Basic Prices with Firm Heterogeneity
for the United States: A Proof of Concept”, paper prepared for the the
Fourth World KLEMS Conference Madrid, Spain
Miao, G and F. Fortanier (2017), “Estimating Transport and Insurance costs
of International Trade” OECD Statistics Working Paper, No. 80
Mudambi, R. (2008). Location, Control and Innovation in Knowledge-Inten-
sive Industries. Journal of Economic Geography, 8(5), 699-725.
Ming Y, B. Meng, and S.Wei (2015), “Measuring Smile Curves in Global
Value Chains” IDE_Jetro Discussion paper, 530.
Saborío, G.M. (2015), “Costa Rica: An Extended Supply-Use Table”. Paper
prepared for 23rd IIOA Conference México City.
Statistics Denmark: Nordic Countries in Global Value Chains (2017)
United Nations (2009): System of National Accounts, 2008.


179
Final Programme
8 October 2018, WTO154 rue de Lausanne, Geneva, Switzerland
9:00 - 9:15 Registration
9:15 - 9:45 Welcome & opening remarks
David Dollar (Brookings Institution)Emmanuelle Ganne (WTO)
9:45 - 10:30 Presentation of Chapter 1 – Update on trends in GVCs
Presenter Zhi Wang (UIBE)
Discussant Nadim Ahmad (OECD)
10:30 - 11:15 Presentation of Chapter 2 – Labor market effects of GVCs in developed countries
Presenter Victor Stolzenburg (WTO)
Discussant Michael Ferrantino (WBG)
11:15 - 11:30 Coffee break
11:30 - 12:15 Presentation of Chapter 3 – Labor market effects of GVCs in developing countries
Presenter Claire Hollweg (WBG)
Discussant Stela Rubinova (WTO)
12:15 - 13:00 Presentation of Chapter 4 – The future of manufacturing, automation, and developing countries
Presenter Daria Taglioni (WBG) & Satoshi Inomata (IDE-JETRO)
Discussant Yuqing Xing (National Graduate Institute for Policy Studies, Tokyo)
13:00 - 14:00 Lunch break
14:00 - 14:45 Presentation of Chapter 5 – GVCs and digital technologies
Presenter Michael Ferrantino & Emine Elcin Koten (WBG)
Discussant Satoshi Inomata (IDE-JETRO)
APPENDIX 1Chapter Authors’ conference

180 • Technological innovation, supply chain trade, and workers in a globalized world
14:45 - 15:30 Presentation of Chapter 6 – The digital economy, SMEs, and GVCs
Presenter Emmanuelle Ganne & Kathryn Lundquist (WTO)
Discussant Abdul Abiad (ADB)
15:30 - 16:15 Presentation of Chapter 7 – Should high domestic value added in exports be an objective of policy?
Presenter David Dollar (Brookings Institution)
Discussant Gaaitzen de Vries (Groningen Growth and Development Centre)
16:15 - 16:30 Coffee break
16:30 - 17:15 Presentation of Chapter 8 – Issues in GVC measurement
Presenter Nadim Ahmad (OECD)
Discussant Christophe Degain (WTO)
17:18 –18:15 Review of the Executive Summary
Presenter David Dollar (Brookings Institution)
17:18 - 18:15 Wrap-Up
Zhi Wang (UIBE)

181
Global Value Chain Development Report 2019 Background Paper Conference
GuoBin Hotel, Beijing, March 22-23, 2018Pre-conference of China Development Forum
Organized by RCGVC_UIBE and China Development Research Foundation. Co-sponsored by China National Science Foundation and Bill & Melinda Gates Foundation
March 22, Guobin Hotel
8:30 - 9:00 Opening Remark
9:15 - 9:45 Welcome & opening remarks
Speakers Dr. Chen Deming, Former Minster of MOFCOMDr. Robert Koopman, Chief Economist, The WTOProfessor Zhao Zhongxiu, Vice President, UIBEMr. Lu Mai, General Secretory, CDRF
9:00 - 10:00 The Multilateral Nature of Bilateral Trade in the Age of Global Value Chains
Speaker Wang Fei, Wang Zhi, UIBE, Wei Shang-jin, Columbia University, and Zhu Kunfu , UIBE
Discussant Satoshi Inomata, IDE-JETRO
10:00 - 11:00 Did global value chains contribute to rising labor market polarization?
Speaker Cosimo Beverelli, Victor Stolzenburg and Stela Rubinova , WTO
Discussant Ma Hong, Tsinghua University
11:00 - 11:15 Tea break
Participant All
11:15 - 12:15 Global Value Chain Participation and Labor Market Outcomes at the Macro and Micro Level
Speaker Claire Hollweg, Jose Guilherme Reis and Deborah Winkler, World Bank Group
Discussant Jiyoung KIM, IDE-JETRO
APPENDIX 2Technological Innovation, Supply Chain Trade, and Workers in a Globalized World

182 • Technological innovation, supply chain trade, and workers in a globalized world
12:15 - 13:30 Lunch
Participant All
13:30 - 14:30 Accounting for Globalization: Frameworks for Integrated International Economic Accounts
Speakers Nadim Ahmad, OECD
Discussant David Dollars, Brookings institution
14:30 - 15:30 Re-examining the Impact of the China Trade Shock on Local US Labor Markets: A Supply Chain Perspective
Speakers Zhi Wang, Shang-jin Wei, Xinding Yu and Kunfu Zhu, RCGVC
Discussant Cosimo Beverelli, WTO
15:30 - 15:45 Tea break
Participant All
15:45 - 16:45 From China with Love
Speakers Mauro Boffa, Gianluca Santoni, and Daria Taglioni, World Bank Group
Discussant Gaaitzen de Vries, University of Groningen, the Netherlands
16:45 - 17:45 The Changing Structure of the Global Value Chains and Domestic Firms’ Productivity: Evidence from Japanese and Chinese Firm-Level Data
Speakers Yoshihiro Hashiguchi Keiko Ito, Chiara Criscuolo, Jonathan Timmis, IDE-JETRO
Discussant Nick Hope, Stanford Center for International Development
17:45 - 18:45 The Future of Supply – How Might Industry 4 0 Impact Global Value Chains ?
Speakers Michael Ferrantino, World Bank Group
Discussant Emmanuelle Ganne, WTO
March 23, Guobin Hotel
8:00 - 9:00 Are the Geese Still Flying? Evidence from Manufacturing FDIMary Hallward-Drimeier and Gaurav Nayyar, World Bank Group
Speakers Mary Hallward-Drimeier and Gaurav Nayyar, World Bank Group
Discussant Jiandong Ju, Tsinghua University
9:00 - 10:00 Regional divergence in China: the Perspective of Value Chain
Speakers Shan-tong Li, He jianwu (DRC)
Discussant Deborah Winkler, World Bank Group
10:00 - 10:15 Tea break
Participant All
10:15 - 11:15 Hollowing Out and Slowing Growth: A Perspective from Heterogeneous Technological Change
Speakers Wenbo Zhu, RCGVC
Discussants Heiwai Tang, John Hopkins University
11:15 - 12:15 Value added in China’s mobile phone handset industry
Speakers Tim Sturgeon, MIT, Eric Thun, OXFORD, Daria Taglioni, World Bank Group
Discussants Yuqing Xing, National Graduate Institute for Policy Studies, Japan
12:15 - 13:15 Lunch
Participant All
13:15 - 14:15 Formerly Assembled, But Now Designed in China?An Exploration of Chinese Activities in Global Value Chains
Speakers Quanrun Chen, Yuning Gao, Jiansuo Pei, Gaaitzen de Vries, Fei Wang
Discussants Bo Meng, IDE-JETRO

Authors’ conferences • 183
14:15 - 15:15 The effect of production fragmentation on Skill reallocation: Is it felt equally across levels of development?
Speakers David Dollar, Matthew Kidder and Bilal M. Khan, RCGVC
Discussants Liping Zhang, Research Center at The State Council
15:15 - 15:30 Tea break
Participant All
15:30 - 16:30 How can the digital economy help small and medium-sized traders in developing countries to integrate into the global economy?
Speakers Rainer Lanz, Kathryn Lundquist, Andreas Maurer and Robert Teh, WTO
Discussants Xin Cheng, Alibaba Research Institute
16:30 - 17:30 Corruption, Import Liberalization, and Productivity in China: A Firm-Level Analysis
Speakers Jiankun LU, Bo MENG, Hongsheng ZHANG, Shang-Jin WEI
Discussants Miaojie Yu, CCER
17:30 - 18:30 Keynote Speech: The impact of new technology on future Jobs
Speakers Michael Spence, Nobel Prize Laureate in Economics
18:30 - 18:45 Closing remarks
Speakers Dr. Robert Koopman, Chief Economist, WTODr. David Dollar, Senior Fellow, Brookings InstitutionWang Zhi, Professor and Director, RCGVC


This report takes stock of the evolution of global value chains (GVCs) in
light of technological developments, such as robotics, big data and the
Internet of Things. It discusses how these technologies are reshaping GVCs
and examines the effect of these changes on labor markets in developed
and developing economies and on supply chain management. The report
discusses how technological developments are creating new opportunities
for the participation of small and medium-sized enterprises in global value
chains and reviews issues related to GVC measurement. The report is
a follow-up to the first Global Value Chain Development Report, which
revealed the changing nature of international trade when analyzed in
terms of value chains and value-added trade.