Global Projections of Intense Tropical Cyclone Activity ...
24
Old Dominion University Old Dominion University ODU Digital Commons ODU Digital Commons CCPO Publications Center for Coastal Physical Oceanography 9-2015 Global Projections of Intense Tropical Cyclone Activity for the Global Projections of Intense Tropical Cyclone Activity for the Late Twenty-First Century from Dynamical Downscaling of Late Twenty-First Century from Dynamical Downscaling of CMIP5/RCP4.5 Scenarios CMIP5/RCP4.5 Scenarios Thomas R. Knutson Joseph J. Sirutis Ming Zhao Robert E. Tuleya Morris Bender See next page for additional authors Follow this and additional works at: https://digitalcommons.odu.edu/ccpo_pubs Part of the Atmospheric Sciences Commons, Climate Commons, and the Meteorology Commons
Transcript of Global Projections of Intense Tropical Cyclone Activity ...
Old Dominion University Old Dominion University
ODU Digital Commons ODU Digital Commons
CCPO Publications Center for Coastal Physical Oceanography
9-2015
Global Projections of Intense Tropical Cyclone Activity for the Global Projections of Intense Tropical Cyclone Activity for the
Late Twenty-First Century from Dynamical Downscaling of Late Twenty-First Century from Dynamical Downscaling of
CMIP5/RCP4.5 Scenarios CMIP5/RCP4.5 Scenarios
Thomas R. Knutson
Joseph J. Sirutis
Ming Zhao
Robert E. Tuleya
Morris Bender
See next page for additional authors
Follow this and additional works at: https://digitalcommons.odu.edu/ccpo_pubs
Part of the Atmospheric Sciences Commons, Climate Commons, and the Meteorology Commons

Authors Authors Thomas R. Knutson, Joseph J. Sirutis, Ming Zhao, Robert E. Tuleya, Morris Bender, Gabriel A. Vecchi, Gabriele Villarini, and Daniel Chavas
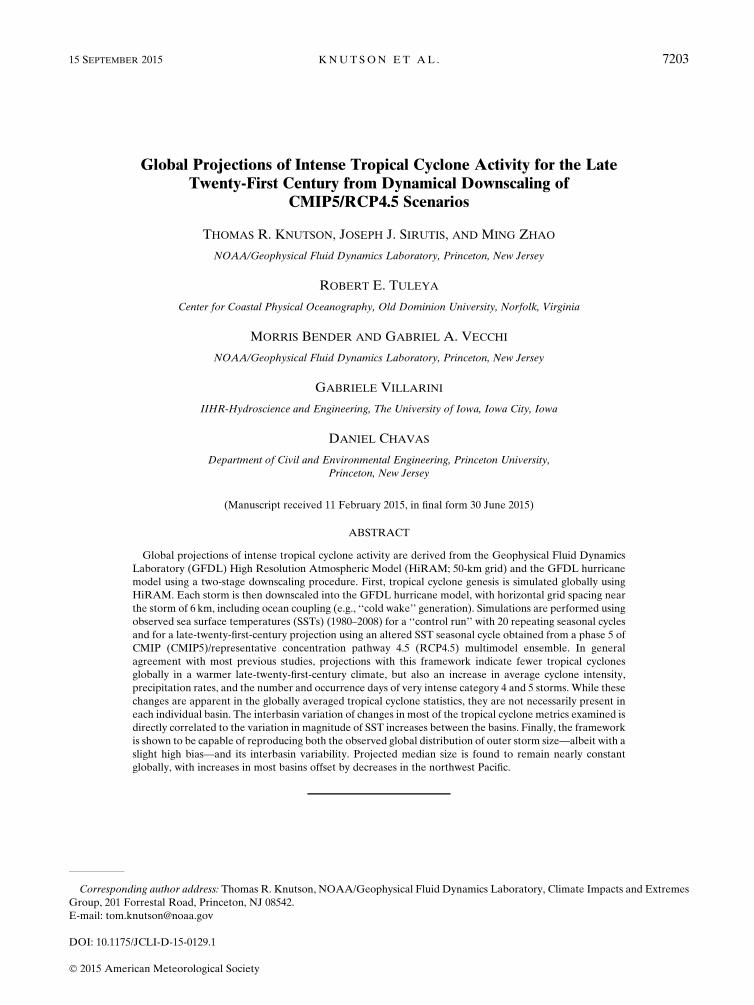
Global Projections of Intense Tropical Cyclone Activity for the LateTwenty-First Century from Dynamical Downscaling of
CMIP5/RCP4.5 Scenarios
THOMAS R. KNUTSON, JOSEPH J. SIRUTIS, AND MING ZHAO
NOAA/Geophysical Fluid Dynamics Laboratory, Princeton, New Jersey
ROBERT E. TULEYA
Center for Coastal Physical Oceanography, Old Dominion University, Norfolk, Virginia
MORRIS BENDER AND GABRIEL A. VECCHI
NOAA/Geophysical Fluid Dynamics Laboratory, Princeton, New Jersey
GABRIELE VILLARINI
IIHR-Hydroscience and Engineering, The University of Iowa, Iowa City, Iowa
DANIEL CHAVAS
Department of Civil and Environmental Engineering, Princeton University,
Princeton, New Jersey
(Manuscript received 11 February 2015, in final form 30 June 2015)
ABSTRACT
Global projections of intense tropical cyclone activity are derived from the Geophysical Fluid Dynamics
Laboratory (GFDL) High Resolution Atmospheric Model (HiRAM; 50-km grid) and the GFDL hurricane
model using a two-stage downscaling procedure. First, tropical cyclone genesis is simulated globally using
HiRAM. Each storm is then downscaled into the GFDL hurricane model, with horizontal grid spacing near
the storm of 6 km, including ocean coupling (e.g., ‘‘cold wake’’ generation). Simulations are performed using
observed sea surface temperatures (SSTs) (1980–2008) for a ‘‘control run’’ with 20 repeating seasonal cycles
and for a late-twenty-first-century projection using an altered SST seasonal cycle obtained from a phase 5 of
CMIP (CMIP5)/representative concentration pathway 4.5 (RCP4.5) multimodel ensemble. In general
agreement with most previous studies, projections with this framework indicate fewer tropical cyclones
globally in a warmer late-twenty-first-century climate, but also an increase in average cyclone intensity,
precipitation rates, and the number and occurrence days of very intense category 4 and 5 storms. While these
changes are apparent in the globally averaged tropical cyclone statistics, they are not necessarily present in
each individual basin. The interbasin variation of changes in most of the tropical cyclone metrics examined is
directly correlated to the variation in magnitude of SST increases between the basins. Finally, the framework
is shown to be capable of reproducing both the observed global distribution of outer storm size—albeit with a
slight high bias—and its interbasin variability. Projected median size is found to remain nearly constant
globally, with increases in most basins offset by decreases in the northwest Pacific.
Corresponding author address: Thomas R. Knutson, NOAA/Geophysical Fluid Dynamics Laboratory, Climate Impacts and Extremes
Group, 201 Forrestal Road, Princeton, NJ 08542.
E-mail: [email protected]
15 SEPTEMBER 2015 KNUTSON ET AL . 7203
DOI: 10.1175/JCLI-D-15-0129.1
� 2015 American Meteorological Society

1. Introduction
The question of how tropical cyclone1 activity could
be altered by future anthropogenic warming (Knutson
et al. 2010; Christensen et al. 2013) is complicated by a
number of factors. First, past observational data are of
limited use for enhancing confidence in future pro-
jections because it remains uncertain whether past
changes in any tropical cyclone metric exceed the level
expected from natural processes alone (Knutson et al.
2010). One exception to this assessment discussed by
IPCC (2013) concerns the likely role of anthropogenic
aerosol forcing (along with natural variability) in con-
tributing to a temporary decrease in Atlantic hurricane
activity during the 1970s and 1980s (e.g., Villarini and
Vecchi 2012, 2013; Dunstone et al. 2013). A second issue
is that uncertainties in the patterns of future sea surface
temperature (SST) changes can lead also to uncer-
tainties in the associated tropical cyclone projections
(Zhao et al. 2009; Sugi et al. 2009; Knutson et al. 2013).
There is also an important dependence of tropical cy-
clone intensity on the vertical structure of atmospheric
temperature changes, for which at least some historical
data/reanalyses are likely to have important shortcom-
ings (Vecchi et al. 2013). Finally, numerous studies have
found that the relatively coarse grid global models, such
as those used in phase 3 of the Coupled Model Inter-
comparison Project (CMIP3; Meehl et al. 2007) or
phase 5 (CMIP5; Taylor et al. 2012) usually do not
produce very realistic climatological tropical cyclone
activity (Camargo et al. 2013) and are particularly de-
ficient at simulating very intense (category 4 and 5)
tropical cyclones. Our previous studies of tropical cy-
clones for the Atlantic basin (Bender et al. 2010;
Knutson et al. 2013) found that the simulated frequency
response of very intense tropical cyclones to climate
warming differs from that of weaker tropical cyclones:
the intense tropical cyclones tend to increase in fre-
quency whereas the weaker tropical cyclones tend to
decrease in frequency in these simulations, using a va-
riety of CMIP3 andCMIP5model scenarios as boundary
forcings. Thus, some form of downscaling, for example
by regional or global model time-slice experiments
(Murakami et al. 2012b; Knutson et al. 2013), statistical
downscaling (Zhao and Held 2010), or statistical/
deterministic downscaling (Emanuel et al. 2008; Emanuel
2013), has commonly been used to attempt to gain in-
sight into the response of tropical cyclone activity to
climate change despite the coarse-resolution limitations
of the CMIP3 and CMIP5 climate models.
In this study, the main focus will be on using a dy-
namical downscaling approach to investigate the re-
sponse of tropical cyclones in all basins to a climate
change scenario obtained from a multimodel ensemble
of CMIP5 models (RCP4.5 scenario). Our approach
closely follows that of Bender et al. (2010) and Knutson
et al. (2013) for the Atlantic basin, but extends this ap-
proach to all ocean basins, with some methodological
adjustments as discussed in the model description sec-
tion. Among other published studies of possible future
global tropical cyclone activity, that of Murakami et al.
(2012b) appears exceptional in terms of the dynamical
model’s capability of simulating very intense (category 4
and 5) tropical cyclones. However, even in that case, the
model used by Murakami et al. did not include ocean
coupling, in which a storm generates a ‘‘cold wake’’ in
the SST field, particularly when traveling over regions
with a relatively shallow mixed layer. This process can
be an important negative feedback on tropical cyclone
intensity (e.g., Bender and Ginis 2000; Lin et al. 2013),
which could possibly alter the tropical cyclone response
to climate change [although see Knutson et al. (2001) for
an early assessment of this mechanism showing little
effect]. Therefore the present study appears to be
unique in comparison to previously published tropical
cyclone global projection studies in that the models can
simulate very intense (category 4 and 5) storms in vari-
ous basins using relatively high spatial resolution near
the storm (as fine as 6 km) while including ocean cou-
pling as a negative feedback on intensity.
As a preliminary test of the downscaling approach, we
first simulate global tropical cyclone activity for the
years 1980–2008 using observed interannually varying
SST and sea ice distributions. Each of these 3081 simu-
lated tropical cyclones (compared to 2518 tropical
cyclones for the same period in observations) is then
downscaled into the Geophysical Fluid Dynamics
Laboratory (GFDL) hurricane model so that higher-
intensity storms (category 4 and 5) can be simulated and
compared with observations in each basin. For observed
storm tracks and intensity, we use the HURDAT and
Joint Typhoon Warning Centers (JTWC) tropical cy-
clone datasets, except as noted in the text. We then
simulate and compare present-day and late-twenty-first-
century climate conditions using two sets of 20-yr runs
based on a repeating seasonal cycle design (no inter-
annual variability) as described in section 2. Thus, in
summary, we perform three basic sets of experiments:
historical (with interannually varying SSTs), present-
day control (repeating seasonal cycle), and late-twenty-
first century (repeating seasonal cycle).
1We use the term ‘‘tropical cyclone’’ in this report to refer collec-
tively to tropical storms and hurricanes (i.e., to tropical cyclones with
intensities exceeding 17.5m s21), with the latter having intensities
greater than 33m s21 regardless of their basin of occurrence.
7204 JOURNAL OF CL IMATE VOLUME 28
2. Model description
We use a two-step downscaling procedure to simu-
late tropical cyclones in our study. First we use a global
atmospheric model (50-km grid spacing) forced by a
present-day or future climate SSTs, sea ice, and ap-
propriate greenhouse gas levels to obtain a distribution
of tropical cyclone genesis. Each tropical cyclone gen-
erated using this global model is then downscaled into
the GFDL hurricane model, which is a regional model
that uses multiple layers of nesting to focus resolution
on a single tropical cyclone (grid spacing as fine as 6km)
for the duration of the cyclone, beginning from the time
the cyclone first reaches tropical storm intensity in the
global model.
a. HiRAM C180 global model
The GFDL High Resolution Atmospheric Model
(HiRAMC180; 50-km grid) used to simulate the genesis
of tropical cyclones is described in Zhao et al. (2009).
Given the global SST distribution and evolution, this
model has a demonstrated ability to simulate the in-
terannual variability of tropical cyclone occurrence
quite realistically, especially in the Atlantic basin, but
also to a reasonable degree in the northeast and north-
west Pacific basins (Zhao et al. 2009).
To reduce the confounding influence of interannual
variability (‘‘noise’’) on our climate change sensitivity
runs, we run control (present day) and late-twenty-first-
century downscaling experiments using 20 repeating
identical seasonal cycles of SST and external forcings for
each climate regime, with the control seasonal cycle
based on the time average (1982–2005) of the HadISST
SST dataset (see Zhao et al. 2009). Thus we are not at-
tempting to model the effect of any climate change–
induced changes in interannual variability (e.g., El
Niño–Southern Oscillation) in our cyclone simulations.
For the late-twenty-first-century climate change runs,
the changes in SSTs, sea ice, and greenhouse gas con-
centrations from the control run conditions are based
on the difference between 20-yr mean climatologies
from the multimodel mean of the CMIP5 RCP4.5 sce-
nario for years 2081–2100 (i.e., late twenty-first century)
and years 2001–20 (i.e., present day). Note there is a
15-yr difference between the midpoint year of our con-
trol condition SSTs (1994) and the midpoint year of the
baseline ‘‘present-day’’ period for the RCP4.5 climate
change calculations (2010). Therefore if one assumes
the control case to be representative of conditions for
1994, rather than 2010, then the so-called late-twenty-
first-century scenarios would correspond approximately
to the 20-yr period centered on 2075 (rather than 2090)
as obtained from the CMIP5/RCP4.5 scenarios. For
these climate change perturbation experiments the
SST increase in the various tropical storm basins ranges
from 1.18 to 1.78C as discussed in more detail later in
this report.
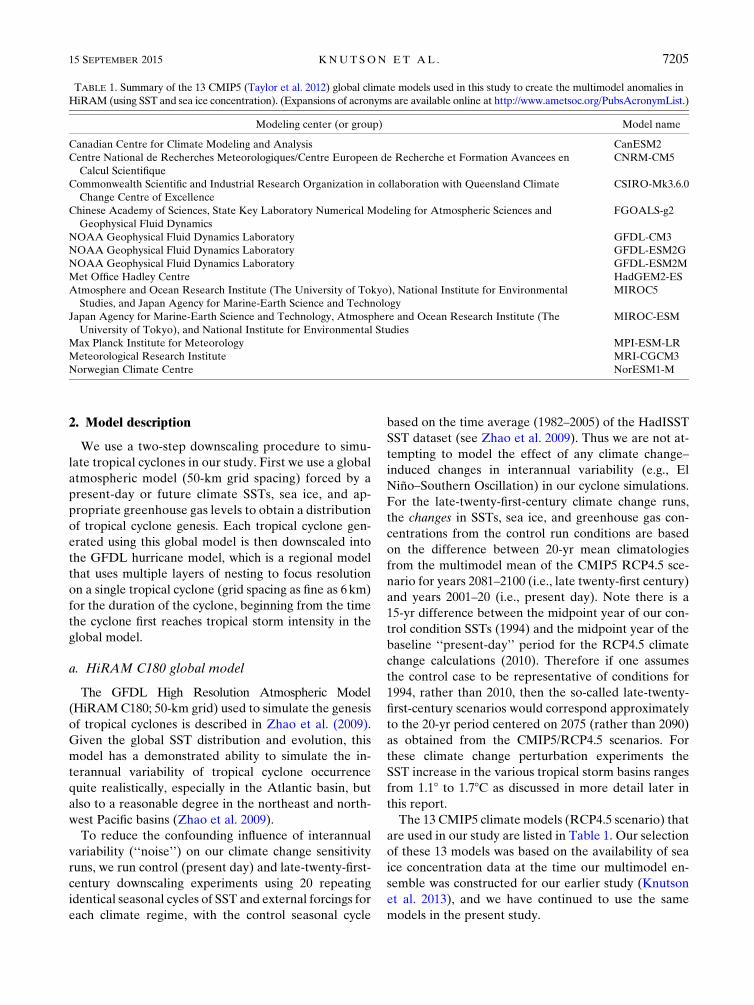
The 13 CMIP5 climate models (RCP4.5 scenario) that
are used in our study are listed in Table 1. Our selection
of these 13 models was based on the availability of sea
ice concentration data at the time our multimodel en-
semble was constructed for our earlier study (Knutson
et al. 2013), and we have continued to use the same
models in the present study.
TABLE 1. Summary of the 13 CMIP5 (Taylor et al. 2012) global climate models used in this study to create the multimodel anomalies in
HiRAM (using SST and sea ice concentration). (Expansions of acronyms are available online at http://www.ametsoc.org/PubsAcronymList.)
Modeling center (or group) Model name
Canadian Centre for Climate Modeling and Analysis CanESM2
Centre National de Recherches Meteorologiques/Centre Europeen de Recherche et Formation Avancees en
Calcul Scientifique
CNRM-CM5
Commonwealth Scientific and Industrial Research Organization in collaboration with Queensland Climate
Change Centre of Excellence
CSIRO-Mk3.6.0
Chinese Academy of Sciences, State Key Laboratory Numerical Modeling for Atmospheric Sciences and
Geophysical Fluid Dynamics
FGOALS-g2
NOAA Geophysical Fluid Dynamics Laboratory GFDL-CM3
NOAA Geophysical Fluid Dynamics Laboratory GFDL-ESM2G
NOAA Geophysical Fluid Dynamics Laboratory GFDL-ESM2M
Met Office Hadley Centre HadGEM2-ES
Atmosphere and Ocean Research Institute (The University of Tokyo), National Institute for Environmental
Studies, and Japan Agency for Marine-Earth Science and Technology
MIROC5
Japan Agency for Marine-Earth Science and Technology, Atmosphere and Ocean Research Institute (The
University of Tokyo), and National Institute for Environmental Studies
MIROC-ESM
Max Planck Institute for Meteorology MPI-ESM-LR
Meteorological Research Institute MRI-CGCM3
Norwegian Climate Centre NorESM1-M
15 SEPTEMBER 2015 KNUTSON ET AL . 7205
b. GFDL hurricane model
The individual tropical cyclones detected in the
HiRAM C180 global model [see Zhao et al. (2009) for
details of the detection scheme] are rerun at enhanced
resolution, and with ocean coupling, using a version of
the operational GFDL hurricane model. The hurricane
model consists of a triply nested moveable mesh atmo-
spheric model coupled to the Princeton Ocean Model
(POM; Bender et al. 2007). The 58 latitude by 58 longi-tude inner nest of the regional atmosphericmodel has, in
the version used in the present study, a horizontal grid
spacing of about 6 km (i.e., 1/188). The middle nest
covers an 118 3 118 region with a grid spacing of 1/68.The high-resolution (inner and middle) nests move
along with the storm to maintain enhanced resolution in
the vicinity of the tropical cyclone. The stationary outer
domain spans 1158 in the east–west direction and 508 inthe north–south direction with a grid spacing of 1/28 andis positioned for each tropical storm basin. The atmo-
spheric model physics has been modified from that used
in Bender et al. (2010) and Knutson et al. (2013) by
implementing the physics upgrades in the GFDL oper-
ational hurricane model adopted in 2012 (including
upgrades in cloud microphysics, cumulus parameteri-
zations, and boundary layer and surface physics). (See
http://www.nws.noaa.gov/os/notification/tin12-18gfdl_
aaa.htm for more details). The only exception is that
the inner-nest resolution in our experiments is set as 1/188(;6km) and the criterion for large-scale condensation
was appropriately modified. The hurricane model ex-
periments were run for up to 15 days, which allowed the
entire tropical cyclone lifetime of almost all storms to be
simulated, including the landfalling stages.
The ocean coupling included in our experiments
provides an important physical process for the simula-
tions, allowing the tropical cyclone to influence the
ocean and generating a cold wake in the SSTs, which
can in turn affect the cyclone’s intensity. As in the op-
erational prediction version of the model, the GFDL
hurricane model’s atmospheric component was coupled
to a one-dimensional version of the POM model for
all basins except the North Atlantic, where a three-
dimensional version was used. The ocean model was
initialized by the atmospheric analysis SST at the surface
and observed [U.S. Navy Generalized Digital Environ-
mental Data (GDEM)] climatology below, using an
assimilation methodology that prevents convective in-
stability in any model layers (Yablonsky and Ginis
2008). The integrations were initiated at the first di-
agnosed time of tropical storm intensity for the HiRAM
global model and initialized by interpolation without
any synthetic vortex replacement (or bogusing), such
that the peak wind speed and radius of maximum wind
in GFDL hurricane model at the initial time is the same
as that found in HiRAM. It is possible that some in-
cipient disturbances that failed to develop in the
HiRAM simulation would have developed into at least
tropical storms had they been initialized as weak dis-
turbances in the GFDL hurricane model. Thus we are
relying on the HiRAM solution to define the number of
tropical cyclone cases to downscale. For the climate
change experiments, we assumed that the ocean mixed
layer depth (defined here as the maximum depth at
which the ocean temperature is no more than 0.58Clower than at the surface) was unchanged in the
warmer climate. That is, the SST change from the cli-
mate models was applied through the entire mixed
layer. Below the mixed layer, this warming perturba-
tion was tapered to zero, with the tapering adjusted so
that the vertical temperature gradient did not exceed
0.048Cm21 (following Yablonsky and Ginis 2008). A
recent study Huang et al. (2015) suggests that in-
cluding the enhanced vertical gradient of upper ocean
surface temperature from CMIP5 late-twenty-first-
century simulations can reduce substantially the in-
tensification of TCs with climate change relative to a
case with no change in vertical gradient. While our
experiments include an enhanced vertical gradient
beneath the mixed layer, a more detailed comparison
with the findings of Huang et al. is a subject of a future
study. Note that the cold wakes generated by the
storms are only affecting the high-resolution nested
experiments. The storms do not feed back onto SSTs in
HiRAM. The original climate models would have in-
cluded some impact of simulated tropical cyclones on
the ocean, although those storms were much less in-
tense and distributed differently in time than those in
the dynamical downscaling framework analyzed here;
thus, we expect any impact of this effect on our results
to be small.
3. Simulated versus observed tropical cycloneactivity
In this section, we compare simulated and observed
tropical cyclone activity in terms of annual counts,
tracks, intensity distribution, precipitation distribution,
and storm size. Tropical cyclone activity as simulated for
the years 1980–2008 using interannually varying ob-
served SSTs is first summarized in Fig. 1. The storm
tracks from theHiRAMC180 global model (Fig. 1b) are
quite realistic in their geographical distribution, al-
though there are some deficiencies apparent in the
model simulation such as too few hurricane-strength
tropical cyclones over the northeast Pacific basin, Bay of
7206 JOURNAL OF CL IMATE VOLUME 28
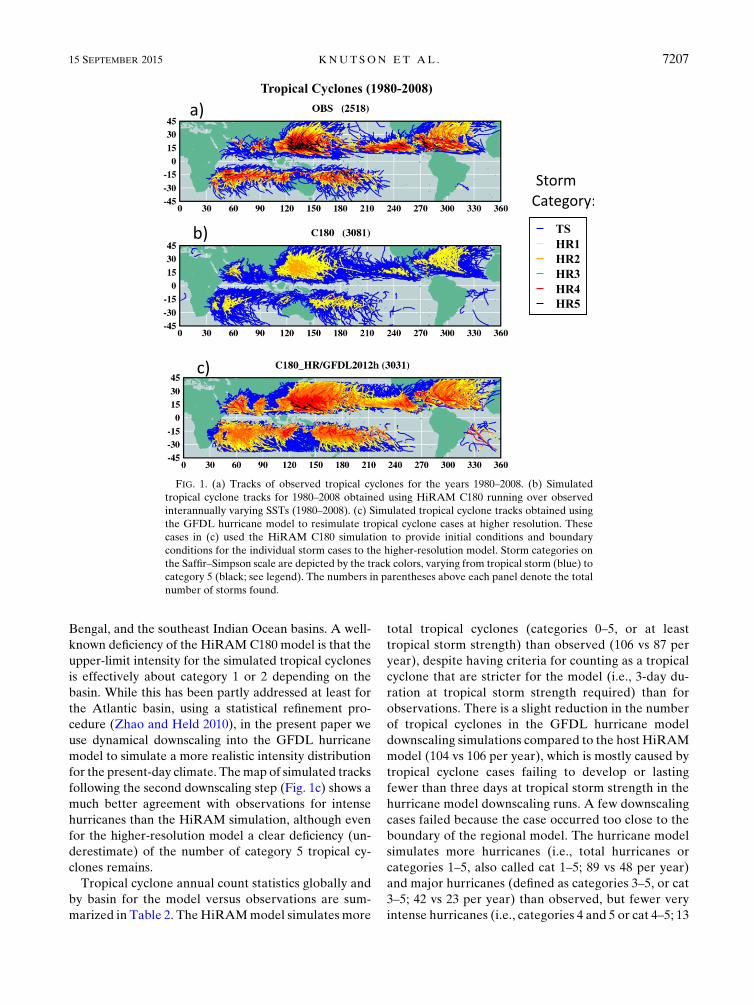
Bengal, and the southeast Indian Ocean basins. A well-
known deficiency of the HiRAMC180 model is that the
upper-limit intensity for the simulated tropical cyclones
is effectively about category 1 or 2 depending on the
basin. While this has been partly addressed at least for
the Atlantic basin, using a statistical refinement pro-
cedure (Zhao and Held 2010), in the present paper we
use dynamical downscaling into the GFDL hurricane
model to simulate a more realistic intensity distribution
for the present-day climate. Themap of simulated tracks
following the second downscaling step (Fig. 1c) shows a
much better agreement with observations for intense
hurricanes than the HiRAM simulation, although even
for the higher-resolution model a clear deficiency (un-
derestimate) of the number of category 5 tropical cy-
clones remains.
Tropical cyclone annual count statistics globally and
by basin for the model versus observations are sum-
marized in Table 2. TheHiRAMmodel simulates more
total tropical cyclones (categories 0–5, or at least
tropical storm strength) than observed (106 vs 87 per
year), despite having criteria for counting as a tropical
cyclone that are stricter for the model (i.e., 3-day du-
ration at tropical storm strength required) than for
observations. There is a slight reduction in the number
of tropical cyclones in the GFDL hurricane model
downscaling simulations compared to the host HiRAM
model (104 vs 106 per year), which is mostly caused by
tropical cyclone cases failing to develop or lasting
fewer than three days at tropical storm strength in the
hurricane model downscaling runs. A few downscaling
cases failed because the case occurred too close to the
boundary of the regional model. The hurricane model
simulates more hurricanes (i.e., total hurricanes or
categories 1–5, also called cat 1–5; 89 vs 48 per year)
and major hurricanes (defined as categories 3–5, or cat
3–5; 42 vs 23 per year) than observed, but fewer very
intense hurricanes (i.e., categories 4 and 5 or cat 4–5; 13
FIG. 1. (a) Tracks of observed tropical cyclones for the years 1980–2008. (b) Simulated
tropical cyclone tracks for 1980–2008 obtained using HiRAM C180 running over observed
interannually varying SSTs (1980–2008). (c) Simulated tropical cyclone tracks obtained using
the GFDL hurricane model to resimulate tropical cyclone cases at higher resolution. These
cases in (c) used the HiRAM C180 simulation to provide initial conditions and boundary
conditions for the individual storm cases to the higher-resolution model. Storm categories on
the Saffir–Simpson scale are depicted by the track colors, varying from tropical storm (blue) to
category 5 (black; see legend). The numbers in parentheses above each panel denote the total
number of storms found.
15 SEPTEMBER 2015 KNUTSON ET AL . 7207
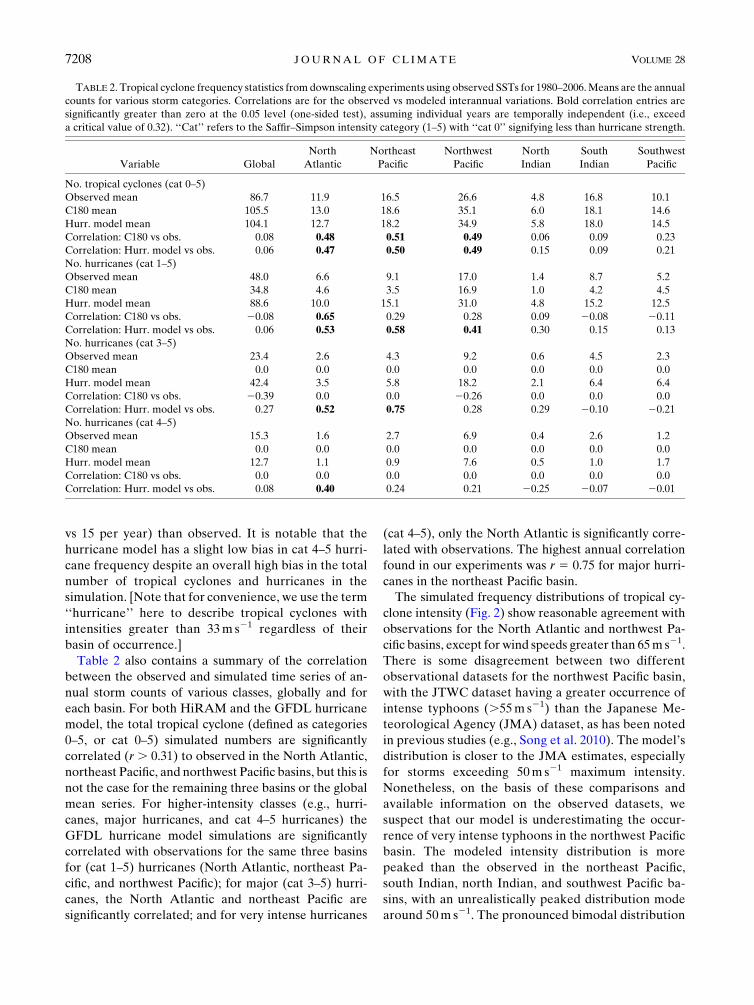
vs 15 per year) than observed. It is notable that the
hurricane model has a slight low bias in cat 4–5 hurri-
cane frequency despite an overall high bias in the total
number of tropical cyclones and hurricanes in the
simulation. [Note that for convenience, we use the term
‘‘hurricane’’ here to describe tropical cyclones with
intensities greater than 33m s21 regardless of their
basin of occurrence.]
Table 2 also contains a summary of the correlation
between the observed and simulated time series of an-
nual storm counts of various classes, globally and for
each basin. For both HiRAM and the GFDL hurricane
model, the total tropical cyclone (defined as categories
0–5, or cat 0–5) simulated numbers are significantly
correlated (r . 0.31) to observed in the North Atlantic,
northeast Pacific, and northwest Pacific basins, but this is
not the case for the remaining three basins or the global
mean series. For higher-intensity classes (e.g., hurri-
canes, major hurricanes, and cat 4–5 hurricanes) the
GFDL hurricane model simulations are significantly
correlated with observations for the same three basins
for (cat 1–5) hurricanes (North Atlantic, northeast Pa-
cific, and northwest Pacific); for major (cat 3–5) hurri-
canes, the North Atlantic and northeast Pacific are
significantly correlated; and for very intense hurricanes
(cat 4–5), only the North Atlantic is significantly corre-
lated with observations. The highest annual correlation
found in our experiments was r 5 0.75 for major hurri-
canes in the northeast Pacific basin.
The simulated frequency distributions of tropical cy-
clone intensity (Fig. 2) show reasonable agreement with
observations for the North Atlantic and northwest Pa-
cific basins, except for wind speeds greater than 65m s21.
There is some disagreement between two different
observational datasets for the northwest Pacific basin,
with the JTWC dataset having a greater occurrence of
intense typhoons (.55m s21) than the Japanese Me-
teorological Agency (JMA) dataset, as has been noted
in previous studies (e.g., Song et al. 2010). The model’s
distribution is closer to the JMA estimates, especially
for storms exceeding 50m s21 maximum intensity.
Nonetheless, on the basis of these comparisons and
available information on the observed datasets, we
suspect that our model is underestimating the occur-
rence of very intense typhoons in the northwest Pacific
basin. The modeled intensity distribution is more
peaked than the observed in the northeast Pacific,
south Indian, north Indian, and southwest Pacific ba-
sins, with an unrealistically peaked distribution mode
around 50m s21. The pronounced bimodal distribution
TABLE 2. Tropical cyclone frequency statistics from downscaling experiments using observed SSTs for 1980–2006.Means are the annual
counts for various storm categories. Correlations are for the observed vs modeled interannual variations. Bold correlation entries are
significantly greater than zero at the 0.05 level (one-sided test), assuming individual years are temporally independent (i.e., exceed
a critical value of 0.32). ‘‘Cat’’ refers to the Saffir–Simpson intensity category (1–5) with ‘‘cat 0’’ signifying less than hurricane strength.
Variable Global
North
Atlantic
Northeast
Pacific
Northwest
Pacific
North
Indian
South
Indian
Southwest
Pacific
No. tropical cyclones (cat 0–5)
Observed mean 86.7 11.9 16.5 26.6 4.8 16.8 10.1
C180 mean 105.5 13.0 18.6 35.1 6.0 18.1 14.6
Hurr. model mean 104.1 12.7 18.2 34.9 5.8 18.0 14.5
Correlation: C180 vs obs. 0.08 0.48 0.51 0.49 0.06 0.09 0.23
Correlation: Hurr. model vs obs. 0.06 0.47 0.50 0.49 0.15 0.09 0.21
No. hurricanes (cat 1–5)
Observed mean 48.0 6.6 9.1 17.0 1.4 8.7 5.2
C180 mean 34.8 4.6 3.5 16.9 1.0 4.2 4.5
Hurr. model mean 88.6 10.0 15.1 31.0 4.8 15.2 12.5
Correlation: C180 vs obs. 20.08 0.65 0.29 0.28 0.09 20.08 20.11
Correlation: Hurr. model vs obs. 0.06 0.53 0.58 0.41 0.30 0.15 0.13
No. hurricanes (cat 3–5)
Observed mean 23.4 2.6 4.3 9.2 0.6 4.5 2.3
C180 mean 0.0 0.0 0.0 0.0 0.0 0.0 0.0
Hurr. model mean 42.4 3.5 5.8 18.2 2.1 6.4 6.4
Correlation: C180 vs obs. 20.39 0.0 0.0 20.26 0.0 0.0 0.0
Correlation: Hurr. model vs obs. 0.27 0.52 0.75 0.28 0.29 20.10 20.21
No. hurricanes (cat 4–5)
Observed mean 15.3 1.6 2.7 6.9 0.4 2.6 1.2
C180 mean 0.0 0.0 0.0 0.0 0.0 0.0 0.0
Hurr. model mean 12.7 1.1 0.9 7.6 0.5 1.0 1.7
Correlation: C180 vs obs. 0.0 0.0 0.0 0.0 0.0 0.0 0.0
Correlation: Hurr. model vs obs. 0.08 0.40 0.24 0.21 20.25 20.07 20.01
7208 JOURNAL OF CL IMATE VOLUME 28
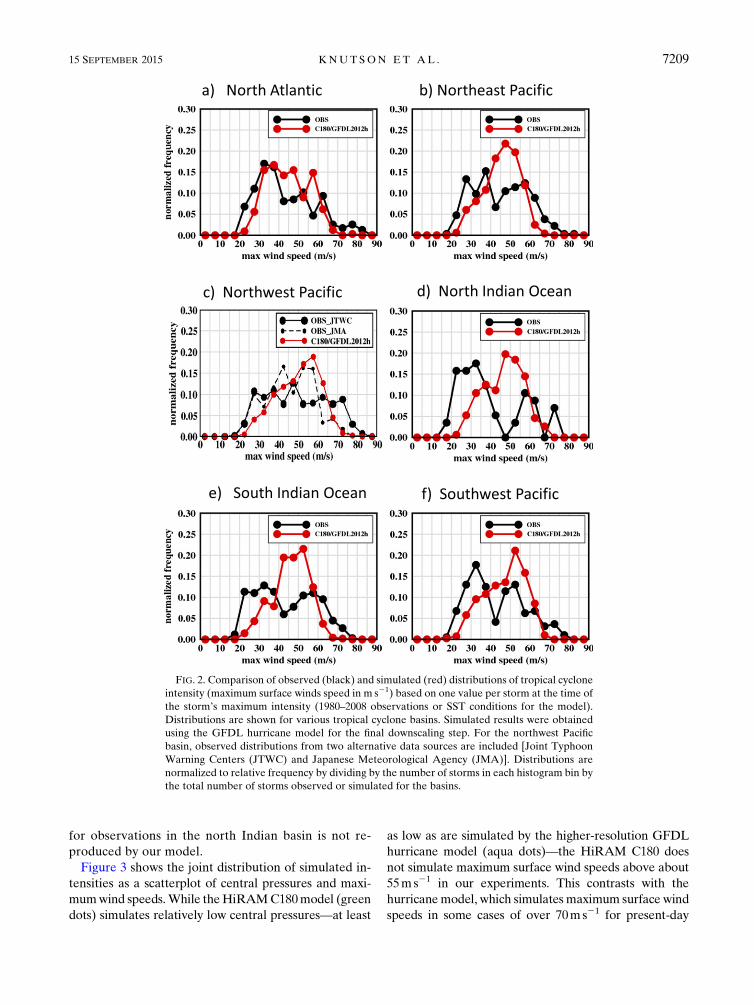
for observations in the north Indian basin is not re-
produced by our model.
Figure 3 shows the joint distribution of simulated in-
tensities as a scatterplot of central pressures and maxi-
mumwind speeds.While theHiRAMC180model (green
dots) simulates relatively low central pressures—at least
as low as are simulated by the higher-resolution GFDL
hurricane model (aqua dots)—the HiRAM C180 does
not simulate maximum surface wind speeds above about
55ms21 in our experiments. This contrasts with the
hurricanemodel, which simulates maximum surface wind
speeds in some cases of over 70ms21 for present-day
FIG. 2. Comparison of observed (black) and simulated (red) distributions of tropical cyclone
intensity (maximum surface winds speed in m s21) based on one value per storm at the time of
the storm’s maximum intensity (1980–2008 observations or SST conditions for the model).
Distributions are shown for various tropical cyclone basins. Simulated results were obtained
using the GFDL hurricane model for the final downscaling step. For the northwest Pacific
basin, observed distributions from two alternative data sources are included [Joint Typhoon
Warning Centers (JTWC) and Japanese Meteorological Agency (JMA)]. Distributions are
normalized to relative frequency by dividing by the number of storms in each histogram bin by
the total number of storms observed or simulated for the basins.
15 SEPTEMBER 2015 KNUTSON ET AL . 7209
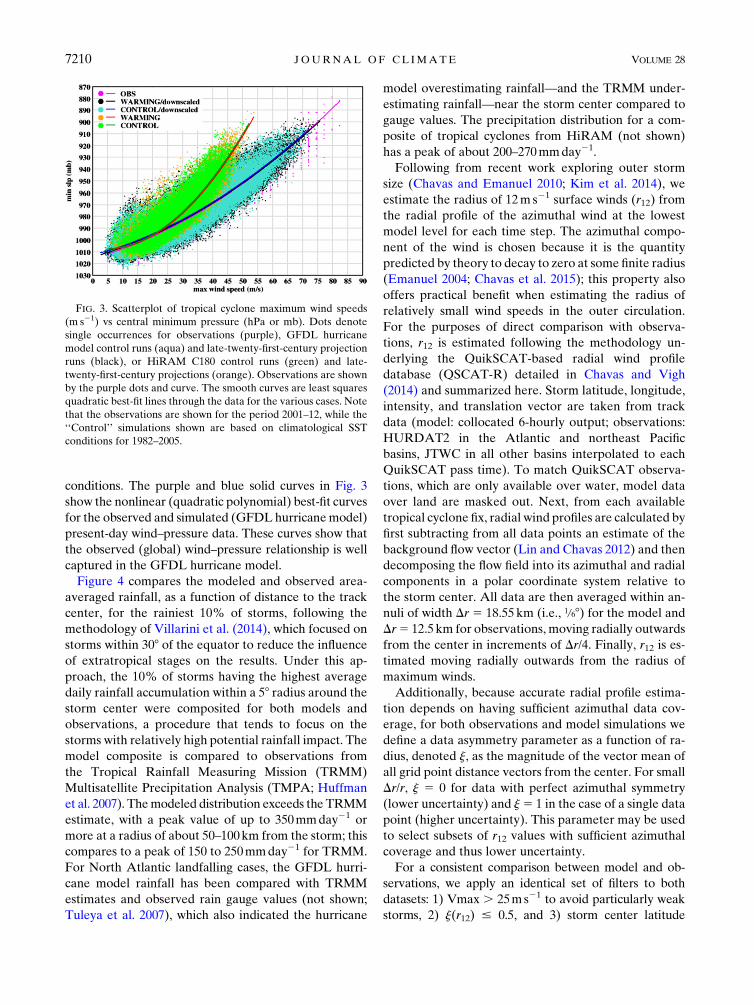
conditions. The purple and blue solid curves in Fig. 3
show the nonlinear (quadratic polynomial) best-fit curves
for the observed and simulated (GFDL hurricanemodel)
present-day wind–pressure data. These curves show that
the observed (global) wind–pressure relationship is well
captured in the GFDL hurricane model.
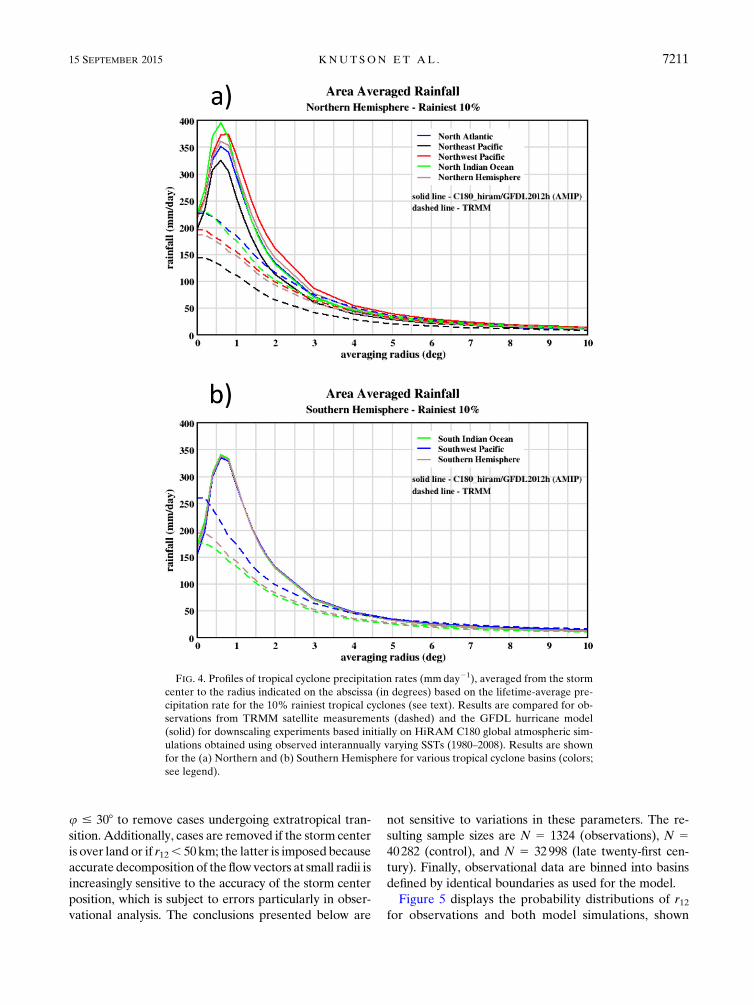
Figure 4 compares the modeled and observed area-
averaged rainfall, as a function of distance to the track
center, for the rainiest 10% of storms, following the
methodology of Villarini et al. (2014), which focused on
storms within 308 of the equator to reduce the influence
of extratropical stages on the results. Under this ap-
proach, the 10% of storms having the highest average
daily rainfall accumulation within a 58 radius around the
storm center were composited for both models and
observations, a procedure that tends to focus on the
storms with relatively high potential rainfall impact. The
model composite is compared to observations from
the Tropical Rainfall Measuring Mission (TRMM)
Multisatellite Precipitation Analysis (TMPA; Huffman
et al. 2007). Themodeled distribution exceeds the TRMM
estimate, with a peak value of up to 350mmday21 or
more at a radius of about 50–100km from the storm; this
compares to a peak of 150 to 250mmday21 for TRMM.
For North Atlantic landfalling cases, the GFDL hurri-
cane model rainfall has been compared with TRMM
estimates and observed rain gauge values (not shown;
Tuleya et al. 2007), which also indicated the hurricane
model overestimating rainfall—and the TRMM under-
estimating rainfall—near the storm center compared to
gauge values. The precipitation distribution for a com-
posite of tropical cyclones from HiRAM (not shown)
has a peak of about 200–270mmday21.
Following from recent work exploring outer storm
size (Chavas and Emanuel 2010; Kim et al. 2014), we
estimate the radius of 12m s21 surface winds (r12) from
the radial profile of the azimuthal wind at the lowest
model level for each time step. The azimuthal compo-
nent of the wind is chosen because it is the quantity
predicted by theory to decay to zero at some finite radius
(Emanuel 2004; Chavas et al. 2015); this property also
offers practical benefit when estimating the radius of
relatively small wind speeds in the outer circulation.
For the purposes of direct comparison with observa-
tions, r12 is estimated following the methodology un-
derlying the QuikSCAT-based radial wind profile
database (QSCAT-R) detailed in Chavas and Vigh
(2014) and summarized here. Storm latitude, longitude,
intensity, and translation vector are taken from track
data (model: collocated 6-hourly output; observations:
HURDAT2 in the Atlantic and northeast Pacific
basins, JTWC in all other basins interpolated to each
QuikSCAT pass time). To match QuikSCAT observa-
tions, which are only available over water, model data
over land are masked out. Next, from each available
tropical cyclone fix, radial wind profiles are calculated by
first subtracting from all data points an estimate of the
background flow vector (Lin and Chavas 2012) and then
decomposing the flow field into its azimuthal and radial
components in a polar coordinate system relative to
the storm center. All data are then averaged within an-
nuli of width Dr 5 18.55 km (i.e., 1/68) for the model and
Dr5 12.5 km for observations, moving radially outwards
from the center in increments of Dr/4. Finally, r12 is es-timated moving radially outwards from the radius of
maximum winds.
Additionally, because accurate radial profile estima-
tion depends on having sufficient azimuthal data cov-
erage, for both observations and model simulations we
define a data asymmetry parameter as a function of ra-
dius, denoted j, as the magnitude of the vector mean of
all grid point distance vectors from the center. For small
Dr/r, j 5 0 for data with perfect azimuthal symmetry
(lower uncertainty) and j5 1 in the case of a single data
point (higher uncertainty). This parameter may be used
to select subsets of r12 values with sufficient azimuthal
coverage and thus lower uncertainty.
For a consistent comparison between model and ob-
servations, we apply an identical set of filters to both
datasets: 1) Vmax . 25ms21 to avoid particularly weak
storms, 2) j(r12) # 0.5, and 3) storm center latitude
FIG. 3. Scatterplot of tropical cyclone maximum wind speeds
(m s21) vs central minimum pressure (hPa or mb). Dots denote
single occurrences for observations (purple), GFDL hurricane
model control runs (aqua) and late-twenty-first-century projection
runs (black), or HiRAM C180 control runs (green) and late-
twenty-first-century projections (orange). Observations are shown
by the purple dots and curve. The smooth curves are least squares
quadratic best-fit lines through the data for the various cases. Note
that the observations are shown for the period 2001–12, while the
‘‘Control’’ simulations shown are based on climatological SST
conditions for 1982–2005.
7210 JOURNAL OF CL IMATE VOLUME 28
u # 308 to remove cases undergoing extratropical tran-
sition. Additionally, cases are removed if the storm center
is over land or if r12, 50km; the latter is imposed because
accurate decomposition of the flowvectors at small radii is
increasingly sensitive to the accuracy of the storm center
position, which is subject to errors particularly in obser-
vational analysis. The conclusions presented below are
not sensitive to variations in these parameters. The re-
sulting sample sizes are N 5 1324 (observations), N 540282 (control), and N 5 32998 (late twenty-first cen-
tury). Finally, observational data are binned into basins
defined by identical boundaries as used for the model.
Figure 5 displays the probability distributions of r12for observations and both model simulations, shown
FIG. 4. Profiles of tropical cyclone precipitation rates (mmday21), averaged from the storm
center to the radius indicated on the abscissa (in degrees) based on the lifetime-average pre-
cipitation rate for the 10% rainiest tropical cyclones (see text). Results are compared for ob-
servations from TRMM satellite measurements (dashed) and the GFDL hurricane model
(solid) for downscaling experiments based initially on HiRAM C180 global atmospheric sim-
ulations obtained using observed interannually varying SSTs (1980–2008). Results are shown
for the (a) Northern and (b) Southern Hemisphere for various tropical cyclone basins (colors;
see legend).
15 SEPTEMBER 2015 KNUTSON ET AL . 7211
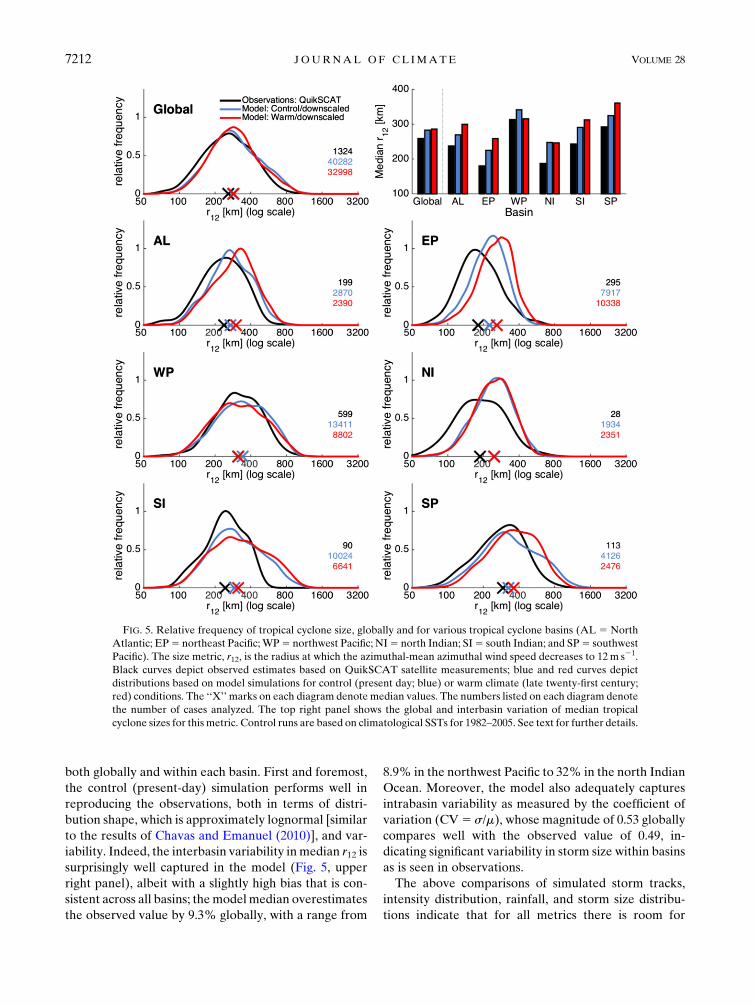
both globally and within each basin. First and foremost,
the control (present-day) simulation performs well in
reproducing the observations, both in terms of distri-
bution shape, which is approximately lognormal [similar
to the results of Chavas and Emanuel (2010)], and var-
iability. Indeed, the interbasin variability inmedian r12 is
surprisingly well captured in the model (Fig. 5, upper
right panel), albeit with a slightly high bias that is con-
sistent across all basins; themodelmedian overestimates
the observed value by 9.3% globally, with a range from
8.9% in the northwest Pacific to 32% in the north Indian
Ocean. Moreover, the model also adequately captures
intrabasin variability as measured by the coefficient of
variation (CV5 s/m), whose magnitude of 0.53 globally
compares well with the observed value of 0.49, in-
dicating significant variability in storm size within basins
as is seen in observations.
The above comparisons of simulated storm tracks,
intensity distribution, rainfall, and storm size distribu-
tions indicate that for all metrics there is room for
FIG. 5. Relative frequency of tropical cyclone size, globally and for various tropical cyclone basins (AL 5 North
Atlantic; EP5 northeast Pacific;WP5 northwest Pacific; NI5 north Indian; SI5 south Indian; and SP5 southwest
Pacific). The size metric, r12, is the radius at which the azimuthal-mean azimuthal wind speed decreases to 12m s21.
Black curves depict observed estimates based on QuikSCAT satellite measurements; blue and red curves depict
distributions based on model simulations for control (present day; blue) or warm climate (late twenty-first century;
red) conditions. The ‘‘X’’ marks on each diagram denote median values. The numbers listed on each diagram denote
the number of cases analyzed. The top right panel shows the global and interbasin variation of median tropical
cyclone sizes for this metric. Control runs are based on climatological SSTs for 1982–2005. See text for further details.
7212 JOURNAL OF CL IMATE VOLUME 28
improvement, but the results suggest that the model
simulation of present-day tropical cyclone activity is
adequate to justify an exploration of our downscaling
framework’s response to climate change scenarios for
the late twenty-first century, keeping in mind the de-
ficiencies noted in this section.
4. Late-twenty-first-century climate changescenarios
a. Tropical cyclone genesis frequency changes
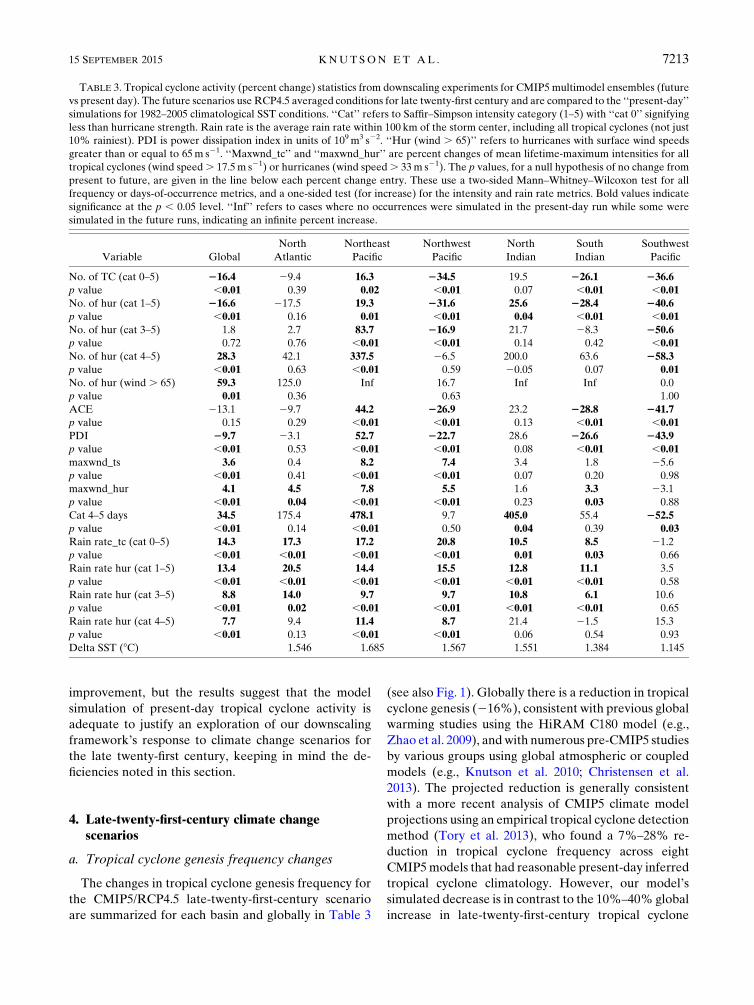
The changes in tropical cyclone genesis frequency for
the CMIP5/RCP4.5 late-twenty-first-century scenario
are summarized for each basin and globally in Table 3
(see also Fig. 1). Globally there is a reduction in tropical
cyclone genesis (216%), consistent with previous global
warming studies using the HiRAM C180 model (e.g.,
Zhao et al. 2009), andwith numerous pre-CMIP5 studies
by various groups using global atmospheric or coupled
models (e.g., Knutson et al. 2010; Christensen et al.
2013). The projected reduction is generally consistent
with a more recent analysis of CMIP5 climate model
projections using an empirical tropical cyclone detection
method (Tory et al. 2013), who found a 7%–28% re-
duction in tropical cyclone frequency across eight
CMIP5models that had reasonable present-day inferred
tropical cyclone climatology. However, our model’s
simulated decrease is in contrast to the 10%–40% global
increase in late-twenty-first-century tropical cyclone
TABLE 3. Tropical cyclone activity (percent change) statistics from downscaling experiments for CMIP5 multimodel ensembles (future
vs present day). The future scenarios use RCP4.5 averaged conditions for late twenty-first century and are compared to the ‘‘present-day’’
simulations for 1982–2005 climatological SST conditions. ‘‘Cat’’ refers to Saffir–Simpson intensity category (1–5) with ‘‘cat 0’’ signifying
less than hurricane strength. Rain rate is the average rain rate within 100 km of the storm center, including all tropical cyclones (not just
10% rainiest). PDI is power dissipation index in units of 109m3 s22. ‘‘Hur (wind . 65)’’ refers to hurricanes with surface wind speeds
greater than or equal to 65m s21. ‘‘Maxwnd_tc’’ and ‘‘maxwnd_hur’’ are percent changes of mean lifetime-maximum intensities for all
tropical cyclones (wind speed. 17.5m s21) or hurricanes (wind speed. 33m s21). The p values, for a null hypothesis of no change from
present to future, are given in the line below each percent change entry. These use a two-sided Mann–Whitney–Wilcoxon test for all
frequency or days-of-occurrence metrics, and a one-sided test (for increase) for the intensity and rain rate metrics. Bold values indicate
significance at the p , 0.05 level. ‘‘Inf’’ refers to cases where no occurrences were simulated in the present-day run while some were
simulated in the future runs, indicating an infinite percent increase.
Variable Global
North
Atlantic
Northeast
Pacific
Northwest
Pacific
North
Indian
South
Indian
Southwest
Pacific
No. of TC (cat 0–5) 216.4 29.4 16.3 234.5 19.5 226.1 236.6
p value ,0.01 0.39 0.02 ,0.01 0.07 ,0.01 ,0.01No. of hur (cat 1–5) 216.6 217.5 19.3 231.6 25.6 228.4 240.6
p value ,0.01 0.16 0.01 ,0.01 0.04 ,0.01 ,0.01
No. of hur (cat 3–5) 1.8 2.7 83.7 216.9 21.7 28.3 250.6p value 0.72 0.76 ,0.01 ,0.01 0.14 0.42 ,0.01
No. of hur (cat 4–5) 28.3 42.1 337.5 26.5 200.0 63.6 258.3
p value ,0.01 0.63 ,0.01 0.59 20.05 0.07 0.01
No. of hur (wind . 65) 59.3 125.0 Inf 16.7 Inf Inf 0.0
p value 0.01 0.36 0.63 1.00
ACE 213.1 29.7 44.2 226.9 23.2 228.8 241.7
p value 0.15 0.29 ,0.01 ,0.01 0.13 ,0.01 ,0.01
PDI 29.7 23.1 52.7 222.7 28.6 226.6 243.9p value ,0.01 0.53 ,0.01 ,0.01 0.08 ,0.01 ,0.01
maxwnd_ts 3.6 0.4 8.2 7.4 3.4 1.8 25.6
p value ,0.01 0.41 ,0.01 ,0.01 0.07 0.20 0.98
maxwnd_hur 4.1 4.5 7.8 5.5 1.6 3.3 23.1
p value ,0.01 0.04 ,0.01 ,0.01 0.23 0.03 0.88
Cat 4–5 days 34.5 175.4 478.1 9.7 405.0 55.4 252.5
p value ,0.01 0.14 ,0.01 0.50 0.04 0.39 0.03Rain rate_tc (cat 0–5) 14.3 17.3 17.2 20.8 10.5 8.5 21.2
p value ,0.01 ,0.01 ,0.01 ,0.01 0.01 0.03 0.66
Rain rate hur (cat 1–5) 13.4 20.5 14.4 15.5 12.8 11.1 3.5
p value ,0.01 ,0.01 ,0.01 ,0.01 ,0.01 ,0.01 0.58
Rain rate hur (cat 3–5) 8.8 14.0 9.7 9.7 10.8 6.1 10.6
p value ,0.01 0.02 ,0.01 ,0.01 ,0.01 ,0.01 0.65
Rain rate hur (cat 4–5) 7.7 9.4 11.4 8.7 21.4 21.5 15.3
p value ,0.01 0.13 ,0.01 ,0.01 0.06 0.54 0.93
Delta SST (8C) 1.546 1.685 1.567 1.551 1.384 1.145
15 SEPTEMBER 2015 KNUTSON ET AL . 7213
frequency projected byEmanuel (2013) using a statistical–
deterministic framework with CMIP5 RCP8.5 projec-
tions. The projections in Emanuel (2013) and Tory et al.
for the late twenty-first century used subsets of CMIP5
models that were different from those included in our
study, and both of those studies were based on a
downscaling of the stronger climate forcing (RCP8.5)
scenario.
As shown by Held and Zhao (2011), the reduction in
tropical cyclone frequency in HiRAM includes a con-
tribution from the direct effect of increasing atmo-
spheric CO2 (with SST held fixed). Their finding and
that of Zhao et al. (2013) confirm the earlier findings of
Yoshimura and Sugi (2005). Zhao et al. (2013) show that
for the seven models they examined, the CO2-induced
reduction in genesis frequency is even more robust
across models than the reduction in genesis frequency
associated with a 2-K uniform SST warming alone. The
physical mechanism producing the global reduction in
tropical cyclone frequency in the various model pro-
jections is still unclear, but possible mechanisms
include a slowing of the large-scale tropical circulation
(Sugi et al. 2002; Bengtsson et al. 2007) due to mecha-
nisms as discussed in Knutson and Manabe (1995) and
Held and Soden (2006) or increases in the saturation
deficit between the surface and middle troposphere
(Emanuel et al. 2008). A recent discussion of the fre-
quency reduction issue is given in Sugi et al. (2012).
The reduced global genesis frequency in the RCP4.5
experiments is reflected in a reduction in four of the six
major tropical cyclone basins (North Atlantic, north-
west Pacific, south Indian, and southwest Pacific). An
increase is simulated for the northeast Pacific and north
Indian Ocean basins. An increase is also simulated for
the South Atlantic basin (Fig. 1), although this basin
is a special case where the historical occurrence is quite
rare (e.g., Catarina in 2004); moreover, the HiRAM
C180 seems to overestimate present-day genesis rate
there (cf. Figs. 1a and 1b), implying that quantitative
projections of increases for this basin should be viewed
with caution.
b. Storm intensity changes
Figure 3 shows that both HiRAM and the GFDL
hurricane model have a slightly expanded range of high
intensities for the warmer climate conditions, consider-
ing all basins as an aggregate global distribution. This is
shown by the occurrence of black dots and orange dots
on Fig. 3 at the upper right edges of the scatterplot re-
gion, extending beyond the green and aqua-colored dot
regions, respectively.
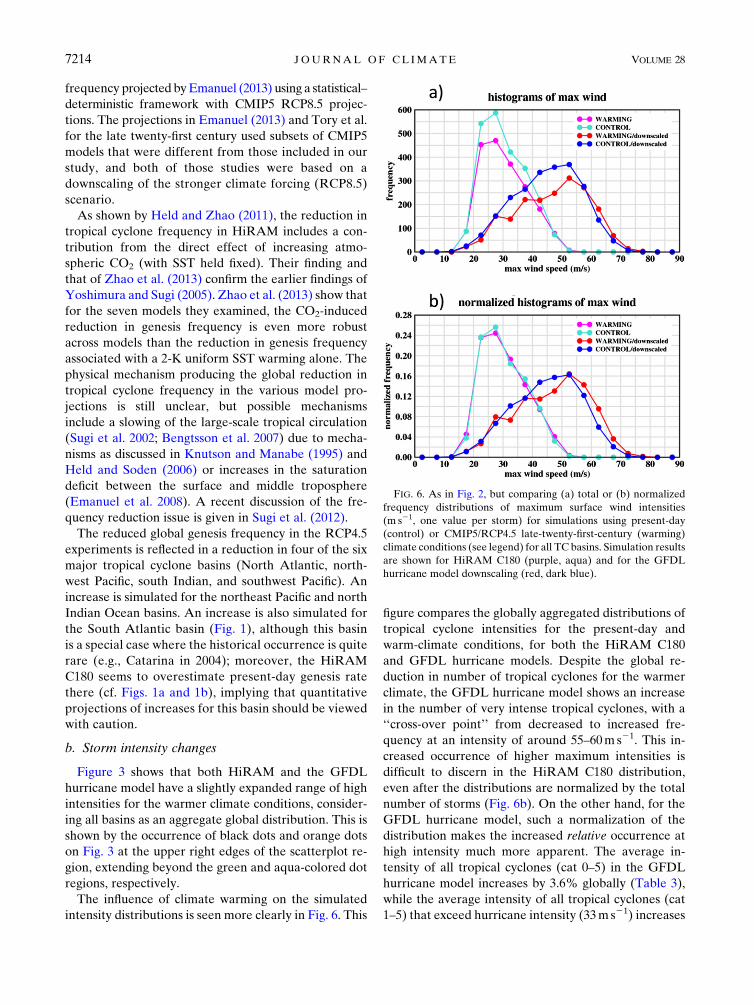
The influence of climate warming on the simulated
intensity distributions is seen more clearly in Fig. 6. This
figure compares the globally aggregated distributions of
tropical cyclone intensities for the present-day and
warm-climate conditions, for both the HiRAM C180
and GFDL hurricane models. Despite the global re-
duction in number of tropical cyclones for the warmer
climate, the GFDL hurricane model shows an increase
in the number of very intense tropical cyclones, with a
‘‘cross-over point’’ from decreased to increased fre-
quency at an intensity of around 55–60m s21. This in-
creased occurrence of higher maximum intensities is
difficult to discern in the HiRAM C180 distribution,
even after the distributions are normalized by the total
number of storms (Fig. 6b). On the other hand, for the
GFDL hurricane model, such a normalization of the
distribution makes the increased relative occurrence at
high intensity much more apparent. The average in-
tensity of all tropical cyclones (cat 0–5) in the GFDL
hurricane model increases by 3.6% globally (Table 3),
while the average intensity of all tropical cyclones (cat
1–5) that exceed hurricane intensity (33ms21) increases
FIG. 6. As in Fig. 2, but comparing (a) total or (b) normalized
frequency distributions of maximum surface wind intensities
(m s21, one value per storm) for simulations using present-day
(control) or CMIP5/RCP4.5 late-twenty-first-century (warming)
climate conditions (see legend) for all TC basins. Simulation results
are shown for HiRAM C180 (purple, aqua) and for the GFDL
hurricane model downscaling (red, dark blue).
7214 JOURNAL OF CL IMATE VOLUME 28
by 4.1%. For HiRAM, the average intensity of all
tropical cyclones increases by 0.4% globally, while the
average intensity of all tropical cyclones that exceed
hurricane intensity increases by 0.7%. The larger in-
tensity increases we find for the GFDL hurricane model
(compared to HiRAM) are relatively more consistent
with previous studies for the Atlantic basin (Hill and
Lackmann 2011; Knutson et al. 2013) and for the globe
(Oouchi et al. 2006; Murakami et al. 2012b) that used
relatively high-resolution modeling frameworks (2–9-km
grid spacing for theAtlantic studies; 20-km grid spacing
in Oouchi et al. and Murakami et al.).
The results in Table 3 indicate that the projected in-
tensity increases noted above for the global distributions
do not occur in all basins. For tropical cyclones ex-
ceeding tropical storm or hurricane intensity (greater
than 17.5 or 33m s21, respectively), the average intensity
decreases in the southwest Pacific basin by 25.6%
and 23.1%, respectively. The average intensity of hur-
ricanes increases in the Atlantic by14.5%, although the
average intensity of all tropical cyclones combined
barely changes (10.4%) in the Atlantic basin. The basin
with the most pronounced intensity increases is the
northeast Pacific (18% for all tropical cyclones and also
for hurricanes). The northwest Pacific basin also has
statistically significant projected maximum intensity in-
creases of 17% for all tropical cyclones and 16% for
hurricanes.
c. Storm track and occurrence changes
While tropical cyclone genesis rates are important,
metrics that are even more closely tied to impacts in-
clude the storm tracks and maps of storm occurrence
rates. Additionally, a small number of very intense storms
have caused a disproportionate amount of damage his-
torically (e.g., Pielke et al. 2008). The tracks of all storms
that reach at least category-4 intensity (.58ms21) in the
present-day and late-twenty-first-century simulations
are shown in Fig. 7. The global increase in the number of
these storms is 128% (244 storms in the control versus
313 storms in the late-twenty-first-century simulation).
A reduction is apparent in the southwest Pacific basin
(258%; Table 3). The basin with the largest fractional
increase is the northeast Pacific (1338%) although sub-
stantial increases are also projected in the Atlantic
(142%), north Indian (1200%), and south Indian
(164%) basins. Focusing on the strongest category of
storm in our simulations (maximum surface wind speeds
exceeding 65ms21), Table 3 shows that the global fre-
quency increases by 59%,with increases in all basins except
the southwest Pacific, where there is no change in projected
frequency; however, the annual number of storms of this
intensity is very limited in our simulated study (increasing
from 2.7 to 4.3yr21).
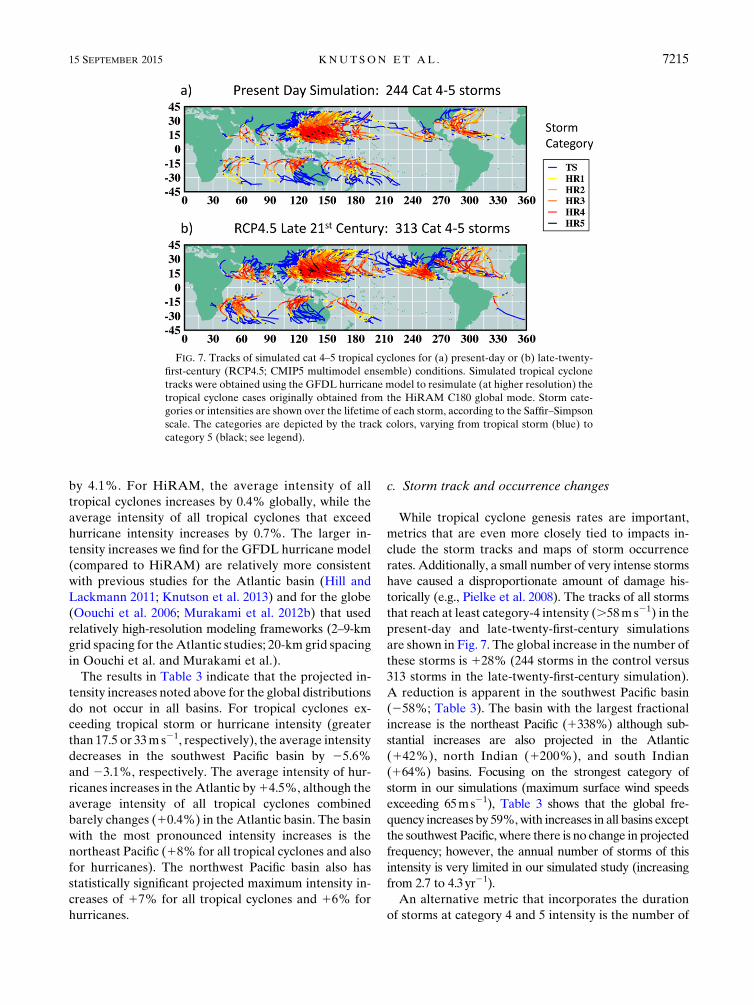
An alternative metric that incorporates the duration
of storms at category 4 and 5 intensity is the number of
FIG. 7. Tracks of simulated cat 4–5 tropical cyclones for (a) present-day or (b) late-twenty-
first-century (RCP4.5; CMIP5 multimodel ensemble) conditions. Simulated tropical cyclone
tracks were obtained using the GFDL hurricane model to resimulate (at higher resolution) the
tropical cyclone cases originally obtained from the HiRAM C180 global mode. Storm cate-
gories or intensities are shown over the lifetime of each storm, according to the Saffir–Simpson
scale. The categories are depicted by the track colors, varying from tropical storm (blue) to
category 5 (black; see legend).
15 SEPTEMBER 2015 KNUTSON ET AL . 7215
cat 4–5 days. This metric is projected to increase by 35%
globally (Table 3), in comparison to the 24% increase in
number, indicating that the average time duration per
cat 4–5 storm that is spent at intensities above the
category-4 threshold is also increasing in the warm cli-
mate simulation. The sample of 244 (control) or 313
(late twenty-first century) cat 4–5 storms in our simula-
tions is a large enough sample for us to investigate some
of the regional patterns of change in occurrence. Thus,
the regional patterns of changes in tropical cyclone oc-
currence and of cat 4–5 storm occurrence are shown in
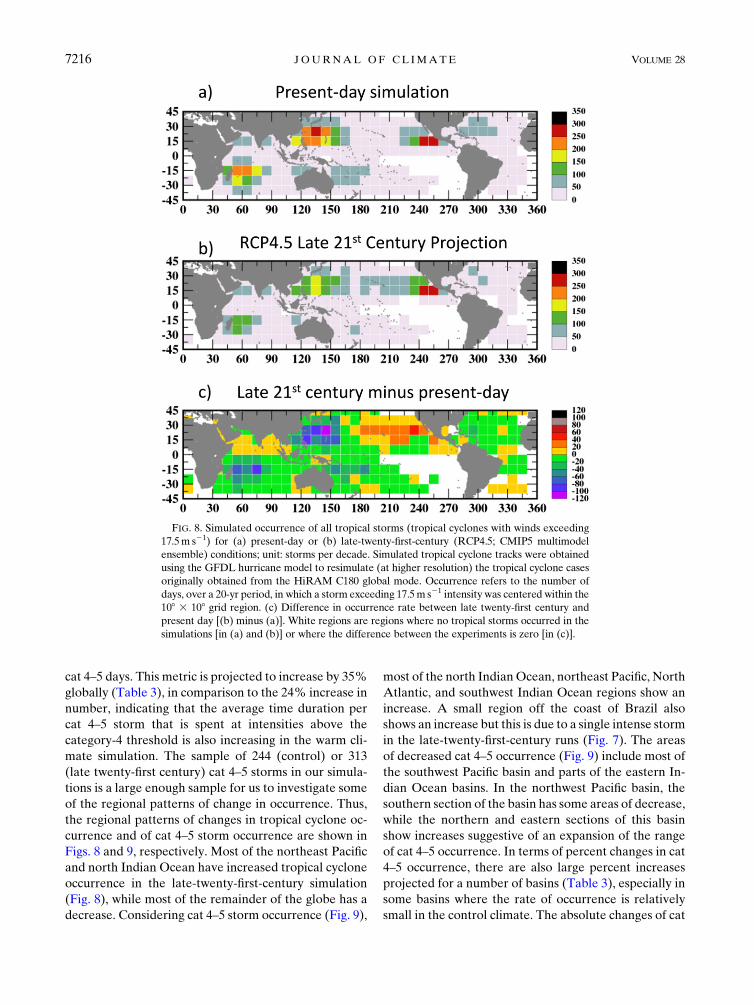
Figs. 8 and 9, respectively. Most of the northeast Pacific
and north Indian Ocean have increased tropical cyclone
occurrence in the late-twenty-first-century simulation
(Fig. 8), while most of the remainder of the globe has a
decrease. Considering cat 4–5 storm occurrence (Fig. 9),
most of the north IndianOcean, northeast Pacific, North
Atlantic, and southwest Indian Ocean regions show an
increase. A small region off the coast of Brazil also
shows an increase but this is due to a single intense storm
in the late-twenty-first-century runs (Fig. 7). The areas
of decreased cat 4–5 occurrence (Fig. 9) include most of
the southwest Pacific basin and parts of the eastern In-
dian Ocean basins. In the northwest Pacific basin, the
southern section of the basin has some areas of decrease,
while the northern and eastern sections of this basin
show increases suggestive of an expansion of the range
of cat 4–5 occurrence. In terms of percent changes in cat
4–5 occurrence, there are also large percent increases
projected for a number of basins (Table 3), especially in
some basins where the rate of occurrence is relatively
small in the control climate. The absolute changes of cat
FIG. 8. Simulated occurrence of all tropical storms (tropical cyclones with winds exceeding
17.5m s21) for (a) present-day or (b) late-twenty-first-century (RCP4.5; CMIP5 multimodel
ensemble) conditions; unit: storms per decade. Simulated tropical cyclone tracks were obtained
using the GFDL hurricane model to resimulate (at higher resolution) the tropical cyclone cases
originally obtained from the HiRAM C180 global mode. Occurrence refers to the number of
days, over a 20-yr period, in which a storm exceeding 17.5m s21 intensity was centered within the
108 3 108 grid region. (c) Difference in occurrence rate between late twenty-first century and
present day [(b) minus (a)]. White regions are regions where no tropical storms occurred in the
simulations [in (a) and (b)] or where the difference between the experiments is zero [in (c)].
7216 JOURNAL OF CL IMATE VOLUME 28
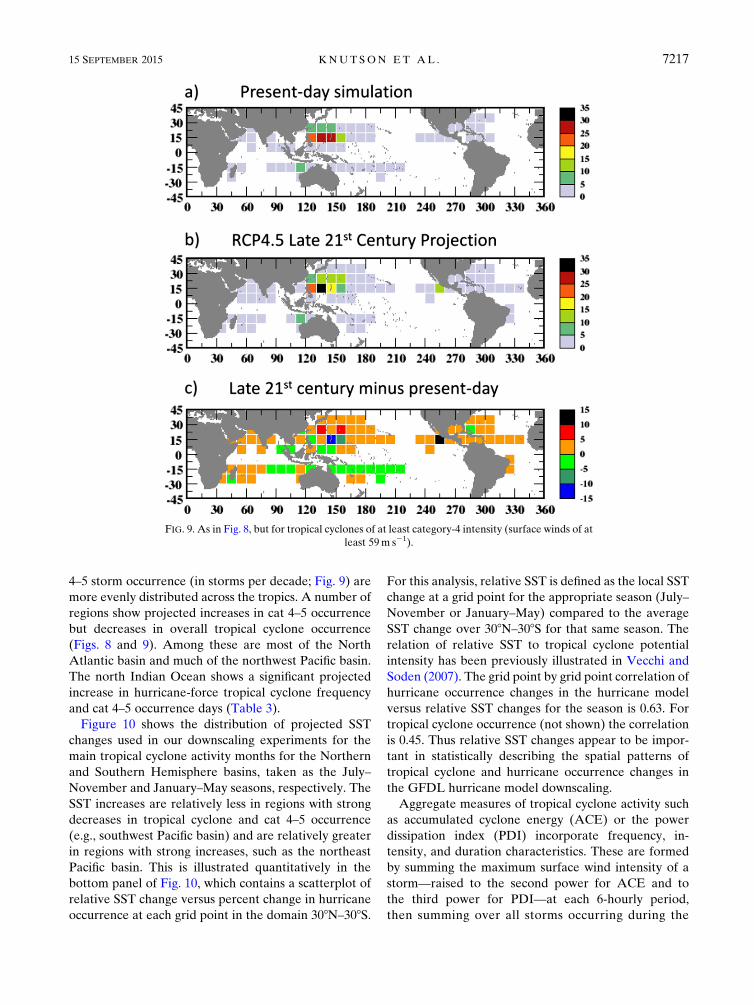
4–5 storm occurrence (in storms per decade; Fig. 9) are
more evenly distributed across the tropics. A number of
regions show projected increases in cat 4–5 occurrence
but decreases in overall tropical cyclone occurrence
(Figs. 8 and 9). Among these are most of the North
Atlantic basin and much of the northwest Pacific basin.
The north Indian Ocean shows a significant projected
increase in hurricane-force tropical cyclone frequency
and cat 4–5 occurrence days (Table 3).
Figure 10 shows the distribution of projected SST
changes used in our downscaling experiments for the
main tropical cyclone activity months for the Northern
and Southern Hemisphere basins, taken as the July–
November and January–May seasons, respectively. The
SST increases are relatively less in regions with strong
decreases in tropical cyclone and cat 4–5 occurrence
(e.g., southwest Pacific basin) and are relatively greater
in regions with strong increases, such as the northeast
Pacific basin. This is illustrated quantitatively in the
bottom panel of Fig. 10, which contains a scatterplot of
relative SST change versus percent change in hurricane
occurrence at each grid point in the domain 308N–308S.
For this analysis, relative SST is defined as the local SST
change at a grid point for the appropriate season (July–
November or January–May) compared to the average
SST change over 308N–308S for that same season. The
relation of relative SST to tropical cyclone potential
intensity has been previously illustrated in Vecchi and
Soden (2007). The grid point by grid point correlation of
hurricane occurrence changes in the hurricane model
versus relative SST changes for the season is 0.63. For
tropical cyclone occurrence (not shown) the correlation
is 0.45. Thus relative SST changes appear to be impor-
tant in statistically describing the spatial patterns of
tropical cyclone and hurricane occurrence changes in
the GFDL hurricane model downscaling.
Aggregate measures of tropical cyclone activity such
as accumulated cyclone energy (ACE) or the power
dissipation index (PDI) incorporate frequency, in-
tensity, and duration characteristics. These are formed
by summing the maximum surface wind intensity of a
storm—raised to the second power for ACE and to
the third power for PDI—at each 6-hourly period,
then summing over all storms occurring during the
FIG. 9. As in Fig. 8, but for tropical cyclones of at least category-4 intensity (surface winds of at
least 59m s21).
15 SEPTEMBER 2015 KNUTSON ET AL . 7217
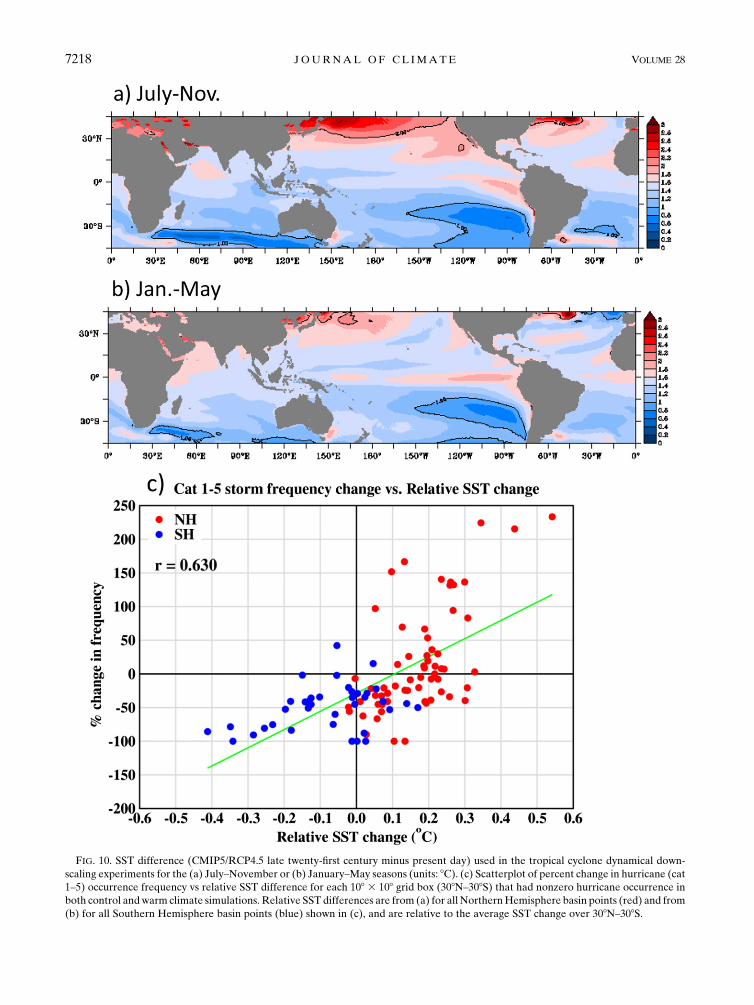
FIG. 10. SST difference (CMIP5/RCP4.5 late twenty-first century minus present day) used in the tropical cyclone dynamical down-
scaling experiments for the (a) July–November or (b) January–May seasons (units: 8C). (c) Scatterplot of percent change in hurricane (cat
1–5) occurrence frequency vs relative SST difference for each 108 3 108 grid box (308N–308S) that had nonzero hurricane occurrence in
both control andwarm climate simulations. Relative SST differences are from (a) for all NorthernHemisphere basin points (red) and from
(b) for all Southern Hemisphere basin points (blue) shown in (c), and are relative to the average SST change over 308N–308S.
7218 JOURNAL OF CL IMATE VOLUME 28
period/region of consideration. For our earlier downscaling
studies with the GFDL hurricane model (e.g., Bender
et al. 2010; Knutson et al. 2013), we did not assess the
ACE or PDI changes for the high-resolution runs be-
cause the experiments were limited to 5 days duration.
Since we have now expanded the runs to up to 15 days in
length per storm we can more reasonably analyze these
metrics. Both ACE and PDI decrease globally, by213%
and 210%, respectively (Table 3). This reflects the par-
tially offsetting influences of decreased overall storm
frequency and increase in average storm intensity, with
the reduction in frequency apparently being the domi-
nating influence. At the basin scale, four of the six major
basins have a simulated decrease while two (the northeast
Pacific and north Indian basins) have a projected increase.
d. Storm-related precipitation rate changes
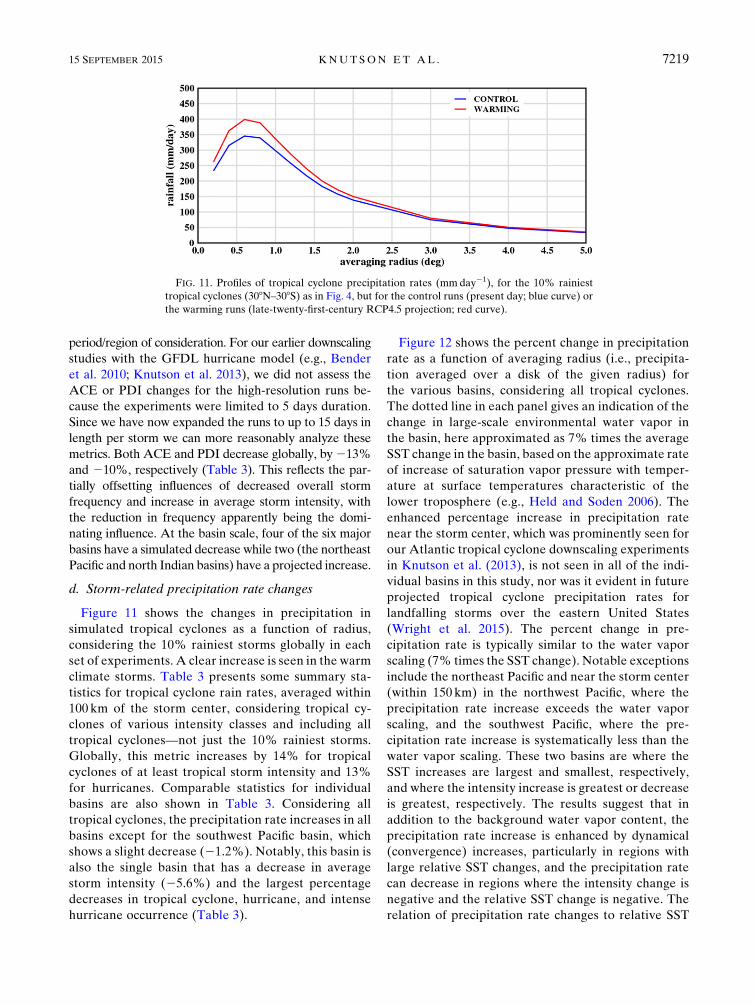
Figure 11 shows the changes in precipitation in
simulated tropical cyclones as a function of radius,
considering the 10% rainiest storms globally in each
set of experiments. A clear increase is seen in the warm
climate storms. Table 3 presents some summary sta-
tistics for tropical cyclone rain rates, averaged within
100 km of the storm center, considering tropical cy-
clones of various intensity classes and including all
tropical cyclones—not just the 10% rainiest storms.
Globally, this metric increases by 14% for tropical
cyclones of at least tropical storm intensity and 13%
for hurricanes. Comparable statistics for individual
basins are also shown in Table 3. Considering all
tropical cyclones, the precipitation rate increases in all
basins except for the southwest Pacific basin, which
shows a slight decrease (21.2%). Notably, this basin is
also the single basin that has a decrease in average
storm intensity (25.6%) and the largest percentage
decreases in tropical cyclone, hurricane, and intense
hurricane occurrence (Table 3).
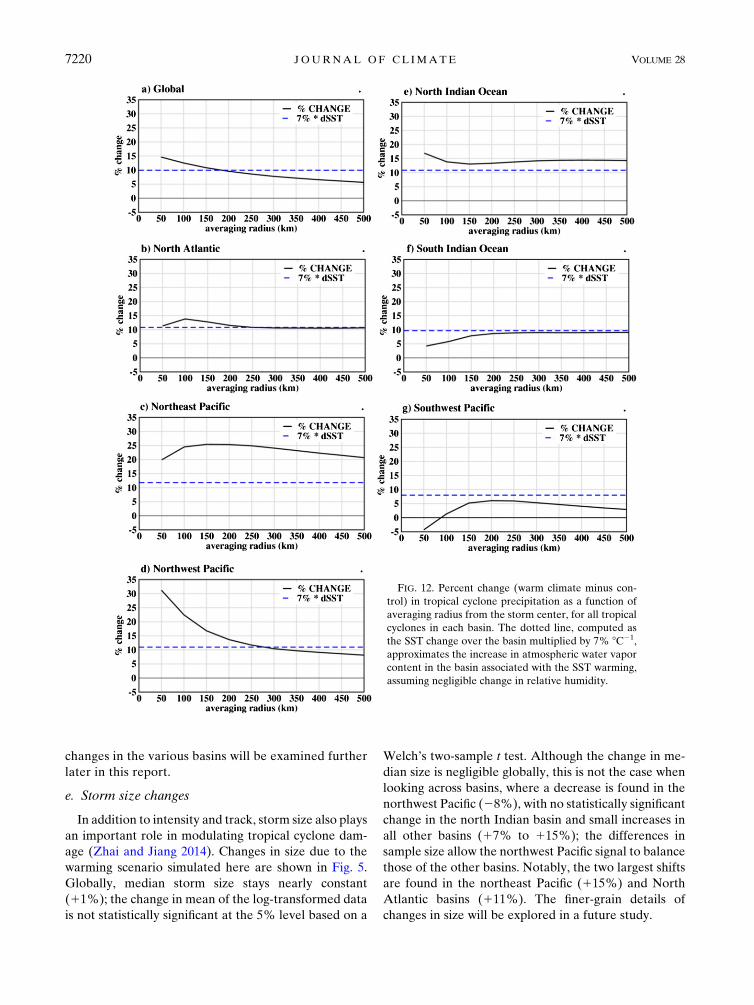
Figure 12 shows the percent change in precipitation
rate as a function of averaging radius (i.e., precipita-
tion averaged over a disk of the given radius) for
the various basins, considering all tropical cyclones.
The dotted line in each panel gives an indication of the
change in large-scale environmental water vapor in
the basin, here approximated as 7% times the average
SST change in the basin, based on the approximate rate
of increase of saturation vapor pressure with temper-
ature at surface temperatures characteristic of the
lower troposphere (e.g., Held and Soden 2006). The
enhanced percentage increase in precipitation rate
near the storm center, which was prominently seen for
our Atlantic tropical cyclone downscaling experiments
in Knutson et al. (2013), is not seen in all of the indi-
vidual basins in this study, nor was it evident in future
projected tropical cyclone precipitation rates for
landfalling storms over the eastern United States
(Wright et al. 2015). The percent change in pre-
cipitation rate is typically similar to the water vapor
scaling (7% times the SST change). Notable exceptions
include the northeast Pacific and near the storm center
(within 150 km) in the northwest Pacific, where the
precipitation rate increase exceeds the water vapor
scaling, and the southwest Pacific, where the pre-
cipitation rate increase is systematically less than the
water vapor scaling. These two basins are where the
SST increases are largest and smallest, respectively,
and where the intensity increase is greatest or decrease
is greatest, respectively. The results suggest that in
addition to the background water vapor content, the
precipitation rate increase is enhanced by dynamical
(convergence) increases, particularly in regions with
large relative SST changes, and the precipitation rate
can decrease in regions where the intensity change is
negative and the relative SST change is negative. The
relation of precipitation rate changes to relative SST
FIG. 11. Profiles of tropical cyclone precipitation rates (mmday21), for the 10% rainiest
tropical cyclones (308N–308S) as in Fig. 4, but for the control runs (present day; blue curve) or
the warming runs (late-twenty-first-century RCP4.5 projection; red curve).
15 SEPTEMBER 2015 KNUTSON ET AL . 7219
changes in the various basins will be examined further
later in this report.
e. Storm size changes
In addition to intensity and track, storm size also plays
an important role in modulating tropical cyclone dam-
age (Zhai and Jiang 2014). Changes in size due to the
warming scenario simulated here are shown in Fig. 5.
Globally, median storm size stays nearly constant
(11%); the change in mean of the log-transformed data
is not statistically significant at the 5% level based on a
Welch’s two-sample t test. Although the change in me-
dian size is negligible globally, this is not the case when
looking across basins, where a decrease is found in the
northwest Pacific (28%), with no statistically significant
change in the north Indian basin and small increases in
all other basins (17% to 115%); the differences in
sample size allow the northwest Pacific signal to balance
those of the other basins. Notably, the two largest shifts
are found in the northeast Pacific (115%) and North
Atlantic basins (111%). The finer-grain details of
changes in size will be explored in a future study.
FIG. 12. Percent change (warm climate minus con-
trol) in tropical cyclone precipitation as a function of
averaging radius from the storm center, for all tropical
cyclones in each basin. The dotted line, computed as
the SST change over the basin multiplied by 7% 8C21,
approximates the increase in atmospheric water vapor
content in the basin associated with the SST warming,
assuming negligible change in relative humidity.
7220 JOURNAL OF CL IMATE VOLUME 28
5. Discussion and conclusions
Using a two-step downscaling framework and the
GFDL hurricane model, we have improved the intensity
distributions of simulated tropical cyclones compared to
the host HiRAMmodel. HiRAMC180 provides a fairly
realistic tropical cyclone genesis distribution as the ini-
tial step in the downscaling but fails to capture tropical
cyclones with winds of category 4 and 5 intensity, which
we believe is important for late-twenty-first-century
climate change projection studies. The inclusion of
ocean coupling in our framework provides an important
additional physical process that is not included in most
other climate impacts studies. Moreover, this frame-
work reproduces fairly well both the observed global
distribution of storm intensity and outer storm size and
their interbasin variability. The dynamical downscaling
framework then provides a scenario-based assessment,
including for very intense tropical cyclones, of changes
in tropical cyclone frequency, precipitation, size, and
intensity characteristics in response to the large-scale
climate change (late twenty-first century) projection as
simulated by a CMIP5 13-model ensemble using the
RCP4.5 scenario.
Salient features of the late-twenty-first-century pro-
jected changes include a substantial reduction in global
tropical cyclone frequency (216%), but an increase in
the frequency of the most intense storms (124% for cat
4–5 and159% for tropical cyclones withmaximumwinds
exceeding 65ms21). The tropical cyclone frequency re-
duction is a relatively robust projection identified in
previous studies (Knutson et al. 2010; Murakami et al.
2012a,b; Mallard et al. 2013; Zhao et al. 2013). The
projected increased frequency of very intense tropical
cyclones is consistent with the results from earlier down-
scaled studies using theGFDLhurricanemodel that were
confined to only the Atlantic basin (Bender et al. 2010;
Knutson et al. 2013) and with the global model study of
Murakami et al. (2012b) .There is a larger projected
fractional increase in the number of cat 4–5 days (135%)
compared to their frequency increase. Global averaged
intensity of tropical cyclones and hurricanes increased by
about 4%. Global aggregate activity measures (ACE
and PDI) show decreases of213%and210%, indicating
the dominating influence of the overall tropical cyclone
frequency reduction over the influence of increased
average intensity. Our results are quite different from
the statistical–deterministic downscaling projections of
Emanuel (2013) for CMIP5 models. Emanuel’s pro-
jections include a large increase in global PDI and trop-
ical cyclone frequency over the twenty-first century.
Projected median storm size is found to remain nearly
constant globally in our projections.
In terms of regional distribution, the increase in pro-
jected cat 4–5 occurrence is fairly widespread in the
Northern Hemisphere basins (Fig. 9). Tropical cyclones in
general (cat 0–5), while decreasing in occurrence in the
majority of regions as well as the global average, still show
some regions of increase, particularly in the central and
eastern North Pacific including in the vicinity of Hawaii,
which is qualitatively similar to climate change projection
results reported in previous studies (Murakami et al. 2013).
There is also decreased cat 4–5 occurrence projected in
some areas, but these are more limited regions—notably
the southwest Pacific and eastern IndianOcean basins, and
parts of the northwest Pacific basin. Interestingly, the re-
gion of the southwest Pacific near northeast Australia,
which is one area of projected decrease in tropical cyclone
activity, including cat 4–5 storms, is also a region where
past data analysis indicates a downward trend in intense
tropical cyclone landfalls over the past century (Callaghan
and Power 2011). While results from the RCP4.5 forcing
scenario cannot be straightforwardly compared with an
historical forcing scenario, this finding may suggest the
possibility of detecting a human influence on tropical cy-
clone activity (i.e., a decrease) in this region on the basis
of a long (century scale) record of intense tropical cyclone
landfalls in northeast Australia. Projected median storm
size increases inmost basins, but this is offset by a decrease
in the northwest Pacific, resulting in a negligible increase
globally (11%). Notable increases occur in the northeast
Pacific (115%) and North Atlantic basins (111%) in
these simulations.
The tropical cyclone precipitation results shown here,
with a pronounced increase in the warmer climate, are
consistent with earlier studies (e.g., Knutson et al. 2010,
2013; Villarini et al. 2014). We do not find strong evi-
dence to support the enhanced rate nearer the storm
center as found by Knutson et al. (2013) for the Atlantic
basin. Additionally, our results (e.g., Table 3) suggest a
link between average tropical cyclone precipitation rate
change at the basin level and the simulated change in TC
intensity. A physical mechanism suggested by the results
(see alsoWang et al. 2015) is that enhanced tropospheric
water vapor in the warmer climate enhances moisture
convergence and thus rainfall rates, but that in a basin
where the average intensity of tropical cyclones de-
creases, the reduced tropical cyclone circulation in-
tensity can offset the higher water vapor content and
even produce a small decrease in tropical cyclone pre-
cipitation rates in that basin.
The projected tropical cyclone metric changes pre-
sented here vary by basin, with the interbasin spread being
explained to a large extent by variation between the re-
gions in the magnitude of SST change. This is illustrated
and summarized in Fig. 13, which contains scatterplots of
15 SEPTEMBER 2015 KNUTSON ET AL . 7221
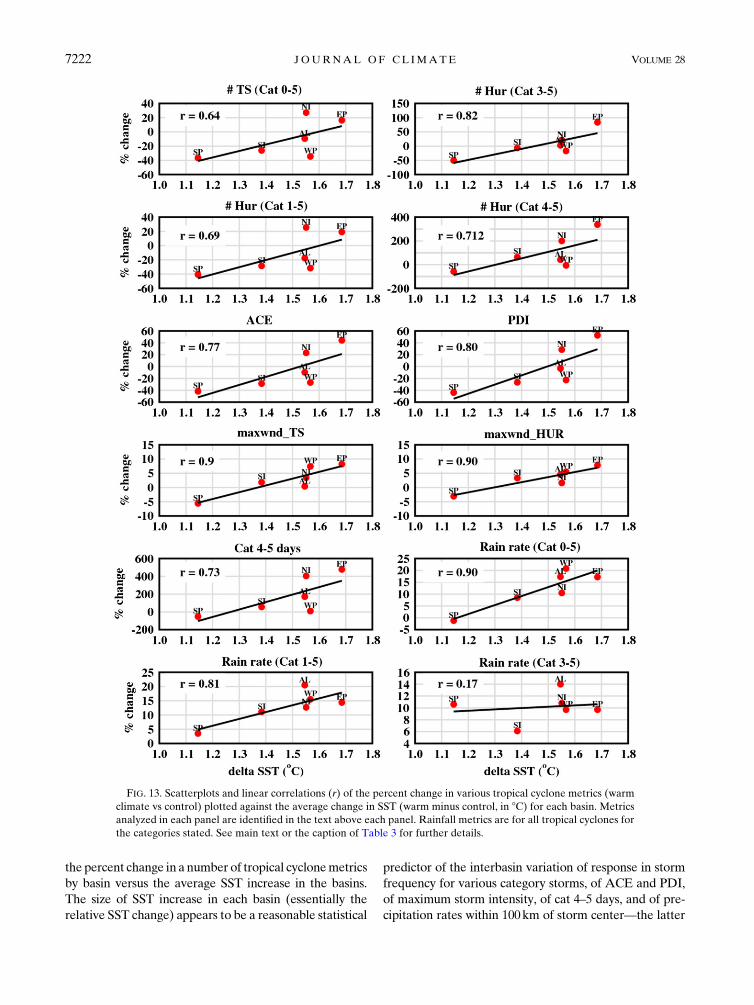
the percent change in a number of tropical cyclonemetrics
by basin versus the average SST increase in the basins.
The size of SST increase in each basin (essentially the
relative SST change) appears to be a reasonable statistical
predictor of the interbasin variation of response in storm
frequency for various category storms, of ACE and PDI,
of maximum storm intensity, of cat 4–5 days, and of pre-
cipitation rates within 100km of storm center—the latter
FIG. 13. Scatterplots and linear correlations (r) of the percent change in various tropical cyclone metrics (warm
climate vs control) plotted against the average change in SST (warm minus control, in 8C) for each basin. Metrics
analyzed in each panel are identified in the text above each panel. Rainfall metrics are for all tropical cyclones for
the categories stated. See main text or the caption of Table 3 for further details.
7222 JOURNAL OF CL IMATE VOLUME 28
at least for tropical cyclones collectively and hurricanes
(cat 1–5). With the exception of the case for precipitation
rate for cat 3–5 hurricanes, which has a negligible corre-
lation, all of the other metrics have a substantial correla-
tion with the basinwide SST changes, ranging from 0.64 to
0.9. This finding highlights the importance of reliable
projections of the interbasin variations or patterns of fu-
ture SST change from climate models, in addition to the
overall tropical mean magnitude of the warming, for fu-
ture tropical cyclone changes (see also Sugi et al. 2009).
Future research will continue to address the issue of ro-
bustness of projections to the use of different downscaling
frameworks such as Emanuel (2013). Nonetheless, our
results suggest that narrowing uncertainties of the large-
scale climate change inputs to the downscaling frame-
works (e.g., SST change patterns) is an important research
task for reducing uncertainty in future tropical cyclone
projections worldwide.
Acknowledgments. We thank Tim Marchok and an
anonymous reviewer for helpful comments on our work.
We acknowledge PCMDI and the modeling groups
contributing to the CMIP3 and CMIP5 model archives
for generously making their model output available to
the community. This material is based in part upon work
supported by the National Science Foundation under
Grant AGS-1262099 (Gabriele Villarini and Gabriel
A. Vecchi) and AGS-1331362 (Daniel R. Chavas). We
acknowledge Hyeong-Seog Kim, sponsored by the
Willis Research Network, for early developmental work
on the global simulation framework. We acknowledge
the assistance of Isaac Ginis and Richard Yablonsky of
the University of Rhode Island on the hurricane model
ocean coupling components.
REFERENCES
Bender, M. A., and I. Ginis, 2000: Real-case simulations of hurricane–
ocean interaction using a high-resolution coupled model: Effects
onhurricane intensity.Mon.Wea.Rev., 128, 917–946, doi:10.1175/1520-0493(2000)128,0917:RCSOHO.2.0.CO;2.
——, ——, R. E. Tuleya, B. Thomas, and T. Marchok, 2007: The
operational GFDL coupled hurricane–ocean prediction sys-
tem and a summary of its performance. Mon. Wea. Rev., 135,
3965–3989, doi:10.1175/2007MWR2032.1.
——, T. R. Knutson, R. E. Tuleya, J. J. Sirutis, G. A. Vecchi, S. T.
Garner, and I. M. Held, 2010: Modeled impact of anthropo-
genic warming of the frequency of intenseAtlantic hurricanes.
Science, 327, 454–458, doi:10.1126/science.1180568.
Bengtsson, L., K. I. Hodges,M. Esch, N. Keenlyside, L. Kornblueh,
J.-J. Luo, and T. Yamagata, 2007: How may tropical cyclones
change in a warmer climate? Tellus, 59A, 539–561, doi:10.1111/
j.1600-0870.2007.00251.x.
Callaghan, J., and S. Power, 2011: Variability and decline in the
number of severe tropical cyclones making land-fall over
eastern Australia since the late nineteenth century. Climate
Dyn., 37, 647–662, doi:10.1007/s00382-010-0883-2.
Camargo, S., M. Ting, and Y. Kushnir, 2013: Influence of
local and remote SST on North Atlantic tropical cyclone
potential intensity. Climate Dyn., 40, 1515–1529, doi:10.1007/
s00382-012-1536-4.
Chavas, D. R., and K. A. Emanuel, 2010: A QuikSCAT climatol-
ogy of tropical cyclone size. Geophys. Res. Lett., 37, L18816,
doi:10.1029/2010GL044558.
——, and J. Vigh, 2014: QSCAT-R: The QuikSCAT tropical
cyclone radial structure dataset. NCAR Tech. Note TN-
5131STR, 27 pp.
——, N. Lin, and K. A. Emanuel, 2015: A model for the complete
radial structure of the tropical cyclone wind field. Part I: Com-
parison with observed structure. J. Atmos. Sci., doi:10.1175/
JAS-D-15-0014.1, in press.
Christensen, J. H., and Coauthors, 2013: Climate phenomena and
their relevance for future regional climate change. Climate
Change 2013: The Physical Science Basis, T. F. Stocker et al.,
Eds., Cambridge University Press, 1217–1308.
Dunstone, N. J., D. M. Smith, B. B. B. Booth, L. Hermanson, and
R. Eade, 2013: Anthropogenic aerosol forcing on Atlantic
tropical storms.Nat. Geosci., 6, 534–539, doi:10.1038/ngeo1854.
Emanuel, K. A., 2004: Tropical cyclone energetics and structure.
Atmospheric Turbulence and Mesoscale Meteorology, Cam-
bridge University Press, 165–191.
——, 2013: Downscaling CMIP5 climate models shows increased
tropical cyclone activity over the 21st century.Proc. Natl. Acad.
Sci. USA, 110, 12219–12224, doi:10.1073/pnas.1301293110.——, R. Sundararajan, and J. Williams, 2008: Hurricanes and
global warming—Results from downscaling IPCC AR4 sim-
ulations. Bull. Amer. Meteor. Soc., 89, 347–367, doi:10.1175/
BAMS-89-3-347.
Held, I. M., and B. J. Soden, 2006: Robust responses of the hy-
drological cycle to global warming. J. Climate, 19, 5686–5699,
doi:10.1175/JCLI3990.1.
——, andM. Zhao, 2011: The response of tropical cyclone statistics
to an increase in CO2 with fixed sea surface temperatures.
J. Climate, 24, 5353–5364, doi:10.1175/JCLI-D-11-00050.1.
Hill, K. A., and G. M. Lackmann, 2011: The impact of future climate
change on TC intensity and structure: A downscaling approach.
J. Climate, 24, 4644–4661, doi:10.1175/2011JCLI3761.1.
Huang, P., I.-I. Lin, C. Chou, and R.-H. Huang, 2015: Change in
ocean subsurface environment to suppress tropical cyclone
intensification under global warming. Nat. Commun., 6, 7188,
doi:10.1038/ncomms8188.
Huffman, G. J., and Coauthors, 2007: The TRMM Multisatellite
Precipitation Analysis (TMPA): Quasi-global, multiyear,
combined-sensor precipitation estimates at fine scales.
J. Hydrometeor., 8, 38–55, doi:10.1175/JHM560.1.
IPCC, 2013:Climate Change 2013: The Physical Science Basis.T. F.
Stocker et al., Eds., Cambridge University Press, 1535 pp.
Kim, H.-S., G. A. Vecchi, T. R. Knutson, W. G. Anderson, T. L.
Delworth, A. Rosati, F. Zeng, and M. Zhao, 2014: Tropical
cyclone simulation and response to CO2 doubling in the
GFDL CM2.5 high-resolution coupled climate model.
J. Climate, 27, 8034–8054, doi:10.1175/JCLI-D-13-00475.1.
Knutson, T. R., and S.Manabe, 1995: Time-mean response over the
tropical Pacific to increased CO2 in a coupled ocean–
atmosphere model. J. Climate, 8, 2181–2199, doi:10.1175/
1520-0442(1995)008,2181:TMROTT.2.0.CO;2.
——, R. E. Tuleya, W. Shen, and I. Ginis, 2001: Impact of CO2-
induced warming on hurricane intensities simulated in a hur-
ricane model with ocean coupling. J. Climate, 14, 2458–2468,
doi:10.1175/1520-0442(2001)014,2458:IOCIWO.2.0.CO;2.
15 SEPTEMBER 2015 KNUTSON ET AL . 7223
——, and Coauthors, 2010: Tropical cyclones and climate change.
Nat. Geosci., 3, 157–163, doi:10.1038/ngeo779.
——, and Coauthors, 2013: Dynamical downscaling projections of
twenty-first-century Atlantic hurricane activity: CMIP3 and
CMIP5 model-based scenario. J. Climate, 26, 6591–6617,
doi:10.1175/JCLI-D-12-00539.1.
Lin, I.-I., and Coauthors, 2013: An ocean coupling potential in-
tensity index for tropical cyclones. Geophys. Res. Lett., 40,1878–1882, doi:10.1002/grl.50091.
Lin, N., andD. R. Chavas, 2012: On hurricane parametric wind and
applications in storm surge modeling. J. Geophys. Res., 117,
D09120, doi:10.1029/2011JD017126.
Mallard, M. S., G. M. Lackmann, A. Aiyyer, and K. Hill, 2013:
Atlantic hurricanes and climate change. Part I: Experimental
design and isolation of thermodynamic effects. J. Climate, 26,4876–4893, doi:10.1175/JCLI-D-12-00182.1.
Meehl, G. A., C. Covey, T. Delworth, M. Latif, B. McAvaney,
J. F. B. Mitchell, R. J. Stouffer, and K. E. Taylor, 2007: The
WCRP CMIP3 multimodel dataset: A new era in climate
change research. Bull. Amer. Meteor. Soc., 88, 1383–1394,
doi:10.1175/BAMS-88-9-1383.
Murakami, H., R. Mizuta, and E. Shindo, 2012a: Future changes in
tropical cyclone activity projected by multi-physics and multi-
SST ensemble experiments using the 60-km-mesh MRI-
AGCM. Climate Dyn., 39, 2569–2584, doi:10.1007/
s00382-011-1223-x.
——, and Coauthors, 2012b: Future changes in tropical cyclone
activity projected by the new high-resolution MRI-AGCM.
J. Climate, 25, 3237–3260, doi:10.1175/JCLI-D-11-00415.1.
——, B. Wang, T. Li, and A. Kitoh, 2013: Projected increase in
tropical cyclones near Hawaii. Nat. Climate Change, 3, 749–
754, doi:10.1038/nclimate1890.
Oouchi, K., J. Yoshimura, H. Yoshimura, R. Mizuta, S. Kusunoki,
and A. Noda, 2006: Tropical cyclone climatology in a global-
warming climate as simulated in a 20 km-mesh global atmo-
spheric model: Frequency and wind intensity analyses.
J. Meteor. Soc. Japan, 84, 259–276, doi:10.2151/jmsj.84.259.
Pielke, R. A., J. Gratz, C. W. Landsea, D. Collins, M. A. Saunders,
and R. Musulin, 2008: Normalized hurricane damages in the
United States: 1900–2005. Nat. Hazards Rev., 9, 29–42,
doi:10.1061/(ASCE)1527-6988(2008)9:1(29).
Song, J.-J., Y.Wang, and L.Wu, 2010: Trend discrepancies among
three best track data sets of western North Pacific tropi-
cal cyclones. J. Geophys. Res., 115, D12128, doi:10.1029/
2009JD013058.
Sugi, M., A. Noda, and N. Sato, 2002: Influence of global warming
on tropical cyclone climatology: An experiment with the JMA
global model. J. Meteor. Soc. Japan, 80, 249–272, doi:10.2151/
jmsj.80.249.
——, H. Murakami, and J. Yoshimura, 2009: A reduction of global
tropical cyclone frequency due to global warming. SOLA, 5,
164–167, doi:10.2151/sola.2009-042.
——, ——, and ——, 2012: On the mechanism of tropical cyclone
frequency changes due to global warming. J. Meteor. Soc. Ja-
pan, 90A, 397–408, doi:10.2151/jmsj.2012-A24.
Taylor, K. E., R. J. Stouffer, andG.A.Meehl, 2012: An overview of
CMIP5 and the experiment design. Bull. Amer. Meteor. Soc.,
93, 485–498, doi:10.1175/BAMS-D-11-00094.1.
Tory, K. J., S. S. Chand, J. L.McBride,H. Ye, andR.A.Dare, 2013:
Projected changes in late-twenty-first-century tropical cyclone
frequency in 13 coupled climate models from phase 5 of the
CoupledModel Intercomparison Project. J. Climate, 26, 9946–9959, doi:10.1175/JCLI-D-13-00010.1.
Tuleya, R. E., M. DeMaria, and R. J. Kuligowski, 2007: Evaluation
of GFDL and simple statistical model rainfall forecasts for
U.S. landfalling tropical storms. Wea. Forecasting, 22, 56–70,doi:10.1175/WAF972.1.
Vecchi, G. A., and B. J. Soden, 2007: Effect of remote sea surface
temperature change on tropical cyclone potential intensity.
Nature, 450, 1066–1070, doi:10.1038/nature06423.——, S. Fueglistaler, I. M. Held, T. R. Knutson, andM. Zhao, 2013:
Impacts of atmospheric temperature trends on tropical
cyclone activity. J. Climate, 26, 3877–3891, doi:10.1175/
JCLI-D-12-00503.1.
Villarini, G., and G. A. Vecchi, 2012: Twenty-first-century pro-
jections of North Atlantic tropical storms from CMIP5
models. Nat. Climate Change, 2, 604–607, doi:10.1038/
nclimate1530.
——, and——, 2013: Projected increases in NorthAtlantic tropical
cyclone intensity from CMIP5 models. J. Climate, 26, 3231–
3240, doi:10.1175/JCLI-D-12-00441.1.
——, D. A. Lavers, E. Scoccimarro, M. Zhao, M. F. Wehner, G. A.
Vecchi, T. R. Knutson, and K. A. Reed, 2014: Sensitivity of
tropical cyclone rainfall to idealized global-scale forcings.
J. Climate, 27, 4622–4641, doi:10.1175/JCLI-D-13-00780.1.
Wang, C.-C., B.-X. Lin, C.-T. Chen, and S.-H. Lo, 2015: Quanti-
fying the effects of long-term climate change on tropical cy-
clone rainfall using a cloud-resolving model: Examples of two
landfall typhoons in Taiwan. J. Climate, 28, 66–85, doi:10.1175/
JCLI-D-14-00044.1.
Wright, D. B., T. R. Knutson, and J. A. Smith, 2015: Regional cli-
matemodel projections of rainfall fromU.S. landfalling tropical
cyclones.ClimateDyn.,doi:10.1007/s00382-015-2544-y, in press.
Yablonsky, R., and I. Ginis, 2008: Improving the ocean initiali-
zation of coupled hurricane–ocean models using feature-
based data assimilation. Mon. Wea. Rev., 136, 2592–2607,
doi:10.1175/2007MWR2166.1.
Yoshimura, J., andM. Sugi, 2005: Tropical cyclone climatology in a
high-resolution AGCM—Impacts of SST warming and CO2
increase. SOLA, 1, 133–136, doi:10.2151/sola.2005-035.
Zhai, A. R., and J. H. Jiang, 2014: Dependence of US hurricane
economic loss on maximum wind speed and storm size. En-
viron. Res. Lett., 9, 064019, doi:10.1088/1748-9326/9/6/064019.Zhao, M., and I. M. Held, 2010: An analysis of the effect of global
warming on the intensity of Atlantic hurricanes using a GCM
with statistical refinement. J. Climate, 23, 6382–6393, doi:10.1175/
2010JCLI3837.1.
——,——, S.-J. Lin, and G. A. Vecchi, 2009: Simulations of global
hurricane climatology, interannual variability, and response to
global warming using a 50-km resolution GCM. J. Climate, 22,6653–6678, doi:10.1175/2009JCLI3049.1.
——, and Coauthors, 2013: Robust direct effect of increasing at-
mospheric CO2 concentration on global tropical cyclone
frequency: A multi-model inter-comparison. U.S. CLIVAR
Variations, 11 (3), U.S. CLIVAR Office, Washington, D.C.,
17–23.
7224 JOURNAL OF CL IMATE VOLUME 28