Global NDVI Data for Climate Studies Compton Tucker NASA/Goddard Space Fight Center Greenbelt,...
20
Global NDVI Data for Climate Studies Compton Tucker NASA/Goddard Space Fight Center Greenbelt, Maryland 20771
-
Upload
ronald-jackson -
Category
Documents
-
view
222 -
download
1
Transcript of Global NDVI Data for Climate Studies Compton Tucker NASA/Goddard Space Fight Center Greenbelt,...
Global NDVI Data for Climate Studies
Compton TuckerNASA/Goddard Space Fight Center
Greenbelt, Maryland 20771
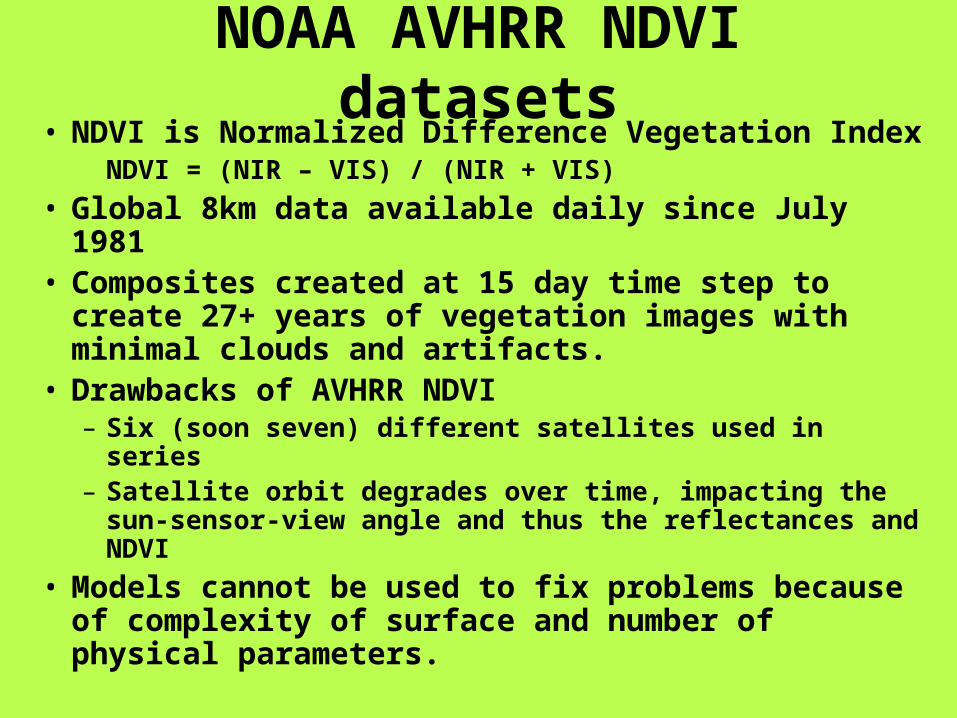
NOAA AVHRR NDVI datasets• NDVI is Normalized Difference Vegetation Index
NDVI = (NIR – VIS) / (NIR + VIS)
• Global 8km data available daily since July 1981• Composites created at 15 day time step to create 27+
years of vegetation images with minimal clouds and artifacts.
• Drawbacks of AVHRR NDVI– Six (soon seven) different satellites used in series– Satellite orbit degrades over time, impacting the sun-
sensor-view angle and thus the reflectances and NDVI
• Models cannot be used to fix problems because of complexity of surface and number of physical parameters.
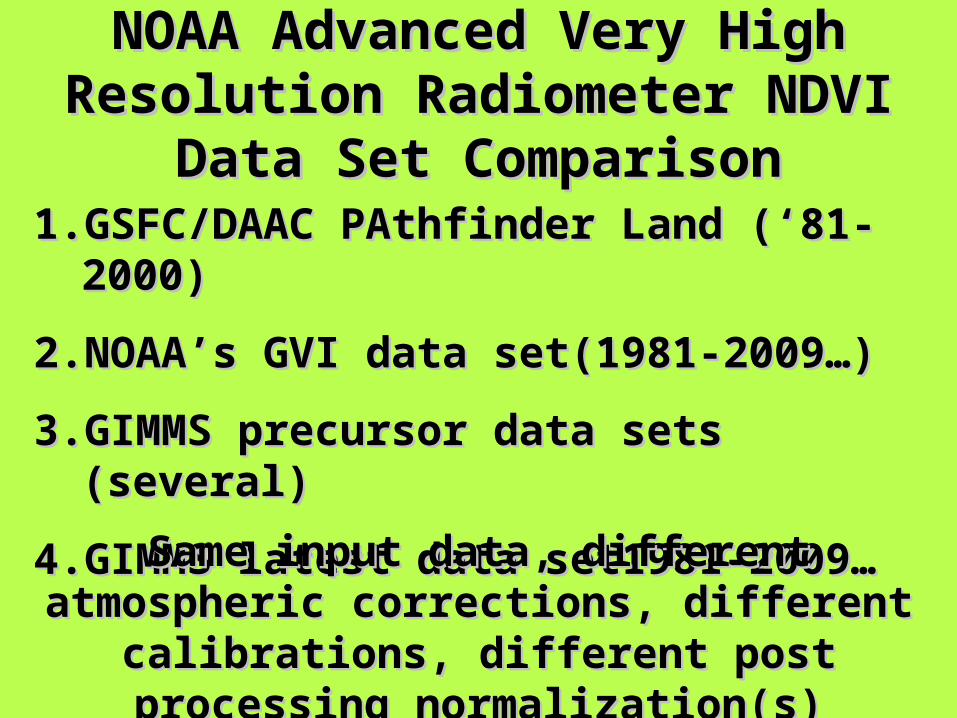
NOAA Advanced Very High Resolution NOAA Advanced Very High Resolution Radiometer NDVI Data Set ComparisonRadiometer NDVI Data Set Comparison
1.1. GSFC/DAAC PAthfinder Land (‘81-2000)GSFC/DAAC PAthfinder Land (‘81-2000)
2.2. NOAA’s GVI data set(1981-2009…)NOAA’s GVI data set(1981-2009…)
3.3. GIMMS precursor data sets (several)GIMMS precursor data sets (several)
4.4. GIMMS latest data set1981-2009…GIMMS latest data set1981-2009…
Same input data, different atmospheric Same input data, different atmospheric corrections, different calibrations, different post corrections, different calibrations, different post
processing normalization(s)processing normalization(s)
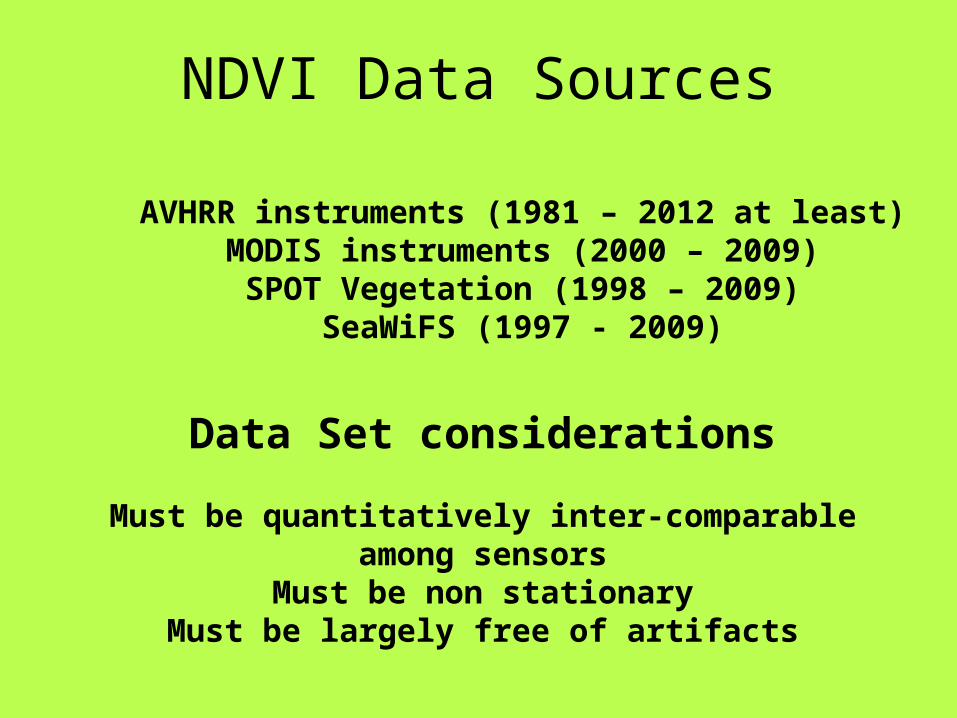
NDVI Data Sources
AVHRR instruments (1981 – 2012 at least)MODIS instruments (2000 – 2009)
SPOT Vegetation (1998 – 2009)SeaWiFS (1997 - 2009)
Data Set considerations
Must be quantitatively inter-comparable among sensorsMust be non stationary
Must be largely free of artifacts
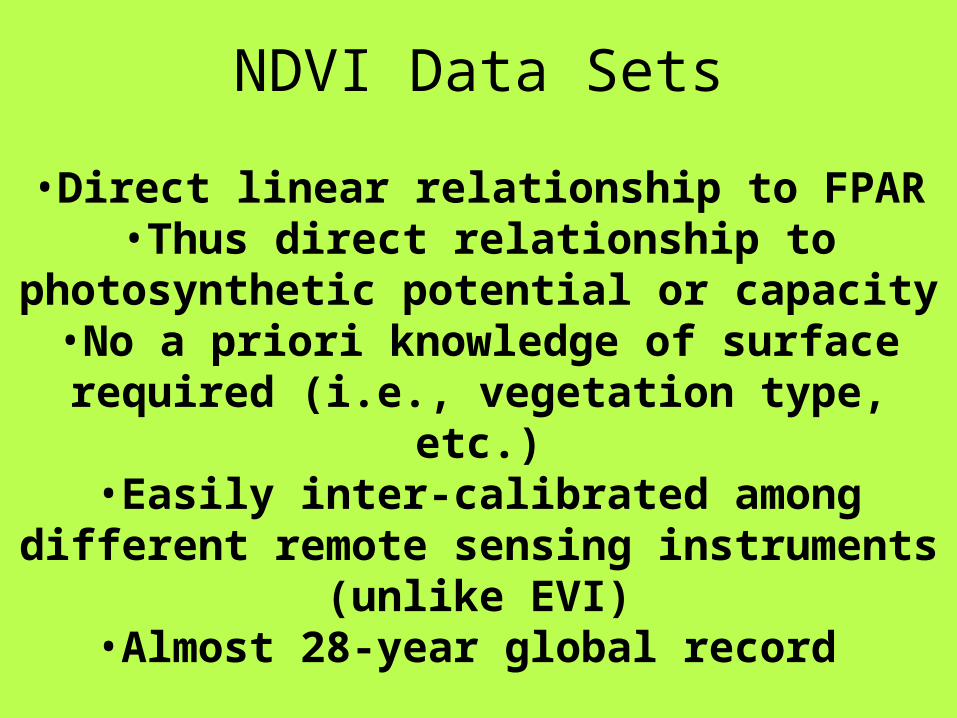
NDVI Data Sets
•Direct linear relationship to FPAR•Thus direct relationship to photosynthetic
potential or capacity•No a priori knowledge of surface required (i.e.,
vegetation type, etc.)•Easily inter-calibrated among different remote
sensing instruments (unlike EVI)•Almost 28-year global record
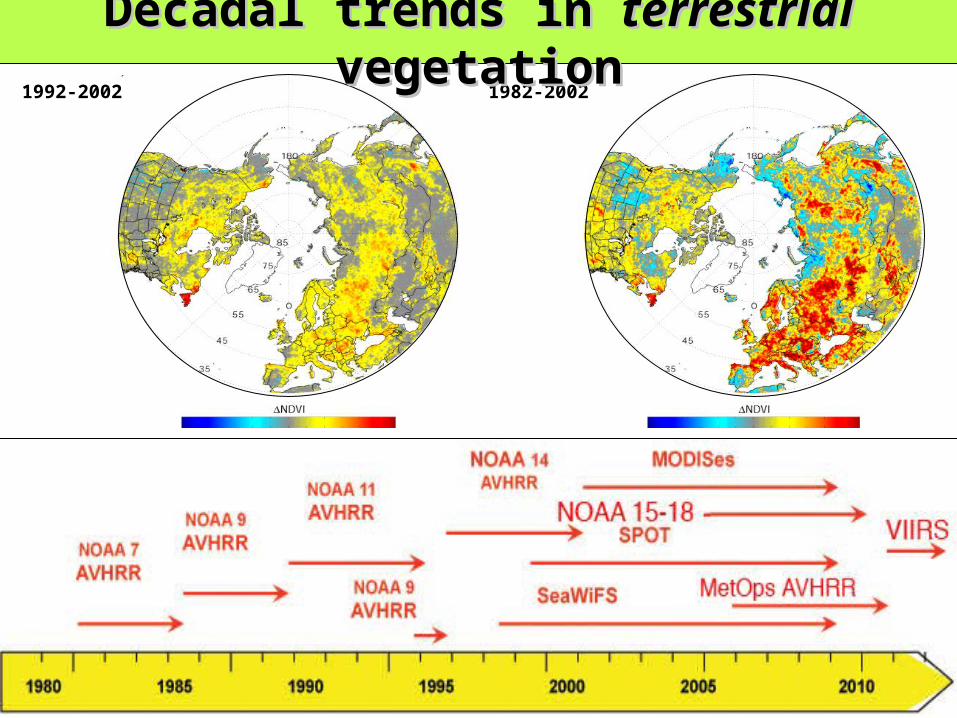
NOAA-16
1982-20021992-2002
Decadal trends in Decadal trends in terrestrialterrestrial vegetation vegetation
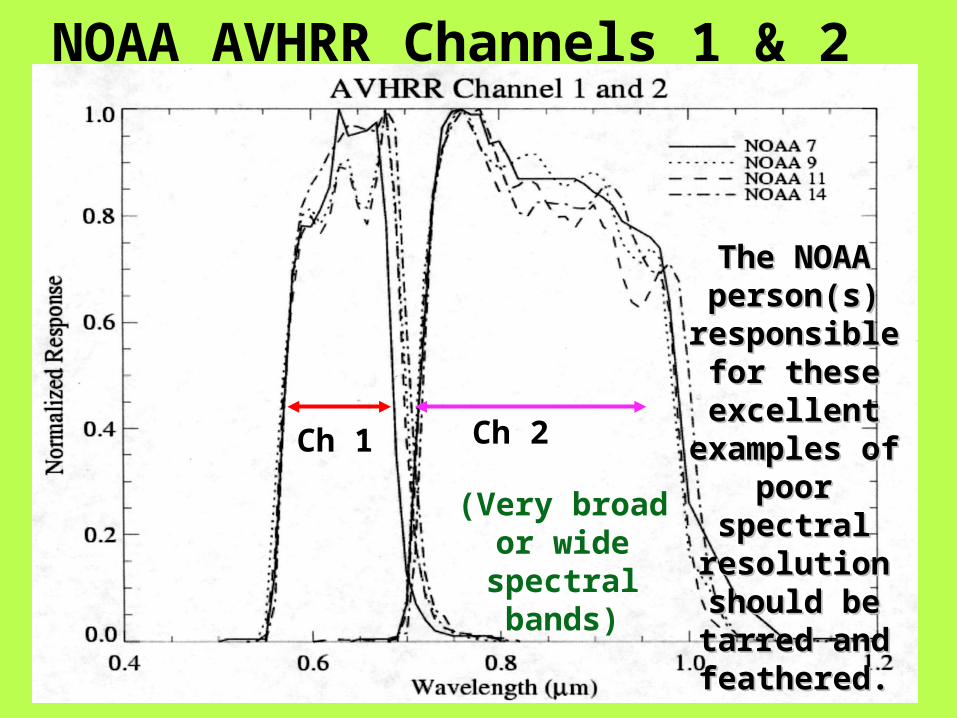
NOAA AVHRR Channels 1 & 2
Ch 1 Ch 2
(Very broad or wide spectral
bands)
The NOAA The NOAA person(s) person(s)
responsible for responsible for these excellent these excellent
examples of examples of poor spectral poor spectral
resolution resolution should be should be
tarred and tarred and feathered.feathered.
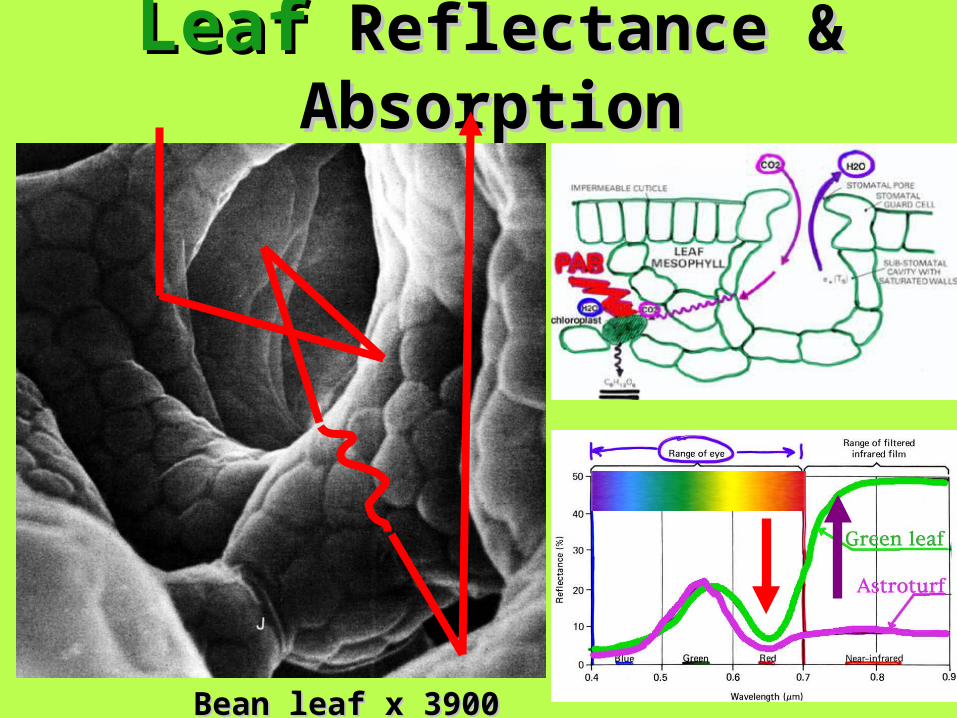
LeafLeaf Reflectance & Absorption Reflectance & Absorption
Bean leaf x 3900Bean leaf x 3900
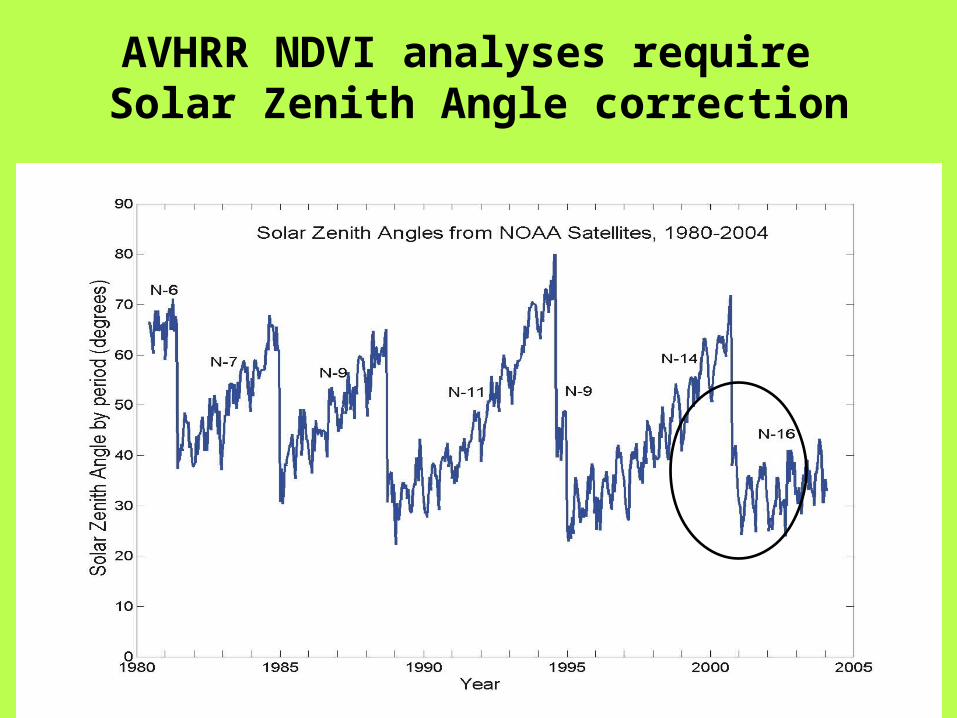
AVHRR NDVI analyses require Solar Zenith Angle correction
Use of Empirical Mode Decomposition to correct NDVI
Empirical Mode Decomposition can identify and separate the real vegetative signal from artifacts. Because the Empirical Mode Decomposition derives functions from the data and is adaptive, it is perfectly suited to identify the NDVI trends associated with the solar zenith angles, and to leave the vegetation dynamics intact.
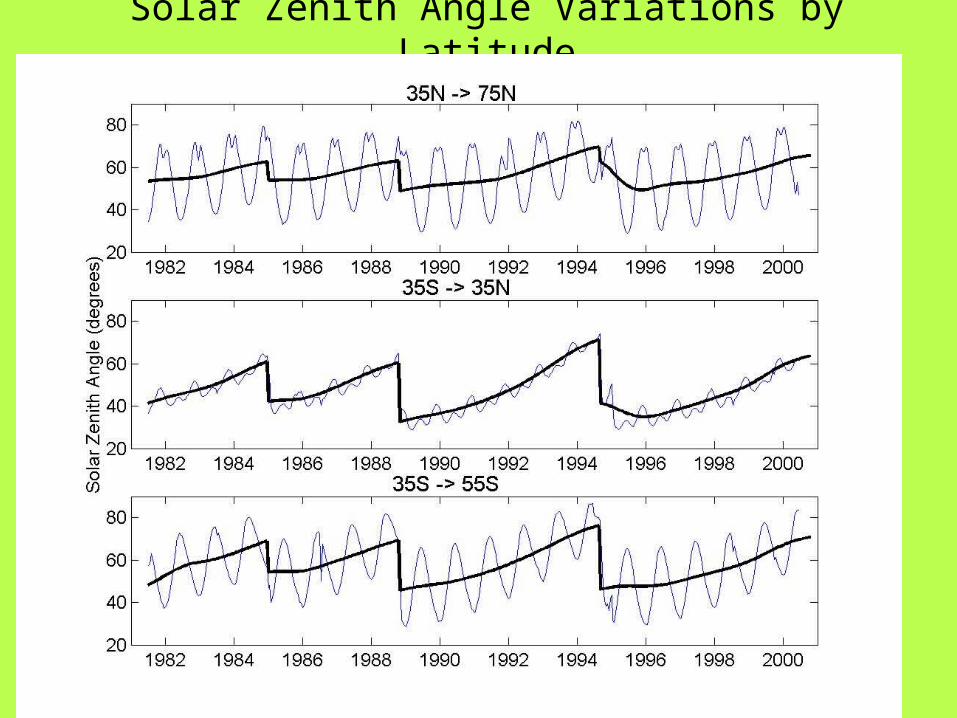
Solar Zenith Angle Variations by Latitude
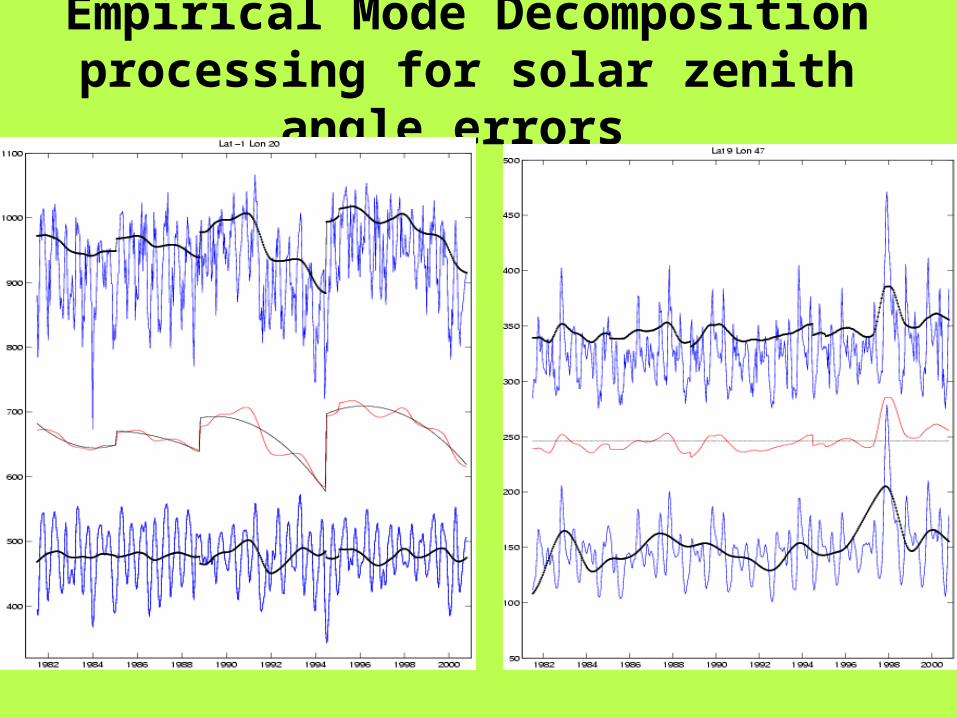
Empirical Mode Decomposition processing for solar zenith angle errors
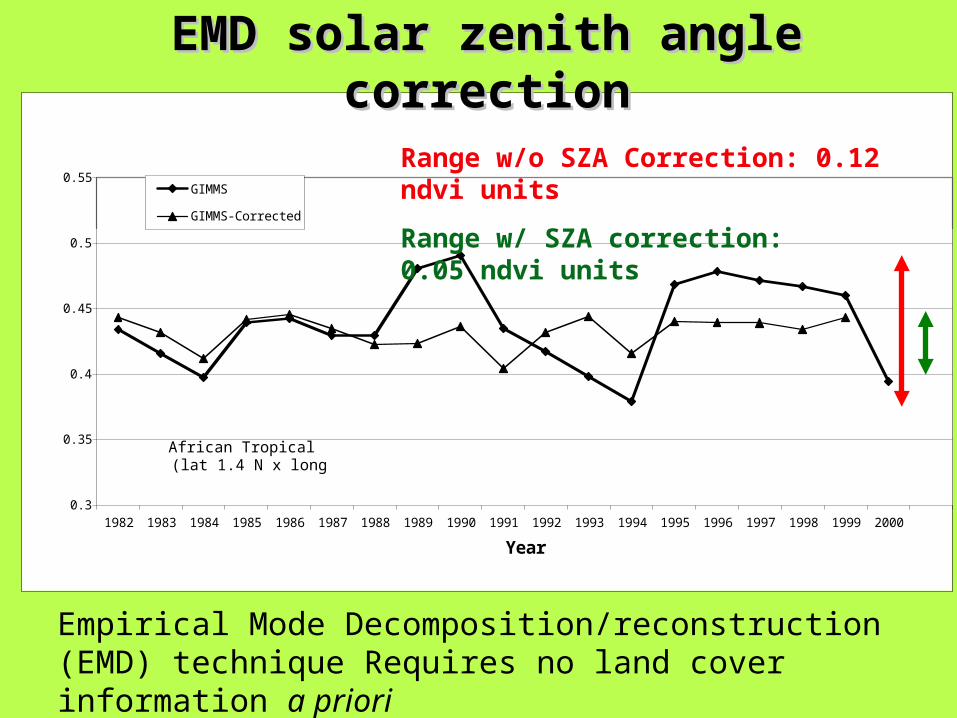
African Tropical Forest(lat 1.4 N x long. 18 E)
0.3
0.35
0.4
0.45
0.5
0.55
1982 1983 1984 1985 1986 1987 1988 1989 1990 1991 1992 1993 1994 1995 1996 1997 1998 1999 2000
Year
NDVI
GIMMS
GIMMS-Corrected
EMD solar zenith angle correctionEMD solar zenith angle correction
Range w/o SZA Correction: 0.12 ndvi units
Range w/ SZA correction: 0.05 ndvi units
Empirical Mode Decomposition/reconstruction (EMD) technique Requires no land cover information a priori
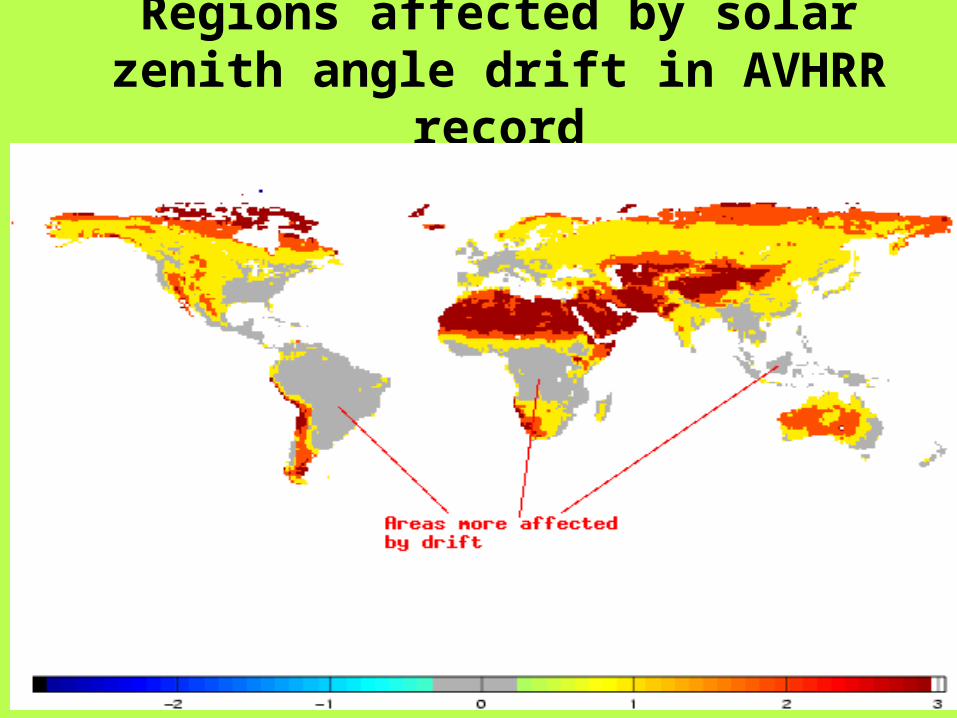
Regions affected by solar zenith angle drift in AVHRR record
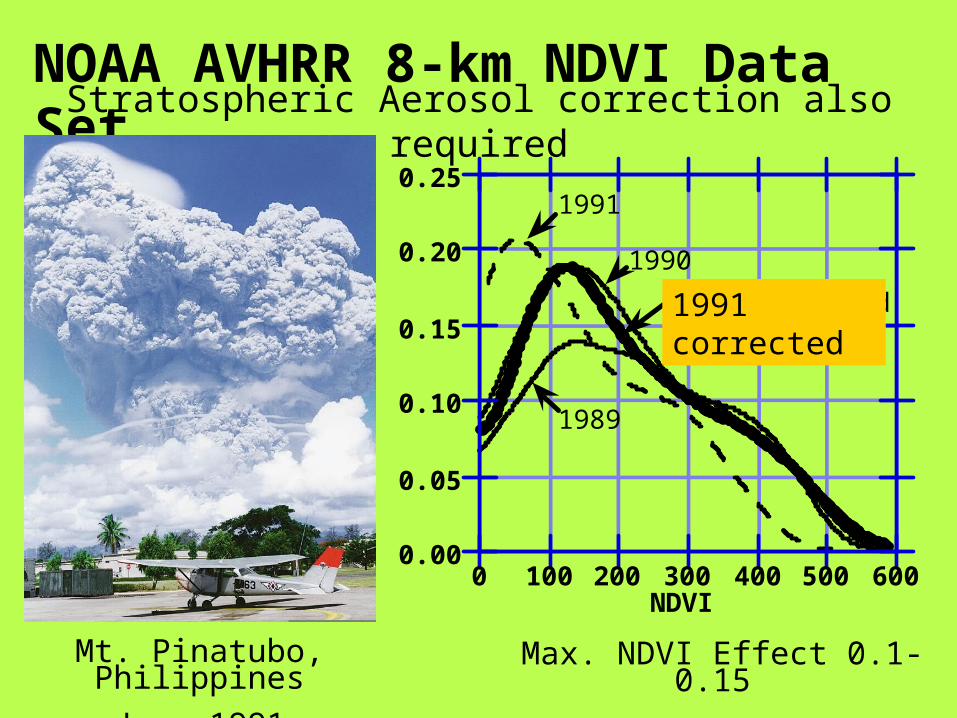
Stratospheric Aerosol correction also required
NOAA AVHRR 8-km NDVI Data Set
Mt. Pinatubo, Philippines
June 1991
0.00
0.05
0.10
0.15
0.20
0.25
0 100 200 300 400 500 600
1991
NDVI
1990
1991 corrected
1989
Max. NDVI Effect 0.1-0.15
1991 corrected
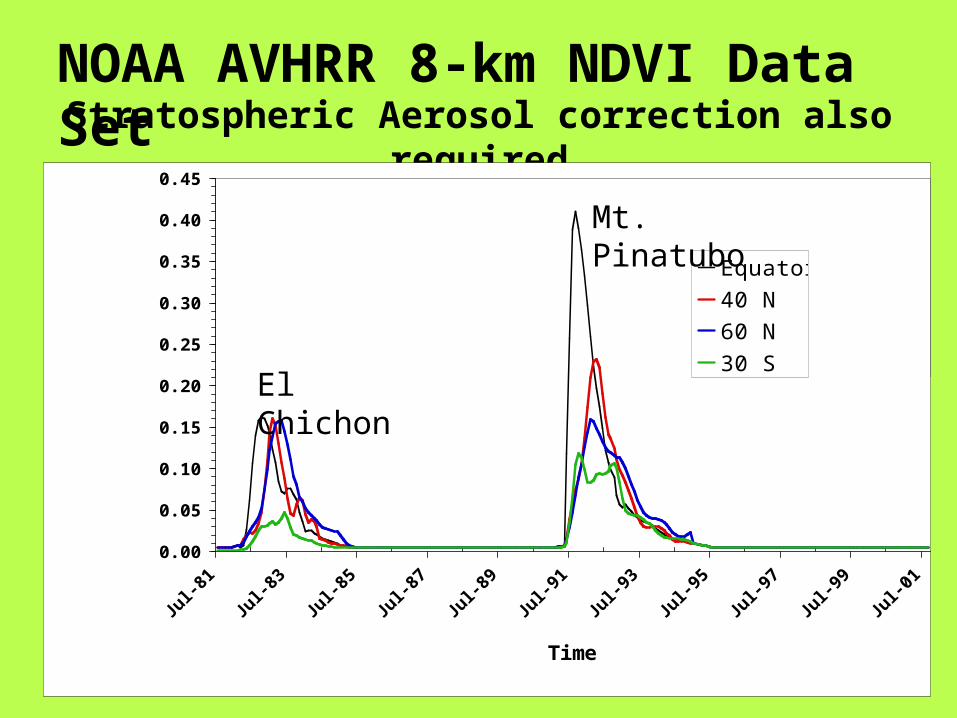
Stratospheric Aerosol correction also required
NOAA AVHRR 8-km NDVI Data Set
0.00
0.05
0.10
0.15
0.20
0.25
0.30
0.35
0.40
0.45
Time
Str
ato
sp
he
ric O
pti
ca
l D
ep
th(5
50
nm
)
Equator
40 N
60 N
30 SEl Chichon
Mt. Pinatubo
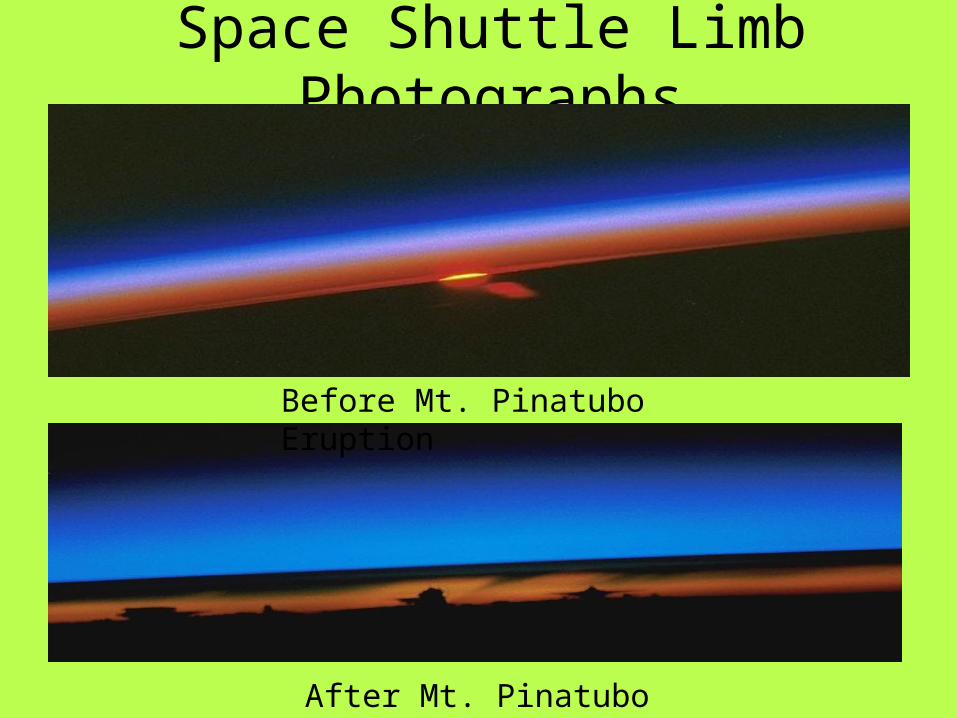
Space Shuttle Limb Photographs
Before Mt. Pinatubo Eruption
After Mt. Pinatubo Eruption
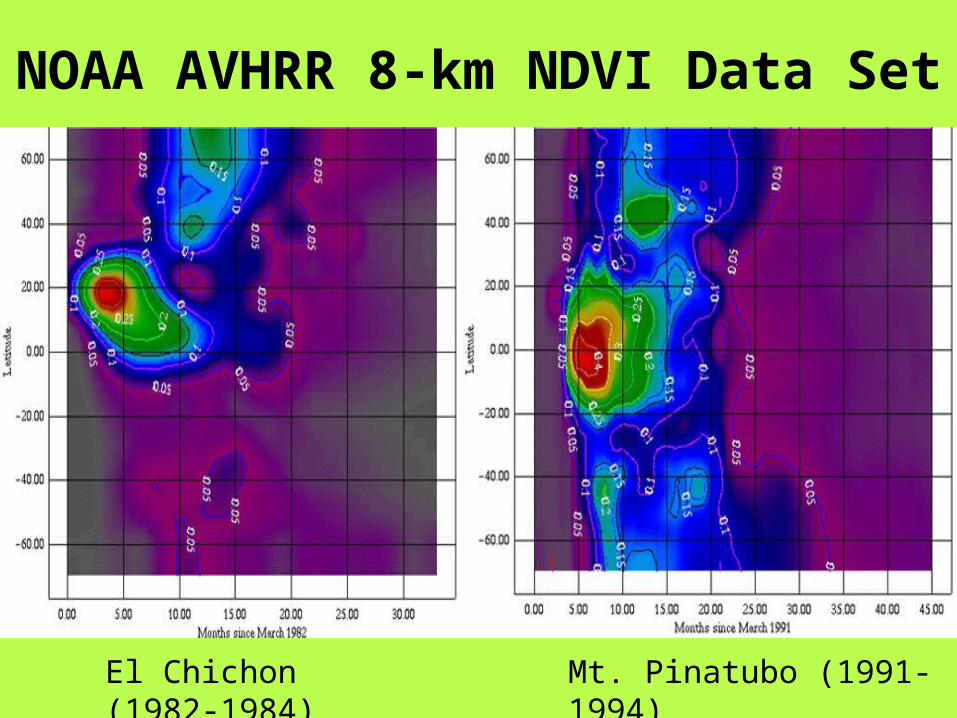
NOAA AVHRR 8-km NDVI Data Set
El Chichon (1982-1984) Mt. Pinatubo (1991-1994)
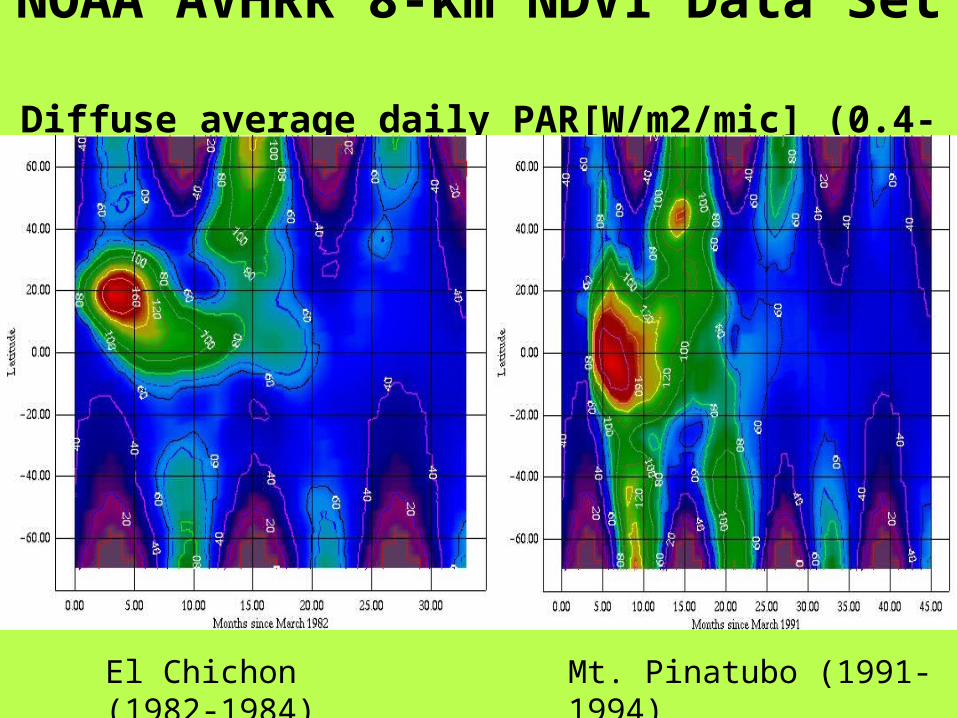
NOAA AVHRR 8-km NDVI Data Set Diffuse average daily PAR[W/m2/mic] (0.4-0.7 mic)
El Chichon (1982-1984) Mt. Pinatubo (1991-1994)
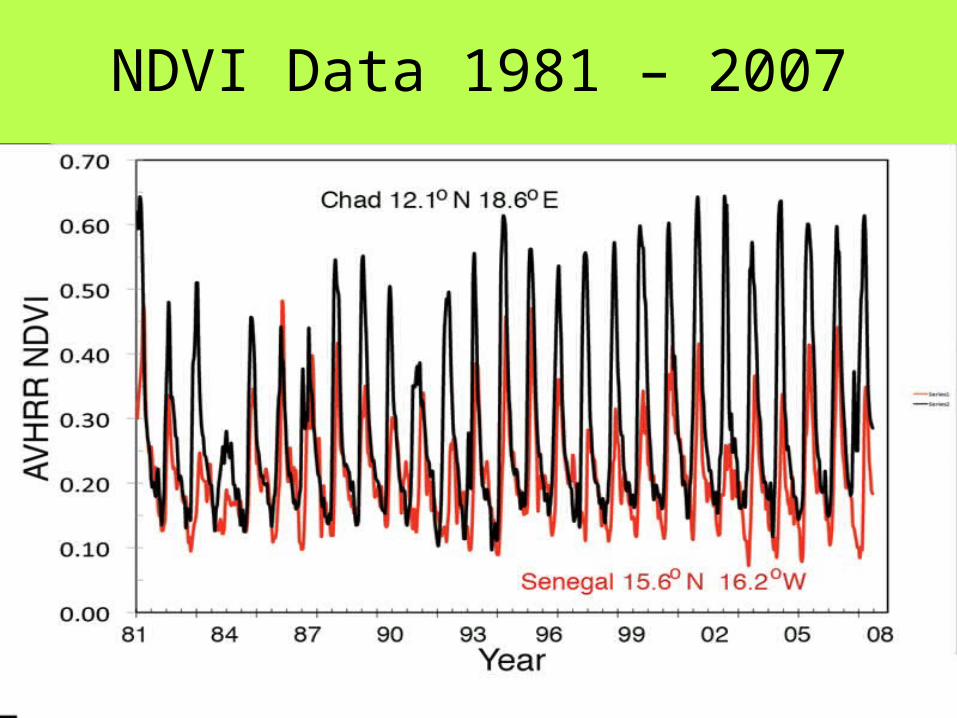
NDVI Data 1981 – 2007