
Phillip securities market outlook seminar market technical outlook

| Wealth Management Advisory |
Global Market Outlook | 11 March 2016 This commentary reflects the views of the Wealth Management Group of Standard Chartered Bank. Important disclosures can be found in the Disclosures Appendix.
Global Market Outlook
March 2016
Risks are rising
A US recession in the next 12 months is not a central scenario, but the risks have clearly risen
since our Outlook 2016 publication in early December. Adding in short-term risks to the outlook
for China and oil markets, this makes us more cautious on the outlook for global equities.
US corporate credit, both Investment Grade (IG) and High Yield (HY) bonds, appears to be
pricing in more of the downside risks, in our opinion. We would be looking to increase allocation
in this space.
Alternative strategies are generally attractive in a more volatile and uncertain world, and many of
the key drivers for this asset class are positive. We have a preference for equity long/short and
global macro strategies.
02 Perspectives from our
Chief Investment
Strategist
03 Market performance
summary
04 Investment strategy
06 Economic and policy
outlook
10 Bonds
12 Equity
17 Commodities
19 Alternative strategies
20 Foreign exchange
23 Multi-asset investing in
the current
environment
24 Disclosure appendix
Global Market Outlook | 11 March 2016 2
Perspectives from our Global Investment Council
You entered the year bullish
on global equities, but you appear to be more concerned today. Can you explain the rationale for this shift?
Where we are in the US economic cycle is key. The central scenario is we are some
way from the end of the cycle, but the risks have increased. While economic
indicators paint a reasonably positive picture, the performance of global equity
markets, High Yield (HY) corporate bonds and downward revisions to corporate
earnings are flashing amber when it comes to recessionary risks.
On balance, we still expect positive equity market returns. However, uncertainty has
increased, especially as equities have discounted a recession less than many other
asset classes, in our opinion. Within equities, we retain our preference for Euro
area/Japan markets.
What are the potential catalysts for a change in the outlook?
The main downside risks are the US heading into a recession or China having a
hard landing. Equities generally fall 6-9 months prior to a US recession, while a
China hard landing would be a major deflationary force.
USD strength and CNY or oil price weakness are seen as being negative for risk
assets, while a change in these trends would likely be positive. A coordinated and
credible G7 policy response would be a huge positive for equities, but there are few
signs of this so far.
So what is the GIC’s outlook for the USD and CNY?
The USD’s rally is expected to be less pronounced, less prolonged and less broad
based in 2016. EUR/USD may still fall, but we are more bearish on the AUD given
our outlook for lower iron ore prices.
The pressure on the CNY is likely to continue in the short term in the absence of a
sharp and broad USD decline.
Oil prices have fallen further so far this year. Are you expecting this to continue?
Oil markets remain oversupplied, with oil inventories continuing to rise. Therefore,
the pressure is on oil prices to decline further.
In the short term, it would likely take a credible production cut or an escalation of
conflict in an oil-producing region to push oil prices higher.
Over the long term, we expect demand to pick up, helping oil prices to bottom in the
25-30 area over the next 3-6 months.
Where do you see value in the current environment?
From a multi-asset investment perspective, we are focusing more on lower volatility,
relative strategies. Our preferred asset class is alternative strategies, where a lot of
the factors driving performance are supportive.
Within bonds, we have a preference for US corporate credit. US HY bonds are
expected to generate positive returns despite an increase in corporate defaults. US
Investment Grade (IG) bonds appear to be pricing in a recession, which makes
valuations attractive, in our opinion.
The team
Alexis Calla Global Head, Investment Advisory and Strategy
Steve Brice Chief Investment Strategist
Aditya Monappa, CFA Head, Asset Allocation & Portfolio Solutions
Clive McDonnell Head, Equity Investment Strategy
Audrey Goh, CFA Director, Asset Allocation & Portfolio Solutions
Manpreet Gill Head, FICC Investment Strategy
Rajat Bhattacharya Investment Strategist
Victor Teo, CFA Investment Strategist
Tariq Ali, CFA Investment Strategist
Abhilash Narayan Investment Strategist Trang Nguyen Analyst, Asset Allocation & Portfolio Solutions
1
2
3
4
5

Global Market Outlook | 11 March 2016 3
Market performance summary*
Equity Year to date 1 month
Global Equities -6.4% 2.4%
Global High Dividend Yield Equities -2.7% 4.4%
Developed Markets (DM) -6.3% 2.4%
Emerging Markets (EM) -7.3% 2.8%
By country
US -4.7% 4.0%
Western Europe (Local) -8.3% -1.4%
Western Europe (USD) -9.0% -0.8%
Japan (Local) -15.6% -6.1%
Japan (USD) -9.9% -1.2%
Australia -8.7% 1.3%
Asia ex-Japan -9.1% 0.3%
Africa -4.5% 10.4%
Eastern Europe -2.1% 8.9%
LatAm -1.9% 11.1%
Middle East -7.9% 8.9%
China -15.7% -2.8%
India -14.0% -5.7%
South Korea -7.6% -1.9%
Taiwan -1.1% 7.2%
By sector
Consumer Discretionary -7.2% 1.4%
Consumer Staples 0.1% 4.2%
Energy -3.4% 8.0%
Financial -12.6% -0.1%
Healthcare -7.8% -1.1%
Industrial -3.7% 5.8%
IT -6.6% 1.6%
Materials -4.7% 8.2%
Telecom 1.2% 4.6%
Utilities 2.2% 5.4%
Global Property Equity/REITS -4.0% 3.2%
Bonds Year to date 1 month
Sovereign
Global IG Sovereign 4.6% 3.6%
Global HY Sovereign -0.2% 2.2%
EM IG Sovereign 2.3% 2.7%
US Sovereign 3.4% 1.8%
EU Sovereign 5.3% 4.1%
Asia EM Local Currency 2.1% 1.9%
Credit
Global IG Corporates 1.1% 1.4%
Global HY Corporates -2.1% 0.3%
US HY -2.3% 0.2%
Europe HY -2.0% 0.5%
Asia HY Corporates -0.3% 0.7%
Commodity Year to date 1 month
Diversified Commodity -3.5% 1.7%
Agriculture -3.2% -3.0%
Energy -16.5% -0.4%
Industrial Metal -0.2% 4.7%
Precious Metal 15.0% 10.5%
Crude Oil -8.4% 12.7%
Gold 16.2% 11.3%
FX (against USD) Year to date 1 month
Asia ex-Japan -1.0% 0.1%
AUD -0.7% 4.0%
EUR 1.4% 1.6%
GBP -5.3% -2.0%
JPY 6.4% 4.7%
SGD 1.2% 2.0%
Alternatives Year to date 1 month
Composite (All strategies) -3.6% -0.6%
Arbitrage -3.1% -0.7%
Event Driven -4.7% -0.6%
Equity Long/Short -6.4% -1.4%
Macro CTAs 1.6% 0.6%
*All performance shown in USD terms, unless otherwise stated.
*YTD performance data from 31 December 2015 to 25 February 2016 and 1-month performance from 25 January to 25 February 2016
Sources: MSCI, JP Morgan, Barclays Capital, Citigroup, Dow Jones, HFRX, FTSE, Bloomberg, Standard Chartered

Global Market Outlook | 11 March 2016 4
Investment strategy
Financial markets have been volatile since the start of 2016. Within A.D.A.P.T., our positive
global equity market view theme has been the main underperformer; diversified income assets
and alternative strategies have managed volatility somewhat better.
Many short-term indicators argue a rebound may be in the offing (or already underway).
Longer term, though, the path has become increasingly data dependent. The Euro area and
Japan remain our preferred equity markets, but in the US, we prefer corporate credit. Alternative
strategies offer very attractive exposure amid rising uncertainty.
Rebound increasingly likely short term
One of the key themes in our Outlook 2016 was the likelihood
of volatility trending higher. This has indeed been the case.
However, many short-term indicators suggest markets may
continue to rebound over the next few weeks and months:
Measures of sentiment are only just starting to rebound
from extremely negative levels
Technical indicators argue equity markets could be in the
process of forming a near-term base
Equity and bond valuations are arguably pricing in at least
a partial likelihood of a recession. US High Yield (HY)
spreads, for instance, are at 2011 ‘growth scare’ levels
Fund manager surveys show cash holdings are very high
(a post-2001 high), suggesting a lot of cash is waiting to be
deployed should sentiment improve
Negative sentiment at its most extreme since 2008-09
BCA US equity composite sentiment indicator
Data as of 12-Feb-2016 Source: BCA Research, Standard Chartered
A more balanced long-term outlook
Looking beyond this short-term outlook, uncertainty and
downside risks have risen since December 2015. The
evolution of macro and market fundamentals data since mid-
December last year has been mixed – while many indicators
have deteriorated, a few have improved. In our view, this is
grounds for a more balanced positioning than before.
However, we do not believe conditions have deteriorated
sufficiently to justify an outright defensive approach.
From an investment perspective, keeping a balance is key.
Equity exposure remains important, in our view, and we
maintain our conviction in the Euro area and Japan. However,
we acknowledge the US and China outlook is more clouded
than before. Here, we believe US HY bonds offer a more
attractive way of gaining exposure – in an optimistic scenario,
current markets offer an opportunity to lock in very attractive
yields, while in a pessimistic scenario, volatility is likely to be
more limited than in equities.
Balancing this with alternative strategies and high-quality
corporate bonds remains key to managing uncertainty. We
believe US Investment Grade (IG) corporate bonds are in a
sweet spot – they usually outperform risky asset classes
significantly in pessimistic outcomes (eg, a US recession), but
today’s attractive valuation levels mean they offer room for
gains in a ‘risk-on’ scenario as well.
Similarly, alternative strategies offer an appealing basket of
strategies amid heightened uncertainty. Macro strategies have
demonstrated considerable ‘insurance value’ during periods of
volatility (including the last two months). Equity long/short
strategies, meanwhile, provide exposure to equities with lower
volatility than simple long-only exposure.
Global Market Outlook | 11 March 2016 5
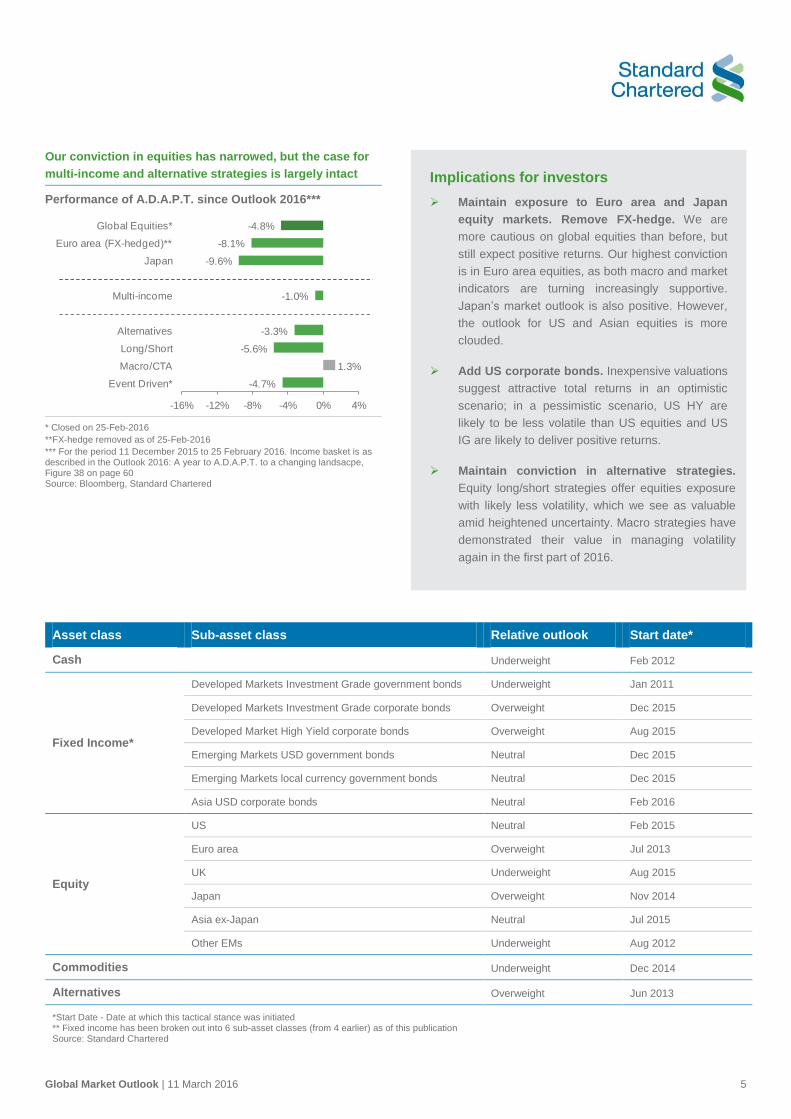
Our conviction in equities has narrowed, but the case for
multi-income and alternative strategies is largely intact
Performance of A.D.A.P.T. since Outlook 2016***
* Closed on 25-Feb-2016
**FX-hedge removed as of 25-Feb-2016
*** For the period 11 December 2015 to 25 February 2016. Income basket is as described in the Outlook 2016: A year to A.D.A.P.T. to a changing landsacpe, Figure 38 on page 60 Source: Bloomberg, Standard Chartered
Asset class Sub-asset class Relative outlook Start date*
Cash Underweight Feb 2012
Fixed Income*
Developed Markets Investment Grade government bonds Underweight Jan 2011
Developed Markets Investment Grade corporate bonds Overweight Dec 2015
Developed Market High Yield corporate bonds Overweight Aug 2015
Emerging Markets USD government bonds Neutral Dec 2015
Emerging Markets local currency government bonds Neutral Dec 2015
Asia USD corporate bonds Neutral Feb 2016
Equity
US Neutral Feb 2015
Euro area Overweight Jul 2013
UK Underweight Aug 2015
Japan Overweight Nov 2014
Asia ex-Japan Neutral Jul 2015
Other EMs Underweight Aug 2012
Commodities Underweight Dec 2014
Alternatives Overweight Jun 2013
*Start Date - Date at which this tactical stance was initiated ** Fixed income has been broken out into 6 sub-asset classes (from 4 earlier) as of this publication Source: Standard Chartered
-4.7%
1.3%
-5.6%
-3.3%
-1.0%
-9.6%
-8.1%
-4.8%
-16% -12% -8% -4% 0% 4%
Event Driven*
Macro/CTA
Long/Short
Alternatives
Multi-income
Japan
Euro area (FX-hedged)**
Global Equities*
Implications for investors
Maintain exposure to Euro area and Japan
equity markets. Remove FX-hedge. We are
more cautious on global equities than before, but
still expect positive returns. Our highest conviction
is in Euro area equities, as both macro and market
indicators are turning increasingly supportive.
Japan’s market outlook is also positive. However,
the outlook for US and Asian equities is more
clouded.
Add US corporate bonds. Inexpensive valuations
suggest attractive total returns in an optimistic
scenario; in a pessimistic scenario, US HY are
likely to be less volatile than US equities and US
IG are likely to deliver positive returns.
Maintain conviction in alternative strategies.
Equity long/short strategies offer equities exposure
with likely less volatility, which we see as valuable
amid heightened uncertainty. Macro strategies have
demonstrated their value in managing volatility
again in the first part of 2016.
Global Market Outlook | 11 March 2016 6
Economic and policy outlook
The global economic outlook has become more challenging in recent months, with growth and
inflation expectations declining in some developed economies, including in the US.
The slowdown has led to paring down of expectations for a Fed rate hike; we now expect one
hike this year. The ECB and the BoJ are likely to carry through with their promises to further
ease policy, perhaps by cutting rates deeper into negative territory, providing support to growth.
China and the Emerging Markets remain key sources of risk. Coordinated policy action among
major developed and emerging economies (through G20 or other forums) would likely revive
confidence and ward off deflation risks, but this looks unlikely for now.
The global economic outlook has weakened in recent
months, with signs of a slowdown in the US, Japan and
Emerging Markets (EMs) across Latin America, the Middle
East and Eastern Europe. The Euro area and Asia ex-Japan
are holding up reasonably well even with the continued
slowdown in China’s industrial sector. The USD’s strength and
mining sector’s investment cutback are weighing on US
growth. However, a strong job market is boosting
consumption, which accounts for two-thirds of the economy,
reducing the risk of a recession this year.
The sustained oil price decline has lowered inflation
expectations in most Developed Markets (DMs). While
lower commodity prices are positive for consumers over the
medium to longer term, the immediate concern is its impact on
the resource sector’s investments and jobs, as well as the
second-order effects on the financial sector exposed to this
industry. We expect oil prices to bottom in the next 3-6
months, which should help alleviate deflation pressures.
Below-trend growth and subdued inflation in DMs should
keep monetary policy supportive. We expect the Fed to
hold rates in March and tighten policy only once this year. The
ECB and the BoJ are likely to lower interest rates further into
negative territory in the coming months.
Persistent deflationary pressures after years of stimulus
are raising questions about the efficacy of easy monetary
policy. Japan’s move into negative rates, following similar
moves in Europe, has ignited a debate over the implications
for global growth and assets. While there is scope for rates to
go deeper into negative, there is growing perception the world
needs coordinated monetary and fiscal stimulus to revive
confidence and overcome deflation risks.
China and EMs remain a key source of risk. The focus will
remain on China’s ability to stem capital outflows and manage
a smooth transition of the economy from investment-led
growth towards consumption. We expect China to tighten
capital controls in the coming months and keep its currency
largely stable against those of its major trading partners. Its
success may be critical in reviving global business sentiment.
Key economic indicators
Factor What has changed since December 2015
Growth outlook
Global growth expectations have weakened. The strong USD and mining investment cuts are hurting US growth, although a strong job market is likely to sustain consumption-led growth this year. Resource-based emerging economies continue to see growth downgrades due to lower oil prices.
Inflation outlook
The oil price decline and still-significant excess production capacities have lowered inflation expectations in most developed economies.
Policy outlook
Below-trend growth and subdued inflation are likely to keep policy supportive in most developed economies. We expect the Fed to raise rates once this year. The ECB and the BoJ may cut rates deeper into negative territory.
Policy risks
Persistent deflationary pressures after years of stimulus are raising questions about the efficacy of monetary policy. Coordinated global policy action may be needed to revive confidence, although it may not be forthcoming soon.
Focus on China
China and the emerging economies remain a key source of risk. We expect China to tighten capital controls and keep its currency largely stable against its key trade partners’ as it seeks to stem capital outflows.
Source: Standard Chartered
We expect the Fed to hold rates
in March and tighten policy only
once this year.
Global Market Outlook | 11 March 2016 7
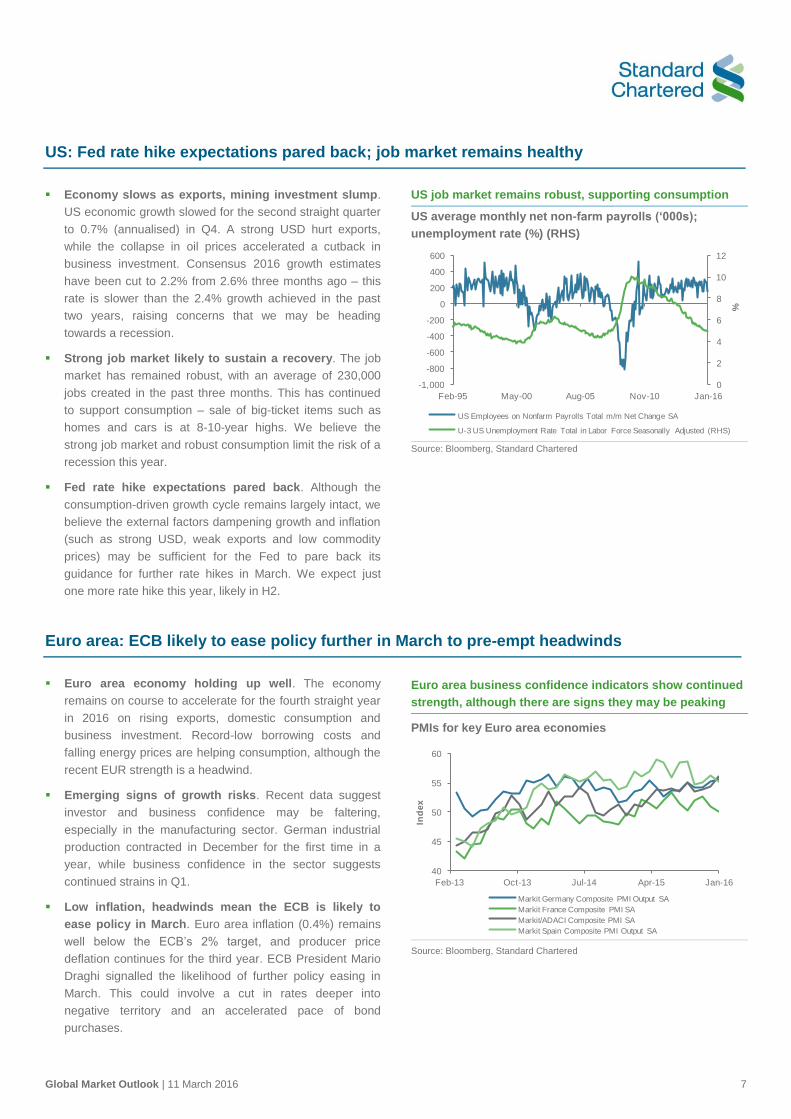
US: Fed rate hike expectations pared back; job market remains healthy
Economy slows as exports, mining investment slump.
US economic growth slowed for the second straight quarter
to 0.7% (annualised) in Q4. A strong USD hurt exports,
while the collapse in oil prices accelerated a cutback in
business investment. Consensus 2016 growth estimates
have been cut to 2.2% from 2.6% three months ago – this
rate is slower than the 2.4% growth achieved in the past
two years, raising concerns that we may be heading
towards a recession.
Strong job market likely to sustain a recovery. The job
market has remained robust, with an average of 230,000
jobs created in the past three months. This has continued
to support consumption – sale of big-ticket items such as
homes and cars is at 8-10-year highs. We believe the
strong job market and robust consumption limit the risk of a
recession this year.
Fed rate hike expectations pared back. Although the
consumption-driven growth cycle remains largely intact, we
believe the external factors dampening growth and inflation
(such as strong USD, weak exports and low commodity
prices) may be sufficient for the Fed to pare back its
guidance for further rate hikes in March. We expect just
one more rate hike this year, likely in H2.
US job market remains robust, supporting consumption
US average monthly net non-farm payrolls (‘000s);
unemployment rate (%) (RHS)
Source: Bloomberg, Standard Chartered
Euro area: ECB likely to ease policy further in March to pre-empt headwinds
Euro area economy holding up well. The economy
remains on course to accelerate for the fourth straight year
in 2016 on rising exports, domestic consumption and
business investment. Record-low borrowing costs and
falling energy prices are helping consumption, although the
recent EUR strength is a headwind.
Emerging signs of growth risks. Recent data suggest
investor and business confidence may be faltering,
especially in the manufacturing sector. German industrial
production contracted in December for the first time in a
year, while business confidence in the sector suggests
continued strains in Q1.
Low inflation, headwinds mean the ECB is likely to
ease policy in March. Euro area inflation (0.4%) remains
well below the ECB’s 2% target, and producer price
deflation continues for the third year. ECB President Mario
Draghi signalled the likelihood of further policy easing in
March. This could involve a cut in rates deeper into
negative territory and an accelerated pace of bond
purchases.
Euro area business confidence indicators show continued
strength, although there are signs they may be peaking
PMIs for key Euro area economies
Source: Bloomberg, Standard Chartered
0
2
4
6
8
10
12
-1,000
-800
-600
-400
-200
0
200
400
600
Feb-95 May-00 Aug-05 Nov-10 Jan-16
%
US Employees on Nonfarm Payrolls Total m/m Net Change SA
U-3 US Unemployment Rate Total in Labor Force Seasonally Adjusted (RHS)
40
45
50
55
60
Feb-13 Oct-13 Jul-14 Apr-15 Jan-16
Ind
ex
Markit Germany Composite PMI Output SA
Markit France Composite PMI SA
Markit/ADACI Composite PMI SA
Markit Spain Composite PMI Output SA
Global Market Outlook | 11 March 2016 8
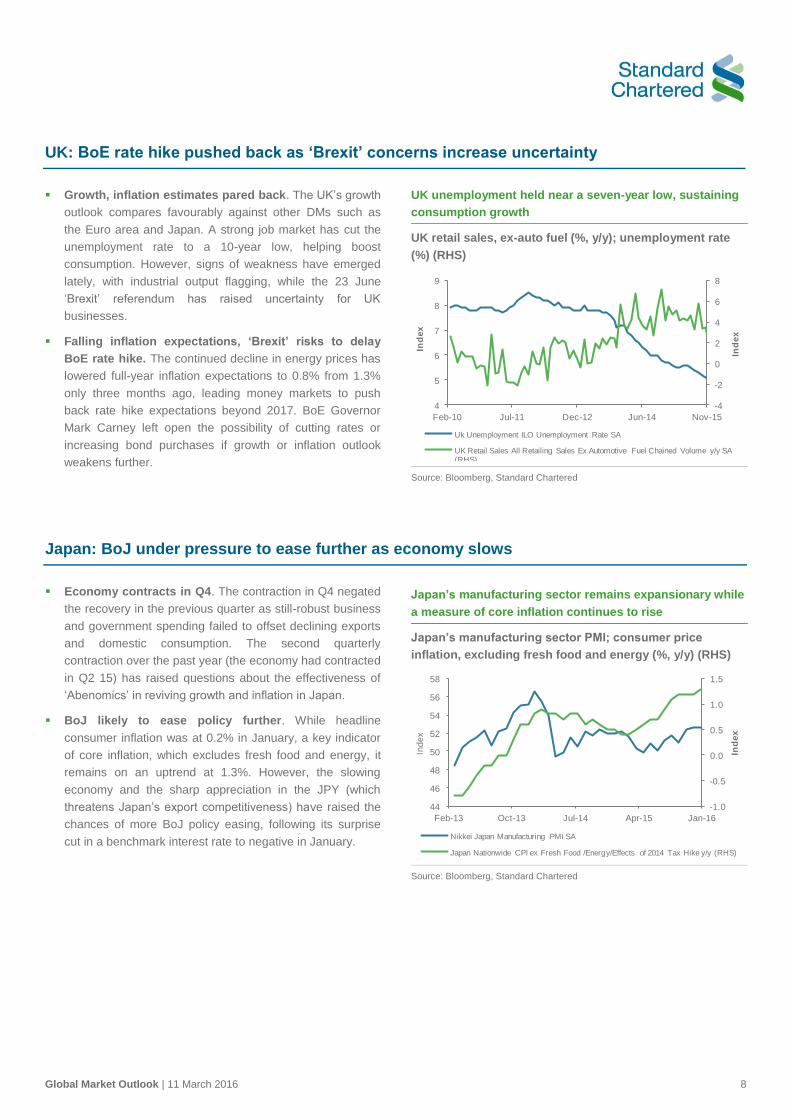
UK: BoE rate hike pushed back as ‘Brexit’ concerns increase uncertainty
Growth, inflation estimates pared back. The UK’s growth
outlook compares favourably against other DMs such as
the Euro area and Japan. A strong job market has cut the
unemployment rate to a 10-year low, helping boost
consumption. However, signs of weakness have emerged
lately, with industrial output flagging, while the 23 June
‘Brexit’ referendum has raised uncertainty for UK
businesses.
Falling inflation expectations, ‘Brexit’ risks to delay
BoE rate hike. The continued decline in energy prices has
lowered full-year inflation expectations to 0.8% from 1.3%
only three months ago, leading money markets to push
back rate hike expectations beyond 2017. BoE Governor
Mark Carney left open the possibility of cutting rates or
increasing bond purchases if growth or inflation outlook
weakens further.
UK unemployment held near a seven-year low, sustaining
consumption growth
UK retail sales, ex-auto fuel (%, y/y); unemployment rate
(%) (RHS)
Source: Bloomberg, Standard Chartered
Japan: BoJ under pressure to ease further as economy slows
Economy contracts in Q4. The contraction in Q4 negated
the recovery in the previous quarter as still-robust business
and government spending failed to offset declining exports
and domestic consumption. The second quarterly
contraction over the past year (the economy had contracted
in Q2 15) has raised questions about the effectiveness of
‘Abenomics’ in reviving growth and inflation in Japan.
BoJ likely to ease policy further. While headline
consumer inflation was at 0.2% in January, a key indicator
of core inflation, which excludes fresh food and energy, it
remains on an uptrend at 1.3%. However, the slowing
economy and the sharp appreciation in the JPY (which
threatens Japan’s export competitiveness) have raised the
chances of more BoJ policy easing, following its surprise
cut in a benchmark interest rate to negative in January.
Japan’s manufacturing sector remains expansionary while
a measure of core inflation continues to rise
Japan’s manufacturing sector PMI; consumer price
inflation, excluding fresh food and energy (%, y/y) (RHS)
Source: Bloomberg, Standard Chartered
-4
-2
0
2
4
6
8
4
5
6
7
8
9
Feb-10 Jul-11 Dec-12 Jun-14 Nov-15
Ind
ex
Ind
ex
Uk Unemployment ILO Unemployment Rate SA
UK Retail Sales All Retailing Sales Ex Automotive Fuel Chained Volume y/y SA (RHS)
-1.0
-0.5
0.0
0.5
1.0
1.5
44
46
48
50
52
54
56
58
Feb-13 Oct-13 Jul-14 Apr-15 Jan-16
Ind
ex
Ind
ex
Nikkei Japan Manufacturing PMI SA
Japan Nationwide CPI ex Fresh Food /Energy/Effects of 2014 Tax Hike y/y (RHS)

Global Market Outlook | 11 March 2016 9
China: Government spending, bank lending ramped up as growth slows
Strong services sector partly offsets industrial
slowdown. China’s services sector expanded more than
8% last year, accounting for half the economy, and helping
offset a continued slowdown in manufacturing. The robust
services sector has helped sustain job creation and
domestic consumption, despite the decline in exports and
slowdown in domestic investment.
Further policy easing likely. The government has ramped
up fiscal spending over the past year and bank lending in
recent months. We expect these measures to continue in
the coming months. Monetary stimulus may take a
backseat for now, as authorities are likely to tighten capital
controls and try to keep the CNY largely stable against the
currencies of China’s major trade partners to stem capital
outflows. We expect targeted bank reserve requirement
cuts as the currency stabilises. The National People’s
Congress in March will be in focus for signs of more
growth-supportive steps.
China’s services sector has continued to expand, despite a
slowdown in the manufacturing sector
China’s manufacturing and non-manufacturing sector
purchasing managers index
Source: Bloomberg, Standard Chartered
Other EMs: Asian export slowdown continues; India’s budget in focus
Asian exports continue to contract. The sustained
decline in exports – as China’s imports slow – has led to a
cutback in Asian growth estimates. (The chart on the right
shows how the rest of the world sees China’s growth
slowdown in USD terms, as opposed to how the slowdown
is seen within China.) With inflation expectations subdued,
most Asian policymakers have room to cut rates further to
support growth. We expect Indonesia to cut rates again in
H1, with an increasing possibility of rate cuts in Malaysia
and South Korea later in the year if global growth fails to
pick up materially.
India’s budget in focus. India’s Finance Minister is under
pressure to meet a 3.5% fiscal deficit target for the year
starting on 1 April. However, increased demands to boost
public spending to offset a continued slowdown in private
investment, a proposed pay hike for government
employees and promises to cut corporate taxes mean he
may need to find new sources of revenue (including
privatisations) to be able to meet the target. RBI Governor
Raghuram Rajan has said further rate cuts depend on the
government’s ability to meet the deficit target.
China’s slowdown is felt more intensely in the rest of the
world than in China itself (Nominal GDP growth in USD
terms have fallen more sharply than nominal GDP growth
in CNY terms due to deflation and CNY depreciation)
China’s quarterly GDP growth in real, nominal (CNY) and
nominal (USD) terms (% y/y)
Source: Gavekal, Bloomberg, Standard Chartered
3
9
15
21
27
Apr-11 May-12 Jul-13 Sep-14 Nov-15
Ind
ex
China Real GDP y/y in CNY China Nominal GDP y/y in CNY
China Nominal GDP y/y in USD
Global Market Outlook | 11 March 2016 10
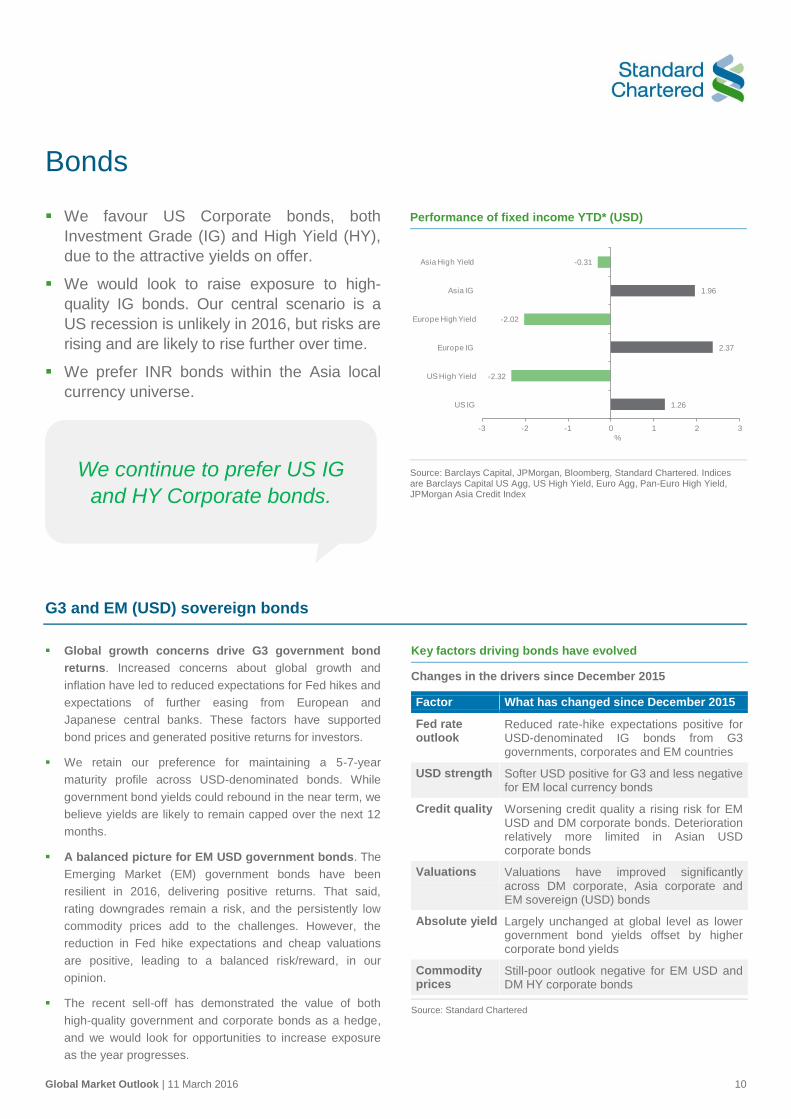
Bonds
We favour US Corporate bonds, both
Investment Grade (IG) and High Yield (HY),
due to the attractive yields on offer.
We would look to raise exposure to high-
quality IG bonds. Our central scenario is a
US recession is unlikely in 2016, but risks are
rising and are likely to rise further over time.
We prefer INR bonds within the Asia local
currency universe.
Performance of fixed income YTD* (USD)
Source: Barclays Capital, JPMorgan, Bloomberg, Standard Chartered. Indices are Barclays Capital US Agg, US High Yield, Euro Agg, Pan-Euro High Yield, JPMorgan Asia Credit Index
G3 and EM (USD) sovereign bonds
Global growth concerns drive G3 government bond
returns. Increased concerns about global growth and
inflation have led to reduced expectations for Fed hikes and
expectations of further easing from European and
Japanese central banks. These factors have supported
bond prices and generated positive returns for investors.
We retain our preference for maintaining a 5-7-year
maturity profile across USD-denominated bonds. While
government bond yields could rebound in the near term, we
believe yields are likely to remain capped over the next 12
months.
A balanced picture for EM USD government bonds. The
Emerging Market (EM) government bonds have been
resilient in 2016, delivering positive returns. That said,
rating downgrades remain a risk, and the persistently low
commodity prices add to the challenges. However, the
reduction in Fed hike expectations and cheap valuations
are positive, leading to a balanced risk/reward, in our
opinion.
The recent sell-off has demonstrated the value of both
high-quality government and corporate bonds as a hedge,
and we would look for opportunities to increase exposure
as the year progresses.
Key factors driving bonds have evolved
Changes in the drivers since December 2015
Factor What has changed since December 2015
Fed rate outlook
Reduced rate-hike expectations positive for USD-denominated IG bonds from G3 governments, corporates and EM countries
USD strength Softer USD positive for G3 and less negative for EM local currency bonds
Credit quality Worsening credit quality a rising risk for EM USD and DM corporate bonds. Deterioration relatively more limited in Asian USD corporate bonds
Valuations Valuations have improved significantly across DM corporate, Asia corporate and EM sovereign (USD) bonds
Absolute yield Largely unchanged at global level as lower government bond yields offset by higher corporate bond yields
Commodity prices
Still-poor outlook negative for EM USD and DM HY corporate bonds
Source: Standard Chartered
1.26
-2.32
2.37
-2.02
1.96
-0.31
-3 -2 -1 0 1 2 3
US IG
US High Yield
Europe IG
Europe High Yield
Asia IG
Asia High Yield
%
We continue to prefer US IG
and HY Corporate bonds.

Global Market Outlook | 11 March 2016 11
Corporate credit (USD)
US corporate credit remains our top pick. Admittedly,
our preference for US HY bonds has not worked out as
expected. Lower oil prices and increasing concerns over a
potential recession in the US have pushed prices lower.
However, US HY bonds now offer close to a 9.5% yield,
and outside of energy sector bonds, current spreads are
pricing default levels generally seen during recessions. We
believe US HY bonds offer a low-volatility alternative to
gain exposure to US corporates compared to equities.
While we cannot rule out further near-term weakness due
to oil price movements, the 9.5% yield on offer adequately
compensates for the risks, in our view.
US IG corporate credit may offer the sweet spot. While
the risks of a US recession are increasing, it is not a central
scenario for us in the next 12 months. However, given the
challenges in predicting a recession, we continue to prefer
owning a balanced exposure to both IG and HY corporate
bonds. In today’s low-yield environment, US IG corporate
credit may offer the sweet spot of IG credit quality and the
3.5% yield, which is attractive in today’s low-yield
environment. As shown in the chart alongside, a balanced
exposure to US IG and HY bonds has helped reduce the
volatility of returns.
Asian USD credit viewed as a defensive play. Asian
credit has been relatively stable in the recent months and
looks expensive against other EMs. However, we remain
comfortable with Asia USD corporate bond exposure, as
the region is in a better economic shape than other regions,
has lower exposure to commodities and is supported by
strong local demand. Data suggests most international EM
investors are underexposed to Asia, which may reduce the
risk of sharp outflows. That said, we acknowledge the
challenges China’s slowdown could pose to the credit
quality and, hence, prefer exposure to IG bonds.
US HY offers equity-like exposure to US corporate, albeit
with a slightly less volatile path
US HY total returns and S&P 500 index, normalised (1
January 2015 = 100)
Source: Barclays, Bloomberg, Standard Chartered
US IG corporates offer more stable returns than US HY
US IG and US HY total returns, normalised (1 Jan 2015 =
100)
Source: Barclays, Bloomberg, Standard Chartered
Asian local currency bonds
We are cautious on Asian local currency bonds. As
before, currency vulnerability remains our chief concern
from a USD-denominated perspective despite policies
supportive of local bond markets, as key drivers of EM
currencies remain weak. While we are a little more
comfortable with Asian local currency bonds over other EM
regions, we prefer USD-denominated bonds over local-
currency-denominated bonds.
86
91
96
101
106
Jan-15 Apr-15 Jul-15 Nov-15 Feb-16
Ind
ex
S&P 500 US HY bonds
88
94
100
106
Jan-15 Apr-15 Jul-15 Nov-15 Feb-16
Ind
ex
US IG Corporate bonds US HY bonds
Global Market Outlook | 11 March 2016 12
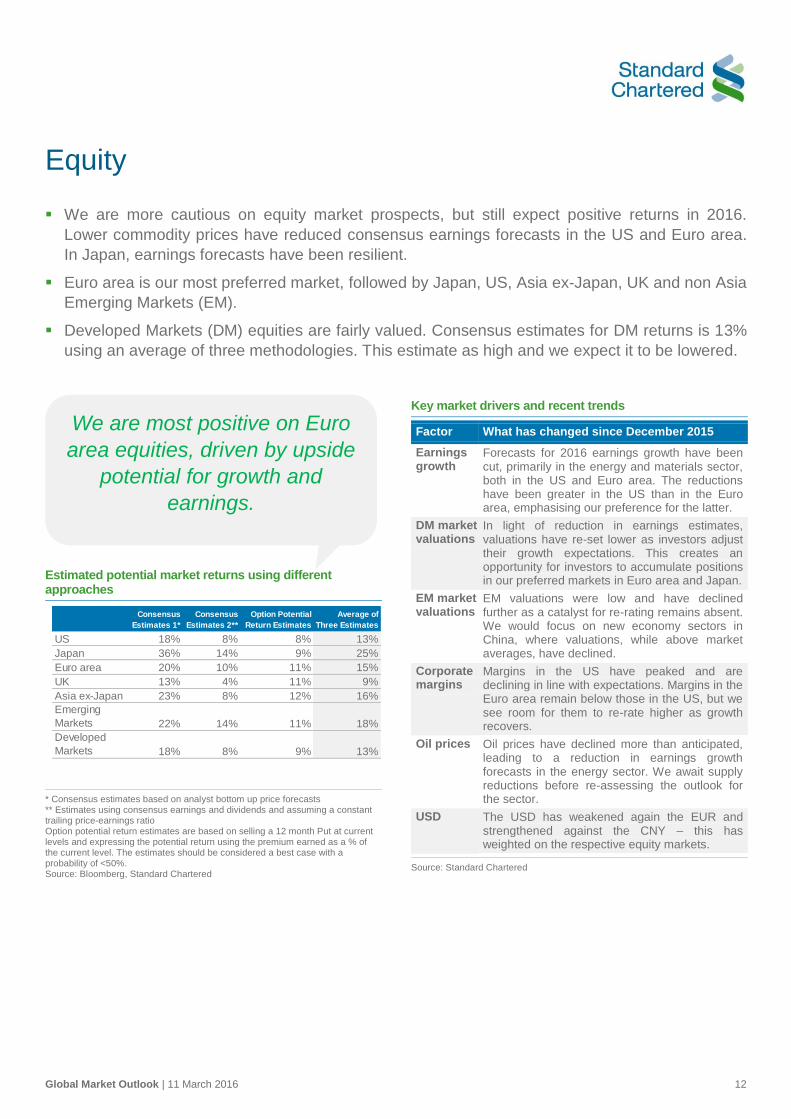
Equity
We are more cautious on equity market prospects, but still expect positive returns in 2016.
Lower commodity prices have reduced consensus earnings forecasts in the US and Euro area.
In Japan, earnings forecasts have been resilient.
Euro area is our most preferred market, followed by Japan, US, Asia ex-Japan, UK and non Asia
Emerging Markets (EM).
Developed Markets (DM) equities are fairly valued. Consensus estimates for DM returns is 13%
using an average of three methodologies. This estimate as high and we expect it to be lowered.
Estimated potential market returns using different approaches
* Consensus estimates based on analyst bottom up price forecasts ** Estimates using consensus earnings and dividends and assuming a constant trailing price-earnings ratio Option potential return estimates are based on selling a 12 month Put at current levels and expressing the potential return using the premium earned as a % of the current level. The estimates should be considered a best case with a probability of <50%. Source: Bloomberg, Standard Chartered
Key market drivers and recent trends
Factor What has changed since December 2015
Earnings growth
Forecasts for 2016 earnings growth have been cut, primarily in the energy and materials sector, both in the US and Euro area. The reductions have been greater in the US than in the Euro area, emphasising our preference for the latter.
DM market valuations
In light of reduction in earnings estimates, valuations have re-set lower as investors adjust their growth expectations. This creates an opportunity for investors to accumulate positions in our preferred markets in Euro area and Japan.
EM market valuations
EM valuations were low and have declined further as a catalyst for re-rating remains absent. We would focus on new economy sectors in China, where valuations, while above market averages, have declined.
Corporate margins
Margins in the US have peaked and are declining in line with expectations. Margins in the Euro area remain below those in the US, but we see room for them to re-rate higher as growth recovers.
Oil prices Oil prices have declined more than anticipated, leading to a reduction in earnings growth forecasts in the energy sector. We await supply reductions before re-assessing the outlook for the sector.
USD The USD has weakened again the EUR and strengthened against the CNY – this has weighted on the respective equity markets.
Source: Standard Chartered
Consensus
Estimates 1*
Consensus
Estimates 2**
Option Potential
Return Estimates
Average of
Three Estimates
US 18% 8% 8% 13%
Japan 36% 14% 9% 25%
Euro area 20% 10% 11% 15%
UK 13% 4% 11% 9%
Asia ex-Japan 23% 8% 12% 16%
Emerging
Markets 22% 14% 11% 18%
Developed
Markets 18% 8% 9% 13%
We are most positive on Euro
area equities, driven by upside
potential for growth and
earnings.
We are most positive on Euro area equities, driven by
upside potential for growth and earnings.

Global Market Outlook | 11 March 2016 13
US: Risk of recession rising, but not central scenario
We are cautious on the outlook for US equities. YTD, there
has been a swift re-pricing of growth expectations, via a
lower P/E ratio and a reduction in earnings estimates. We
view the P/E ratio decline as a return to fair value as
opposed to signaling a recession ahead – the probability of
which we peg at one in three.
There are reasons to remain positive on the US, and we
would characterise the current equity market weakness as
more reflective of a profits recession as opposed to an
economic one. Moreover, earnings growth, while
deteriorating, is not in the recession zone (typically three or
more quarters of double-digit earnings decline).
A key positive factor supporting US growth is consumer
spending. Labour market trends are very positive, and the
recent pick in wage growth is welcome. So far, we have not
seen evidence of the positive effect from lower oil prices
outside the auto sector, but we continue to believe that the
trickle-down effect will eventually occur.
US valuations have re-set lower in light of weaker
economic and earnings growth estimates
S&P500 valuations
Source: Bloomberg, Standard Chartered
We remain positive on US banks and US-listed technology
companies. We acknowledge that the banks’ sector view
has been under pressure since the start of the year, as
expectations for US interest rate hikes have been reduced
and pushed out to later in the year. Nevetheless, we
believe closing the banks’ sector preference now risks
exiting at a low point with regard to valuations and
performance. US-listed technology performance has also
been weak, but fundamentals remain unchanged, and we
retain our positive stance.
Earnings growth is not yet in recessionary territory
US earnings growth trend
Source: MSCI, Standard Chartered
Europe: Positive Euro area, negative on the UK
We are positive on Euro area equities, anticipating 0-5%
earnings growth in 2016, and believe there is some scope
for valuations to increase from their current levels, which
are close to the long-term average.
Importantly, we do not anticipate a banking crisis in the
Euro area, as current valuations imply. We would
characterise the current downturn in the sector as a
reassessment of the profit outlook as opposed to a
reassessment of the outlook for banks’ capital
requirements. This implies that equity holders are likely to
witness dividend cuts, a trend already underway.
The recent appreciation of the Euro poses a challenge to
the recovery in corporate earnings. Nevertheless, we
believe the ECB is likely to extend its quantitative easing
(QE) programme and further cut the deposit rate deeper
into negative territory. These actions are likely to weaken
the Euro marginally.
9
14
19
24
Jan-02 Aug-05 Feb-09 Aug-12 Feb-16
12m
fw
d P
E (
X)
S&P 500 at 15.8x PE Mean +/- 1 S.D.
-15%
-10%
-5%
0%
5%
10%
15%
1Q14 2Q14 3Q14 4Q14 1Q15 2Q15 3Q15 4Q15
y/y
%
MSCI US Earnings growth

Global Market Outlook | 11 March 2016 14
Our analysis of economic momentum and recession risks
across the Euro area, Japan and the US highlight that we
are least concerned over the outlook for the Euro area. This
provides further support to our positive view.
We remain negative on the outlook for the UK equity
market, noting that consensus earnings growth forecasts,
at -5%, is the worst across the key global markets/regions.
The main factor responsible for dragging earnings lower is
commodity exposure. The UK market has heightened
exposure to these sectors, which continue to come under
pressure given the continued downward pressure on oil
prices.
An added factor weighing on the UK market is the
referendum on continuing its membership of the EU on 23
June. Uncertainty surrounding the outcome of the vote is
likely to maintain downward pressure on the equity
markets.
Uncertainty over EU vote likely to weigh on performance of
the UK market
Euro area and UK equity market performance trend
Source: MSCI, Bloomberg, Standard Chartered
Japan: Remain positive despite the recent sell-off
We remain positive on Japanese equities, but we
acknowledge the decline in the market YTD. Equity market
weakness appears to be a function of the JPY strength in
an environment of rising risk aversion as opposed to a
deterioration in fundamentals – we estimate 5-10%
earnings growth in 2016.
While economic data has weakened and the hope for
increase in employee wages remains elusive, we believe
the weakness in select lead indicators reflects the JPY
strength, which the BoJ is unlikely to allow to continue
unchecked. Our view on salary increases is dependent on
global growth rising above 3%. The latest IMF forecast for
2016 global growth is 3.4%; hence, we remain on track.
However, the timing of the increase could be delayed in
light of the recent surge in the JPY.
Global investors remain overweight Japan, which is the
second-most preferred market after the Euro area.
Nevertheless, reflecting increased uncertainty the
conviciton of the overweight has decreased m/m.
Japanese equity market performance and the yen have
been closely correlated
Nikkei 225 and the yen
Source: Bloomberg, Standard Chartered
70
85
100
115
Feb-15 May-15 Aug-15 Nov-15 Feb-16
Ind
ex 3
1-D
ec
-201
5 =
100
UK Euro area
70
80
90
100
110
120
130
140
5,000
7,000
9,000
11,000
13,000
15,000
17,000
19,000
21,000
23,000
Jan-00 Mar-04 May-08 Jul-12 Aug-16
JP
Y
Ind
ex
Nikkei 225 JPY (RHS)
Global Market Outlook | 11 March 2016 15
Asia ex-Japan: Cautious, focusing on identifying the right sectors in China
We remain cautious on the prospects for Asia, recognising
the value in these markets, but note the absence of
catalysts. Economic growth is slowing and policy makers
are reacting to this through lower rates: Indonesia cut rates
this year and others are expected to follow. Nevertheless,
the economic slowdown is likely to dominate in the near
term, and we expect earnings growth of 0-5% in 2016.
Within Asia, we prefer China, emphasising our preference
for new economy sectors, including technology and
consumer services. We also prefer MSCI China relative to
A shares. While we are positive on China on a relative
basis in Asia ex-Japan, we note that in a ranking of our
preference for key markets, Asia ex-Japan is placed four
out of six, behind the US, but ahead of the UK and non-
Asia EM.
China remains a key market for our clients and for us.
Uncertainty over exchange rate policy, mixed signals on
credit growth and a significant easing of fiscal policy have
created conflicting signals over the outlook.
We have emphasised our preference for new economy
sectors that centre on technology and consumer services.
High valuations in these sectors have left them exposed, as
growth expectations were revised lower. Nevertheless, as
there is no change in the positive drivers of these sectors,
we continue to have conviction over their prospects.
Gap between old and new economy sectors widening
China market valuations
Source: FactSet, Standard Chartered
China A shares tracking the Nasdaq pattern during its
2000-01 down turn
China A shares and Nasdaq
T = peak, T+1 = 1 month after peak Source: FactSet, Standard Chartered
0
5
10
15
20
25
30
Jan-02 Aug-05 Feb-09 Aug-12 Feb-16
12m
fw
d P
E (
x)
China Old Economy New Economy
50
70
90
110
130
150
170
190
T-5 T-3 T-2 T+1 T+3 T+4 T+6 T+8 T+9 T+11 T+13
NASDAQ China A-Shares
Global Market Outlook | 11 March 2016 16
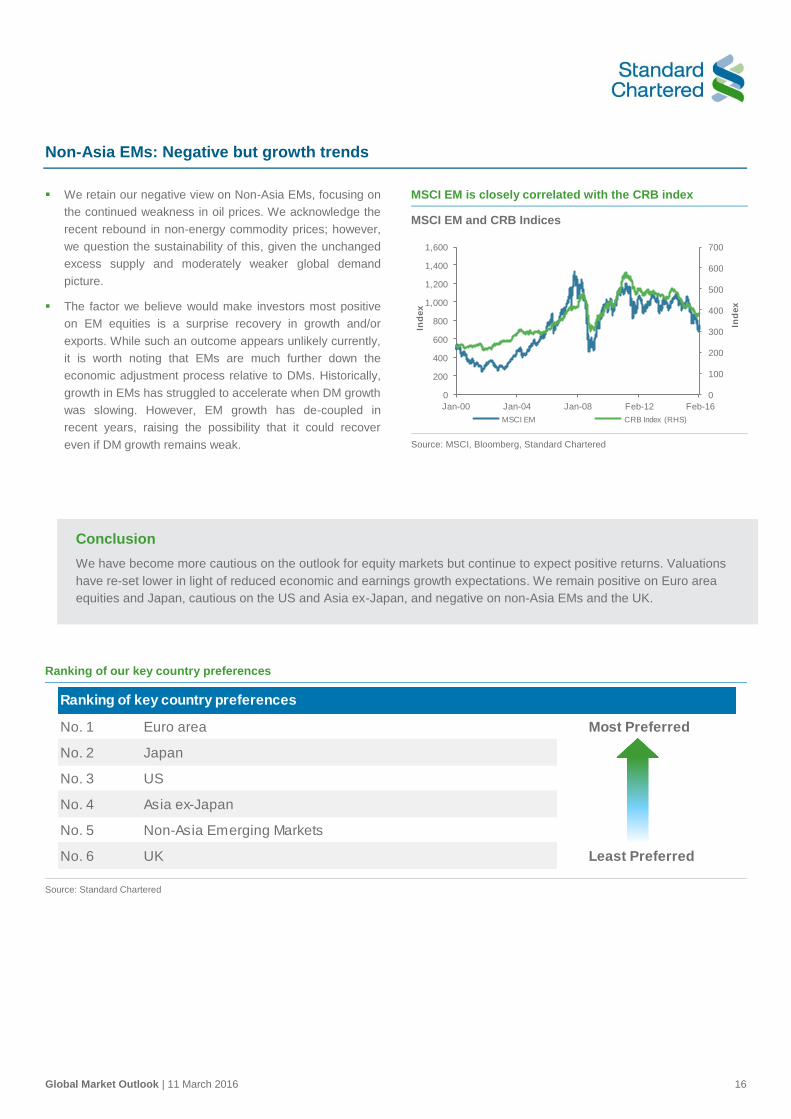
Non-Asia EMs: Negative but growth trends
We retain our negative view on Non-Asia EMs, focusing on
the continued weakness in oil prices. We acknowledge the
recent rebound in non-energy commodity prices; however,
we question the sustainability of this, given the unchanged
excess supply and moderately weaker global demand
picture.
The factor we believe would make investors most positive
on EM equities is a surprise recovery in growth and/or
exports. While such an outcome appears unlikely currently,
it is worth noting that EMs are much further down the
economic adjustment process relative to DMs. Historically,
growth in EMs has struggled to accelerate when DM growth
was slowing. However, EM growth has de-coupled in
recent years, raising the possibility that it could recover
even if DM growth remains weak.
MSCI EM is closely correlated with the CRB index
MSCI EM and CRB Indices
Source: MSCI, Bloomberg, Standard Chartered
Ranking of our key country preferences
Source: Standard Chartered
0
100
200
300
400
500
600
700
0
200
400
600
800
1,000
1,200
1,400
1,600
Jan-00 Jan-04 Jan-08 Feb-12 Feb-16
Ind
ex
Ind
ex
MSCI EM CRB Index (RHS)
Ranking of key country preferences
No. 1 Euro area Most Preferred
No. 2 Japan
No. 3 US
No. 4 Asia ex-Japan
No. 5 Non-Asia Emerging Markets
No. 6 UK Least Preferred
Conclusion
We have become more cautious on the outlook for equity markets but continue to expect positive returns. Valuations
have re-set lower in light of reduced economic and earnings growth expectations. We remain positive on Euro area
equities and Japan, cautious on the US and Asia ex-Japan, and negative on non-Asia EMs and the UK.

Global Market Outlook | 11 March 2016 17
Commodities
Oil prices to bottom out and gradually head
higher, but rebalancing may take longer.
Gold to have limited upside, but we expect it
to outperform industrial metals.
We remain bearish on commodities near term. Further
acceleration in supply growth and a stronger USD may imply
further downside, while greater-than-expected producer
cutbacks are upside risks. We expect crude oil to outperform
gold and industrial metals.
Performance of commodities YTD* (USD)
Source: Bloomberg, Standard Chartered
Oil
We are bearish on oil prices in the short term, but expect
Brent oil prices to bottom out over the next 3-6 months within
USD 25-USD 30. However, the recovery in oil prices is likely
to be gradual and uneven.
We continue to see supply as the primary drivers of low oil
prices. OPEC crude oil production remains firm, while US
production is showing signs of easing. This trend is also
evident in the US rig count, which has plummeted over the
last year, while those in OPEC countries still remain near peak
levels. The recent agreement between Russia and Saudi
Arabia to cap production is unlikely to have a major impact
given it is contingent on others following suit and the already
elevated levels of output.
Crude oil demand, on the other hand, remains more resilient.
According to the International Energy Agency (IEA), total
crude oil demand continues to climb, with a pick-up in
momentum in US crude oil demand. In sum, we believe
markets are likely to rebalance by the end of the year, putting
upward pressure on oil prices. Since our Outlook 2016, our
picture of gradual rebalancing remains intact, but may take
another 3-6 months to materialise. The key downside risk is a
significantly slower production cutback than what we currently
expect.
OPEC supply indicators firm while non-OPEC signals more
supply cutbacks
OPEC and non-OPEC rig count
Source: Bloomberg, Standard Chartered
-0.23
-16.52
-3.22
-3.58
-28 -23 -18 -13 -8 -3
Industrial Metals
Energy
Precious Metals
Agriculture
Commodities composite
%
180
230
280
330
380
430
480
530 Baker Hughes OPEC rig count
350
450
550
650
750
850
950
Jan-00 Jan-04 Jan-08 Jan-12 Jan-16
Baker Hughes non-OPEC rig count

Global Market Outlook | 11 March 2016 18
Gold
We expect gold to trade in the USD/oz 1,150-USD/oz 1,250
range in the short term. Gold has met increased safe-haven
demand, following the sell-off in global equities and scaling
back of Fed rate hike expectations. Lower US interest rates
have also reduced real (inflation-adjusted) interest rate
expectations. US Treasury inflation protection securities
(TIPS) yields, a proxy for real interest rate expectations,
continue to track gold closely (see chart). Inflation
expectations, on the other hand, have continued to fall. In our
opinion, real interest rates are not expected to decline
significantly from current levels, given our expectations for one
Fed rate hike this year. Hence, we would not expect gold to
move higher significantly from current levels, although it is
likely to outperform industrial metals.
Sentiment indicators for gold point to more optimism on the
safe currency. Inflows into gold exchange-traded funds (ETF)
have increased, while positioning shows increased net-long
positioning. A further slowdown or a recession and a banking
sector crisis are key risks for significant upside in gold. On the
downside, a more hawkish Fed poses risks.
Decreased real interest rate expectations behind stronger
gold prices
5-year TIPS yields and gold price
Source: Bloomberg, Standard Chartered
Industrial metals
We do not believe the recent upturn in industrial metal prices
signals a wider upturn. Inventory levels in key industrial
metals, including copper, zinc and iron ore, remain elevated
and continue to rise. Aluminium inventory levels, however,
continue to fall.
On the demand side, global industrial production and China
manufacturing PMI continue to suggest depressed demand for
industrial metals. Furthermore, we do not see significant USD
weakness from here on, which is likely to keep gains in
industrial metals capped.
Copper inventories remain elevated
Copper inventories
Source: BCA, Standard Chartered
-2.0
-1.5
-1.0
-0.5
0.0
0.51,000
1,100
1,200
1,300
1,400
1,500
1,600
1,700
1,800
1,900
Jan-12 Jan-13 Jan-14 Feb-15 Feb-16
%
US
D/O
Z
Gold Price Spot US 5-year TIPS yield (Reverse Scale)
0
10
20
30
40
50
60
70
80
90
100
Jan-12 Jan-13 Jan-14 Feb-15 Feb-16
Mn
MT

Global Market Outlook | 11 March 2016 19
Alternative strategies
We like alternative strategies as key themes – rising volatility, market dispersion, trending
markets and policy divergence – remain supportive. Long/short and macro are our preferred
sub-strategies.
Macro strategies have delivered positive absolute returns YTD, demonstrating their value in
volatile markets, while equity long/short strategies outperformed global equities. We believe this
track record strengthens the case for holding alternative strategies in what we expect to be a
year characterised by continued bouts of volatility.
The start of 2016 turned out to be a testing period for
alternative strategies, with arguably positive results.
Macro strategies were the key outperformer, delivering
positive returns YTD. Our other preferred sub-strategy, equity
long/short strategies, outperformed global equities, but failed
to deliver positive absolute returns. In our view, this YTD
performance is an illustration of the value of alternative
strategies in what we expect to be a year punctuated by
further bouts of volatility.
Key drivers unchanged, supporting our positive view on
the asset class. What we see as key drivers of alternative
strategies – rising volatility, market dispersion, trending
markets and policy divergence – largely remain in place, in
our view. We believe this, together with the strategies’ recent
performance, underscore why we continue to see alternative
strategies as a key component of a well-diversified allocation.
Temporary underperformance likely if equity market
rebound extends. Equity long/short strategies, in particular,
tend to underperform when equity markets rise sharply.
However, we expect any such underperformance to be
temporary.
Equity long/short and macro strategies remain our
preferred sub-strategies. Equity long/short is an attractive
way to gain exposure to equities in an increasingly uncertain
environment, as it not only offers largely lower volatility
relative to long-only exposure but also benefits from rising or
heightened valuation dispersion. We also see macro
strategies as a very good way of managing volatility, more of
which is likely through the year.
Environment for event-driven strategies a little more
mixed. While still-robust mergers and acquisitions activity is a
tailwind for the asset class, event-driven strategies are
vulnerable to broader market volatility. The recent experience
shows this can overwhelm the sub-strategy in the short term.
Our views on the main sub-strategies
Sub-strategy Our view
Equity long/short
Positive - Provides exposure to equities in arguably less volatile way relative to long-only
Relative value Neutral - Volatility has improved opportunity set, but liquidity is likely to be a challenge
Event driven Neutral - Strong M&A activity a positive, but strategy is vulnerable to broad market volatility
Credit Neutral - Volatility and sector stress positive for credit long/short strategies, but possible rise in defaults a risk
Macro Positive - Outperformance during recent volatility reinforces diversification value
Commodities Neutral - Continued pressure on commodity prices a risk, though an eventual (12 month) rise in oil prices may support
Insurance-linked
Negative - Insurance losses were below average in 2015, posing the risk losses could rise this year
Source: Standard Chartered
Macro strategies delivered positive returns YTD,
demonstrating their value in volatile markets.
Global Market Outlook | 11 March 2016 20
Foreign exchange
The USD likely to flatten out, but we expect modest gains against the EUR, AUD, NZD and
SGD. We do not expect the recent JPY gains to sustain.
We are neutral on Asia ex-Japan currencies, but any significant CNY devaluation poses
downside risks.
Scaling back of US and UK rate hike expectations has seen
the USD and GBP lose ground against most major peers.
‘Brexit’ concerns have also weakened sentiment on the GBP
considerably. However, we remain wary of substantial gains in
the EUR and the JPY, given increasing chances of further
unconventional monetary policy action. Worries of CNY
devaluation are likely to limit gains in most Asian currencies,
including the AUD in our view.
Short term: Refers to a horizon of less than 3 months Medium term: Refers to a time horizon of 6 to12 months
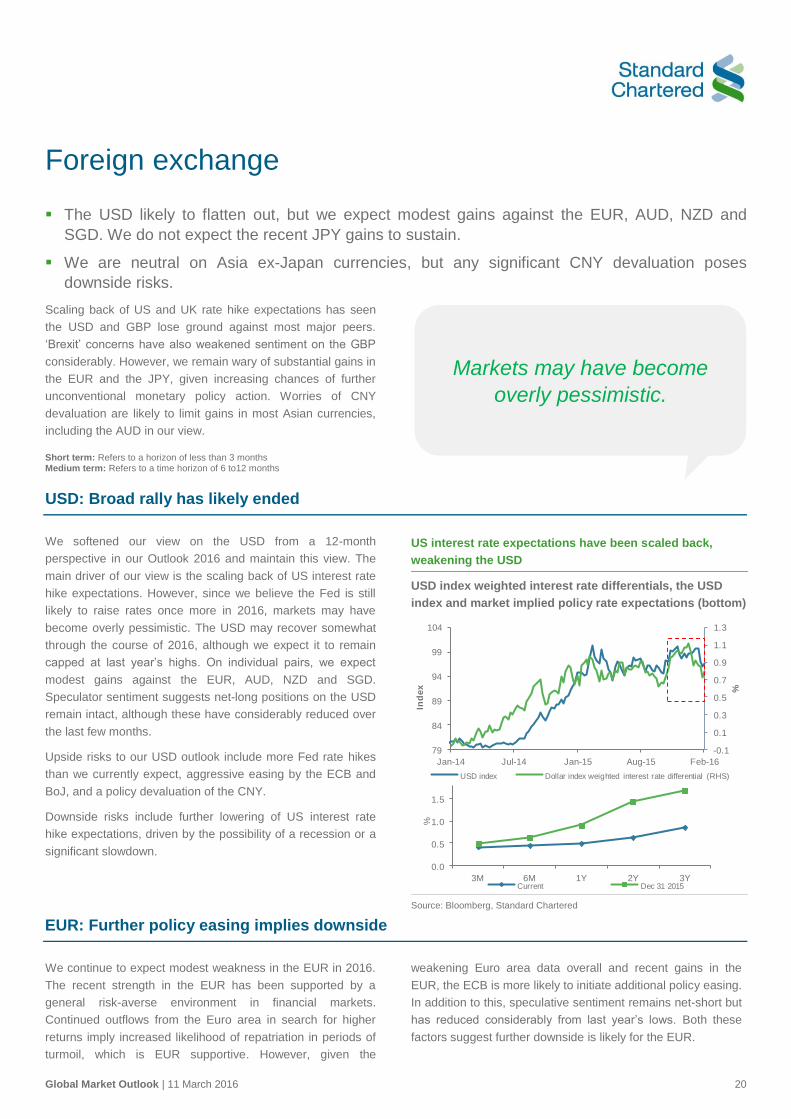
USD: Broad rally has likely ended
We softened our view on the USD from a 12-month
perspective in our Outlook 2016 and maintain this view. The
main driver of our view is the scaling back of US interest rate
hike expectations. However, since we believe the Fed is still
likely to raise rates once more in 2016, markets may have
become overly pessimistic. The USD may recover somewhat
through the course of 2016, although we expect it to remain
capped at last year’s highs. On individual pairs, we expect
modest gains against the EUR, AUD, NZD and SGD.
Speculator sentiment suggests net-long positions on the USD
remain intact, although these have considerably reduced over
the last few months.
Upside risks to our USD outlook include more Fed rate hikes
than we currently expect, aggressive easing by the ECB and
BoJ, and a policy devaluation of the CNY.
Downside risks include further lowering of US interest rate
hike expectations, driven by the possibility of a recession or a
significant slowdown.
US interest rate expectations have been scaled back,
weakening the USD
USD index weighted interest rate differentials, the USD
index and market implied policy rate expectations (bottom)
Source: Bloomberg, Standard Chartered
EUR: Further policy easing implies downside
We continue to expect modest weakness in the EUR in 2016.
The recent strength in the EUR has been supported by a
general risk-averse environment in financial markets.
Continued outflows from the Euro area in search for higher
returns imply increased likelihood of repatriation in periods of
turmoil, which is EUR supportive. However, given the
weakening Euro area data overall and recent gains in the
EUR, the ECB is more likely to initiate additional policy easing.
In addition to this, speculative sentiment remains net-short but
has reduced considerably from last year’s lows. Both these
factors suggest further downside is likely for the EUR.
-0.1
0.1
0.3
0.5
0.7
0.9
1.1
1.3
79
84
89
94
99
104
Jan-14 Jul-14 Jan-15 Aug-15 Feb-16
%
Ind
ex
USD index Dollar index weighted interest rate differential (RHS)
0.0
0.5
1.0
1.5
3M 6M 1Y 2Y 3Y
%
Current Dec 31 2015
Markets may have become
overly pessimistic.

Global Market Outlook | 11 March 2016 21
JPY: Supported by risk-off markets
We remain neutral on the JPY in 2016 and expect it to trade in
the 116-120 range in the short term. We believe the recent
JPY strength has been driven by safe-haven demand, a pick-
up in financial market volatility and concerns regarding the
effectiveness of BoJ’s policy. From this point on, we believe
the BoJ is poised to undertake further policy action, given the
significant trade-weighted appreciation in the JPY. Although
this is likely to weaken the JPY from current levels, we believe
the long-term undervaluation suggests weakness may be
limited.
A significant global slowdown or a recession would be the
main risk for a stronger JPY. We also highlight the net-long
speculative positioning is now approaching extreme levels. A
quick unwinding could result in JPY weakness.
USD/JPY has been recently following the global equity
sell-off more closely than interest rate differentials
USD/JPY two-year interest rate differentials, USD/JPY and
MSCI World Index
Source: Bloomberg, Standard Chartered
GBP: ‘Brexit’ concerns dominate short term
We remain neutral on the GBP in 2016. We believe most of
the recent weakness is due to a combination of ‘Brexit’
concerns and the BoE significantly scaling back interest-rate
expectations. On the ‘Brexit’ issue, the near-term newsflow is
likely to keep sentiment in the GBP negative in the short term,
detached from longer-term fundamentals. Furthermore, we
believe the BoE has proactively opened the room for
continued accommodative monetary policy even as economic
data has not deteriorated significantly. Continued EU
membership and earlier rate hikes are the main upside risks to
our view.
A scale-back of BoE rate hikes partially responsible for a
weaker GBP
UK-US 2-year interest rate expectations and implied BOE
policy rates (below)
Source: Bloomberg, Standard Chartered
0.30
0.50
0.70
0.90
1.10
1.30
1.50
112
117
122
%
US
D/J
PY
USD/JPY 2 year interest rate differntial USD/JPY (RHS)
111
116
121
126
131
350
370
390
410
430
Jun-15 Aug-15 Oct-15 Dec-15 Feb-16
US
D/J
PY
Ind
ex
MSCI World USD/JPY (RHS)
1.42
1.47
1.52
1.57
1.62
1.67
1.72
1.77
-0.4
-0.2
0.0
0.2
0.4
0.6
0.8
1.0
Jan-14 Jul-14 Jan-15 Aug-15 Feb-16
%
Ind
ex
GBP/USD GBP-USD 2 year interest rate differntial (RHS)
0.0
1.0
2.0
3M 6M 1Y 2Y 3Y
%
Current 31-Dec-15
Global Market Outlook | 11 March 2016 22
AUD and NZD: Remain exposed to China risks
We retain our negative outlook for the AUD and the NZD in
2016. The lack of a catalyst for a strong rebound in commodity
prices, in addition to continued exposure to CNY depreciation
risks, requires some caution. In addition to this, both the RBA
and the RBNZ have not ruled out further rate cuts. On the
positive side, domestic economic data in both countries have
somewhat improved. An additional supporting factor for the
two currencies may come from further BoJ easing, which is
likely to increase demand for Australian and New Zealand
assets. On balance, we prefer to remain bearish until a clear
bottoming of commodity prices is evident.
Prone to China devaluation risks; the AUD increasingly
correlated with the CNH
AUD/USD and USD/CNH (spot)
Source: Bloomberg, Standard Chartered
Asia ex-Japan: CNY policy key
We remain neutral overall on the Asia ex-Japan currency
space. However, the main risk to our outlook comes from a
weaker CNY. Our base case is for the USD/CNY to trade
broadly stable, but we do see increasing downside risks to this
view. The PBoC’s new policy of following a basket of
currencies implies greater volatility. Our main downside risk
scenario is that further capital outflows from China may, at
some point, compel authorities to broadly weaken the CNY.
We expect the SGD to weaken modestly through 2016.
Although not our base case, generally weaker economic data,
falling property prices and sustained deflationary pressures
may compel the MAS to further relax policy. Upside risks to
our view include a weaker-than-expected USD or further
strength in currencies of key trading partners.
6.30
6.35
6.40
6.45
6.50
6.55
6.60
6.65
6.70
6.750.68
0.69
0.70
0.71
0.72
0.73
0.74
Nov-15 Nov-15 Dec-15 Jan-16 Feb-16
US
D/C
NH
AU
D/U
SD
AUD/USD USD/CNH (REVERSE SCALE)

Global Market Outlook | 11 March 2016 23
Multi-asset investing in the current environment
As multi-asset investors consider their portfolios in the current
market environment, it is worth looking back at history to get a
sense of how the cross-asset approach has evolved since
2009. The change in trends over this period might provide
some guidance on the investment approach going forward.
Following the financial crisis in 2008, central bank liquidity
acted as a backstop for markets and supported the
performance of directional strategies – market-linked returns
in traditional asset classes within equity and fixed income.
Events in Europe, notwithstanding a balanced portfolio, would
have performed quite well over the 2009-2012 period on a
total return basis.
Trends in multi-asset investing (2009-today)
Source: Standard Chartered
The knock-on effect of central bank easing led to an
environment of depressed bond yields in traditional fixed
income. This resulted in a search for income being the primary
focus of a multi-asset investor. Between 2013 and 2015, we
highlighted the importance of multi-income-focused asset
allocation. Our focus was on diversified sources of income for
two main reasons: 1) widening the range of assets through
which to capture income and 2) managing the overall risk of
the portfolio through the introduction of non-correlated assets.
While the former saw the introduction of a much broader
range of fixed income assets, the latter objective led to the
inclusion of non-core assets (preferred stock, convertible
bonds, REITs) in the income strategy.
Looking forward, we foresee an increase in volatility perhaps,
as markets contemplate the implications of a move to the last
phase of this economic cycle. In our Outlook 2016, while we
suggested our income objective remained achievable, we
highlighted the risk of larger pullbacks as we move through
the year. The first two months have been a preview of what
might be in store for the remainder of 2016.
Playing the diversification card through a series of market-
linked (directional) strategies in equity and fixed income is
becoming more challenging. With this in mind, we advocate
income-focused investors look to substitute some of their
directional or market-linked exposure with a multi-asset
absolute-return strategy. Diversification by investing in assets
that have low correlation (relative value, hedging) to traditional
assets should help protect investors during more frequent
periods of pullbacks we might experience over the course of
the year.

Disclosure appendix This document is not research material and it has not been prepared in accordance with legal requirements designed to promote the
independence of investment research and is not subject to any prohibition on dealing ahead of the dissemination of investment
research. This document does not necessarily represent the views of every function within Standard Chartered Bank, (“SCB”)
particularly those of the Global Research function.
Standard Chartered Bank is incorporated in England with limited liability by Royal Charter 1853 Reference Number ZC18. The
Principal Office of the Company is situated in England at 1 Basinghall Avenue, London, EC2V 5DD Standard Chartered Bank is
authorised by the Prudential Regulation Authority and regulated by the Financial Conduct Authority and Prudential Regulation
Authority.
United Kingdom: Standard Chartered Bank (trading as Standard Chartered Private Bank) is an authorised financial services provider
(licence number 45747) in terms of the South African Financial Advisory and Intermediary Services Act, 2002
In Dubai International Financial Centre (“DIFC”), the attached material is circulated by Standard Chartered Bank DIFC on behalf of
the product and/or Issuer. Standard Chartered Bank DIFC is regulated by the Dubai Financial Services Authority (DFSA) and is
authorised to provide financial products and services to persons who meet the qualifying criteria of a Professional Client under the
DFSA rules. The protection and compensation rights that may generally be available to retail customers in the DIFC or other
jurisdictions will not be afforded to Professional Clients in the DIFC.
Banking activities may be carried out internationally by different Standard Chartered Bank branches, subsidiaries and affiliates
(collectively “SCB”) according to local regulatory requirements. With respect to any jurisdiction in which there is a SCB ent ity, this
document is distributed in such jurisdiction by, and is attributable to, such local SCB entity. Recipients in any jurisdiction should
contact the local SCB entity in relation to any matters arising from, or in connection with, this document. Not all products and
services are provided by all SCB entities.
This document is being distributed for general information only and it does not constitute an offer, recommendation or solicitation to
enter into any transaction or adopt any hedging, trading or investment strategy, in relation to any securities or other financial
instruments. This document is for general evaluation only, it does not take into account the specific investment objectives, financial
situation or particular needs of any particular person or class of persons and it has not been prepared for any particular person or
class of persons.
Opinions, projections and estimates are solely those of SCB at the date of this document and subject to change without notice. Past
performance is not indicative of future results and no representation or warranty is made regarding future performance. Any forecast
contained herein as to likely future movements in rates or prices or likely future events or occurrences constitutes an opinion only
and is not indicative of actual future movements in rates or prices or actual future events or occurrences (as the case may be).
This document has not and will not be registered as a prospectus in any jurisdiction and it is not authorised by any regulatory
authority under any regulations.
SCB makes no representation or warranty of any kind, express, implied or statutory regarding, but not limited to, the accuracy of this
document or the completeness of any information contained or referred to in this document. This document is distributed on the
express understanding that, whilst the information in it is believed to be reliable, it has not been independently verified by us. SCB
accepts no liability and will not be liable for any loss or damage arising directly or indirectly (including special, incidental or
consequential loss or damage) from your use of this document, howsoever arising, and including any loss, damage or expense
arising from, but not limited to, any defect, error, imperfection, fault, mistake or inaccuracy with this document, its contents or
associated services, or due to any unavailability of the document or any part thereof or any contents.
SCB, and/or a connected company, may at any time, to the extent permitted by applicable law and/or regulation, be long or short
any securities, currencies or financial instruments referred to on this document or have a material interest in any such securities or
related investment, or may be the only market maker in relation to such investments, or provide, or have provided advice,
investment banking or other services, to issuers of such investments. Accordingly, SCB, its affiliates and/or subsidiaries may have a
conflict of interest that could affect the objectivity of this document. This document must not be forwarded or otherwise made
available to any other person without the express written consent of SCB.
Copyright: Standard Chartered Bank 2016. Copyright in all materials, text, articles and information contained herein is the property
of, and may only be reproduced with permission of an authorised signatory of, Standard Chartered Bank. Copyright in materials
created by third parties and the rights under copyright of such parties are hereby acknowledged. Copyright in all other materials not
belonging to third parties and copyright in these materials as a compilation vests and shall remain at all times copyright of Standard
Chartered Bank and should not be reproduced or used except for business purposes on behalf of Standard Chartered Bank or save
with the express prior written consent of an authorised signatory of Standard Chartered Bank. All rights reserved. © Standard
Chartered Bank 2016.
THIS IS NOT A RESEARCH REPORT AND HAS NOT BEEN PRODUCED BY A RESEARCH UNIT.


![British Columbia Labour Market Outlook 2010 - 2020 · Labour Market OutlookLabour Market Outlook British Columbia Labour Market Outlook: 2010-2020 [2] B.C. Labour Market Outlook,](https://static.fdocuments.net/doc/165x107/5e167e8e481eae63a43f8127/british-columbia-labour-market-outlook-2010-2020-labour-market-outlooklabour-market.jpg)
