GLOBAL LOGISTICS: THE FUTURE IS NOW - CBRE … Investment... · GLOBAL LOGISTICS: THE FUTURE IS NOW...
37
GLOBAL LOGISTICS: THE FUTURE IS NOW 18 MAY 2016 PRESENTED BY: Doug Herzbrun, Global Head of Research Anthony Wirth, Director – Industrial Research John Thomas, Sr. Managing Director – Logistics
Transcript of GLOBAL LOGISTICS: THE FUTURE IS NOW - CBRE … Investment... · GLOBAL LOGISTICS: THE FUTURE IS NOW...

GLOBAL LOGISTICS: THE FUTURE IS NOW
18 MAY 2016
PRESENTED BY:
Doug Herzbrun, Global Head of Research
Anthony Wirth, Director – Industrial Research
John Thomas, Sr. Managing Director – Logistics

THE STRUCTURAL SHIFT BECOMES CLEAR

GLOBAL INVESTMENT SYMPOSIUM 2
E-COMMERCE IS BLURRING THE LINE
BETWEEN RETAIL AND INDUSTRIAL
0%
1%
2%
3%
4%
5%
6%
7%
8%
$0
$50.000
$100.000
$150.000
$200.000
$250.000
$300.000
$350.000
$400.000
2000 2001 2002 2003 2004 2005 2006 2007 2008 2009 2010 2011 2012 2013 2014 2015
E-C
om
merce Share
U.S. E-C
om
merce Sale
s (m
illio
ns)
Sales
E-Commerce Share
Sources: Census Bureau; Moody’s Analytics

GLOBAL INVESTMENT SYMPOSIUM 3
U.S. INDUSTRIAL DEMAND IS ROBUST
-90
-75
-60
-45
-30
-15
0
15
30
45
60
75
Q1Q2Q3Q4Q1Q2Q3Q4Q1Q2Q3Q4Q1Q2Q3Q4Q1Q2Q3Q4Q1Q2Q3Q4Q1Q2Q3Q4Q1Q2Q3Q4Q1Q2Q3Q41Q
U
.S. Industrial A
bsorption
SF (m
illio
ns)
Absorption
Long-term Average
4 Qtr Moving Average
* Long-term Average = 1980 - 2016
Sources: CBRE EA; CBRE Global Investors
2007 2008 2009 2010 2011 2012 2013 2014 2015 2016

GLOBAL INVESTMENT SYMPOSIUM 4
THE STORY’S THE SAME IN EUROPE
0%
2%
4%
6%
8%
10%
0
50
100
150
200
250
19
99
20
00
20
01
20
02
20
03
20
04
20
05
20
06
20
07
20
08
20
09
20
10
20
11
20
12
20
13
20
14
20
15
20
16
F
20
17
F
Online Sale
s Share
Western Europe O
nline Retail Sale
s (EU
R Bn.)
Internet Retailing (EUR Bn.)
Online Sales as % of total sales
Source: Euromonitor
¹ Includes Belgium, Czech Republic, Finland, France, Germany, Italy, Netherlands, Poland, Portugal, Spain, Sweden, United Kingdom

GLOBAL INVESTMENT SYMPOSIUM 5
THERE IS ROOM FOR GROWTH
13,6%
10,2%
9,2%
8,6%
7,8%
6,9% 6,5% 6,4%
4,9%
3,3%
0%
2%
4%
6%
8%
10%
12%
14%
16%
UK China US Germany Sweden Japan Poland Australia Portugal Spain
Online Retail Sale
s as %
of Total Retail Sale
s (2015)
Source: Euromonitor

GLOBAL INVESTMENT SYMPOSIUM 6
U.S. INDUSTRIAL IS AN INVESTOR DARLING
$0
$5
$10
$15
$20
$25
$30
1Q09 1Q10 1Q11 1Q12 1Q13 1Q14 1Q15 1Q16
Volum
es
$Billions
Transaction Volume ($B)
4-Qtr Average
Strong Acquisition Activity
4
5
6
7
8
9
1Q09 1Q10 1Q11 1Q12 1Q13 1Q14 1Q15 1Q16
Cap Rates (%
)
Industrial
Retail
Office
Multifamily
Comparable Yields

GLOBAL INVESTMENT SYMPOSIUM 7
CAPITAL MARKETS ARE SHIFTING
Sources: JLL, CBRE, CBRE Global Investors
3
5
7
9
11
13
15
17
Logistics Yields, %
Warsaw
Prague
Paris
Rotterdam
Hamburg
London
GLOBAL INVESTMENT SYMPOSIUM 8
TRANSACTION VOLUMES ARE RISING
Source: CBRE
0
5
10
15
20
25
2003 2004 2005 2006 2007 2008 2009 2010 2011 2012 2013 2014 2015
Europe Industrial Transaction Volum
e (Bn)

GLOBAL INVESTMENT SYMPOSIUM 9
CROSS-BORDER ONLINE SALES WILL REACH $1T BY 2020
$0
$200
$400
$600
$800
$1.000
2016 2017 2018 2019 2020
Cross-Border O
nline Sales (Bn)
Sources: Accenture, AliResearch

GLOBAL INVESTMENT SYMPOSIUM 10
KEY TRENDS ARE EVOLVING
Technology is creating value Site selection is holistic Supply chain analysis is real time

GLOBAL INVESTMENT SYMPOSIUM 11
• “Cost of Chaos”
• Not your grandfather’s 3PL
• Provide the grease
• Innovation is key
OUTSOURCED LOGISTICS IS BECOMING MORE PREVALENT

GLOBAL INVESTMENT SYMPOSIUM 12
RISKS MUST BE CONSIDERED
Cyclical
Risk
Political
Risk
Technological
Risk

OPTIMIZING THE LOGISTICS SUPPLY CHAIN

GLOBAL INVESTMENT SYMPOSIUM 14
FLOW OF GOODS TO THE CONSUMER
GLOBAL INVESTMENT SYMPOSIUM 15
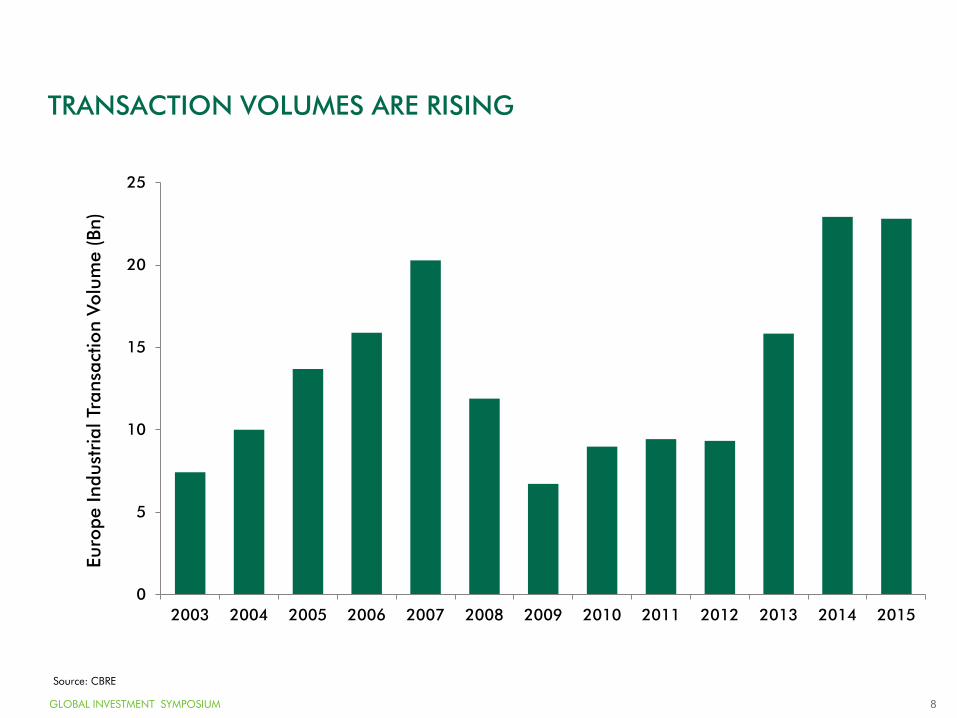
LOGISTICS COST BREAKDOWN
Sources: Establish, Inc. / Herbert W Davis and Company, Grubb & Ellis Global Logistics
50,3%
21,8%
17,3%
4,3% 6,1%
Transportation
Inventory Carry
Employees
Property
Other
50,3%
21,8%
17,3%
4,3% 6,1%
Transportation
Inventory Carry
Employees
Property
Other
(Primarily Rent)

GLOBAL INVESTMENT SYMPOSIUM 16
GLOBAL SHIPPING TRADE ROUTES
Logistics refers to the management of the flow of goods and other resources between
the point of origin and the point of consumption

GLOBAL INVESTMENT SYMPOSIUM 17
Rank Port, Country Millions of TEUs (2013)
1 Shanghai, China 34
2 Singapore, Singapore 33
3 Shenzhen, China 23
4 Hong Kong, China 22
5 Busan, South Korea 18
6 Ningbo-Zhoushan, China 17
7 Qingdao, China 16
8 Guangzhou Harbor, China 15
9 Jebel Ali, Dubai, United Arab Emirates 14
10 Tianjin, China 13
11 ROTTERDAM, NETHERLANDS 12
12 Dalian, China 11
13 Port Kelang, Malaysia 10
14 Kaohsiung, Taiwan, China 10
15 HAMBURG, GERMANY 9
16 ANTWERP, BELGIUM 9
17 Keihin Ports, Japan 8
18 Xiamen, China 8
19 Los Angeles, U.S. 8
20 Tanjung Pelepas, Malaysia 8
21 Long Beach, U.S. 7
22 Tanjung Priok, Jakarta, Indonesia 7
23 Laem Chabang, Thailand 6
24 Ho Chi Minh, Vietnam 6
25 BREMEN/BREMERHAVEN, GERMANY 6
WORLD PORT STATS

GLOBAL INVESTMENT SYMPOSIUM 18
• 97 ultra-large container vessels are
on order:
– Capable of handling between
18,000 and 20,000 TEUs
– Scheduled for delivery by mid-
2019
• 36 in 2015
• 12 in 2016
• 22 in 2017
• 22 in 2018
• 5 in 2019
• Fuel Consumption for the 15,000+
TEU vessels is expected to be 50%
below the industry average
– This is the driver behind the
demand for the big ships
MEGA SHIPS ARE CHANGING THE LANDSCAPE
www.imsw.com
Foreign Trade Zone, Logistics and Supply Chain Consulting

GLOBAL INVESTMENT SYMPOSIUM 19
• Bigger ships mean less vessels
• Less vessel calls mean less
ports visited by the major
carriers
• Ultra-large ships must be
matched on the land side with:
– Adequate water-depth
– Port infrastructure
• Cranes
• Labor
• Space
– Distribution channels
• Rail
• Highways
• Trucking
LARGE SHIPS IMPACT ON PORTS 2015-2020

GLOBAL INVESTMENT SYMPOSIUM 20
INLAND TRANSPORT

GLOBAL INVESTMENT SYMPOSIUM 21
Pros
• About twice as fast as sea route
• More reliable service
• 20% of the cost of airfreight
• Chinese and German
governments are advocates
Cons
• Several customs stops
• Different rail gauges
• 2.5 times the cost of sea route
• Smaller load capacity (about
100 containers/train)
Observations
• Higher cost items such as
electronics and automobile
parts work best
• Still a new service, so with the
government backing, will
improve overtime
• Central China to CEE saves
over 2,000 km of distance
CHINESE SILK ROAD – CONTAINER TRAIN ALTERNATIVE

GLOBAL INVESTMENT SYMPOSIUM 22
Algeciras
24 days
€1,000
Top 20 Major Seaports
Major Inland Ports
Other Seaports
MAJOR PORTS
Shanghai
Valencia
29 days
€1,000
Barcelona
31 days
€1,000
Marseille
33 days
€1,000
Genoa
29 days
€835
Trieste
32 days
€835
Piraeus
21 days
€1,000
Aliaga
23 days
€1,000
Botas
22 days
€1,000
Izmit
24 days
€1,000
Ambarli
25 days
€1,000
Novorossiysk
27days
€835
Moscow
39 days
€880
Dusseldorf
30 days
€1,550
Paris
29 days
€1,500
Hamburg
32 days
€835
St Petersburg
38 days
€310
Bergen
39 days
€1,000
Bremerhaven
36 days
€835
Amsterdam
41 days
€1,000
Rotterdam
29 days
€1,000
Antwerp 31 days
€1,000
Le Havre
28 days
€1,000
Liege
30 days
€1,365
Grimsby
34 days
€1,000
Felixstowe
29 days
€1,000
London
36 days
€1,000
Source: SeaRates.com. Cost includes ocean freight cost only for 2TEU container. Inland Ports
include road haul costs from nearest port..
GLOBAL INVESTMENT SYMPOSIUM 23
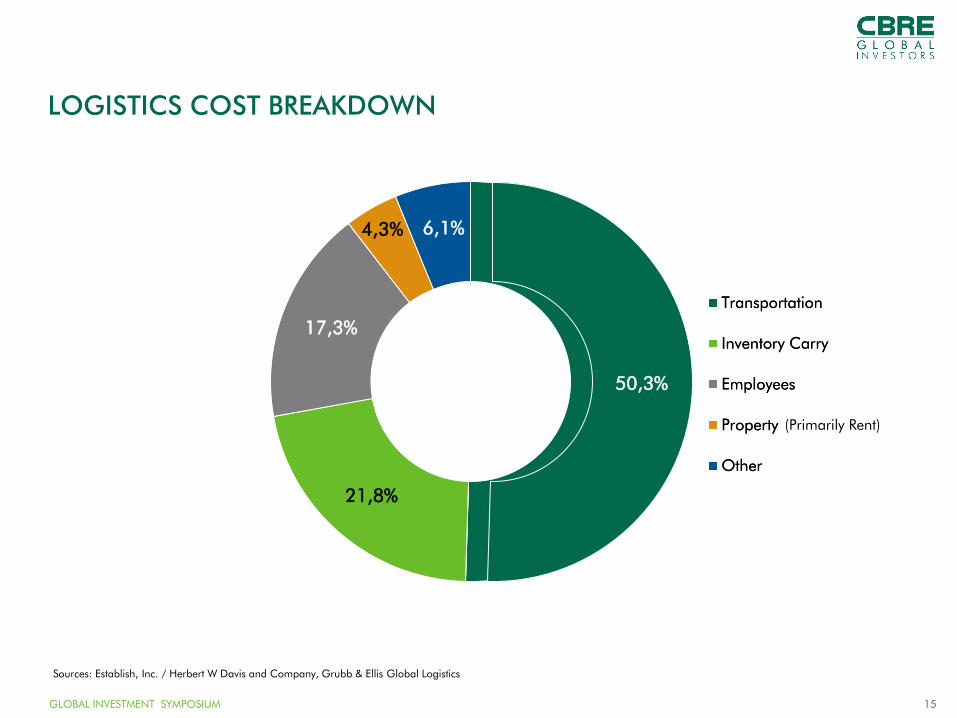
LOGISTICS COST BREAKDOWN
Sources: Establish, Inc. / Herbert W Davis and Company, Grubb & Ellis Global Logistics
50,3%
21,8%
17,3%
4,3% 6,1%
Transportation
Inventory Carry
Employees
Property
Other
50,3%
21,8%
17,3%
4,3% 6,1%
Transportation
Inventory Carry
Employees
Property
Other
(Primarily Rent)

GLOBAL INVESTMENT SYMPOSIUM 24
Today’s Integrated Logistics Solutions had their beginnings as local specialists in practices such as
dedicated trucking, warehousing operations, and freight forwarding.
EVOLUTION OF LOGISTICS
Integrated Broad Services
1970s
Local services in specific
transportation mode
• Warehouse operators
• Trucking companies
• Freight Forwarders
Local Specialists
Customer Centric
Current Era
• Lead Logistics Providers (4PL)
• Integrated in customer’s value
chain
Globalization/Integration
• Consulting services
• Global coverage for customers
across transportation modes
Fragmented Narrow
Service Offering
1990s

GLOBAL INVESTMENT SYMPOSIUM 25
From real estate to solutions design and operations we provide our customers with the expertise
required to manage & grow their business
HOLISTIC SOLUTIONS FOR CUSTOMERS
Customer
Solution
Real
Estate
Solutions
Design
In-House
Experts
• Network design
• Facility design, engineering and
simulation
• Transportation design and
optimization
• Expertise in development
• Customer focused suite of real estate services
• Exclusively focused on logistics related real
estate solutions
• Operational expertise
• Tax credits & incentives
• Legal & licensing

GLOBAL INVESTMENT SYMPOSIUM 26
LOGISTICS COST BREAKDOWN
Sources: Establish, Inc. / Herbert W Davis and Company, Grubb & Ellis Global Logistics
50,3%
21,8%
17,3%
4,3% 6,1%
Transportation
Inventory Carry
Employees
Property
Other
50,3%
21,8%
17,3%
4,3% 6,1%
Transportation
Inventory Carry
Employees
Property
Other
(Primarily Rent)

GLOBAL INVESTMENT SYMPOSIUM 27
COMMON EUROPEAN LOGISTICS FACILITY
GLOBAL INVESTMENT SYMPOSIUM 28
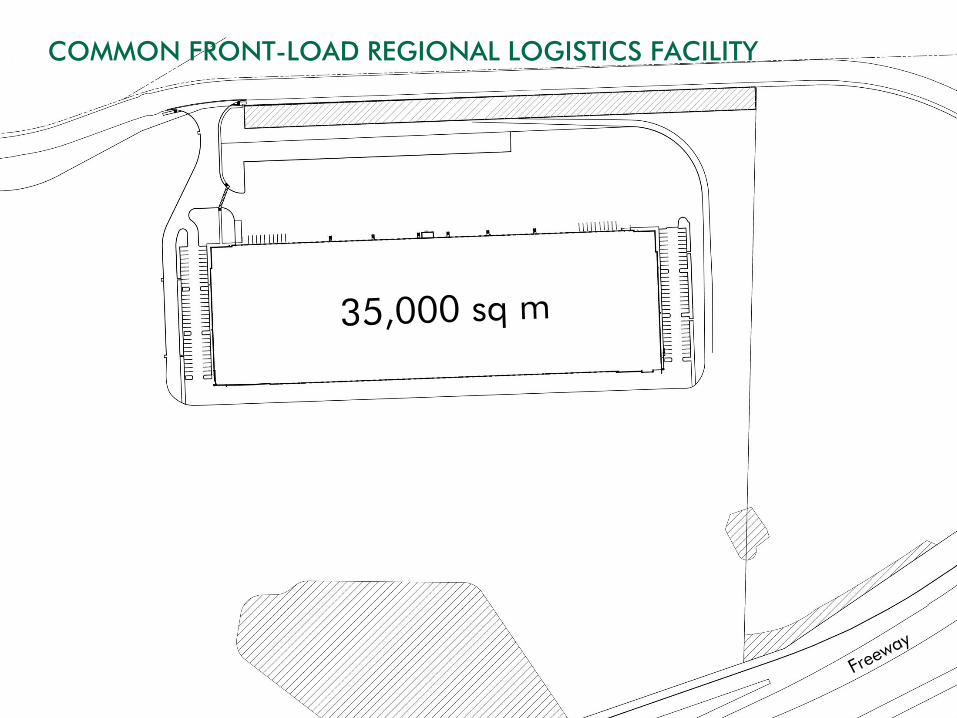
COMMON FRONT-LOAD REGIONAL LOGISTICS FACILITY

GLOBAL INVESTMENT SYMPOSIUM 29
MODERN REGIONAL LOGISTICS FACILITY

GLOBAL INVESTMENT SYMPOSIUM 30
The Last Mile Opportunity
GLOBAL INVESTMENT SYMPOSIUM 31
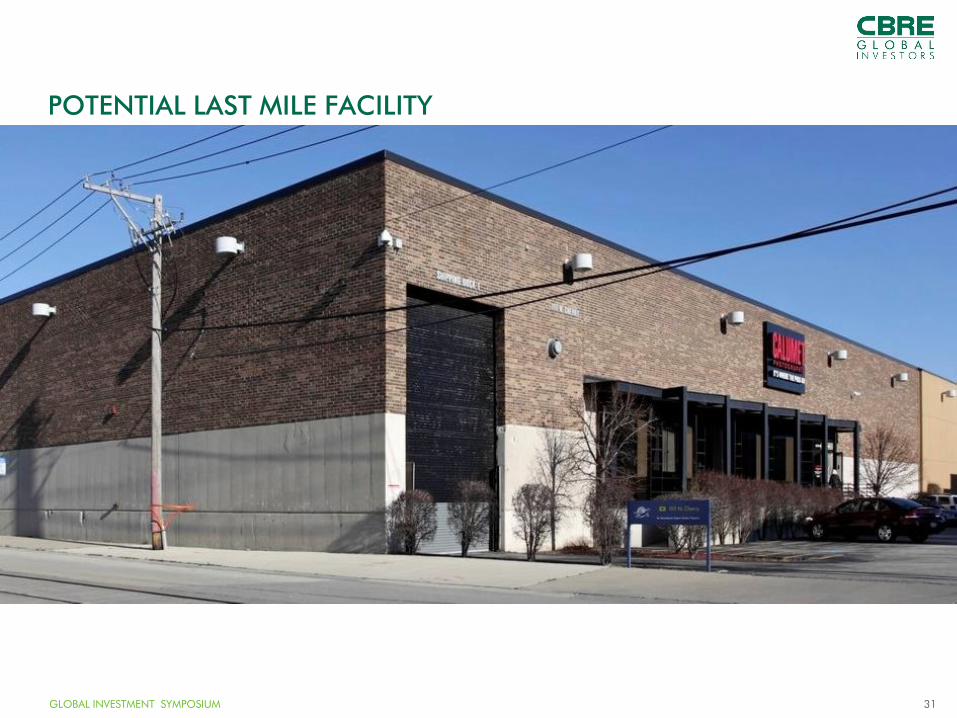
POTENTIAL LAST MILE FACILITY
GLOBAL INVESTMENT SYMPOSIUM 32
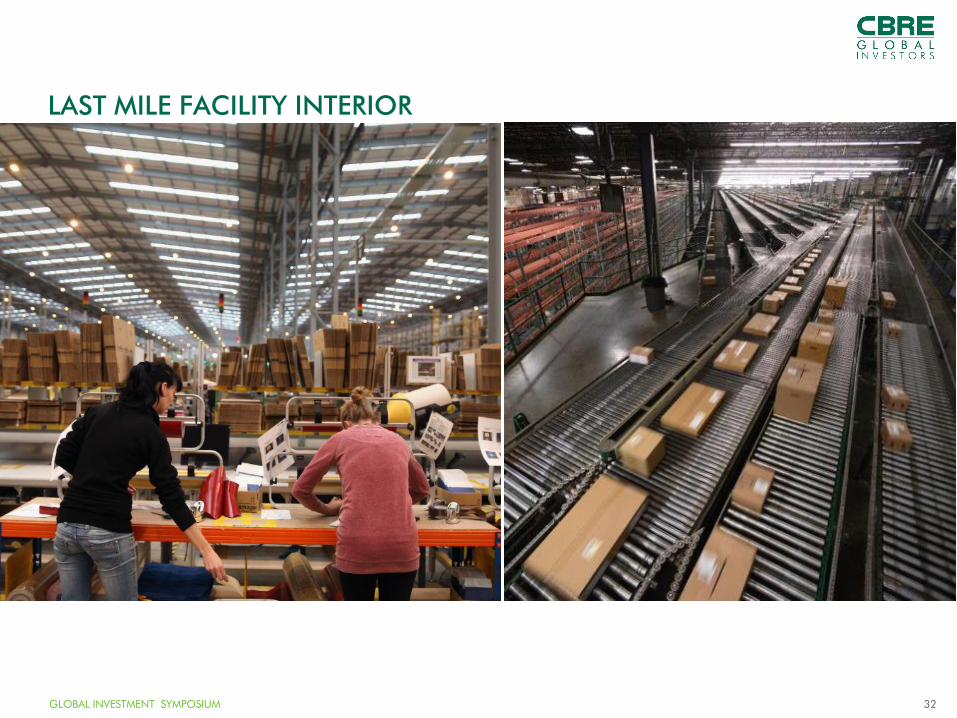
LAST MILE FACILITY INTERIOR

GLOBAL INVESTMENT SYMPOSIUM 33
MODERN LAST MILE CENTER

GLOBAL INVESTMENT SYMPOSIUM 34
“Others have seen
what is and asked why.
I have seen what could
be and asked why not.”
– Pablo Picasso

GLOBAL INVESTMENT SYMPOSIUM 35
• Logistics is the management of the flow of goods and other resources
between the point of origin and the point of consumption
• Efficiency drives logistics tenant demand; location and capabilities of the
facility far more important than rental price
• Last mile is the newest opportunity, but it requires imagination and vision
to execute
KEY TAKEAWAYS

GLOBAL INVESTMENT SYMPOSIUM 36
SPECIAL THANKS