Peak minerals & resource sustainability: a cross commodity analysis

Global Commodity Chain Sustainability Analysis: Explanations and Examples
Prepared by: Jason Potts, IISD
for the Planning Meeting of the Task Force on China’s Sustainable Development and Global
Markets 1.0 Introduction This note has been prepared as a complement to the paper Global Commodity Chain Sustainability Analysis: An Analytic Framework for Assessing Ecological Impacts of Commodity Supply Chains and Appropriate Policy Responses and is designed to provide a more detailed explanation and examples for application of the GCCSA methodology (See Appendix 6). 2.0 Rationale for the GCCSA The environmental impacts of human activity are fundamentally the result of individual decisions made in response to existing market and policy frameworks. Over the course of the past several decades trends in the global marketplace have contributed to a growing rationale and opportunity for managing environmental impacts of global product chains including: • Growth in international trade has increased the role of inter-firm governance and
coordination along international supply chains • Growing levels of market concentration at specific stages of global supply chains
has established clear lines of decision making authority in supply chain governance • Public awareness of shared responsibilities for global environmental challenges and
the importance of coordinating sustainable production and consumption has grown to unprecedented levels through policy and sectoral initiatives linked to the Agenda 21 process
• Increased international trade in goods has solidified growing awareness of environmental impacts of production and consumption through improved communication and awareness of environmental impacts of actions along international supply chains

These forces point towards the growing significance of global supply chains in determining the environmental impacts of international economic activity. They also suggest a corresponding growth in the potential for using such supply chains as instruments for leveraging change for improved sustainability. One of the underlying promises of GCCSA is that by identifying the distribution of decision making authority across global supply chains, it will be possible to identify key leverage points for stimulating changes in private behaviour thereby enabling more effective policy intervention. The GCCSA approach provides a unique opportunity for linking public and private actions through the common objective of sustainability for the entire supply chain. As such GCCSA paints a landscape which has the potential to not only improve policy efficiency, but which can also operate as a framework for empowering individuals and institutions in the promotion of improved sustainability outcomes. In Global Commodity Chain Sustainability Analysis: An Analytic Framework for Assessing Ecological Impacts of Commodity Supply Chains and Appropriate Policy Responses we outlined the basic characteristics of a GCCSA. The core steps of a GCCSA include an analysis of the:1
1. Supply Chain Framework (Steps in the Supply Chain) 2. Supply and Demand (Trade Flows) 3. Environmental Impacts along the Supply Chain 4. Social Impacts along the Supply Chain 5. International and National Policy Frameworks 6. Supply Chain Structure (Power Relationships Along the Supply Chain) 7. Policy Analysis
Below we consider each of these stages of the GCCSA in more detail in an effort to provide researchers with more explicit guidance in the performance of GCCSA. 3.0 Explanatory Notes for conducting GCCSA
3.1 Supply Chain Framework Objective: To provide a basic overview of the product and supply chain in question
1. definition of the supply chain
Although the notion of global supply chains is gaining increased acceptance and saliency through growing international trade, the concept nevertheless remains an
1 Note : In our overview of he GCCSA methodology we list five elements to a GCCSA. In this analysis we have added a fifth element « Supply Chain Framework » (correspoding to “input-output structure” and “territory” variables under a commodity chain analysis approach).which provides the basic parameters for setting the stage of the investigation. We have also altered the order placing the policy framework analysis following the first three stages of the analysis.

abstraction. The processes giving rise to any given product involve a wide variety of other products which in turn participate in their own respective product chains. Similarly, any given primary commodity can find its final form a vast array of other manufactured products making it difficult to analyze the impacts of the commodity at its final point of consumption. The complexities of actual supply chains, makes it important to define the breadth and scope of any given supply chain prior to undertaking further analysis. Some relevant variables for defining the size and scope of any given supply chain include:
• product definition: what is the nature of the product under consideration? Is it a primary commodity or a manufactured product?
• geographic definition: does the analysis look at all geographic sources and destinations along a given product’s supply chain or does it focus on supply chains as they relate to a specific country or geographic region?
• length of the supply chain cycle: does the analysis apply to the product from the development of all of its constituent parts, a limited set of its constituent parts or after the point when the full set of constituent parts come together in the form of a manufactured or processed product?
2. identification of supply chain stages
The sustainability impacts of any given supply chain are directly dependent upon the impacts of individual actions undertaken along the chain. A general description of the basic processes and actions undertaken over the life of the product is the essential starting point for determining supply chain impacts. Generally a large number processes will occur along the supply chain and some degree of prioritization in the identification of relevant or “key” supply chain stages with respect to the social and environmental analysis will need to be determined. At this stage, the use of flow chart diagrams provides a useful tool for developing a conceptual understanding of the relationships between different supply chain stages but a more detailed narrative will also be essential to setting the framework for the impacts analysis. Appendix 1 provides an example of a description of the supply chain stages for palm oil production.
Primary Research Resources: Industry and market analysis reports
3.2 Supply and Demand Objective: To provide a snapshot of actual and expected supply, demand and the relevant importance of specific sources of production and consumption with respect to the target country. The overview of supply and demand statistics provides the quickest general indication of existing geographic importance of social and environmental impacts resulting from supply chain activity. An identification of market trends, on the other hand, provides a

prima facie prediction of where future social and environmental impacts are likely to be felt. Market statistics at both the national and international levels are therefore a critical element of a GCCSA. For international trade statistics, comtrade (http://unstats.un.org/unsd/comtrade/) offers one of the most robust sources of trade data available. Care needs to be taken to compile data which covers the full breadth of the identified supply chain however when choosing the relevant HS codes. The same HS codes should be used across different statistics in order to maximize comparability. For national trade statistics, local databases may provide more up-to-date information than comtrade and therefore may be preferable however, comtrade can perform the task well in most circumstances. Most GCCSAs, due to resource constraints, will not be able to cover the full range of countries involved in both supplying and consuming a given product. As a result more strategic geographic applications of the GCCSA can be expected as a norm. When this is the case, country specific trade flow statistics will play an important role in determining the relative importance of specific countries with respect to specific product chains. A determination of geographic trade flows is relevant to determining both the geographic distribution of sustainability impacts and the potential roles of specific stakeholders (based on their importance in identified trading relationships) in managing change for sustainable development. The following list provides a preliminary indication of some key questions which can be expected to form the core of the supply and demand analysis relevant to a GCCSA using China as the focal point of concern in the analysis:
• Global production levels • Total amount of Chinese imports • Total amount of Chinese exports • Top five exporters of product to China • Top five importers of product from China • Top five countries to whom China is a major buyer • The proportion of national trade levels linked to trade with China for top five
import and export countries • Estimated quantities of illegal trade • Actual and expected market drivers at different stages of the supply chain • Expected market trends at the global and national levels
Appendix 2 provides an example in table format of partial trade flows for the coniferous lumber sector. A complete analysis will complement a table format with a narrative description of supply chain statistics and trends internationally and nationally as they relate to the target country. The analysis should provide statistics with respect to the above parameters for at least the past decade in order to provide an indication of market trends.
Primary Research Resources: Comtrade; national trade databases; market analysis reports; GTAP and other (pre-existing) modelling research
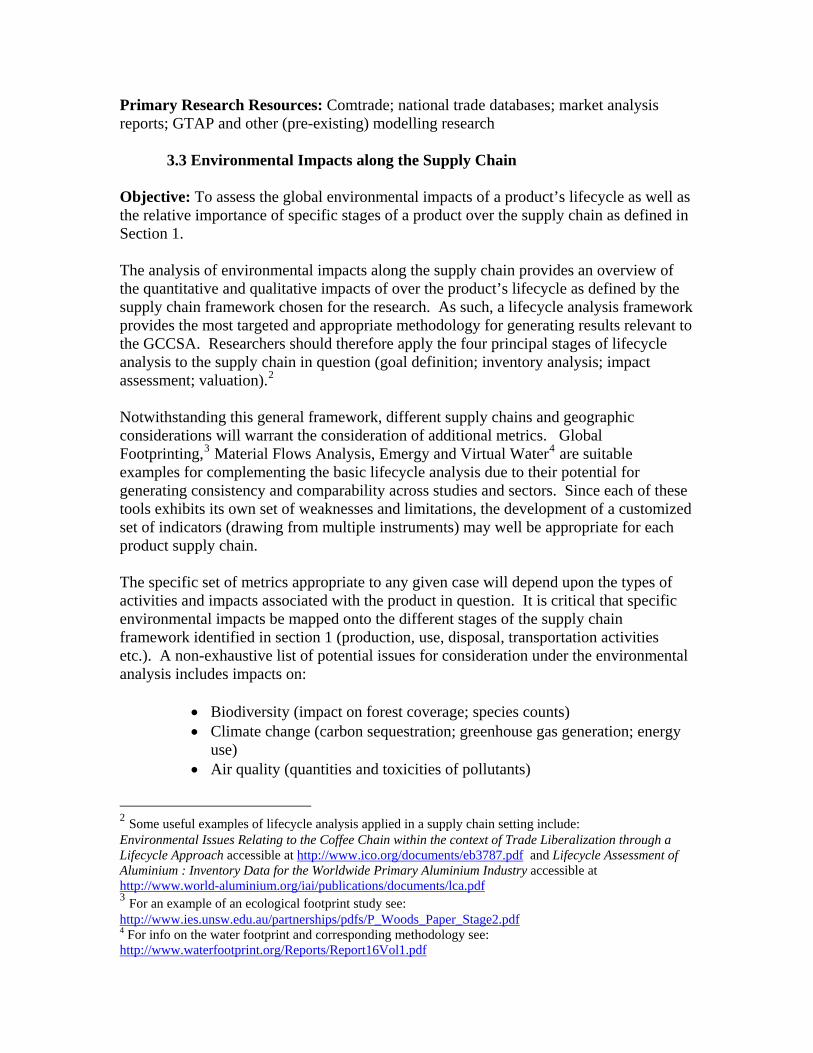
3.3 Environmental Impacts along the Supply Chain
Objective: To assess the global environmental impacts of a product’s lifecycle as well as the relative importance of specific stages of a product over the supply chain as defined in Section 1. The analysis of environmental impacts along the supply chain provides an overview of the quantitative and qualitative impacts of over the product’s lifecycle as defined by the supply chain framework chosen for the research. As such, a lifecycle analysis framework provides the most targeted and appropriate methodology for generating results relevant to the GCCSA. Researchers should therefore apply the four principal stages of lifecycle analysis to the supply chain in question (goal definition; inventory analysis; impact assessment; valuation).2 Notwithstanding this general framework, different supply chains and geographic considerations will warrant the consideration of additional metrics. Global Footprinting,3 Material Flows Analysis, Emergy and Virtual Water4 are suitable examples for complementing the basic lifecycle analysis due to their potential for generating consistency and comparability across studies and sectors. Since each of ttools exhibits its own set of weaknesses and limitations, the development of a customizedset of indicators (drawing from multiple instruments) may well be appropriate for eaproduct supply chain.
hese
ch
The specific set of metrics appropriate to any given case will depend upon the types of activities and impacts associated with the product in question. It is critical that specific environmental impacts be mapped onto the different stages of the supply chain framework identified in section 1 (production, use, disposal, transportation activities etc.). A non-exhaustive list of potential issues for consideration under the environmental analysis includes impacts on:
• Biodiversity (impact on forest coverage; species counts) • Climate change (carbon sequestration; greenhouse gas generation; energy
use) • Air quality (quantities and toxicities of pollutants)
2 Some useful examples of lifecycle analysis applied in a supply chain setting include: Environmental Issues Relating to the Coffee Chain within the context of Trade Liberalization through a Lifecycle Approach accessible at http://www.ico.org/documents/eb3787.pdf and Lifecycle Assessment of Aluminium : Inventory Data for the Worldwide Primary Aluminium Industry accessible at http://www.world-aluminium.org/iai/publications/documents/lca.pdf 3 For an example of an ecological footprint study see: http://www.ies.unsw.edu.au/partnerships/pdfs/P_Woods_Paper_Stage2.pdf 4 For info on the water footprint and corresponding methodology see: http://www.waterfootprint.org/Reports/Report16Vol1.pdf

• Land use and quality (area used, erosion, soil pollution) • Water quality and use (biological oxygen demand; pollutants; acidification;
irrigation volumes) • Ozone Depletion (specific pollutants) • Etc.
The importance and relevance of any given indicator will be a function of the manner and location in which the impacts are present in the given supply chain. Special attention should be paid to local and regional context with a view to identifying acute environmental challenges in the core countries of analysis. Appendix 3 provides an example of one possible means of representing environmental impacts along the supply chain from a material flows perspective. Primary Research Resources: Lifecycle analysis and databases, environmental literature review, government regulators, primary resources (companies and associations)
3.4 Social Impacts Objective: to measure the social impacts and issues of the supply chain Social sustainability is a central pillar of sustainable development and therefore needs to be considered as part of an overall supply chain sustainability analysis. Because the definition of social “goods” and “bads” varies according to cultural history and context, and because social conditions themselves are not always amenable to quantitative measurement, it may be either inappropriate or impossible to reach positive conclusions with respect to social impacts. Notwithstanding the inherent difficulties in measuring social impacts, over the course of the past decade, the international community has found widespread agreement on social matters related to “core” labour standards which can be considered to serve as something of a proxy for universally shared economic goods. These issues should therefore form the basis for consideration under the social pillar. Key variables for consideration in this analysis include:
• job creation (vs. previous or alternative occupations) • wages • benefits • working hours • discrimination • juvenile and migratory workers • existence of strucutres for association and collective bargaining • occupational safety • community identity and governance • wealth distribution • access to drinking water

While there is a close link between social and economic performance, care should be taken not to consider economic sustainability as a proxy for social sustainability. Economic considerations form a key portion of the policy analysis section below. Primary Research Resources: Literature and press review; interviews.
3.5 Supply Chain Governance
Objective: to identify the distribution of market power and decision making authority across the supply chain and across specific supply chain actors The analysis of the governance structure of the market provides a unique point of entry for the GCCSA in the formation of strategies for change and policy recommendations. Drawing from Global Commodity Chain Analysis and Value Chain Analysis approaches,5 this section of the research should focus on two specific elements of the supply chain: 1. Supply Chain Infrastructure: A description of the players participating in and/or influencing decision-making along the supply chain. Note that this will typically be larger than the group of players directly involved in the basic processes defining the supply chain (eg. supply chain stages) as per Section 3.1 above as it also includes financiers, futures markets, traders etc. This portion of the analysis should also identify networks, associations and other group decision making processes along the supply chain including voluntary initiatives led by stakeholders in the sector. 2. Supply Chain Governance: A description of where the distribution of decision making authority lies with respect to: 1. the supply chain as a whole and 2. to core social and environmental impacts identified in Section 3.3/3.4 above. Relevant indicators in assessing decision making authority include:
• Concentration ratios (and/or relevant market shares of specific companies) for purchasing and sales at specific stages along the supply chain
• Evidence of group decision making along the supply chain • Rent capture along the supply chain (for specific “groups” of players along
the supply chain (eg. “traders”)). • Wages along the supply chain
5 See for example “A Handbook for Value Chain Research” at http://www.ids.ac.uk/ids/global/pdfs/VchNov01.pdf or other works at http://www.yale.edu/ccr/gereffi.doc. See also: “Standards and Sustainability in the Coffee Sector: A Global Value Chain Approach” at http://www.iisd.org/publications/pub.aspx?id=652
• Evidence of leaders in standards setting and other governance initiatives (do players occupying a specific role of the supply chain establish rules for other players along the supply chain?)
• Corporate ownership/investment ownership • Processes used for price formation
Primary Research Resources: market analysis reports; global commodity chain literature; value chain literature; interviews with sector experts and associations.
3.6 Policy Framework
Objective: to identify the legal framework governing production, trade and consumption of the product under consideration. This section of the analysis sets forth existing policies at the national and international levels relevant to the product in question. The analysis should include:
• Public regulatory measures • Public market-based measures such as fiscal incentives and other voluntary
measures promulgated by intergovernmental, national (and sub-national where relevant) public authorities
• Private codes, standards and other incentive systems promulgated by private stakeholders
The overview should distinguish between regulatory and market-based mechanisms. Any clear evidence with respect to the impacts of any given policy is also relevant information to the research. Primary Research Methods: Literature review; Legal research, Interviews with industry associations
3.7 Policy Analysis and Recommendations Objective: to provide sound policy recommendations for improving the sustainability impacts of the product supply chains under consideration. The policy analysis will draw from the sustainability insights derived from the social and environmental impact analysis and will be aimed at developing recommendations both for the Chinese government and larger international community in its own interactions with the global commodity chains of which China is a part. Relevant considerations in developing policy recommendations include: 1. Effectiveness : the expected ability of the given policy recommendation to achive a specific social or environmental objective

2. Efficiency: whether or not the proposed instrument promotes overall economic efficiency (is it prone to generating market distortions); whether or not the proposed instrument is cost-effective 3. Administration and compliance costs: the administrative and managerial cost burden imposed on the administrative bodies responsible for applying the instrument 4. Distributional impacts : potential impacts on trade flows and revenue distribution along the supply chain 5. Stability : potential impacts on economic stability 6. Policy coherence : coherence with existing national and international policy objectives
References Ecotek UK (2000). Ecological Footprinting, European Parliament, Brussels. Gereffi, G. (1994). ‘The Organization of Buyer-Driven Global Commodity Chains: How US Retailers Shape Overseas Production Networks.’ In G. Gereffi and M. Korzeniewicz (eds.), Commodity Chains and Global Capitalism. Westport: Greenwood Press. Gibbon, P (2000). Global Commodity Chains and Economic Upgrading in Less Developed Countries, Centre for Development Research, Copenhagen. IISD/Scott Wilson (forthcoming) An Evidence Base for Sustainable Consumption and Production Across select Commodities (Defra, UK) International Aluminium Institute (2003) Lifecycle Assessment of Aluminium : Inventory Data for the Worldwide Primary Aluminium Industry (Germany, IAI) Ponte, S (2002). Standards, Trade and Equity: Lessons from the Specialty Coffee Industry, Centre for Development Research, Copenhagen. Teoh, Cheng Hai (2002) The Malaysian Palm Oil Industry: From Seed to Frying Pan (Switzerland, WWF) Raikes, Phillip; Michael Friss Jensen, Stefano Ponte (2000). Global Commodity Chain Analysis and the French Filiere Approach: Comparison and Critique, Centre for Development Studies, Copenhagen. Vellinga, P. [ed.](1996) The Environment - A Multidisciplinary Concern: Substance Flows through Environment and Society, Institute for Environmental Studies, Vrije Universiteit, Amsterdam. Von Moltke, Konrad and Onno Kuik (1998). Global Product Chains and the Environment, Institute for Environment Studies, Amsterdam. Vorley, Bill (2004) Food Inc : Corporate Concetration from Farmer to Consumer (UK, UK Food Group) Wackernagel, Mathis (2001). Advancing Sustainable Resource Management: Using Ecological Footprint Analysis for Problem Formulation, Policy Development and Communication, Redefining Progress, Oakland.

Appendix 1: Example of Supply Chain Stage Description for Sugar Cane Supply Chain Framework Diagram Example taken from IISD/Scott Wilson GCCSA analysis project for DEFRA and from WWF “From Seed to Frying Pan: The Malaysian Oil Palm Sector”
Palm Supply Chain
Pre-Cultivation
Supply Chain Stages for Palm Oil Nursery Establishment Nursery Establishment commences as soon as the land is found to be suitable and approved by the respective agencies for development to proceed. Good quality DxP seedlings are raised in a polybag nursery for about 12 months. Good nursery practices such as adequate watering, manuring and culling of seedlings with undesirable characteristics are essential for the production of vigorous planting materials. A culling rate of up to 25% is commonly practised in well managed nurseries. Site Preparation include land survey, clearing of existing vegetation, establishment of a road and field drainage system, soil conservation measures such as terracing,
Cultivation
Transport As Palm Kernel As Palm and Palm Kernel Oil As Palm Meal
Consumption
Manufacturing
Processing
Animal Feed
Food Products
Food Consumption
Crop Production and Harvesting
Plantation Establishment
Kernel Crushing
Feed Lot
Cosmetics
Home Use Home and Industrial Use
Chemical Products (including fuel)
In Country Milling
Crude Oil Refining

conservation bunds and silt pits and sowing of leguminous cover crops. Burning and non-burning techniques are used to clear forest areas. Field Establishment activities are lining, holing and planting of polybag oil palm seedlings at density of 136 to 148 palms per ha, depending on the soil type. It is important that effort is made to obtain full ground coverage by leguminous cover crops such as Pueraria javanica and Calopogonium caeruleum to minimise soil loss through runoff as well as to improve the soil properties through nitrogen fixation. Field Maintenance and Harvesting Field Maintenance operations include weeding, water management, pruning, pest and disease management and manuring. Integrated pest management involving a mix of cultural, physical, chemical and biological control approaches to minimise crop losses to pests is commonly adopted in plantations. Examples of biological control measures applied include the use of baculovirus and Metarhizium anisopliae to control the rhinoceros beetle (Oryctes rhinoceros), control of leaf-eating bagworms and nettle caterpillars by their natural predators and parasitoids and the use of barn owls (Tyto alba) as the biological agent to control rats. As the cost of fertilisers is the major component of field upkeep expenditure, plantation companies generally undertake soil and foliar analyses of individual fields regularly to assess their nutritional status and determine the appropriate types and quantities of fertilisers required for optimal palm development and production. Harvesting of FFB commences between 24 to 30 months after field planting, depending on the soil type and agronomic and management inputs. Harvesting is done manually, using a chisel in young palms and a sickle mounted on a bamboo or aluminum pole in taller palms. Various systems for in-field collection of FFB and transportation to the palm oil mill. In view of increasing shortage of workers as well as the need to increase worker productivity, mechanised approaches have been adopted by plantations, an example being the tractor-mounted ‘grabber’. Replanting. The economic cycle of the oil palm is about 25 years, after which the old stand is replanted. The zero burning technique of replanting is now common commercial practice. However, in some situations, plantations consider underplanting, whereby new seedlings are planted under the old palms which are thinned out progressively to allow the development of the new stand. Processing
Milling After harvesting, it is important that the fresh fruit bunches (FFB) are processed as soon as possible to prevent a rapid rise in free fatty acids (FFA) which could adversely affect the quality of the crude palm oil (CPO). Palm oil mills are generally located in the plantations to facilitate timely transportation and effective processing of FFB.

The palm oil milling process involves the physical extraction of palm products namely, crude palm oil and palm kernel from the FFB. The process begins with sterilization of the FFB. The fruit bunches are steamed in pressurised vessels up to 3 bars to arrest the formation of free fatty acids and prepare the fruits for subsequent sub-processes. The sterilised bunches are then stripped of the fruitlets in a rotating drum thresher. The stripped bunches or empty fruit bunches (EFB) are transported to the plantation for mulching while the fruitlets are conveyed to the press digesters. In the digesters, the fruits are heated using live steam and continuously stirred to loosen the oil-bearing mesocarp from the nuts as well as to break open the oil cells present in the mesocarp. The digested mash is then pressed, extracting the oil by means of screw presses. The press cake is then conveyed to the kernel plant where the kernels are recovered. The oil from the press is diluted and pumped to vertical clarifier tanks. The clarified oil is then fed to purifiers to remove dirt and moisture before being dried further in the vacuum drier. The clean and dry oil is ready for storage and dispatch. The sludge from the clarifier sediment is fed into bowl centrifuges for further oil recovery. The recovered oil is recycled to the clarifiers while the water/sludge mixture which is referred to as Palm Oil Mill Effluent (POME) is treated in the effluent treatment plant.(ETP). The press cake is conveyed to the depericarper where the fibre and nuts are separated. Fibre is burned as fuel in the boiler to generate steam. The nuts are cracked and the shell and kernel are separated by means of a winnower and hydro-cyclone. The clean kernels are dried prior to storage. The diagram below outlines the different stages of the milling process.

Refining The refining process removes free fatty acids, phosphatides, odouriferous matter, water as well as impurities such as dirt and traces of metals from the CPO; the objective being to produce an edible oil of consistent quality that meets industry’s standards and satisfies customer requirements, moisture and impurities, Iodine Value, Peroxide Value, melting point, colour and flavour. The refined oil must tasteless and have a bland flavour. CPO is processed by either physical or chemical refining to produce either refined, bleached and deodourised palm oil (RBDPO) or neutralised, bleached and deodourised palm oil (NBDPO). These are subjected to fractionation to obtain the respective liquid olein fraction and the solid stearin fraction. Of the two processes, physical refining is the predominant approach adopted by the refineries as it is simpler, less capital intensive, more efficient and produces a lower effluent load. Physical or steam refining begins with degumming when the CPO is treated with food grade phosphoric acid or citric acid to remove natural gums in the form of phosphatides , followed by bleaching with activated earth (Fuller’s Earth) under vacuum to remove colouring matters as well as to adsorb any metal ions. The treated oil is then heated to 240 C - 260 C under 2- 6 mm Hg (MEOMA, 2002) for simultaneous deacidification and

deodorisation. The FFA is stripped off by live steam and is recovered together with the entrained oil is as palm fatty acid distillate. The steam distillation process also removes odours and off-flavors from the CPO (‘Deodorisation’). The oil is then cooled to 55°C before polishing. In the chemical refining process, the FFA present in CPO is removed by neutralisation with caustic soda (sodium hydroxide), the concentration of the latter being dependent on the quality of the CPO feedstock. This chemical reaction produces neutralised CPO and a soap stock; the latter is separated from the oil by a high-speed separator. The neutralised oil is subjected to earth bleaching to remove colour pigments and metal ions followed by deodorisation - steam distillation under vacuum to remove odoriferous matters such as aldehydes and ketones. The refined oil contains triglycerides of various compositions and melting points, the main fractions being palm olein and palm stearin. These fractions can be separated by dry fractionation, detergent fractionation and solvent fractionation. Dry fractionation is commonly used whereby the refined oil is allowed to crystallise under controlled temperature and the resultant slurry is pumped through a membrane filter press to obtain the liquid olein fraction and the solid stearin portion. The olein could also be fractionated for a second time (‘double fractionation’) to produce a ‘super olein’ and a solid palm mid-fraction (PMF) which is the feedstock for production of specialty fats and other products.
Kernel Crushing Three different processes are used for the transformation of Palm Kernels into oil and meal: mechanical, chemical and traditional.
Mechanical crushing entails three basic steps: (a) kernel pre-treatment, (b) screw-pressing, and (c) oil clarification. Kernel pretreatment consists of washing, decontamination, initial crushing and cooking of the kernels. This process produces more efficient extraction rates but may be skipped or only partially applied prior to moving to the screw pressing stage of extraction. During screw pressing the kernels or meal, as the case may be, are placed in a centrifuge which separates the oil from the cake. The oil is then clarified through a decanting process.
Mechanical extraction of palm kernel oil.

The traditional method of extraction the kernels are cracked either by hand or through a kernel cracker. The mechanical nut-crackers deliver a mixture of kernels and shells that must be separated. The kernel/shell separation is usually performed in a clay-bath, which is a concentrated viscous mixture of clay and water. The density of the clay-bath is such that the shells sink while the lighter kernels float to the top of the mixture. The floating kernels are scooped in baskets, washed with clean water and dried. Periodically, the shells are scooped out of the bath and discarded. The resulting meat is then fried, mashed into a paste and cooked in water at which point the oil can be scooped fron the top. The chemical extraction process relies principally on the use of hexane as a solvent and, although highly efficient (extracting all but 2% of the oil) is also costly and dangerous and therefore only suited to large processing plants. Manufacturing/Consumption The pulp of the fruit produces an edible vegetable oil and the kernel produces a non-edible oil. Palm oil and palm kernel oil have a wide range of applications, about 80% are

used of food applications while the rest is feedstock for a number of non-food applications. Among the food uses, refined, bleached and deodorised (RBD) olein is used mainly as cooking and frying oils, shortenings and margarine while RBD stearin is used for the production of shortenings and margarine. RBD palm oil (i.e. unfractionated palm oil) is used for producing margarine, shortenings, vanaspati (vegetable ghee), frying fats and ice cream. Several blends have been developed to produce solid fats with a zero content of trans-fatty acids. In the production of ice cream, milk fats are replaced by a combination of palm oil and palm kernel oil. A blend of palm oil, palm kernel oil and other fats replaces milk fat for the production of non-diary creamers or whiteners. It is estimated that 1 in 10 products on supermarket shelves contain palm oili. An emerging market is that of biofuel and increased demand for this may become a significant competitor with the food industry for palm oil products.

Appendix 2: Supply and Demand Analysis Example taken from joint IISD/Scott Wilson project applying GCCSA to UK coniferous wood supply chain. The following table provides a partial summary presentation of key trade statistics relevant to GCCSA for coniferous lumber using the UK as the target country for 2004. A narrative description will be important to explain trends, relationships and distinctions between classifications etc. Data should also be collected for a time series to demonstrate trends over the last decade (or more to the extent appropriate).
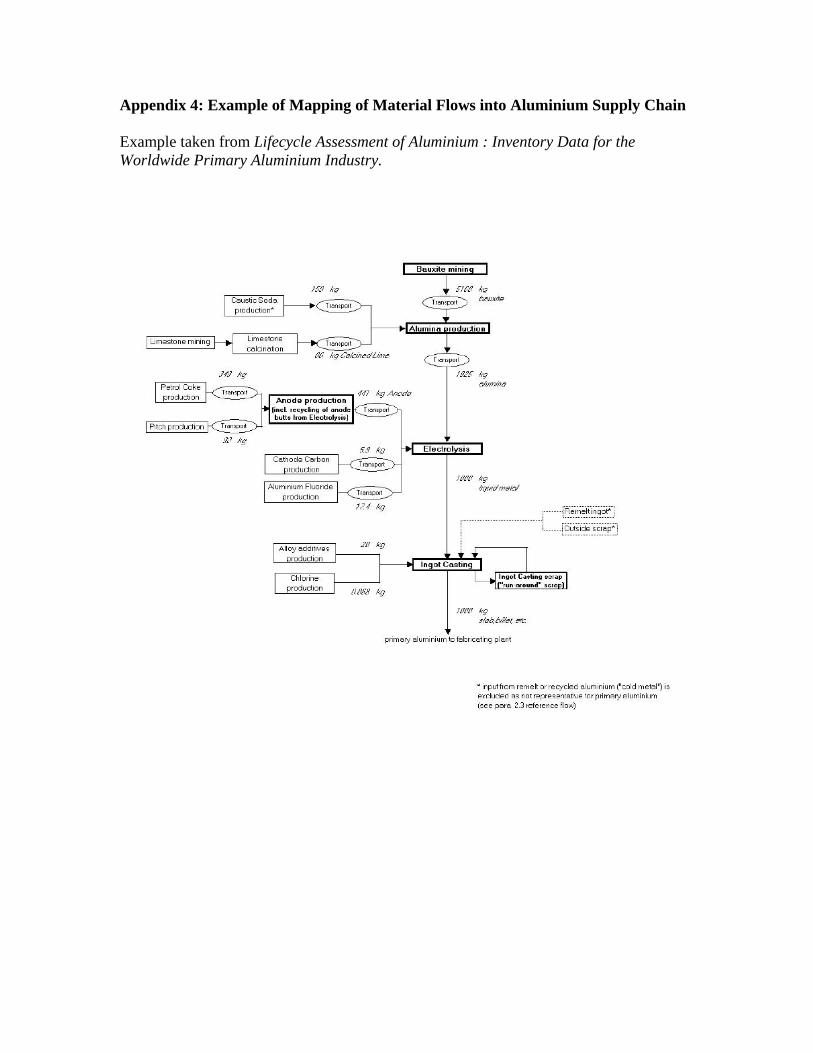
Appendix 4: Example of Mapping of Material Flows into Aluminium Supply Chain Example taken from Lifecycle Assessment of Aluminium : Inventory Data for the Worldwide Primary Aluminium Industry.

Appendix 5 : Supply Chain Governance Data Example Chart and Analysis (Cereals Sector) Example from Food Inc : Corporate Concetration from Farmer to Consumer (UK Food Group) Cereals Globally, grains are produced for three principal reasons: direct human consumption (41%), animal feed (45%) and other uses, including industrial consumption. The fact that cereals and oilseeds have virtually no retail demand, but are sold as inputs to industrial processes that yield livestock, bread and sweeteners, has a major bearing on the way in which these commodity chains are governed. Wheat is the most important cereal traded on international markets. Major wheat producing countries such as China and India are not the most important traders; the US is the world’s largest wheat exporter, contributing around onethird of world export volume, followed by Canada and Australia. Among the ‘developing’ countries, the only major exporter is Argentina. Developing countries, however, account for nearly 80% of all wheat imports. By contrast, the international rice market is ‘thin’, accounting for only 5-6% of global output, though trade is expanding. And unlike other bulk commodities, the rice market is segmented into a number of different varieties and qualities, each with strong consumer loyalty. If adjusted for inflation, calculated at constant 1998 prices, world rice prices averaged $860 per tonne from 1950 to 1964, dropping to under $300 by the late 1990s and now hovering slightly under $200. Higher-quality basmati from Pakistan is sold at close to $370 per tonne. Key rice exporters are Thailand, Vietnam, China, USA, India and Pakistan. Thailand and Vietnam face intense competition from India in low quality markets. Since June 2001, India has been the lowest-priced source for rice, and more recently, for higher quality regular milled white rice. Competition among rice producers and exporters through undercutting prices to get orders in a situation of suppressed demand and low prices has affected rice farmers and the resilience of rural economies in Thailand, Vietnam and China. These three countries, plus India and Pakistan, are investigating mechanisms to achieve export price stability, through the possible formation of a Council on Rice Trade Cooperation. This follows a failed attempt by Thailand in 2001 to create a ‘rice pool’, in effect a rice cartel to stabilise world rice prices. Corporate control of the global grain trade Corporate control of the grain trade was high on the political agenda even in the 1970s, and further consolidation in the intervening period is again fuelling farmers’ frustration. Cargill is the largest privately owned corporation in the US, with nearly US$60 billion in annual company-wide sales in 2003 and reported net earnings of $ 1.3 billion. According to Leland Swenson, President of the National Farmers Union, Cargill’s controversial acquisition of Continental’s grain business in 1999 gave the company 45% of the global grain trade.77 It controls 42% of all US maize exports, a third of all soybean exports, and approximately 20% of wheat exports. The company operates in 61 countries. Other businesses include meat processing, cotton, sugar, and petroleum trading; financial trading; food processing; futures brokering; feed and fertilizer production; and steelmaking. The combined Cargill and MacMillan families own 90% of the company's stock; the rest is owned by company executives. Paris-based Louis Dreyfus is ‘one of the world's largest merchandisers of grains and oilseeds’. The company has a major presence in all of the important grain and oilseed production regions in the world. Aggregate annual gross sales in recent years have exceeded US$18 billion. Other activities include trading in energy commodities, forestry management, telecommunications and real estate. Although privately owned, is also a cooperative under French law. It owns 49% of the shares of the cooperative Union Française des Céréales (UFC, better known as La Cooperative Lafayette). Archer Daniels Midland (ADM) controls about 30% of the global grain trade, with sales in 2002 of US$22.6 billion. ADM also ranks second in flour milling in the US, first in Canada and has a leading position in Mexico, as well as in the Caribbean. When these transnational cereal traders are part of national export cartels, there are issues of rent-seeking and import prices in developing countries to consider. During the Reagan presidency, Cargill, Dreyfus, Continental and Artfer collected US$1.38 billion from the US government, much of it bonuses under the Export Enhancement Programme (EEP) in the period 1985-89. This programme to grow US market share and expand export competitiveness did little to improve the lot of American grain farmers (Kneen, 2002). An increasing role of transnational agribusiness firms is discernible in the rice market. The UN Commission on Trade and Development’s (UNCTAD) rice commodity information78 traces the shift in rice trading patterns. This shows that since the 1970s, the trade has moved from Annual net farm incomes for UK cereal farmers fell sharply from a peak in 1995/96 (average £44,700) dropping to £3,300 in 2001/02. The figure rose to £7,000 in 2002/03, and a temporary recovery occurred in 2003.

The grains sector in the UK is consolidating rapidly. A feature of the UK cereals trading sector is the dominance of farmer-owned enterprises, which now account for 7 million tonnes, or 40%, of ex-farm trade in combinable crops.80 Grainfarmers (formerly SCATS) is the UK’s largest farmer-owned arable and grain marketing business and supplies grain to most of the UK's major flour millers, feed compounders, maltsters, crushers and processors. It has export facilities close to every major grain-producing region in the UK. An International Marketing Alliance with Dreyfus ‘provides the business with worldwide market access and market intelligence’. In 2001, Grainfarmers established a joint venture, the Organic Arable Marketing Group (OAMG), which now markets over 25% of the UK's organic combinable crop. Of the private grain traders, Allied Grain is the second biggest collector of ex farm grain in the UK. The UK bread and flour industry The UK market for bread and bakery snacks is worth over £2.2 billion annually in retail sales value. The milling industry has been contracting rapidly over the years, with the number of mills having fallen from 252 in 1950 to just 68 in 2000.81 The UK flour milling companies have a total turnover from all sources of nearly £1 billion. The two largest companies Rank Hovis (part of RHM) and Allied Mills accounted for around 50% of flour produced in the UK, though ADM Milling (a wholly-owned subsidiary of ADM), recently acquired six of Allied’s flour mills in the UK, which promotes them to second rank behind Rank Hovis in British milling. There are around 30 other milling companies in the UK, such as Smiths Flour Mills, part of Northern Foods. The large factory baking industry (‘plant bread’) in the UK produces around three-quarters of bread consumed in the UK, and the market is valued at around £1.5 billion. Two companies – Allied Bakeries (also part of ABF) and British Bakeries (RHM) – account for around 55% of the market by value. Profitability in the UK milling and baking industries has not been high, with persistent pressure on margins. Influence of supermarkets Most of the largest plant bakeries produce their own branded breads and also own-brand products for the multiple retailers. For example, British Bakeries’ customers include Tesco, Sainsbury, Asda, Somerfield, Safeway and Co-op. The big supermarkets account for around 72% of bread volume sales. Own-label bread accounts for around 50% of the bread now sold in supermarkets, though this is declining. Supermarkets themselves have moved into instore bakeries, which now have a market share of 18%. The master/craft baker is in decline, with a market share of around 7%. Since 1994, retail sales value of bread has declined by 9%, and consumption has been declining since 1996. Prices of economy bread (e.g.Tesco Value) have fallen by 28% since 1995. Value lines of bread, as a ‘known value item’ (KVI) have been sold by multiple retailers below cost for at least the last five years, and this has been accused of devaluing the whole sector. In summary, although the level of concentration in the wheat-flour-bread chain is extremely high (Figure 4.1) nobody is making large profits from the chain, due to the maturity of the market, and the influence of retail buying power combined with below-cost or at-cost selling, which suppresses the value of the entire sector. The Common Agricultural Policy ensures that cereal farmers are partially insulated from the influence of downstream concentration. This sentiment is not echoed in Canada, where the National Farmers Union has pointed to the growing divergence between farmgate wheat prices and retail bread prices: ‘Higher prices to farmers need not mean higher prices for consumers. Twenty years ago, the farmer got 7¢ out of a 74¢ loaf of bread. Today, that farmer gets 5¢ out of a $1.33 loaf. Bread went up 59¢ while the farmers' share went down. Millers and retailers raise prices to consumers, and lower prices to farmers – profiting handsomely while exploiting both. The farmers need another 5¢ per loaf, but this need not come out of consumers’ pockets. We think it can come out of the 59¢ increase that millers and retailers are pocketing.’ Canadian NFU Vice-President Fred Tait, 15 August 2000 exclusive control by governments (public contracts) and/or by private Chinese family exporters conducting mainly intra-Asian trade, to penetration by Dreyfus, Rustal, Novel, Nidera, ADM and The Rice Corporation (TRC). The importance of private exporters in Asia has also grown; in Thailand the share of private trade exportation of rice has risen over the past ten years from 20% to 80%. In Vietnam private negotiators have also stepped in following national economic reforms that took place in the 1990s. Rice marketing in Vietnam has rapidly developed into a complex system without the central management that policy-makers once thought was necessary.79 Similarly in Pakistan, the public sector monopoly in the export of rice and cotton has been ended. Consolidation in the UK grains sector To understand the impact of corporate concentration in the cereals chain, the wheat-flour-bread chain in the UK is very illuminating. The sector has a high level of concentration and vertical integration, but little of the chain is very profitable due in large part to the strategy of retailers. The UK is the third largest producer of cereals in the EU, after France and Germany. Cereals comprise by far the largest proportion of the UK cropped area (3.25 million ha of a total of 4.57 million ha in 2002, with a value of £2.19

billion) and therefore cereal production has broad implications for the environmental and economic performance of UK agriculture. The UK is a net exporter of cereals; higher quality milling wheat is imported and feed barley and feed wheat exported. Exporters must compete with domestic users (milling and feed industries) and this ‘elasticity’ limits market power of traders. Domestic wheat is divided roughly equally between animal feed and flour milling. Barley is divided between brewing/distilling (34%) and animal feed (61%).
i FoE (2005) Friends of the Earth 2005, press release 16 December 2005 ‘Asda joins roundtable on palm oil’