Global burden of osteoarthritis in the year 2000 - WHO · Draft 15 -08 06 Global Burden of Disease...
26
Draft 15-08-06 Global Burden of Disease 2000 Global burden of osteoarthritis in the year 2000 Deborah Symmons 1 Colin Mathers 2 , Bruce Pfleger 3 1. Introduction Osteoarthritis (OA) is a complex disease entity that is difficult to diagnose and define. The Subcommittee on Osteoarthritis of the American College of Rheumatology Diagnostic and Therapeutic Criteria Committee defined osteoarthritis (OA) as "A heterogeneous group of conditions that lead to joint symptoms and signs which are associated with defective integrity of articular cartilage, in addition to related changes in the underlying bone at the joint margins" (1). Clinically, the condition is characterized by joint pain, tenderness, limitation of movement, crepitus, occasional effusion, and variable degrees of local inflammation. The concept that binds the different conditions labelled ‘OA’ together is a pathological one. The pathological definition is of a condition characterised by focal areas of loss of articular cartilage within synovial joints, associated with hypertrophy of bone (osteophytes and subchondral bone sclerosis) and thickening of the capsule. In this sense it is the reaction of synovial joints to injury. Histologically, the disease is characterized early by fragmentation of the cartilage surface, cloning of chondrocytes, vertical clefts in the cartilage, variable crystal deposition, remodeling, and eventual violation of the tidemark by blood vessels (2). This phenomenon can occur in any joint, but is most common in selected joints of the hand, spine, knee, foot and hip. This pathological change, when severe, results in radiological changes (loss of joint space and osteophytes) which have been used in epidemiological studies to estimate prevalence of OA at different joint sites. A Kellgren & Lawrence radiological OA score of 2-4 is still the most widely used definition of radiological OA in epidemiological studies (section 2) (5). Osteoarthritis is more common in women than men but the prevalence increases dramatically with age. 45% of women over the age of 65 have symptoms while radiological evidence is found in 70% of those over 65(3). Osteoarthritis of the knee is a major cause of mobility impairment, particularly among females. OA was estimated to be the 10 th leading cause of non-fatal burden in the world in 1990, accounting for 2.8% of total YLD, around the same percentage as schizophrenia and congenital anomalies (4). In the Version 2 estimates for the Global Burden of Disease 2000 study, published in the World Health Report 2002(5), OA is the 4 th leading cause of YLDs at global level, 1 ARC Epidemiology Unit, University of Manchester, United Kingdom. 2 Co-ordinator, Epidemiology and Burden of Disease, WHO Geneva (EBD/GPE) 3 Management of Noncommunicable Diseases, WHO Geneva.
Transcript of Global burden of osteoarthritis in the year 2000 - WHO · Draft 15 -08 06 Global Burden of Disease...

Draft 15-08-06 Global Burden of Disease 2000
Global burden of osteoarthritis in the year 2000
Deborah Symmons1 Colin Mathers2, Bruce Pfleger3
1. Introduction Osteoarthritis (OA) is a complex disease entity that is difficult to diagnose and define. The Subcommittee on Osteoarthritis of the American College of Rheumatology Diagnostic and Therapeutic Criteria Committee defined osteoarthritis (OA) as "A heterogeneous group of conditions that lead to joint symptoms and signs which are associated with defective integrity of articular cartilage, in addition to related changes in the underlying bone at the joint margins" (1). Clinically, the condition is characterized by joint pain, tenderness, limitation of movement, crepitus, occasional effusion, and variable degrees of local inflammation.
The concept that binds the different conditions labelled ‘OA’ together is a pathological one. The pathological definition is of a condition characterised by focal areas of loss of articular cartilage within synovial joints, associated with hypertrophy of bone (osteophytes and subchondral bone sclerosis) and thickening of the capsule. In this sense it is the reaction of synovial joints to injury. Histologically, the disease is characterized early by fragmentation of the cartilage surface, cloning of chondrocytes, vertical clefts in the cartilage, variable crystal deposition, remodeling, and eventual violation of the tidemark by blood vessels (2). This phenomenon can occur in any joint, but is most common in selected joints of the hand, spine, knee, foot and hip.
This pathological change, when severe, results in radiological changes (loss of joint space and osteophytes) which have been used in epidemiological studies to estimate prevalence of OA at different joint sites. A Kellgren & Lawrence radiological OA score of 2-4 is still the most widely used definition of radiological OA in epidemiological studies (section 2) (5).
Osteoarthritis is more common in women than men but the prevalence increases dramatically with age. 45% of women over the age of 65 have symptoms while radiological evidence is found in 70% of those over 65(3). Osteoarthritis of the knee is a major cause of mobility impairment, particularly among females. OA was estimated to be the 10th leading cause of non-fatal burden in the world in 1990, accounting for 2.8% of total YLD, around the same percentage as schizophrenia and congenital anomalies (4). In the Version 2 estimates for the Global Burden of Disease 2000 study, published in the World Health Report 2002(5), OA is the 4th leading cause of YLDs at global level,
1 ARC Epidemiology Unit, University of Manchester, United Kingdom. 2 Co-ordinator, Epidemiology and Burden of Disease, WHO Geneva (EBD/GPE) 3 Management of Noncommunicable Diseases, WHO Geneva.

2
Draft 15-08-06 Global Burden of Disease 2000
accounting for 3.0% of total global YLDs. This draft paper summarises the data and methods used to produce the Version 2 estimates of OA burden for the year 2000.
2. Case and sequelae definitions The most widely using classification schemes for OA are based on the radiological appearance of the joint. The radiological hallmarks of OA are osteophyte formation, joint space narrowing, sclerosis and cyst formation. Severity may be graded based on the 0-4 scale developed by Kellgren and Lawrence (6). The scoring system is based on comparing films with those in a standard atlas of radiographs. Tables 1 and 2 below describe the categories for osteoarthritis of the knee and hip. Based solely on radiographic findings, osteoarthritis can be classified as: 0-absent 1-doubtful, 2-minimal, 3-moderate, and 4-severe. Studies commonly use either grades 2-4 or grades 3-4 for establishing OA, resulting in greatly differing prevalence estimates. Including grade 2 results in estimates 4-17 times higher for OA of the knee and 2-8 times higher for the hip (7).
Table 2.1 Radiographic grades of severity for osteoarthritis of the knee (atlas of standard radiographs, 1963)
Grade Verbal description
Grade 1
Grade 2
Grade 3
Grade 4
Doubtful narrowing of joint space and possible osteophytic lipping.
Definite osteophytes and possible narrowing of joint space.
Moderate multiple osteophytes, definit narrowing of joint space, and some sclerosis and possible deformity of bone ends.
Large osteophytes, marked narrowing of joint space, severe sclerosis, and definite deformity of bone ends.
Table 2.2 Radiographic grades of severity for osteoarthritis of the hip (atlas of standard radiographs, 1963)
Grade Verbal description
Grade 1
Grade 2
Grade 3
Grade 4
Doubtful narrowing of joint space medially and possible osteophytes around femoral head.
Definite narrowing of joint space inferiorly, definite osteophyes, and slight sclerosis.
Marked narrowing of joint pace, slight osteophytes, some sclerosis and cyst formation, and deformity of femoral head and acetabulum.
Gross loss of joint space with sclerosis and cysts, marked deformity of femoral head and acetabulum, and large osteophytes.
Some (but not the majority) of people with these pathological (radiographic) changes have joint symptoms (pain, stiffness and loss of function) that are likely to be related to the presence of the joint pathology. These symptoms are not specific, and there is no clinical definition of OA at any joint site that has been properly validated. The symptom severity depends on joint damage, but also varies across individuals and joint. There are clinical criteria for the classification of OA of hand, hip and knee (1;8;9). Pain is an obligatory symptom in these OA classifications.
The Global Burden of Disease 1990 study found high correlation between hand and hip OA and assumed that cases with hip or knee OA would cover most OA (10). We maintain this assumption

3
Draft 15-08-06 Global Burden of Disease 2000
for the GBD 2000 estimates. Hence only hip and knee OA were used for analysis of the analysis of OA disease burden.
As radiological changes are not always accompanied by symptoms such as pain, stiffness, and loss of function, their sole use as classification criteria can lead to overestimates of the burden of disease. One study of women aged 45-65 in the UK showed that the prevalence knee OA was 2.3% based on symptoms compared to 17% based on radiological criteria (11). The preferred definition for OA includes x-ray findings accompanied by symptoms such as joint pain on most days. In 1981 the Subcommittee on Osteoarthritis of the American College of Rheumatology's Diagnostic and Therapeutic Criteria Committee was formed to establish clinical criteria for the classification of OA. Algorithms for the knee and hip are summarized in Tables 2.3 and 2.4.
Table 2.3 ACR classification of OA of the knee*
Clinical
1
2
3
4
5
Knee pain for most days of prior monty
Crepitus on active joint motion
Morning stiffness # 30 min in duration
Age∃38 years
Bony enlargement of the knee on examination
OA present if items 1, 2, 3, 4, or 1, 2, 5 or 1, 4, 5 are present
Clinical and radiological
1
2
3
4
5
6
Knee pain for most days of prior month
Osteophytes at joint margins (X-ray)
Synovial fluid typical of osteoarthritis (laboratory)
Age ∃ 40 years
Morning stiffness # 30 min
Crepitus on active joint motion
OA present if items 1, 2 or 1, 3, 5, 6 or 1, 4, 5, 6 are present
*Modified from Altman (1986) (1), Altman (1991)
Table 2.4 ACR classification of OA of the hip*
Clinical and radiological
1
2
3
4
Hip pain for most days of the prior month
Erythrocyte sedimentation rate # 20 mm/h (laboratory)
Radiographic fermoral and/or acetabular osteophytes
Radiographic hip joint space narrowing
OA present if items 1, 2, 3, or 1, 2, 4 or 1, 3, 4 are present
*Modified from references (1) and (7)
Many national health surveys include questions asking for self-reported chronic conditions including osteoarthritis. For example, the 1995 Australian National Health Survey found that reported
4
Draft 15-08-06 Global Burden of Disease 2000
prevalence of osteoarthritis plus arthritis (not further specified as osteoarthritis or rheumatoid arthritis), but excluding rheumatoid arthritis, and rheumatism was 10% for males and 15% for females (all ages. For those aged 65-74 years, reported prevalences were 33% for males and 49% for females, rising slightly to 37% for males and 51% for females for those aged 75 years and over (12). March et al (13) reported that 10% of men and 19.5% of women aged 45-64 in North Sydney were diagnosed with OA. These are considerably lower than the self-report prevalences in the National Health Survey. Surveys using radiographic plus symptomatic criteria in other developed countries also find prevalences at older ages considerably lower than self-reported prevalences. It is very likely that a wide range of musculoskeletal conditions are being self-reported as osteoarthritis in such surveys, and as a result, we have chosen to base the case definitions for the GBD 2000 on the radiological plus symptomatic criteria as shown in Table 2.5.

5
Draft 15-08-06 Global Burden of Disease 2000
Table 2.5 GB D 2000 case and sequelae definitions for osteoarthritis
Cause category GBD 2000 Code ICD 9 codes ICD 10 codes
Osteoarthritis U127 715 M15-M19
Sequela Definition Definition
Osteoarthritis of the hip Symptomatic osteoarthritis of the hip, radiologically confirmed as Kellgren-Lawrence grade 2 or greater.
Radiological grade 2-4 (Kellgren-Lawrence)
Radiological grade 3-4 (Kellgren-Lawrence)
ACR clinical criteria (8;9)
Osteoarthritis of the knee Symptomatic osteoarthritis of the knee, radiologically confirmed as Kellgren-Lawrence grade 2 or greater.
Radiological grade 2-4 (Kellgren-Lawrence)
Radiological grade 3-4 (Kellgren-Lawrence)
ACR clinical criteria (8;9)
3. Population prevalence and incidence studies As OA is not reversible, the prevalence of OA increases indefinitely with age. Males are affected more often than females below age 45, while females are affected more frequently after age 55 (14). An exception is OA of the hip where, in the 45-64 year age group males are affected more often than women. There are some ethnic and geographical differences in prevalence. African American females are more prone than Caucasian females to OA of the knee (15) but not for the hip (16). OA of the hip occurs more often in European Caucasians than in Jamaican blacks (17), African or South African blacks (18;19), Chinese (20) or Asian Indians (Jukhopadhaya and Barooah 1967).
3.1 Prevalence
The prevalence of osteoarthritis using radiographic criteria has been studied world-wide (6;19;21-32). These data have been reviewed and summarized by others, most notably Kelsey (33), Lawrence (34),Van Sasse et al. (32) and Silman and Hochberg. (14).
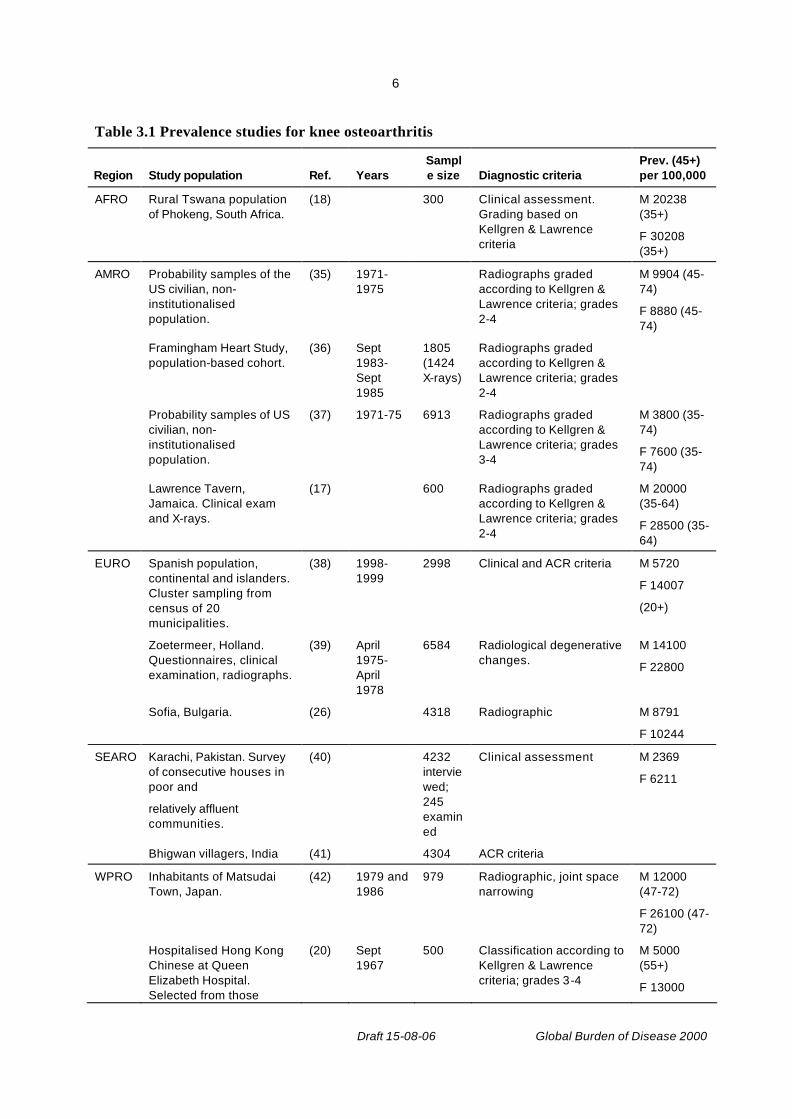
Available data on OA prevalence derive particularly from studies performed in the USA and Europe, with minimal information on other parts of the world. These studies have been recently reviewed (14). We estimate that approximately 10% of the world’s population who are 60 years or older have symptomatic problems that can be attributed to OA. The prevalence in developing countries is variable; some studies show lower prevalence rates while others show similar levels to those in developed countries (Table 3.1).
The two largest surveys are those from the US National Health Surveys and the Zoetermeer Community Survey in the Netherlands (7;32). The latter survey was more extensive and included 22 joints and joint groups whereas the US survey was more limited.
6
Draft 15-08-06 Global Burden of Disease 2000
Table 3.1 Prevalence studies for knee osteoarthritis
Region Study population Ref. Years Sample size Diagnostic criteria
Prev. (45+) per 100,000
AFRO Rural Tswana population of Phokeng, South Africa.
(18) 300 Clinical assessment. Grading based on Kellgren & Lawrence criteria
M 20238 (35+)
F 30208 (35+)
AMRO Probability samples of the US civilian, non-institutionalised population.
(35) 1971-1975
Radiographs graded according to Kellgren & Lawrence criteria; grades 2-4
M 9904 (45-74)
F 8880 (45-74)
Framingham Heart Study, population-based cohort.
(36) Sept 1983-Sept 1985
1805 (1424 X-rays)
Radiographs graded according to Kellgren & Lawrence criteria; grades 2-4
Probability samples of US civilian, non-institutionalised population.
(37) 1971-75 6913 Radiographs graded according to Kellgren & Lawrence criteria; grades 3-4
M 3800 (35-74)
F 7600 (35-74)
Lawrence Tavern, Jamaica. Clinical exam and X-rays.
(17) 600 Radiographs graded according to Kellgren & Lawrence criteria; grades 2-4
M 20000 (35-64)
F 28500 (35-64)
EURO Spanish population, continental and islanders. Cluster sampling from census of 20 municipalities.
(38) 1998-1999
2998 Clinical and ACR criteria M 5720
F 14007
(20+)
Zoetermeer, Holland. Questionnaires, clinical examination, radiographs.
(39) April 1975- April 1978
6584 Radiological degenerative changes.
M 14100
F 22800
Sofia, Bulgaria. (26) 4318 Radiographic M 8791
F 10244
SEARO Karachi, Pakistan. Survey of consecutive houses in poor and
relatively affluent communities.
(40) 4232 interviewed; 245 examined
Clinical assessment M 2369
F 6211
Bhigwan villagers, India (41) 4304 ACR criteria
WPRO Inhabitants of Matsudai Town, Japan.
(42) 1979 and 1986
979 Radiographic, joint space narrowing
M 12000 (47-72)
F 26100 (47-72)
Hospitalised Hong Kong Chinese at Queen Elizabeth Hospital. Selected from those
(20) Sept 1967
500 Classification according to Kellgren & Lawrence criteria; grades 3-4
M 5000 (55+)
F 13000

7
Draft 15-08-06 Global Burden of Disease 2000
admitted, as well as from outpatient department.
(55+)

8
Draft 15-08-06 Global Burden of Disease 2000
Table 3.2. Prevalence studies for hip osteoarthritis
Region Study population Ref. Years Sample size Diagnostic criteria
Prev. (45+) per 100,000
AFRO Rural Tswana population of Phokeng, South Africa. Clinical assessment.
(18) 300 Clinical assessment. Grading based on Kellgren & Lawrence criteria
M 3278 (55+)
F 725 (55+)
Rural Tswana population of Phokeng, South Africa.
(19) 1975 307 Radiographs graded according to Kellgren & Lawrence criteria; grades 2-4
M 3279 (55+)
F 2899 (55+)
AMRO Probability samples of US civilian, non-institutionalised population.
(37) 1971-75 Radiographs graded according to Kellgren & Lawrence criteria; grades 2-4
Lawrence Tavern, Jamaica. Clinical exam and X-rays.
(17) 600 Radiographs graded according to Kellgren & Lawrence criteria; grades 2-4
M 2500 (35-64)
F 5000 (35-64)
EURO Random population sample in Jerusalem previously enrolled in osteoporosis study.
(43) 641 Radiographs graded according to Kellgren & Lawrence criteria; grades 3-4
M 3904 (45-84)
F 4221 (45-84)
Malmö, southern Sweden. All adult patients with radiographs of colon taken between 1987-95.
(44) 1987-1995
4121 Radiographic Danielsson – joint space less than 4mm if aged <70, less than 3mm if aged = 70
M 1945
F 2305
Iceland. All colon radiographs at 3 radiographic departments examined.
(45) 1990-1996
1517 Measurement of joint space
M 12700
F 11783
Sofia, Bulgaria. (26) 4318 Radiographic M 1319
F 1057
3.2 Incidence
Few studies have examined the incidence of osteoarthritis. Two longitudinal studies of hand osteoarthritis (46;47) found that incidence of osteoarthritis increased with duration of follow-up and with advancing age. In addition, existing osteoarthritis progressed with longer follow-up and the rate of progression increased at older ages.
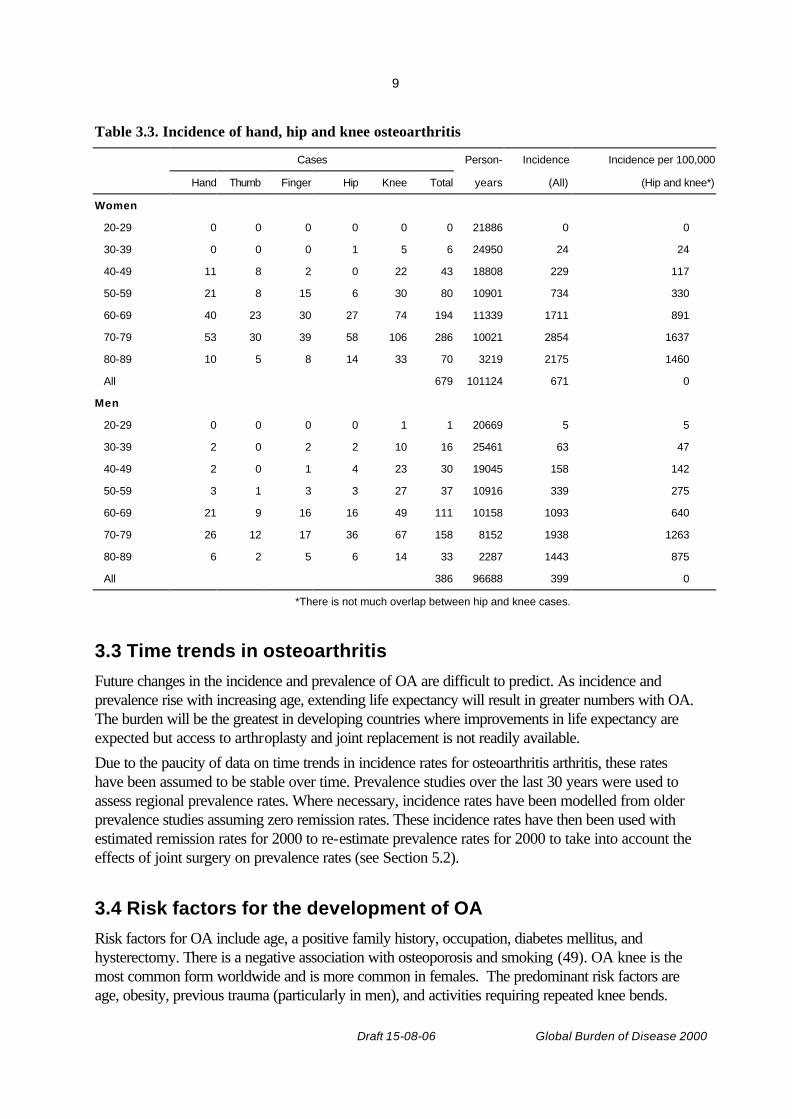
Oliveria et al (48) reported findings from a large-scale study (N=130,000) in Massachusetts, in which subjects were members of a health maintenance organisation. Incidence of radiographic OA (Grade 2 and above) by affected joint, age and sex are listed in Table 3.3.
9
Draft 15-08-06 Global Burden of Disease 2000
Table 3.3. Incidence of hand, hip and knee osteoarthritis
Cases Person- Incidence Incidence per 100,000
Hand Thumb Finger Hip Knee Total years (All) (Hip and knee*)
Women
20-29 0 0 0 0 0 0 21886 0 0
30-39 0 0 0 1 5 6 24950 24 24
40-49 11 8 2 0 22 43 18808 229 117
50-59 21 8 15 6 30 80 10901 734 330
60-69 40 23 30 27 74 194 11339 1711 891
70-79 53 30 39 58 106 286 10021 2854 1637
80-89 10 5 8 14 33 70 3219 2175 1460
All 679 101124 671 0
Men
20-29 0 0 0 0 1 1 20669 5 5
30-39 2 0 2 2 10 16 25461 63 47
40-49 2 0 1 4 23 30 19045 158 142
50-59 3 1 3 3 27 37 10916 339 275
60-69 21 9 16 16 49 111 10158 1093 640
70-79 26 12 17 36 67 158 8152 1938 1263
80-89 6 2 5 6 14 33 2287 1443 875
All 386 96688 399 0
*There is not much overlap between hip and knee cases.
3.3 Time trends in osteoarthritis
Future changes in the incidence and prevalence of OA are difficult to predict. As incidence and prevalence rise with increasing age, extending life expectancy will result in greater numbers with OA. The burden will be the greatest in developing countries where improvements in life expectancy are expected but access to arthroplasty and joint replacement is not readily available.
Due to the paucity of data on time trends in incidence rates for osteoarthritis arthritis, these rates have been assumed to be stable over time. Prevalence studies over the last 30 years were used to assess regional prevalence rates. Where necessary, incidence rates have been modelled from older prevalence studies assuming zero remission rates. These incidence rates have then been used with estimated remission rates for 2000 to re-estimate prevalence rates for 2000 to take into account the effects of joint surgery on prevalence rates (see Section 5.2).
3.4 Risk factors for the development of OA
Risk factors for OA include age, a positive family history, occupation, diabetes mellitus, and hysterectomy. There is a negative association with osteoporosis and smoking (49). OA knee is the most common form worldwide and is more common in females. The predominant risk factors are age, obesity, previous trauma (particularly in men), and activities requiring repeated knee bends.
10
Draft 15-08-06 Global Burden of Disease 2000
One study showed obesity to result in an odds ratio of about 8.0 for developing OA knee (50). Occupational groups showing increased risk for OA include miners (51), dock workers (52), jobs involving high knee-bending demands (15), and farmers (53). The latter study showed farming to present the greatest relative risk for OA of the hip: 4.5 for farming 1-9 years and 9.3 for farming ten years or more. OA of the hip and knee are the most important from the viewpoint of public health, based on their prevalence and associated disability.
4. Health state descriptions and disability weights The course of the disease varies but often is progressive, leading to increased pain and disability changes ((54-56). Progression of OA of the knee is accelerated by obesity (57). OA continues to get slowly worse with time, as measured by radiographic criteria. Two groups have analysed data from the National Health and Nutrition Examination Survey - I Epidemiologic Follow Up Survey to determine the occurrence of physical disability in long-term survivors with knee osteoarthritis (58-60). Subjects with knee osteoarthritis defined by radiography at baseline were significantly more likely to have difficulty walking from one room to another or up or down two steps and arising from an armless straight chair or getting in and out of bed. Futhermore, those individuals with symptomatic knee pain at baseline were significantly more likely to report difficulty with these activities at follow-up than those with radiographic changes alone.
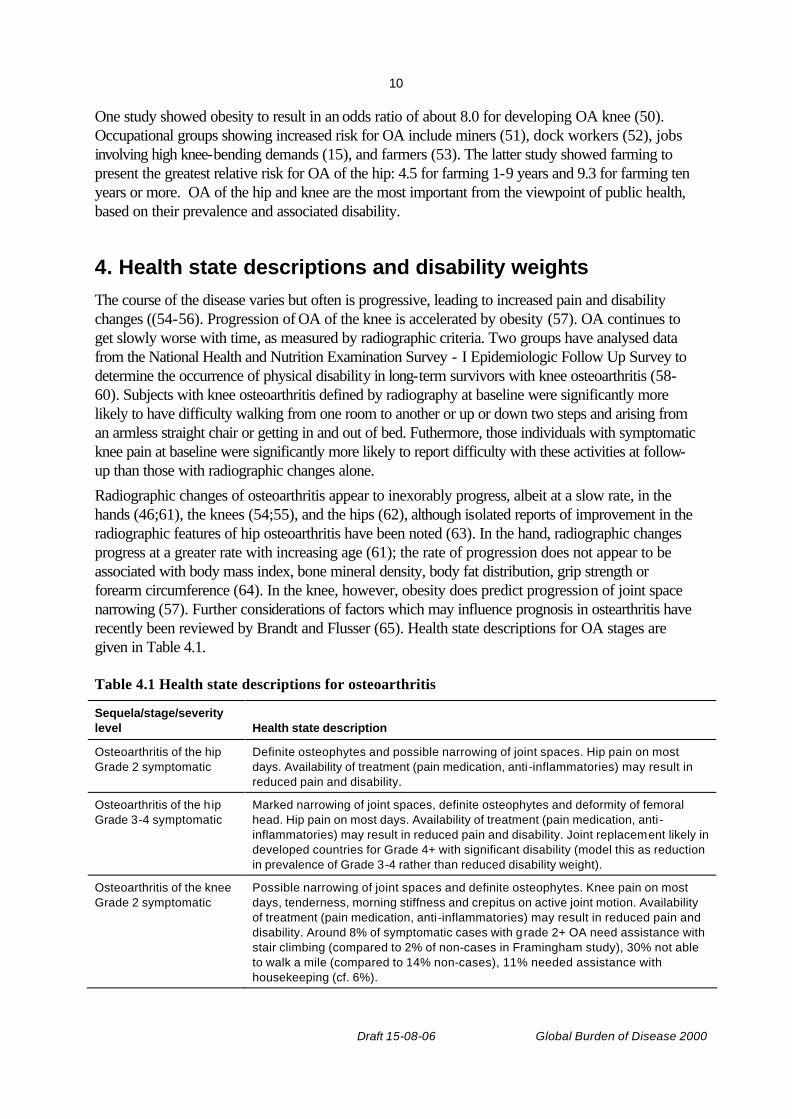
Radiographic changes of osteoarthritis appear to inexorably progress, albeit at a slow rate, in the hands (46;61), the knees (54;55), and the hips (62), although isolated reports of improvement in the radiographic features of hip osteoarthritis have been noted (63). In the hand, radiographic changes progress at a greater rate with increasing age (61); the rate of progression does not appear to be associated with body mass index, bone mineral density, body fat distribution, grip strength or forearm circumference (64). In the knee, however, obesity does predict progression of joint space narrowing (57). Further considerations of factors which may influence prognosis in ostearthritis have recently been reviewed by Brandt and Flusser (65). Health state descriptions for OA stages are given in Table 4.1.
Table 4.1 Health state descriptions for osteoarthritis
Sequela/stage/severity level Health state description
Osteoarthritis of the hip Grade 2 symptomatic
Definite osteophytes and possible narrowing of joint spaces. Hip pain on most days. Availability of treatment (pain medication, anti-inflammatories) may result in reduced pain and disability.
Osteoarthritis of the hip Grade 3-4 symptomatic
Marked narrowing of joint spaces, definite osteophytes and deformity of femoral head. Hip pain on most days. Availability of treatment (pain medication, anti -inflammatories) may result in reduced pain and disability. Joint replacement likely in developed countries for Grade 4+ with significant disability (model this as reduction in prevalence of Grade 3-4 rather than reduced disability weight).
Osteoarthritis of the knee Grade 2 symptomatic
Possible narrowing of joint spaces and definite osteophytes. Knee pain on most days, tenderness, morning stiffness and crepitus on active joint motion. Availability of treatment (pain medication, anti -inflammatories) may result in reduced pain and disability. Around 8% of symptomatic cases with grade 2+ OA need assistance with stair climbing (compared to 2% of non-cases in Framingham study), 30% not able to walk a mile (compared to 14% non-cases), 11% needed assistance with housekeeping (cf. 6%).
11
Draft 15-08-06 Global Burden of Disease 2000
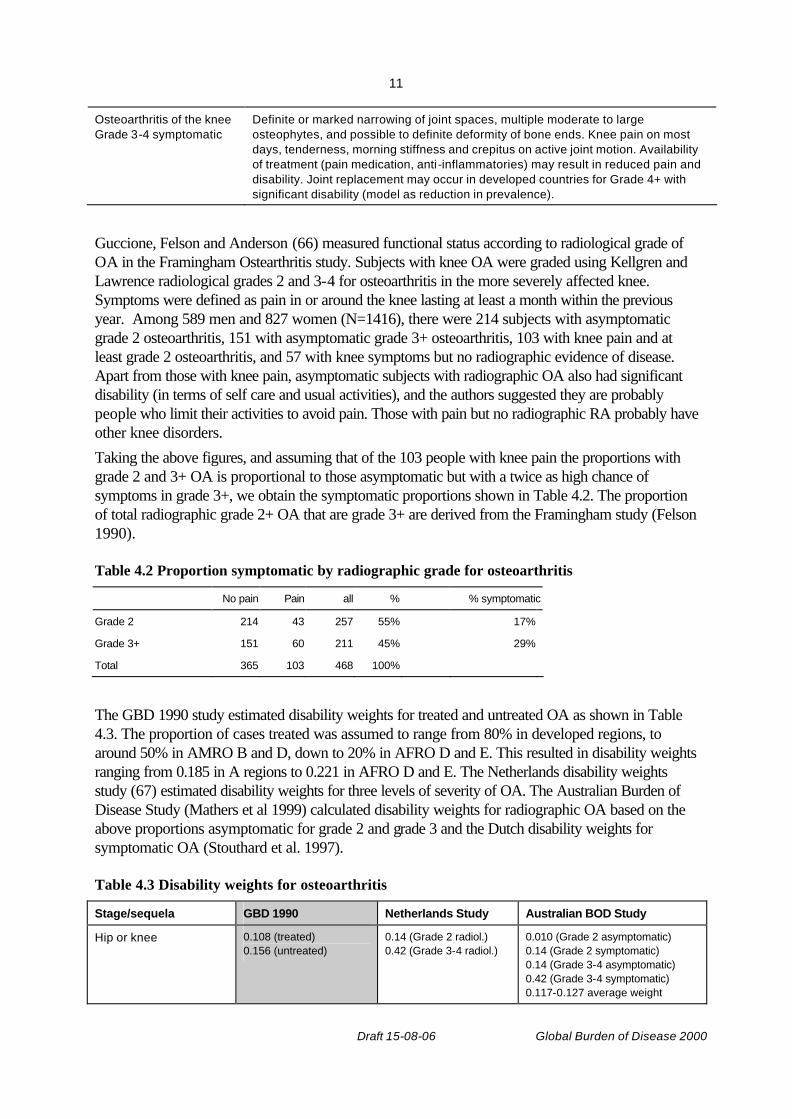
Osteoarthritis of the knee Grade 3-4 symptomatic
Definite or marked narrowing of joint spaces, multiple moderate to large osteophytes, and possible to definite deformity of bone ends. Knee pain on most days, tenderness, morning stiffness and crepitus on active joint motion. Availability of treatment (pain medication, anti -inflammatories) may result in reduced pain and disability. Joint replacement may occur in developed countries for Grade 4+ with significant disability (model as reduction in prevalence).
Guccione, Felson and Anderson (66) measured functional status according to radiological grade of OA in the Framingham Ostearthritis study. Subjects with knee OA were graded using Kellgren and Lawrence radiological grades 2 and 3-4 for osteoarthritis in the more severely affected knee. Symptoms were defined as pain in or around the knee lasting at least a month within the previous year. Among 589 men and 827 women (N=1416), there were 214 subjects with asymptomatic grade 2 osteoarthritis, 151 with asymptomatic grade 3+ osteoarthritis, 103 with knee pain and at least grade 2 osteoarthritis, and 57 with knee symptoms but no radiographic evidence of disease. Apart from those with knee pain, asymptomatic subjects with radiographic OA also had significant disability (in terms of self care and usual activities), and the authors suggested they are probably people who limit their activities to avoid pain. Those with pain but no radiographic RA probably have other knee disorders.
Taking the above figures, and assuming that of the 103 people with knee pain the proportions with grade 2 and 3+ OA is proportional to those asymptomatic but with a twice as high chance of symptoms in grade 3+, we obtain the symptomatic proportions shown in Table 4.2. The proportion of total radiographic grade 2+ OA that are grade 3+ are derived from the Framingham study (Felson 1990).
Table 4.2 Proportion symptomatic by radiographic grade for osteoarthritis
No pain Pain all % % symptomatic
Grade 2 214 43 257 55% 17%
Grade 3+ 151 60 211 45% 29%
Total 365 103 468 100%
The GBD 1990 study estimated disability weights for treated and untreated OA as shown in Table 4.3. The proportion of cases treated was assumed to range from 80% in developed regions, to around 50% in AMRO B and D, down to 20% in AFRO D and E. This resulted in disability weights ranging from 0.185 in A regions to 0.221 in AFRO D and E. The Netherlands disability weights study (67) estimated disability weights for three levels of severity of OA. The Australian Burden of Disease Study (Mathers et al 1999) calculated disability weights for radiographic OA based on the above proportions asymptomatic for grade 2 and grade 3 and the Dutch disability weights for symptomatic OA (Stouthard et al. 1997).
Table 4.3 Disability weights for osteoarthritis
Stage/sequela GBD 1990 Netherlands Study Australian BOD Study
Hip or knee 0.108 (treated) 0.156 (untreated)
0.14 (Grade 2 radiol.) 0.42 (Grade 3-4 radiol.)
0.010 (Grade 2 asymptomatic) 0.14 (Grade 2 symptomatic) 0.14 (Grade 3-4 asymptomatic) 0.42 (Grade 3-4 symptomatic) 0.117-0.127 average weight

12
Draft 15-08-06 Global Burden of Disease 2000
5. Disease model for osteoarthritis The disease model for osteoarthritis is shown in Figure 5.1. Hip and knee OA are assumed to be independent, and their incidence and prevalence rates separately estimated. As noted before, we assume that prevalent hip OA will include most cases of hand OA.
Years lived with disability (YLDs) were calculated for the boxes shaded in grey.
Figure 5.1: Osteoarthritis disease model.
5.1 Mortality and case fatality
OA, by itself, is not a life threatening disease. Drugs commonly used to treat OA such as non-steroidal anti-inflammatory medications, can lead to excess mortality. Obesity, a risk factor for OA, can also lead to reduced life expectancy. People with osteoarthritis have a somewhat higher risk of death than others, but it is thought that this is due to an increased likelihood of significant comorbidities (not related to the osteoarthritis). An all-cause relative risk of 1.1 was used in DISMOD to model average duration of osteoarthritis.
5.2 Remission rates for osteoarthritis
The underlying disease process of OA does not remit, although it may fail to progress. Relief of symptoms may be achieved by arthroplasty or joint replacement surgery. Total joint replacement is a highly cost effective operation for severe osteoarthritis and provides good pain relief and improvement in mobility and quality of life in the majority of patients. In the United States, osteoarthritis is the most common indication for total hip arthoplasty, accounting for the majority of elective procedures in Americans aged 65 and above.
A remission rate equal to the rate of knee arthroplasties performed in the US population for reference year 19964 was used in modeling knee OA in DISMOD 2. US knee joint replacement surgery rates were also assumed for other A regions; knee replacement rates were assumed to be zero in other regions.
Hip OA remission rates were estimated from hip replacement surgery rates (primary total hip replacement) in the USA (AMRO A) and Scandinavian countries (for EURO A, WPRO A), and
4 From Joint Procedures chapter in book by American Academy of Orthopedic Surgeons.
Incidence of OA knee
Prevalence
Death
Incidence of OA hip
Prevalence
Death

13
Draft 15-08-06 Global Burden of Disease 2000
assumed to be 0 in other regions Primary total hip replacement rates were available from Sweden (Herberts and Malchau 2000), Norway (Havelin et al 2000), and Denmark (Lucht 2000).
5.3 DISMOD estimation of incidence and duration for osteoarthritis
The observed incidence rates from the Rochester study for hip and knee OA were input to DISMOD 2 together with the estimated remission rates and a RR for mortality of 1.1. The resulting calculated prevalence rates were in reasonably good agreement with the prevalence rates observed in the NHANES study, suggesting that the remission and RR assumptions are acceptable.
Osteoarthritis disease model and assumptions are shown in Table 5.1. Table 5.2 compares the GBD 2000 assumptions with those used in 1990.
Table 5.1. Osteoarthritis disease model and assumptions
Definitions ACR clinical criteria assumed = symptomatic
Prevalence symptomatic hip OA = 33% of KL Grade 2+ radiological prevalence
Prevalence symptomatic hip OA = 50% of KL Grade 3+ radiological prevalence
Incidence Incidence rates from Rochester USA adjusted for various regions to match prevalences
Remission Knee: US knee joint replacement surgery rates in A regions, zero in other regions
Hip: Hip replacement surgery rates (primary THR) in USA (AMRO A) and Scandinavian countries (EURO A, WPRO A), zero in other regions
Case fatality RR=1.1 (due to obesity mainly)
Severity distribution 0.108 (treated), 0.156 (untreated)
Other assumptions OA knee rates higher in US blacks (1.25 male, 2.0 female)
Data Incidence of knee and hip OA in 2 US populations, prevalence studies of varying quality and time periods for other regions of the world.
Table 5.2. Comparison between GBD 1990 and GBD 2000 disease models
GBD 1990 GBD 2000
Stages/Sequelae Symptomatic osteoarthritis of the hip or knee, radiologically confirmed as Kellgren-Lawrence grade 2 or greater.
Symptomatic osteoarthritis of the hip or knee, radiologically confirmed as Kellgren-Lawrence grade 2 or greater.
Incidence rates DISMOD 1 used to estimate from prevalence rates
DISMOD 2 used to estimate from prevalence rates
Remission 0 Based on hip and knee replacement rates in A regions, 0 elsewhere
Case fatality RR=1.0 RR=1.1
Disability weights 0.108 (treated) 0.156 (untreated)
0.108 (treated) 0.156 (untreated)
14
Draft 15-08-06 Global Burden of Disease 2000
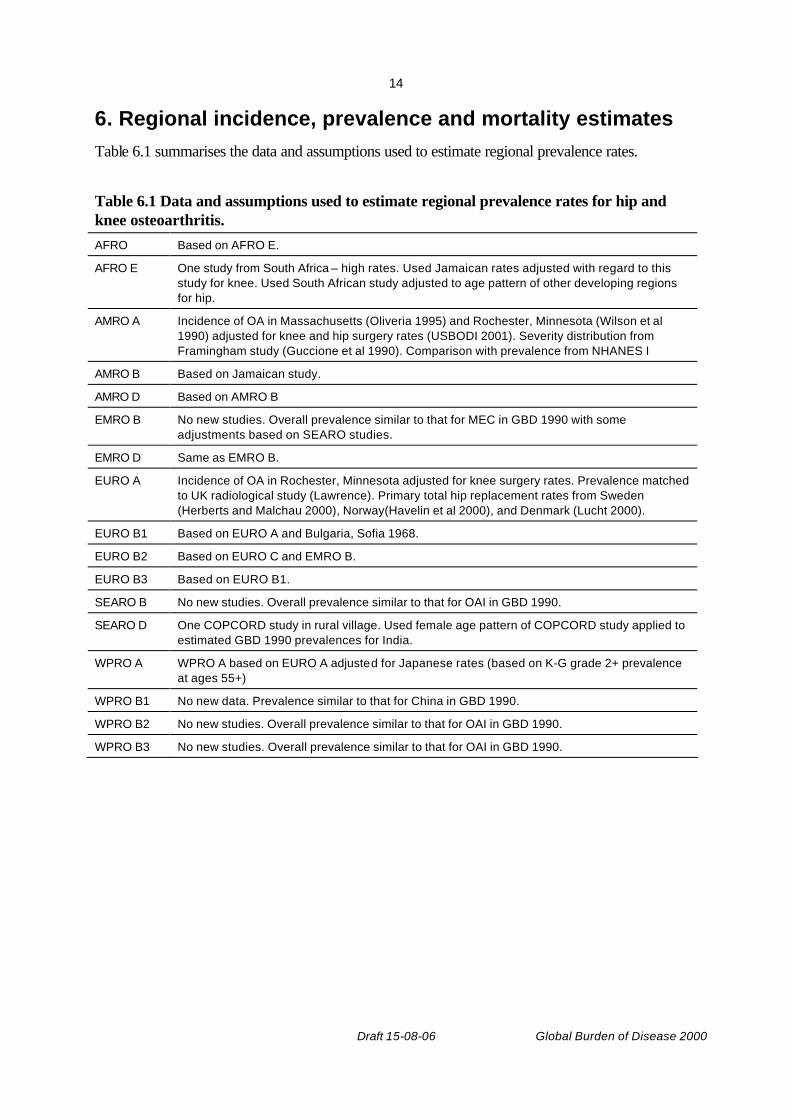
6. Regional incidence, prevalence and mortality estimates Table 6.1 summarises the data and assumptions used to estimate regional prevalence rates.
Table 6.1 Data and assumptions used to estimate regional prevalence rates for hip and knee osteoarthritis. AFRO Based on AFRO E.
AFRO E One study from South Africa – high rates. Used Jamaican rates adjusted with regard to this study for knee. Used South African study adjusted to age pattern of other developing regions for hip.
AMRO A Incidence of OA in Massachusetts (Oliveria 1995) and Rochester, Minnesota (Wilson et al 1990) adjusted for knee and hip surgery rates (USBODI 2001). Severity distribution from Framingham study (Guccione et al 1990). Comparison with prevalence from NHANES I
AMRO B Based on Jamaican study.
AMRO D Based on AMRO B
EMRO B No new studies. Overall prevalence similar to that for MEC in GBD 1990 with some adjustments based on SEARO studies.
EMRO D Same as EMRO B.
EURO A Incidence of OA in Rochester, Minnesota adjusted for knee surgery rates. Prevalence matched to UK radiological study (Lawrence). Primary total hip replacement rates from Sweden (Herberts and Malchau 2000), Norway(Havelin et al 2000), and Denmark (Lucht 2000).
EURO B1 Based on EURO A and Bulgaria, Sofia 1968.
EURO B2 Based on EURO C and EMRO B.
EURO B3 Based on EURO B1.
SEARO B No new studies. Overall prevalence similar to that for OAI in GBD 1990.
SEARO D One COPCORD study in rural village. Used female age pattern of COPCORD study applied to estimated GBD 1990 prevalences for India.
WPRO A WPRO A based on EURO A adjusted for Japanese rates (based on K-G grade 2+ prevalence at ages 55+)
WPRO B1 No new data. Prevalence similar to that for China in GBD 1990.
WPRO B2 No new studies. Overall prevalence similar to that for OAI in GBD 1990.
WPRO B3 No new studies. Overall prevalence similar to that for OAI in GBD 1990.

15
Draft 15-08-06 Global Burden of Disease 2000
For those regions with no available OA prevalence or incidence studies, prevalence rates were assumed to be similar to other selected regions, comparable in terms of level of development and population age structure. An estimate derived from a different region is more likely to be correct than the assumption that the condition does not exist in the region with no data of its own. In some instances, there are sufficient data from a region to indicate whether it is likely to be a high or low prevalence area for OA, but not to give a clear age pattern. In these cases, age patterns have been based on those seen in other regions. This process can also be used to decide where further work is needed. It is not necessary for a comprehensive set of surveys to be conducted in every country. A few large, high quality surveys are needed from representative areas.
Table 6.2 Hip and knee osteoarthritis: age-standardized incidence and prevalence rate estimates for WHO epidemiological subregions, 2000.
Age-std. incidence per 100,000 Age-std. prevalence per 100,000
Hip Knee Hip Knee
Subregion Males Female
s
Males Females Males Females
Males Females
AFRO D 39.0 33.8 148.1 183.5 473 373 2176 2894
AFRO E 40.5 34.3 148.1 183.5 475 382 2176 2894
AMRO A 38.0 53.1 123.8 155.6 413 576 1641 1915
AMRO B 36.1 52.6 144.7 181.2 375 558 1900 2224
AMRO D 37.7 52.6 144.7 181.4 397 544 1879 2184
EMRO B 22.2 14.6 67.7 136.8 277 167 1163 2325
EMRO D 22.2 15.7 75.2 142.4 274 162 1234 2273
EURO A 38.1 53.3 119.9 144.9 413 577 1583 1773
EURO B1 40.3 34.4 176.9 248.2 700 601 3086 3942
EURO B2 22.0 13.5 110.4 176.8 273 156 1737 2752
EURO C 40.5 31.4 188.1 253.1 633 490 2869 3683
SEARO B 31.2 13.3 179.6 195.2 381 151 2819 3236
SEARO D 32.7 13.5 70.0 141.6 406 159 1197 2327
WPRO A 36.4 55.4 120.3 156.2 398 598 1593 2040
WPRO B1 31.6 12.8 99.0 174.4 391 149 1476 2996
WPRO B2 30.0 12.8 176.7 192.7 368 145 2886 3406
WPRO B3 34.6 15.0 194.9 213.4 427 169 3089 3654
World 35.0 30.8 119.7 178.6 426 371 1770 2693
• Age-standardized to World Standard Population(68).
16
Draft 15-08-06 Global Burden of Disease 2000
Males
0
1000
2000
3000
4000
5000
6000
7000
8000
0-4 5-14 15-29 30-44 45-59 60-69 70-79 80+
Age groups
Pre
vale
nce/
100,
000
A Regions
AMRO BD
EURO BC
EMRO
SEARO
WPRO B
AFRO
Females
0
2000
4000
6000
8000
10000
12000
0-4 5-14 15-29 30-44 45-59 60-69 70-79 80+
Age groups
Pre
vale
nce/
100,
000
A Regions
AMRO BD
EURO BC
EMRO
SEARO
WPRO B
AFRO
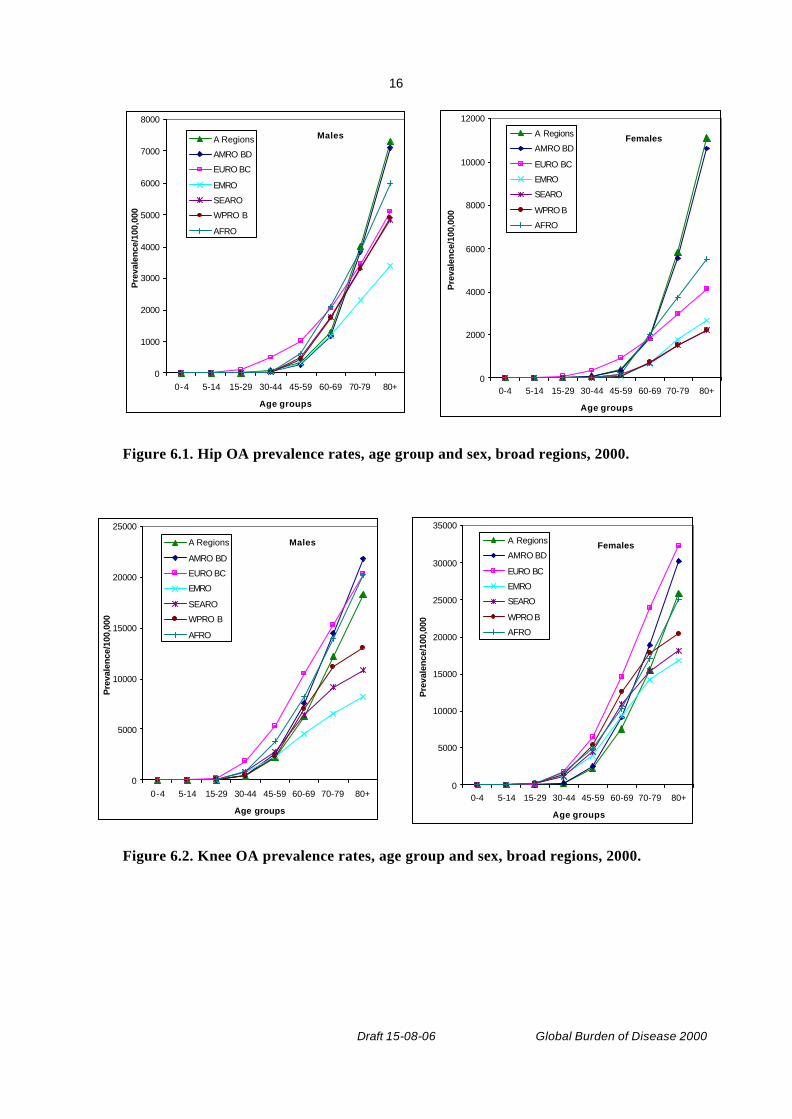
Figure 6.1. Hip OA prevalence rates, age group and sex, broad regions, 2000.
Males
0
5000
10000
15000
20000
25000
0-4 5-14 15-29 30-44 45-59 60-69 70-79 80+
Age groups
Pre
vale
nce/
100,
000
A Regions
AMRO BD
EURO BC
EMRO
SEARO
WPRO B
AFRO
Females
0
5000
10000
15000
20000
25000
30000
35000
0-4 5-14 15-29 30-44 45-59 60-69 70-79 80+
Age groups
Pre
vale
nce/
100,
000
A Regions
AMRO BD
EURO BC
EMRO
SEARO
WPRO B
AFRO
Figure 6.2. Knee OA prevalence rates, age group and sex, broad regions, 2000.

17
Draft 15-08-06 Global Burden of Disease 2000
7. Global burden of osteoarthritis in 2000 General methods used for the estimation of the global burden of disease are given elsewhere (69). The tables and graphs below summarise the global burden of OA estimates for the GBD 2000 and compare them with the OA estimates from the GBD 1990 (4).
Table 7.1: Osteoarthritis: global total YLD, YLL and DALY estimates, 1990 and 2000.
Males Females Persons
YLD('000)
GBD1990 5,341 7,934 13,275
GBD2000 5,549 8,667 14,216
YLL('000)
GBD1990 - - -
GBD2000 5 8 13
DALY('000)
GBD1990 5,341 7,934 13,275
GBD2000 5,554 8,675 14,230
Table 7.2: Osteoarthritis: YLD, YLL and DALY estimates for WHO epidemiological subregions, 2000.
YLD/100,000 YLL/100,000 YLD YLL DALY
Subregion Males Females Males Females (‘000) (‘000) (‘000)
AFRO D 162 227 0.0 0.0 650 0 650
AFRO E 143 208 0.0 0.0 593 0 593
AMRO A 212 299 0.5 1.1 794 2 796
AMRO B 159 212 0.5 0.8 823 3 826
AMRO D 122 146 0.0 1.3 96 0 96
EMRO B 107 185 0.0 0.0 202 0 202
EMRO D 107 180 0.0 0.0 198 0 198
EURO A 231 331 0.7 1.3 1,159 4 1,163
EURO B1 374 482 0.2 0.2 711 0 711
EURO B2 142 236 0.4 0.2 96 0 97
EURO C 349 516 0.6 0.4 1,075 1 1,076
SEARO B 256 307 0.2 0.2 1,109 1 1,110
SEARO D 127 210 0.0 0.0 2,254 0 2,254
WPRO A 254 401 0.1 0.3 491 0 492
WPRO B1 174 354 0.0 0.1 3,550 1 3,551
WPRO B2 238 320 0.0 0.0 397 0 397
18
Draft 15-08-06 Global Burden of Disease 2000
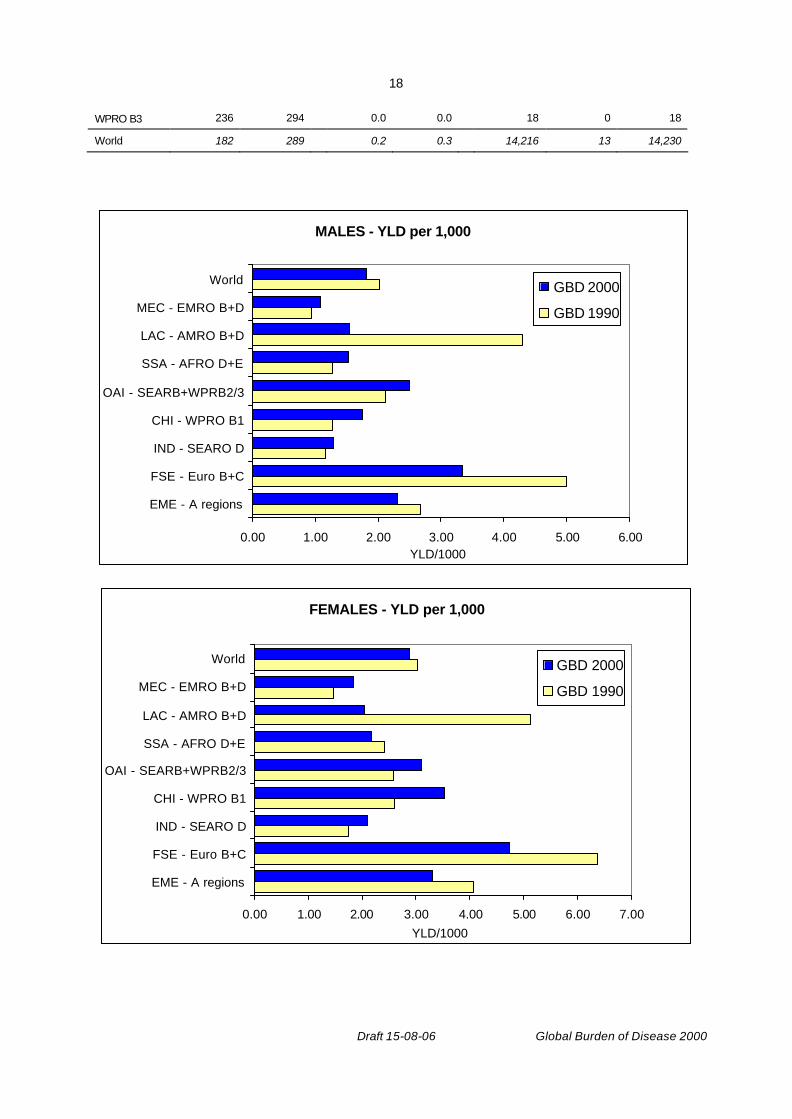
WPRO B3 236 294 0.0 0.0 18 0 18
World 182 289 0.2 0.3 14,216 13 14,230
MALES - YLD per 1,000
0.00 1.00 2.00 3.00 4.00 5.00 6.00
EME - A regions
FSE - Euro B+C
IND - SEARO D
CHI - WPRO B1
OAI - SEARB+WPRB2/3
SSA - AFRO D+E
LAC - AMRO B+D
MEC - EMRO B+D
World
YLD/1000
GBD 2000
GBD 1990
FEMALES - YLD per 1,000
0.00 1.00 2.00 3.00 4.00 5.00 6.00 7.00
EME - A regions
FSE - Euro B+C
IND - SEARO D
CHI - WPRO B1
OAI - SEARB+WPRB2/3
SSA - AFRO D+E
LAC - AMRO B+D
MEC - EMRO B+D
World
YLD/1000
GBD 2000
GBD 1990
19
Draft 15-08-06 Global Burden of Disease 2000
Figure 7.1. OA YLD rates, by sex, broad regions, 1990 and 2000.
MALES - Global YLD per 1,000 by age
0.00
1.00
2.00
3.00
4.00
5.00
6.00
7.00
8.00
0 20 40 60 80 100
YL
D/1
000
GBD 1990
GBD 2000
FEMALES - Global YLD per 1,000 by age
0.00
2.00
4.00
6.00
8.00
10.00
12.00
14.00
0 20 40 60 80 100
YLD
/100
0
GBD 1990
GBD 2000
20
Draft 15-08-06 Global Burden of Disease 2000
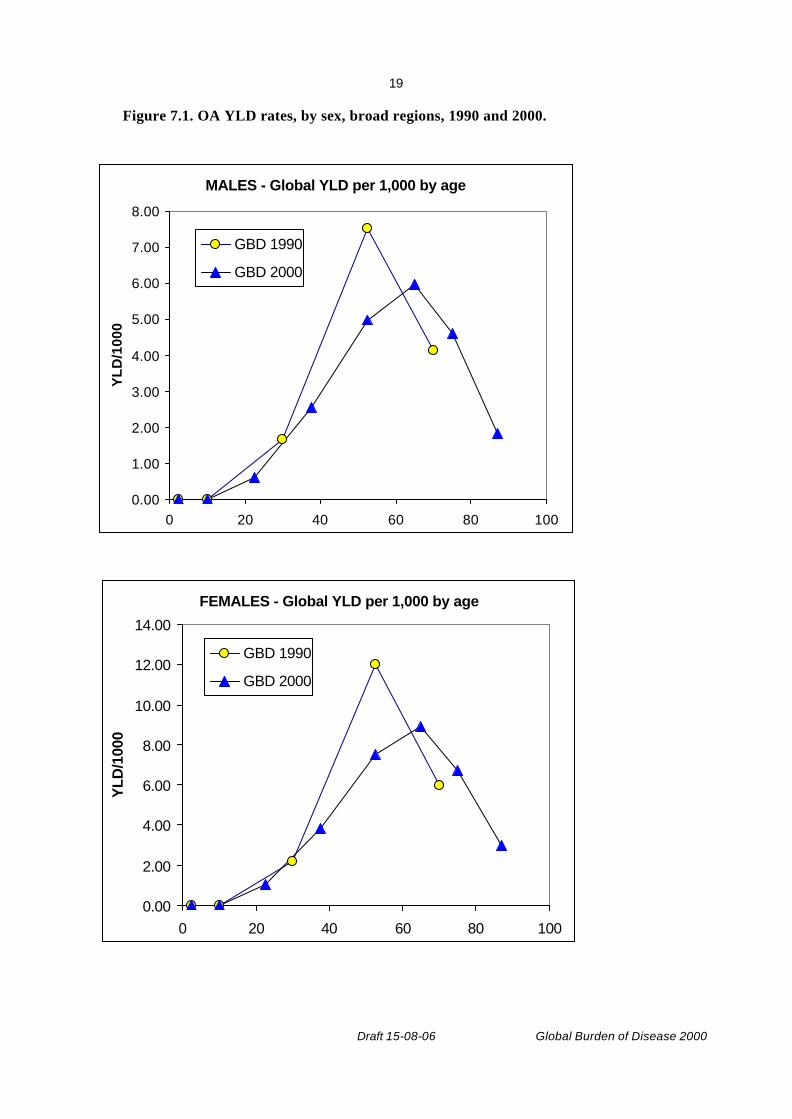
Figure 7.2. Global OA YLD rates, by age and sex, 1990 and 2000.
8. Uncertainty analysis General methods for uncertainty analysis of estimates for the Global Burden of Disease 2000 are outlined elsewhere (70). Uncertainty analysis for OA is currently underway.
9. Conclusions These are version 2 estimates for the GBD 2000. Apart from the uncertainty analysis, updating estimates to reflect revisions of mortality estimates and any new or revised epidemiological data or evidence, it is not intended to undertake any major addition revision of these estimates. It will be important to fill some of the major gaps in population studies – for example in Eastern Europe, South America and Africa – for future burden of disease analyses, although it is possible to move forward with uncertain estimates of numbers rather than delaying progress by waiting for more precise figures. Uncertainty intervals will be provided for OA burden estimates.
We welcome comments and criticisms of these draft estimates, and information on additional sources of data and evidence. Please contact Colin Mathers (EBD/GPE) on email [email protected]
Acknowledgements We particularly wish to thank Dorothy Pattison (University of Manchester) for assistance with literature reviews, Christina Bernard (EBD/GPE, WHO) for assistance with literature reviews and burden of disease analysis, including development of DISMOD models for all regions, and Jennifer Wong for assistance with referencing. We thank the Bone and Joint Decade Monitor Group, and its chair, Anthony Woolf, for advice and assistance.
The authors also thank the many staff of the Global Program on Evidence for Health Policy who contributed to the development of life tables and cause of death analysis. In particular we thank Omar Ahmad, Brodie Ferguson, Mie Inoue, Alan Lopez, Rafael Lozano Doris Ma Fat, Christopher Murray and Chalipati Rao,. This study has been supported by a grant from the National Institute on Aging, USA (1-PO1-AG17625). Bruce Pfleger was also supported by a grant from Pfizer, Incorporated.
21
Draft 15-08-06 Global Burden of Disease 2000
Reference List
(1) Altman R, Asch E, Bloch D, Bole G, Borenstein D, Brandt K et al. Development of criteria for the classification and reporting of osteoarthritis. Classification of osteoarthritis of the knee. Diagnostic and Therapeutic Criteria Committee of the American Rheumatism Association. Arthritis & Rheumatism 1986; 29(8):1039-1049
(2) Brandt KD, Mankin HJ, Shulman LE. Workshop on Etiopathogenesis of Osteoarthritis. Journal of Rheumatology 1986; 13:1126-1160
(3) Brooks PM. Rheumatology. Medical Journal of Australia (Practice Essentials) 1998;8-45
(4) Murray CJL, Lopez AD. Mortality by Cause for Eight Regions of the World> Global Burden of Disease Study. 1997
(5) World Health Organization. World Health Report 2002. Reducing Risks, Promoting Healthy Life. Geneva: WHO, 2002. (www.who.int/whr).
(6) Kellgren JH, Lawrence JS. Osteoarthritis and disk degeneration in an urban population. Annals of 1958; 17:388-397
(7) Lawrence RC, Hochberg MC, Kelsey JL. Estimates of the prevalence of selected arthritis and musculoskeletal diseases in the United States. Journal of Rheumatology 1989;(16):427-441
(8) Altman R, Alarcon G, Appelrouth D, Bloch D, Borenstein D, Brandt K et al. The American College of Rheumatology criteria for the classification and reporting of osteoarthritis of the hip. Arthritis & Rheumatism 1991; 34(5):505-514
(9) Altman R, Alarcon G, Appelrouth D, Bloch D, Borenstein D, Brandt K et al. The American College of Rheumatology criteria for the classification and reporting of osteoarthritis of the hand. Arthritis & Rheumatism 1990; 33(11):1601-1610
(10) Murray CJL, Lopez AD. Global Health Statistics. Cambridge: Harvard University Press, 1996
(11) Spector TD, Hart DJ, Leedham-Greene M. The prevalence of knee and hand osteoarthritis in the general population using differnt clinical criteria: The Chingford Study. Arthritis and Rheumatology 1991; 34(9)
(12) Mathers CD, Vos T, Stevenson C. The burden of disease and injury in Australia. Australian Institute of Health and Welfare, Canberra: AIHW, 1999
(13) March LM, Brnabic AJ, Skinner JC, Schwarz JM, Finnegan T, Druce J et al. Musculoskeletal disability among elderly people in the community. Medical Journal of Australia 1998; 168(9):439-442

22
Draft 15-08-06 Global Burden of Disease 2000
(14) Silman AJ, Hochberg MC. Epidemiology of the rheumatic diseases. Oxford: Oxford University Press, 1993
(15) Anderson JJ, Felson DT. Factors associated with osteoarthritis of the knee in the First National Health and Nutrition Examination Survey: evidence for an association with overweight, race and physical demands of work. American Journal of Epidemiology 1988; 128:179-189
(16) Tepper S, Hochberg MC. Factors associated with hip osteoarthritis: data from the First National Health and Nutrition Examination Survey (NHANES-I). American Journal of Epidemiology 1993; 137(10):1081-1088
(17) Bremner JM, Lawrence JS, Miall WE. Degenerative joint disease in a Jamaican rural population. Annals of the Rheumatic Diseases 1968; 27(4):326-332
(18) Solomon L, Beighton P, Lawrence JS. Rheumatic disorders in the South African Negro. Part II. Osteo-arthrosis. South African Medical Journal 1975; 49(42):1737-1740
(19) Solomon L, Beighton P, Lawrence JS. Osteoarthrosis in a rural South African Negro population. Annals of the Rheumatic Diseases 1976; 35(3):274-278
(20) Hoaglund FT, Yau AC, Wong WL. Osteoarthritis of the hip and other joints in southern Chinese in Hong Kong. Journal of Bone & Joint Surgery - American Volume 1973; 55(3):545-557
(21) Lawrence JS, Bremner JM, Bier F. Osteo-arthrosis. Prevalence in the population and relationship between symptoms and x-ray changes. Annals of the Rheumatic Diseases 1966; 25(1):1-24
(22) Roberts J, Burch TA. Prevalence of osteoarthritis in adults by age, sex race and geographic area: United States1960-2. Series 11 ed. Washington, DC: USDHEW, 1966
(23) Mikklesen WM, Dodge HJ, Duff IF. Estimates of the prevalence of rheumatic diseases in the population of Tecumseh, Michigan. Chronic Diseases 1967; 20:351-369
(24) Mikklesen WM, Duff IF, Dodge HJ. Age-sex-specific prevalance of radiographic abnormalities of the joints of the hands, wrists and cervical spine of the adult residents of Tecumseh, Michigan Health Study Area. Journal for Chronic Disease 1970; 23:151-159
(25) Bennett PH, Burch TA. Osteoarthritis in the Blackfeet and Pima Indians. Population Studies of the rheumatic diseases 1968;407-412
(26) Tzonchev VT. Prevalence of osteoarthrisits in Bulgaria. In: Bennett PH, Wood PHN, editors. Population studies in the rheumatic diseases. Excerpta Medica, 1968: 413-415
(27) Basic data on arthritis knee, hip and sacroliac joints in adults ages 25-74 years, United States, 1971-5. Series 11 ed. Washington, D.C.: USDHEW, 1979
23
Draft 15-08-06 Global Burden of Disease 2000
(28) Beighton SW, DeLa Harpe AL, VanStaden DA. The prevalence of osteoarthritis in a rural African community. British Journal of Rheumatology 1985; 24:321-325
(29) Bergstrom G, Bjelle A, Sorenson LB, Sundh V, Svanborg A. Prevalence of Rheumatoid Arthritis. Osteoarthritis and gouty arthritis at age 79. Journal of Rheumatology 1986; 13:527-534
(30) Felson DT, Naimark A, Anderson J, Kazis L, Castellani W, Meenan RF. The Prevalence of Knee Osteoarthritis in the elderly. Arthritis and Rheumatology 1987; 30:914-918
(31) Butler WJ, Hawthorne VM, Mikklesen WM. Prevalence of Radiologically defined osteoarthritis in the finger and wrist joints of adult residnets of Techumseh, Michigan 1962-5. Clinical Epidemiology 1988; 41:467-473
(32) van Saase JL, van Romunde LK, Cats A, Vandenbroucke JP, Valkenburg HA. Epidemiology of osteoarthritis: Zoetermeer survey. Comparison of radiological osteoarthritis in a Dutch population with that in 10 other populations. Annals of the Rheumatic Diseases 1989; 48(4):271-280
(33) Kelsey JL. Prevalence Studies of the epidemiology of osteoarthritis. Epidemiology of the Rheumatic Diseases 1984;282-288
(34) Lawrence JS. Rheumatism in populations 1977;98-155
(35) Davis MA, Ettinger WH, Neuhaus JM, Hauck WW. Sex differences in osteoarthritis of the knee. The role of obesity. American Journal of Epidemiology 1988; 127(5):1019-1030
(36) Felson DT. Epidemiology of hip and knee osteoarthritis. Epidemiologic Reviews 1988; 10:1-28
(37) NHANES I: Basic data on arthritis: knees, hip and sacro-iliac joints. Adults ages 25-74 years. United States 1971-1975. U.S. Department of Health, Education and Welfare,
(38) Carmona L. The prevalence of 6 rheumatic disease in the Spanish population. Annals of the Rheumatic Diseases 2000;
(39) Valkenburg HA. Clinical versus radiological osteoarthritis in the general population. In: Peyron JG, editor. Epidemiology of osteoarthritis. Paris: Ciba-Geigy, 1980: 53-58
(40) Gibson T, Hameed K, Kadir M, Sultana S, Fatima Z, Syed A. Knee pain amongst the poor and affluent in Pakistan. British Journal of Rheumatology 1996; 35(2):146-149
(41) Chopra A. The Bhigwan COPCORD: methodology and first information report. APLAR Journal of Rheumatology 1997; 1(1):145
(42) Tamaki M, Koga Y. Osteoarthritis of the knee joint: a field study. Nippon Seikeigeka Gakkai Zasshi - Journal of the Japanese Orthopaedic Association 1994; 68(9):737-750

24
Draft 15-08-06 Global Burden of Disease 2000
(43) Pogrund H, Rutenberg M, Makin M, Robin G, Menczel J, Steinberg R. Osteoarthritis of the hip joint and osteoporosis: a radiological study in a random population sample in Jerusalem. Clinical Orthopaedics & Related Research 1982;(164):130-135
(44) Danielsson L, Lindberg H. Prevalence of coxarthrosis in an urban population during four decades. Clinical Orthopaedics & Related Research 1997;(342):106-110
(45) Ingvarsson T. Prevalence and inheritance of hip osteoarthritis in Iceland. Acta Orthopaedica Scandinavica 2000; Supplementum. 298:1-46
(46) Plato CC, Norris AH. Osteoarthritis of the hand: longitudinal studies. American Journal of Epidemiology 1979; 110:740-6
(47) Sowers M, Zobel D, Weissfeld L, Hawthorne VM, Carman W. Progression of osteoarthritis of the hand and metacarpal bone loss: a twenty year following of incident cases. Arthritis and Rheumatology 1991; 34:36-42
(48) Oliveria SA, Felson DT, Reed JI, Cirillo PA, Walker AM. Incidence of symptomatic hand, hip, and knee osteoarthritis among patients in a health maintenance organization. Arthritis & Rheumatism 1995; 38(8):1134-1141
(49) Symmons DP. Musculoskeletal disorders (draft chapter). The Burden of Disease Global and Regional Estimates for 1990. 1996:
(50) Davis MA, Neuhaus JM, Ettinger WH, Muller WH. Body fat distribution and osteoarthritis. American Journal of Epidemiology 1990; 132:701-707
(51) Kellgren JH, Lawrence JS. Rheumatism in Coal Miners II: XRay Study. British Journal of Indepemdent Medicine 1952; 9:197-207
(52) Partridge REH, Duthie JJR. Rheumatism in dockers and civil servants: a comparison of heavy manual and sedentary workers. Annals of the Rheumatic Diseases 1968; 27:559-568
(53) Croft P, Coggon D, Cruddas M, Cooper C. Osteoarthritis of the hip:an occupational disease in farmers. British Medical Journal 1992; 304:1269-1272
(54) Hernborg JS, Nilsson BE. The natural course of untreated osteoarthritis of the knee. Clinical Orthopedics 1977; 123:130-137
(55) Massardo L, Watt I, Cushnaghan J, Dieppe P. Osteoarthritis of the knee joint: an eight year prosoective study. Annals of Rheumatic Disease 1989;(48):893-897
(56) Danielsson LG. Incidence and prognosis of coxarthrosis. Acta Ortho Scandinavica 1964; 66:1-114
25
Draft 15-08-06 Global Burden of Disease 2000
(57) Dougados M, Gueguen A, Nguyen MQ, Thiesce A, Listrat V, Jacob L. Longitudinal radiological evaluation of osteoarthritis of the knee. Journal of Rheumatology 1992; 19:378-384
(58) Hochberg MC, Lawrence RC, Everett DF, Cornoni-Huntley J. Epidemiologic associations of pain in osteoarthritis of the knee: data from the National Health and Nutrition Examination Survey and the National Health and Nutrition Examination - I Epidemiologic Follow Up Survey. Seminars in Arthritis Rheumatology 1989; 18:4-9
(59) Lawrence RC, Everett DF, Hochberg MC. Arthritis. Health Status and Well Being of the Elderly: National Health and Nutrition Examination - I Epidemiologic Follow Up Survey 1990;
(60) Davis MS, Ettinger WH, Neuhaus JM, Mallon KP. Knee osteoarthritis and physical functioning: evidence from NHANES I. Epidemiologic Follow-up Survey. Journal of Rheumatology 1991; 18:591-598
(61) Kallman DA, Wigley FM, Scott WWJr, Hochberg MC, Tobin JD. The longitudinal course of hand osteoarthritis in a male population. Arthritis and Rheumatology 1990; 33:1323-1332
(62) Danielsson LG. Incidence and prognosis of coxarthrosis. Acta Ortho Scandinavica 1964; 66:1-114
(63) Perry GH, Smith MJG, Whiteside CG. Spontaneous recovery of the joint space in degenerative hip disease. Annals of Rheumatic Disease 1972; 31:440-448
(64) Hochberg M. Factors associated with osteoarthritis of the hand in males: data from the Baltimore Longitudinal Study of Aging. American Journal of Epidemiology 1991; 134:1121-1127
(65) Brandt KD, Flusser D. Osteoarthritis. Prognosis in the Rheumatic Disease 1991;(11):35
(66) Guccione AA, Felson DT, Anderson JJ. Defining arthritis and measuring functional status in elders: methodological issues in the study of disease and physical disability. American Journal of Public Health 1990; 80(8):945-949
(67) Stouthard M, Essink-Bot M, Bonsel G, Barendregt J, Kramers P. Disability weights for diseases in the Netherlands. Rotterdam: Department of Public Health, Erasmus University, 1997
(68) Ahmad O, Boschi-Pinto C, Lopez AD, Murray CJL, Lozano R, Inoue M. Age standardization of rates: a new WHO standard. GPE Discussion Paper No. 31. Geneva: WHO, 2001.
(69) Murray CJL, Lopez AD, Mathers CD, Stein C. The Global Burden of Disease 2000 project: aims, methods and data sources. GPE Discussion Paper No. 36. Geneva: WHO, 2001.

26
Draft 15-08-06 Global Burden of Disease 2000
(70) Salomon JA, Mathers CD, Murray CJL, Ferguson B. Methods for life expectancy and healthy life expectancy uncertainty analysis. GPE Discussion Paper No. 10. Geneva: WHO. Available on the worldwide web at http://www.who.int/evidence, 2001.