Glen Raven Cover
85
Glen Raven Stream Restoration Mitigation Plan – As-Built Report Alamance County, NC Cape Fear 02 River Basin - Contract # D05011-1 Submitted to: NCDENR-EEP, 1652 Mail Service Center, Raleigh, NC 27699-1652 June 2007
Transcript of Glen Raven Cover

Glen Raven Stream Restoration Mitigation Plan – As-Built Report
Alamance County, NC Cape Fear 02 River Basin - Contract # D05011-1
Submitted to:
NCDENR-EEP, 1652 Mail Service Center, Raleigh, NC 27699-1652
June 2007

Landmark Center II, Suite 220 4601 Six Forks Road Raleigh, NC 27609
Phone: (919) 783-9214 Fax: (919) 783-9266
Project Manager: Joseph J. Pfeiffer, P.W.S.
Email: [email protected]
Design Engineer: Gary M. Mryncza, P.H., P.E. Email: [email protected]

Mitigation Plan Glen Raven Stream Restoration
TABLE OF CONTENTS 1.0 PROJECT BACKGROUND...................................................................................1 1.1 Project Goals and Objectives.......................................................................................1 1.2 Project Structure, Restoration Type and Approach .....................................................1 1.3 Project History, Contacts and Data..............................................................................3 2.0 MONITORING PLAN AND METHODOLOGY 2.1 Monitoring Features ....................................................................................................6 2.2 Monitoring Guidelines.................................................................................................6 2.3 As-Built Conditions.....................................................................................................6 3.0 SUCCESS CRITERIA........................................................................................................6 3.1 Channel Stability .........................................................................................................6 3.2 Vegetation....................................................................................................................7 3.3 Hydrology....................................................................................................................7 4.0 MAINTENANCE AND CONTINGENCY PLAN............................................................7
FIGURES Figure 1. Project Site Vicinity Map.........................................................................................2
TABLES Table 1. Project Restoration Components ..............................................................................3 Table 2. Project Activity and Reporting History....................................................................3 Table 3. Project Contact Table ...............................................................................................4 Table 4. Project Background Table ........................................................................................5 Table 5. Baseline Stream Summary .......................................................................................8-11 Table 6. Morphology and Hydraulic Monitoring Summary...................................................12 Table 7. Stem Counts Arranged by Plots ...............................................................................13
APPENDICES Appendix A. As-Built Plans Appendix B. As-Built Vegetation Monitoring Plot Data Sheets Appendix C. As-Built Cross-Sections and Pebble Counts Appendix D. As-Built Detailed Longitudinal Profile Appendix E. Permanent Photo Station Photos
Mitigation Plan Glen Raven Stream Restoration
EXECUTIVE SUMMARY
The Glen Raven Stream Restoration Site is a full-delivery project that has been developed for the North Carolina Ecosystem Enhancement Program (EEP). The goals of the project include improving water quality, restoring aquatic habitat, and improving riparian habitat. These goals will be accomplished by achieving the following objectives: establishing a stable stream channel, creating a heterogeneous stream bed with distinct pool and riffle features, and planting a riparian buffer with site-appropriate native trees and shrubs. The site is located 1.5 miles northwest of Burlington, North Carolina in Alamance County. It is situated within the 03030002 (Cape Fear 02) Watershed Cataloging Unit (8-digit HUC) and is in a portion of the NCDWQ Priority Sub-basin 03-06-02. The EEP identifies this 8-digit HUC as a Targeted Local Watershed. The project site is part of an approximately 60-acre parcel owned by Catherine Paris Chandler, William S. Chandler, Catherine Preston Chandler and Margaret Chandler-Salinger. The primary land use on the subject property prior to restoration was rangeland. The project restored and enhanced an unnamed tributary to the Haw River (UTHR) and two of its tributaries (UT1 and UT2). The UTHR is a second-order stream that flows south to north through the subject property and is bisected by Gerringer Road. UT1 is a first-order stream that flows east to west before joining UTHR upstream of Gerringer Road. UT2 is also a first-order stream flowing east to west, but joins UTHR downstream of Gerringer Road. The pre-restoration lengths of UTHR, UT1, and UT2 were 2,855, 520, and 320 linear feet, respectively. The project restored 3,317 linear feet of channel using a combination of Priority II and III approaches, and enhanced 450 linear feet using a Priority II approach. The priority II restoration established a bankfull channel with a new floodplain, a channel bed at its existing level in an existing gravel layer and the cross-section dimensions necessary to provide stable flow maintenance and sediment transport. The priority III design generally worked within the existing stream corridor/belt width by adjusting the stream dimension and profile. The priority II enhancement included cross-section modifications, the incorporation of defined pools and riffles, and vegetation stabilization. The UTHR was restored to a Rosgen stream type C4, and UT1 and UT2 were restored to stream type B4c. The riparian buffer was planted with native trees and shrubs. The target vegetative community along UTHR was designed after a Piedmont Alluvial Forest. This community shifts towards a Piedmont Levee Forest along UT1 and UT2. The as-built conditions of the site do not reflect any significant changes from the design. Bedrock was unavoidable in some sections and was used as grade control instead of designed structures in these areas. These changes resulted in minor alterations to the planned profile, but are not anticipated to cause any instability in the stream. Project success will be assessed utilizing the following measurements: stream dimension, pattern, and profile; site photographs, and vegetation sampling. Cross-section and profile measurements should show little or no change from the as-built conditions. If changes do occur, they will be evaluated to determine whether they are minor adjustments associated with settling and increasing stability or whether they indicate movement toward an unstable condition. Riparian vegetation must meet a minimum survival rate of 320 stems/acre after five years. If monitoring indicates that the specified survival rate is not being met, appropriate corrective actions will be developed to include invasive species control, the removal of dead/dying plants and replanting. The site will be monitored beginning in 2007 through 2011 or until the success criteria are achieved. Reports will be submitted to EEP each year.

Mitigation Plan Glen Raven Stream Restoration
1
1.0 PROJECT BACKGROUND The Glen Raven Stream Restoration Site is located 1.5 miles northwest of Burlington, North Carolina in Alamance County (Figure 1). From Raleigh, proceed west on Interstate-40 (I-40). Continue on I-40 West/ I-85 South after they merge near Hillsborough. Take Exit 148 and turn right towards Burlington. Proceed to the split of NC-54/49 and NC-87/100. Turn right heading northwest on NC-87/100. Proceed to the split of NC-87 & NC-100 in Glen Raven. Turn right and travel north 0.15 miles on NC-87. Make a left onto Power Line Road and proceed 0.7 miles. The project site begins just downstream of the Power Line Road culvert.
1.1 Project Goals and Objectives Based on the descriptions of former and reference conditions, the restoration goals and objectives for the project site project are as follows:
Restoration Goals:
Improve water quality by recreating natural conditions of the stream before major anthropogenic disturbances;
Restoring aquatic habitat to enhance native flora and fauna throughout the stream and banks and,
Improve riparian habitat to protect the integrity of the restored stream.
Restoration Objectives: Establish a stable C4 stream channel on the UTHR and a B4c stream channel on UT1 and
UT2, Create a heterogeneous stream bed with distinct pool and riffle features and, Plant a riparian buffer with site-appropriate native trees and shrubs.
1.2 Project Structure, Restoration Type and Approach
The project site became degraded as a result of agricultural activities (poor grazing management) and human disturbances (removal of riparian vegetation and development in the watershed). As a result, the ecological diversity and water quality of the site were adversely affected. The project restored 3,317 linear feet of channel using a combination of Priority II and III approaches, and enhanced 450 linear feet using a Priority II approach. The Priority II restoration established a bankfull channel with a new floodplain, a channel bed at its existing level in an existing gravel layer and the cross-section dimensions necessary to provide stable flow maintenance and sediment transport. The Priority III design generally worked within the existing stream corridor/belt width by adjusting the stream dimension and profile. Enhancement level I was used with a Priority II approach on 450 linear feet to modify cross-sections, incorporate defined pools and riffles, and stabilize vegetation. The UTHR was restored to a Rosgen stream type C4, and UT1 and UT2 were restored to stream type B4c. The riparian buffer was planted with native trees and shrubs. The target vegetative community along UTHR was designed after a Piedmont Alluvial Forest. This community shifts towards a Piedmont Levee Forest along UT1 and UT2. The design bankfull stage equals the floodplain elevation in the new channel (bank height ratio = 1.0). The stream dimension, pattern, and profile are based on the detailed morphological criteria and hydraulic geometry relationships developed from the reference streams.

ÊÚ
§̈¦85
87
100
54
62
61
tu70
²1 0 10.5
Miles
1:63,3601 inch equals 1 miles
ÊÚ Project Site Location
RoadsMajor RiversCities and TownsCounty BoundariesAlamance County
ROCKINGHAMVANCE
WARREN
NASH
FRANKLIN
WAKE
GRANVILLE
Loui sburgFrankl inton
Youngsvil le
Bunn
Henderson
Wake Forest
ÊÚGUILFORD ORANGEALAMANCE
RANDOLPHCHATHAM
CASWELL
Haw River
Alamance County, North Carolina
Gerringer Rd
Power Line Rd
Figure 1. Vicinity Map
ElonCollege
Burlington
Gibsonville

Mitigation Plan Glen Raven Stream Restoration
3
Exi
stin
g Fe
et/A
cres
Typ
e
App
roac
h
As-
Bui
lt L
inea
r Fo
otag
e
Elig
ible
Fo
otag
e*
Miti
gatio
n R
atio
Miti
gatio
n U
nits
Stationing300 R P2 275 lf 275 lf 1.0 275 10+00 - 12+75483 EI P2 450 lf 446 lf 1.5 297 12+75 - 17+25
1,028 R P2 1,071 lf 1,014 lf 1.0 1,014 17+25 - 27+961,045 R P2 1,059 lf 1,000 lf 1.0 1,000 27+97 - 38+56524 R P3 542 lf 501 lf 1.0 501 40+00 - 45+42315 R P3 370 lf 318 lf 1.0 318 50+00 - 53+70
Stream (lf) Buffer (Ac)
3,405 0
*Reflects Easment Exceptions
Reach IVTrib 1
EI = Enhancement I R = Restoration
Trib 2
Mitigation Unit Summations
Riparian Wetland (Ac)
Nonriparian Wetland (Ac)
Total Wetland (Ac)
P2 = Priority IIP3 = Priority III
0 0 0
Reach III
Table 1. Project Restoration ComponentsProject Name: Glen Raven
Project Segment / Reach IDReach IReach II
1.3 Project History, Contacts and Data
The project site watershed drains approximately 697 acres at the downstream project limits. The upper watershed boundary generally follows the Southern Railway alignment (to the south and southeast of the subject property). The southwest boundary extends to Elon College and continues slightly northeast to the intersection of Power Line Road with Walker Road. The western boundary follows Walker Road before turning east to the project limits. NC-87 forms most of the northeast-east drainage boundary. An Anderson Level I classification indicates that the contributing drainage area consists of: urban (43%), forest (37%), agriculture (9%), rangeland (7%), and wetlands/open water (4%) land use/land cover. Project design was completed in October 2006 and construction began in November 2006. Construction was slowed by a wet winter season and ended in April 2007 (Tables 2 & 3). The site is located in an urban setting within the Southern Outer Piedmont ecoregion of the Piedmont physiographic province (Table 4).
Restoration Plan Jan 06 Aug 06 Final Design - Construction Plans N/A Oct 06 Construction N/A Apr 07 Temporary seed mix applied to entire project area N/A Mar 07 Permanent seed mix applied to entire project area N/A Apr 07 Tree plantings completed N/A Apr 07 Mitigation Plan / As-Built (Year 0 Monitoring - Baseline) May 07 May 07
Table 2. Project Activity and Reporting HistoryProject Name: Glen Raven
Activity or ReportData
Collection Completion or
Delivery

Mitigation Plan Glen Raven Stream Restoration
4
Design Firm KCI Associates of NC, P.A. Landmark Center II, Suite 220 4601 Six Forks Rd. Raleigh, NC 27609 Contact: Ms. April Helms Phone: (919) 783-9214 Fax: (919) 783-9266
Construction Contractor KCI Associates of NC, P.A. (ETC) Landmark Center II, Suite 220 4601 Six Forks Rd. Raleigh, NC 27609 Contact: Mr. Dan Kramer Phone: (919) 783-9214 Fax: (919) 783-9266
Planting Contractor H & J Forest Services PO Box 458 Holly Ridge, NC 28445 Contact: Mr. Brian Jarvenin Phone: (910) 512-6754
Seeding Contractor N/A Seed Mix Sources Evergreen Seed
Nursery Stock Suppliers International Paper and Cure Nursery
Monitoring Performers MY-0 - MY-5 KCI Associates of NC, P.A.
Landmark Center, II Suite 220 4601 Six Forks Rd. Raleigh, NC 27609 Contact: Mr. Adam Spiller Phone: (919) 783-9214 Fax: (919) 783-9266
Table 3. Project Contact Table Project Name: Glen Raven

Mitigation Plan Glen Raven Stream Restoration
5
Project County Alamance County Physiographic Region Piedmont Ecoregion Southern Outer Piedmont Project River Basin Cape Fear USGS HUC for Project and Reference 03030002030010 (Cape Fear) UTHR
03030002060110 (Cape Fear) Long Branch 03030002050100 (Cape Fear) UT to Wilkinson
NCDWQ Sub-basin for Project and Reference 03-06-02 (Cape Fear) UTHR 03-06-05 (Cape Fear) Long Branch 03-06-04 (Cape Fear) UT to Wilkinson
Drainage Area 697 Acres Stream Order Second Order Watershed Type (Rural, Urban, Developing, etc.) Developing Watershed LULC Distribution Urban 43%
Ag-Row Crop 9%Ag-Livestock 7%
Forested 37%Water/Wetlands 4%
Watershed impervious cover (%) 43% Rosgen Classification of As-built C4 (UTHR), B4c (UT1, UT2) Reference Site ID Long Branch Creek, UT to Wilkinson Creek NCDWQ Classification for Project Class C, NSW Within EEP Watershed Plan? Yes, Travis, Tickle, and Little Alamance WP Total project acreage of easement 9.6 Acres Total vegetated acreage within easement 9.0 Acres Total planted acreage 9.0 Acres Dominant Soil Types Worsham Sandy Loam
% of Project Easement Fenced 0%
Table 4. Project Background TableProject Name: Glen Raven
Project soil characteristics Poorly drained soils

Mitigation Plan Glen Raven Stream Restoration
6
2.0 MONITORING PLAN AND METHODOLOGY
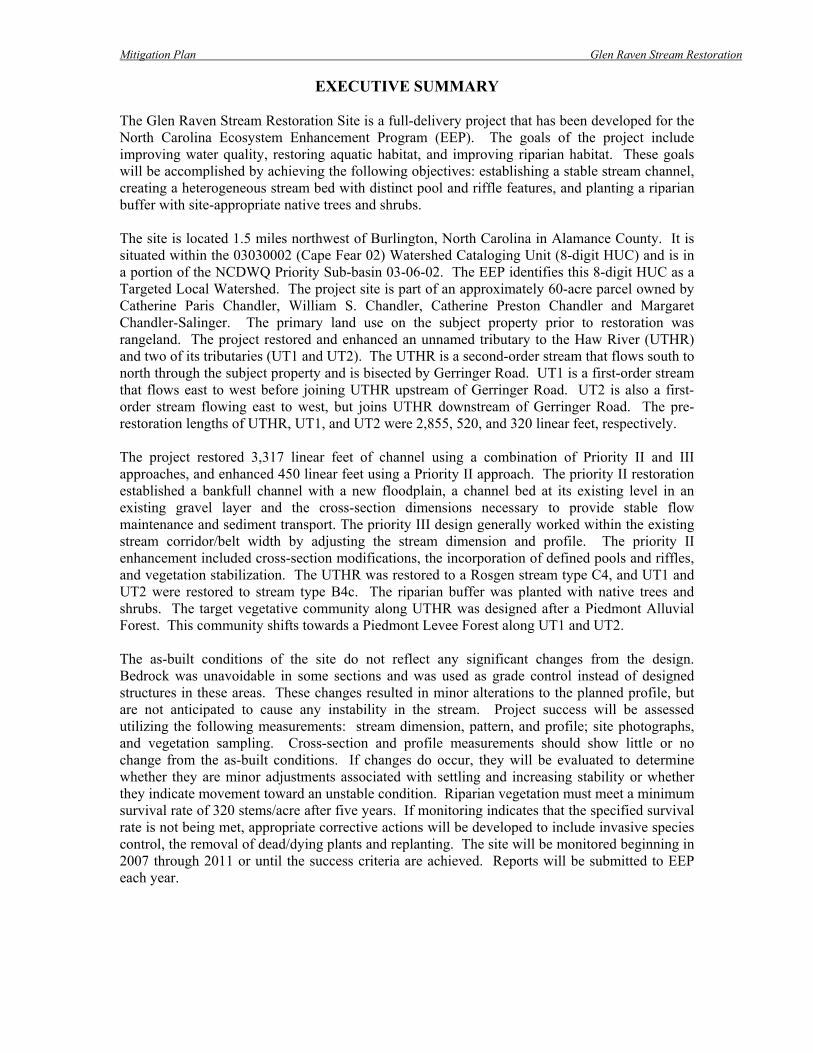
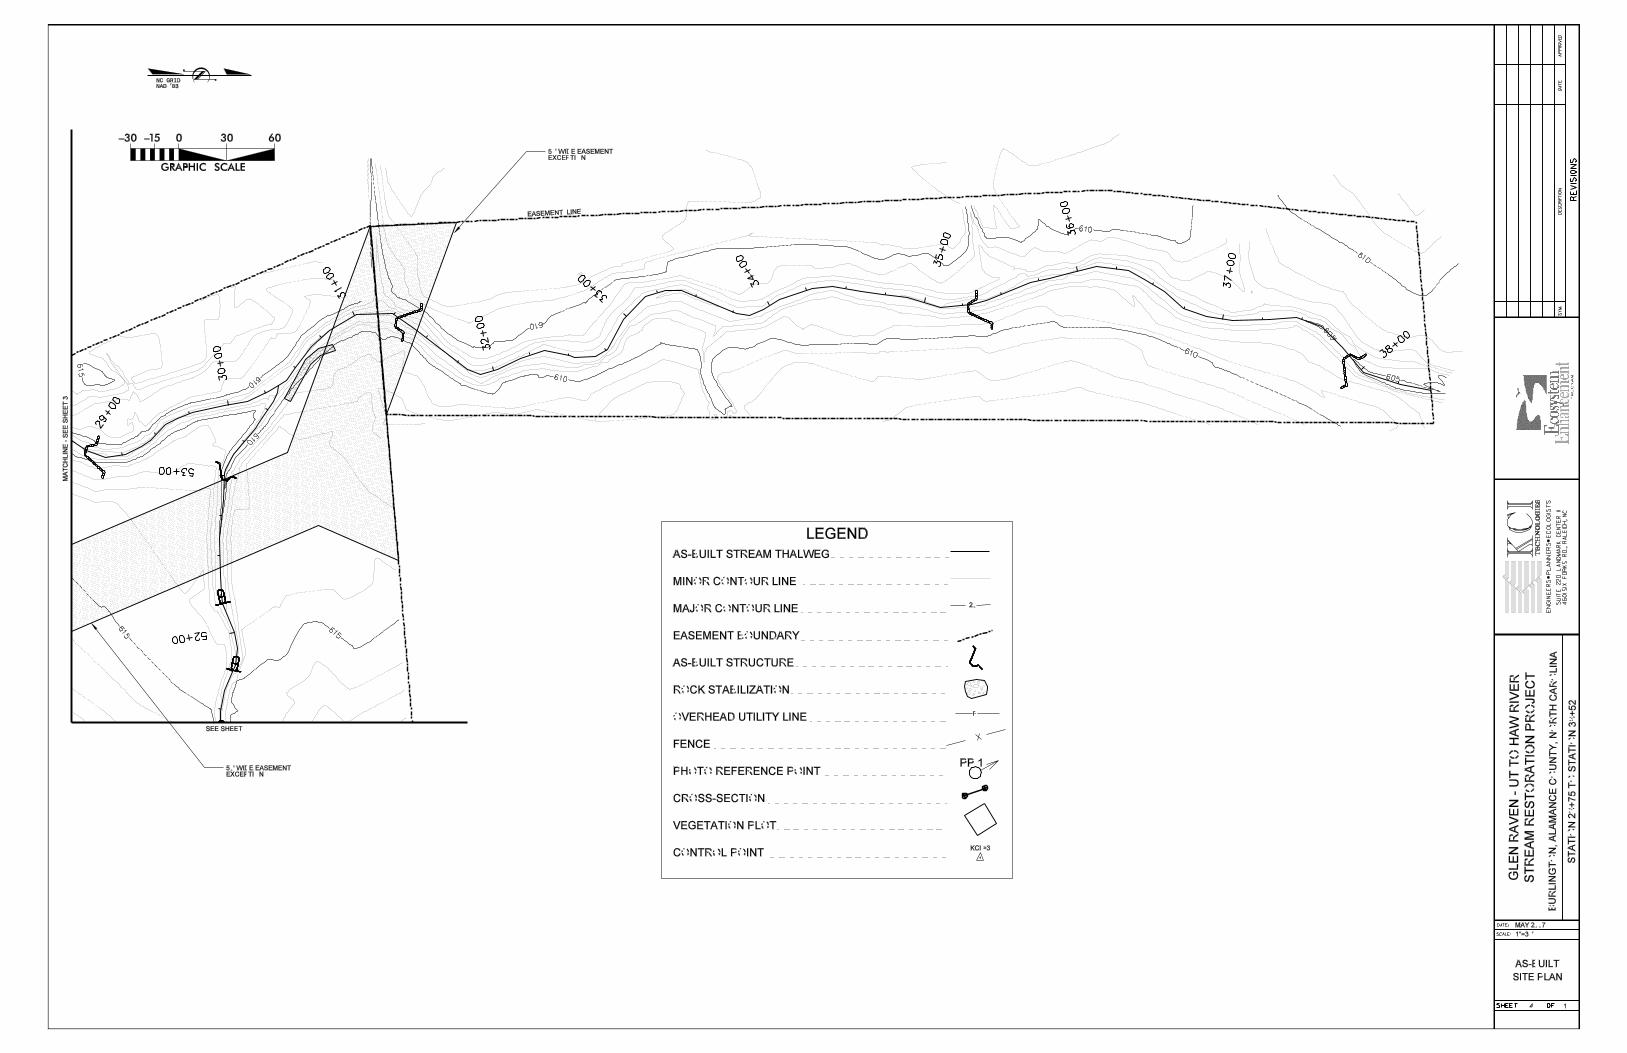
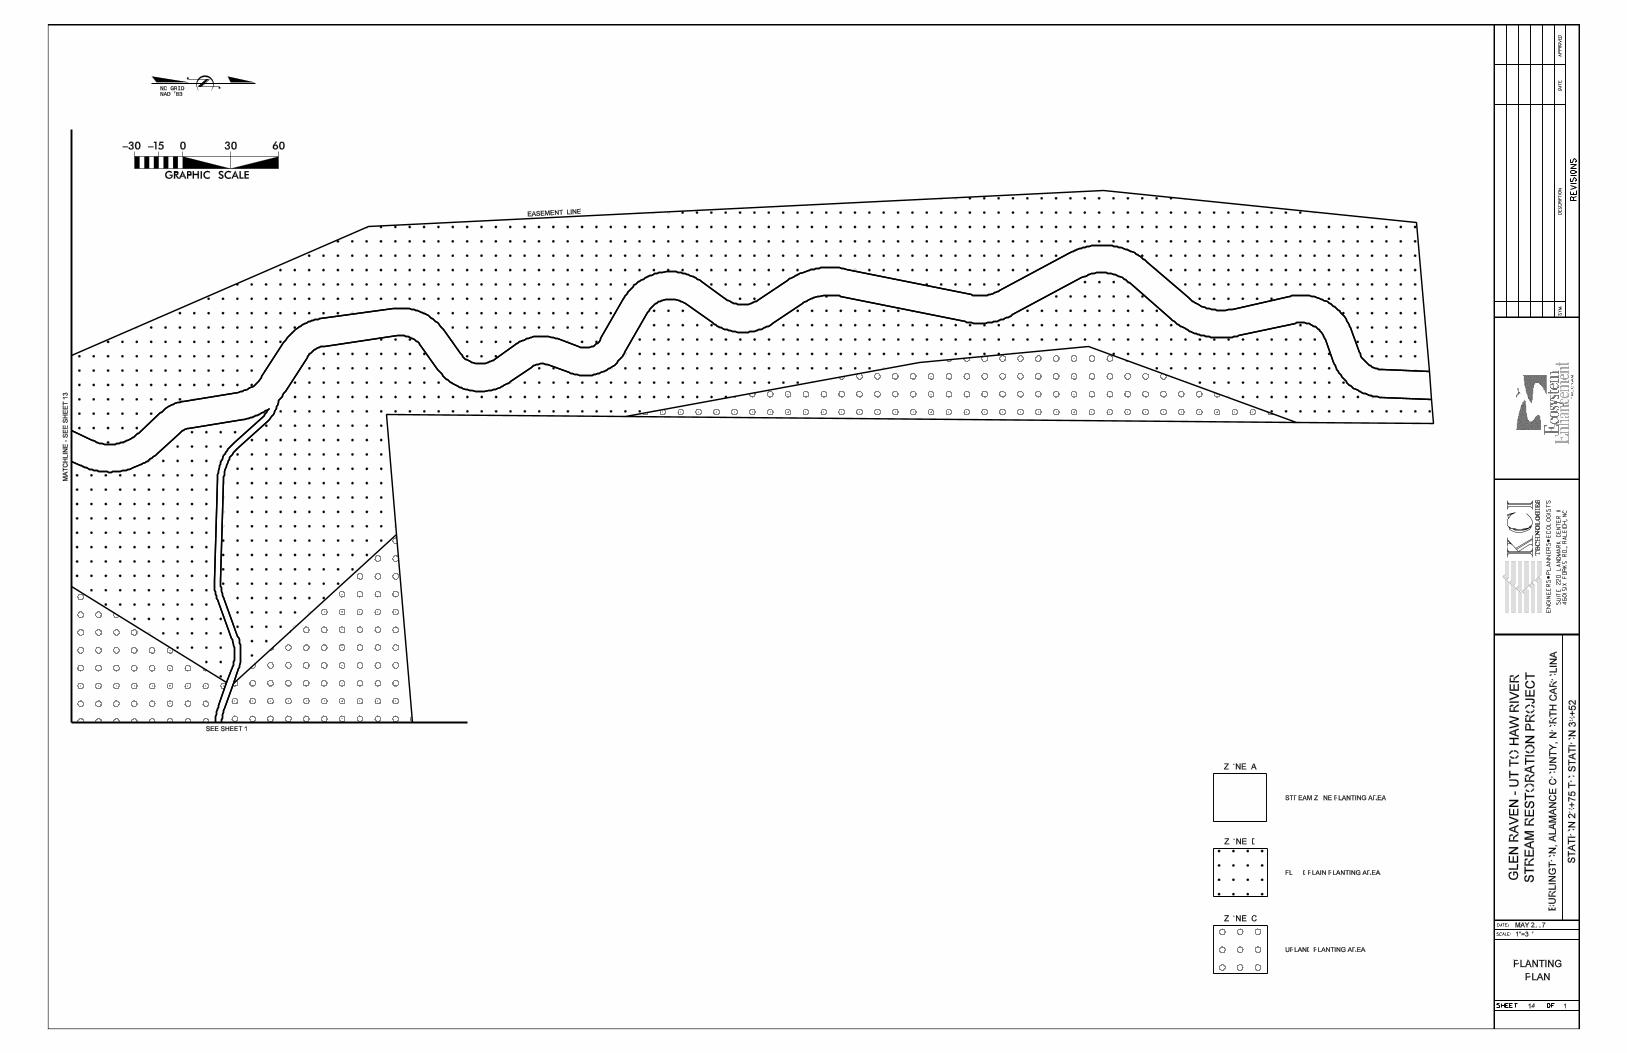
2.1 Monitoring Features Permanent monuments marking monitoring feature locations were established on-site. The beginning and end of each permanent cross-section were marked with rebar set in concrete monuments. Vegetation plots were installed with flagged metal conduit at each corner and flagged PVC pipe at the photo corner. The locations of the permanent photo points are marked in the as-built plan. The stream gauge was installed using permeable PVC pipe and outfitted with a transducer to monitor water surface levels. 2.2 Monitoring Guidelines Eight permanent cross-sections, four riffle and four pool, were established and will be used to evaluate stream dimension. Pebble counts will be performed at each cross section. Six cross-sections were established on the UTHR, four upstream and two downstream of Gerringer Road. Two additional cross-sections were established on UT1. Cross-sections will be surveyed each year using a total station. Cross-sectional data such as area and width to depth ratio will be calculated for each cross-section. Longitudinal profiles will be conducted for all reaches and tributaries. The profiles will be surveyed with a total station and will record feature changes, water surface levels, and bankfull levels. These data will be used to obtain feature lengths and slopes, pool-to-pool spacing and other longitudinal measurements. The longitudinal profile will also be used to calculate planform measurements. Stem counts of planted trees and shrubs will be conducted in the eight 10m x10m permanent vegetation plots. Visual monitoring of the site will be conducted with annual site walks and with site photos taken from 12 permanent photo points located throughout the site. All aspects of these guidelines will continue through year 5 of monitoring. 2.3 As-Built Conditions Baseline monitoring data were collected in May 2007. These data include the detailed profile of all reaches and tributaries, eight cross-sections, pebble counts of four riffles and four pools, eight 10m x 10m vegetation plot stem counts, the installation of a stream gauge, and 12 photo points throughout the site (Tables 5, 6, and 7). The as-built topographic survey was conducted in May 2007. The as-built stream alignment and stream centerline is depicted in the As-Built Plans (Appendix A.) The stream length, to calculate mitigation credit, was based on the length of the as-built stream centerline. The thalweg of the stream was surveyed during the detailed longitudinal profile. The thalweg profile is depicted in the As-Built Detailed Longitudinal Profile (Appendix D.) Bedrock was unavoidable in some sections and was used as grade control instead of designed structures in these areas. These changes resulted in minor alterations to the planned profile, but are not anticipated to cause any instability in the stream. The discrepancies between the design and as-built can be mostly attributed to this issue. Bedrock outcrops created backwater conditions over multiple riffles and caused water slopes to be lower than anticipated. Yearly monitoring will document conditions in these areas to ensure that they do not lead to instability. Channel beltwidth and meander wavelength show inconsistencies between the design and as-built conditions in tables 5a and 5b. These differences were cause by site constraints associated with easement boundaries and bedrock outcroppings. The following structures were not installed due to the aforementioned bedrock issue: cross vanes at stations 10+81, 30+43, and 35+49 (UTHR), and a riffle grade control structure at station 45+00 (UT1). Alterations from the planting plan included the addition of Buttonbush (Cephalanthus occidentalis), and a reduction in the amount of Beautyberry (Callicarpa americana) due to supplier shortages.

Mitigation Plan Glen Raven Stream Restoration
7
3.0 SUCCESS CRITERIA
3.1 Channel Stability To measure stability, cross-section measurements should show little or no change from the as-built cross-sections. If changes do occur, they will be evaluated to determine whether they are minor adjustments associated with settling and increasing stability or whether they indicate movement toward an unstable condition. Annual measurements of the longitudinal profile should indicate stable bedform features with little change from the as-built survey. The pools should maintain their depth with low water surface slopes, while the riffles should remain shallower with steeper water surface slopes. Sediment transport should remain relatively unchanged with respect to aggradation and deposition of sediments. 3.2 Vegetation Riparian vegetation must meet a minimum survival success rate of 320 stems/acre after five years. If monitoring indicates that the specified survival rate is not being met, appropriate corrective actions will be developed to include invasive species control, the removal of dead/dying plants, and replanting. 3.3 Hydrology A minimum of two bankfull events must occur in separate years within the five year monitoring period. If stream gauge data reveal that this criteria is not met, KCI will determine the cause.
4.0 MAINTENANCE AND CONTINGENCY PLAN
Any problems that arise will be dealt with accordingly based on the severity of the problem. Site maintenance may include reinstalling coir matting, removing debris from the channel, stabilizing bank erosion with protective structures, or adjusting in-stream structures. All maintenance activities will be documented in the yearly monitoring reports and any major repairs will be completed only after consultation with the EEP.

Mitigation Plan Glen Raven Stream Restoration
8
Parameter
Dimension Min Max Min Mean MaxBankfull Width (ft) 15.9 15.0 15.8 16.6
Floodprone Width (ft) >40 >62Bankfull Mean Depth (ft) 1.3 1.4 1.6 1.7Bankfull Max Depth (ft) 2.4 2.5 2.6 2.7
Bankfull Cross Sectional Area (ft2) 21.0 21.2 24.7 28.0Width/Depth Ratio 12.0 9.8 10.2 10.6
Entrenchment Ratio >2.5 >3.6Bank Height Ratio 1.0 1.0 1.0 1.0
PatternChannel Beltwidth (ft) 64 80 40 59
Radius of Curvature (ft) 48 80 26 84Rc:Bankfull width (ft/ft) 3.0 5.0 1.7 5.3
Meander Wavelength (ft) 80 239 93 199Meander Width Ratio 5 15 6 13
Riffle Length (ft) 3 19.9 51Riffle Slope (ft/ft) 0.010 0.019 0.001 0.017 0.041
Pool Length (ft) 24 40 5 18 45Pool Spacing (ft) 40 119 17 76 241
Substrate and Transport ParametersSC% / Sa% / G% / C% / B% / Be%
d16 / d35 / d50 / d84 / d95 / dip / disp (mm)
Channel length (ft)Drainage Area (mi2)
Rosgen ClassificationSinuosity
Water Surface Slope (ft/ft)BF slope (ft/ft)
0.0038 0.00480.005
C4 C41.3 1.1
Additional Reach Parameters1,779 1,7960.77 0.77
2.5% / 28% / 61% / 5.5% / - / 3.5%0.8 / 5.0 / 12.1 / 38.5 / 60 / - / -
Profile
Table 5a. Baseline UTHR Upstream Summary (10+00 - 27+96)Project Name: Glen Raven
Design As-built

Mitigation Plan Glen Raven Stream Restoration
9
Parameter
Dimension -Riffle Min Max Min Mean MaxBankfull Width (ft) 17.3 20.9
Floodprone Width (ft) >43 >70.7Bankfull Mean Depth (ft) 1.4 1.3Bankfull Max Depth (ft) 2.7 2.5
Bankfull Cross Sectional Area (ft2) 25.0 28.0Width/Depth Ratio 12.0 15.6
Entrenchment Ratio >2.5 >2.5Bank Height Ratio 1.0 1.0
PatternChannel Beltwidth (ft) 69 87 31 64
Radius of Curvature (ft) 52 87 25 84Rc:Bankfull width (ft/ft) 3.0 5.0 1.2 4.0
Meander Wavelength (ft) 87 260 73 136Meander Width Ratio 4.0 5.0 3.5 6.5
Riffle Length (ft) 7 21 44Riffle Slope (ft/ft) 0.010 0.019 0.001 0.009 0.029
Pool Length (ft) 26 43 6 11 20Pool Spacing (ft) 43 130 32 65 152
SC% / Sa% / G% / C% / B% / Be%d16 / d35 / d50 / d84 / d95 / dip / disp (mm)
Channel length (ft)Drainage Area (mi2)
Rosgen ClassificationSinuosity
Water Surface Slope (ft/ft)BF slope (ft/ft)
Table 5b. Baseline UTHR Downstream Summary (27+97 - 38+56)Project Name: Glen Raven
Design As-built
Profile
Substrate and Transport Parameters7% / 58% / 31% / 4% / - / -
0.14 / 0.26 / 0.5 / 28 / 58 / - / -Additional Reach Parameters
1,073 1,0591.1 1.1C4 C41.3 1.1
0.0038 0.00320.0042

Mitigation Plan Glen Raven Stream Restoration
10
Parameter
Dimension -Riffle Min Max Min Mean MaxBankfull Width (ft) 8.4 10.0
Floodprone Width (ft) 16.0 24.5Bankfull Mean Depth (ft) 0.8 0.9Bankfull Max Depth (ft) 1.7 1.6
Bankfull Cross Sectional Area (ft2) 7.0 8.7Width/Depth Ratio 10.0 11.5
Entrenchment Ratio 1.9 2.5Bank Height Ratio 1.5
PatternChannel Beltwidth (ft) 17 24 14 22
Radius of Curvature (ft) 8.0 25 12 32Rc:Bankfull width (ft/ft) 1.0 3.0 1.2 3.2
Meander Wavelength (ft) 38 65 49 95Meander Width Ratio 4.5 7.7 4.9 9.5
SC% / Sa% / G% / C% / B% / Be%d16 / d35 / d50 / d84 / d95 / dip / disp (mm)
Channel length (ft)Drainage Area (mi2)
Rosgen ClassificationSinuosity
Water Surface Slope (ft/ft)BF slope (ft/ft)
Substrate and Transport Parameters
Table 5c. Baseline UT1 Summary Project Name: Glen Raven
Design As-built
5% / 18% / 65% / 6% / - / 6%1.2 / 6.5 / 14 / 45 / 71 / - / -
Additional Reach Parameters556 5420.1 0.1B4c B4c1.2 1.1
0.009 0.0180.018

Mitigation Plan Glen Raven Stream Restoration
11
Parameter
Pattern Min Max Min Mean MaxChannel Beltwidth (ft) 17 24 15 17
Radius of Curvature (ft) 8.0 25 24 32Meander Wavelength (ft) 38 65 85 100
Channel length (ft)Drainage Area (mi2)
Rosgen ClassificationSinuosity
Water Surface Slope (ft/ft)BF slope (ft/ft)
Table 5d. Baseline UT2 Summary Project Name: Glen Raven
Design As-built
Additional Reach Parameters370 3700.1 0.1B4c B4c
0.025
1.2 1.10.009 0.025

Mitigation Plan Glen Raven Stream Restoration
12
Parameter X-Section 1 X-Section 2 X-Section 3 X-Section 4 X-Section 5 X-Section 6 X-Section 7 X-Section 8Pool Riffle Pool Riffle Riffle Pool Riffle Pool
Reach UTHR (UPS*) UTHR (UPS) UTHR (UPS) UTHR (UPS) UTHR (DS**) UTHR (DS) UT1 UT1
Bankfull Width (ft) 22.7 16.6 20.0 15.0 20.9 26.8 10 14.9Floodprone Width (ft) - >64 - >62 >71 - 24.9 -
Bankfull Mean Depth (ft) 1.9 1.7 1.5 1.4 1.3 1 0.9 0.9Bankfull Max Depth (ft) 3.7 2.7 2.9 2.5 2.5 2.9 1.6 2
Bankfull Cross Sectional Area (ft2) 44.2 28.0 29.6 21.2 28 27.4 8.7 14.1 Bankfull Width/Depth Ratio - 9.8 - 10.6 15.6 - 11.5 -Bankfull Entrenchment Ratio - >3.6 - >4 >3 - 2.5 -
Bankfull Bank Height Ratio - 1 - 1 1 - 1.5 -
d50 (mm) 0.37 17 0.57 7.1 14 0.59 0.5 0.49d84 (mm) 0.72 31 12 46 45 18 28 20
*Upstream reach of UTHR**Downstream reach of UTHR
Table 6. Morphology and Hydraulic Monitoring Summary Project Name: Glen Raven
Dimension
Substrate

Mitigation Plan Glen Raven Stream Restoration
13
1 2 3 4 5 6 7 8ShrubsCallicarpa americana 4 1 5 - -Cephalanthus occidentalis 1 1 - -Ilex verticillata 3 1 1 5 - -Lindera benzoin 1 1 1 3 - -Symphoricarpos orbiculatas 1 1 1 2 1 6 - -TreesBetula nigra 1 1 2 4 - -Cornus amomum 1 1 3 5 - -Fraxinus pennsylvanica 1 2 1 6 10 - -Juglans nigra 9 4 13 - -Platanus occidentalis 3 1 4 - -Quercus sp. 1 3 4 - -Quercus falcata 2 2 - -Quercus michauxii 8 1 2 4 8 23 - -Quercus phellos 1 1 - -Salix sp. 1 1 - -Salix nigra 4 1 2 3 10 - -Salix sericea 2 1 1 1 5 - -Unknown* 5 2 11 8 11 6 3 5 51 - -Unknown I 4 1 2 1 1 9 - -Unknown II 2 1 3 - -Unknown III 2 2 - -*indicates species unknown, all other unknown species (I, II, and III), are distinct species, however unidentifiable at this time.
Table 7: Stem counts arranged by plot.Project Name: Glen Raven
Species Plots Initial Totals
Year 1 Totals
Survival %

Mitigation Plan Glen Raven Stream Restoration
Appendix A
As-Built Plans


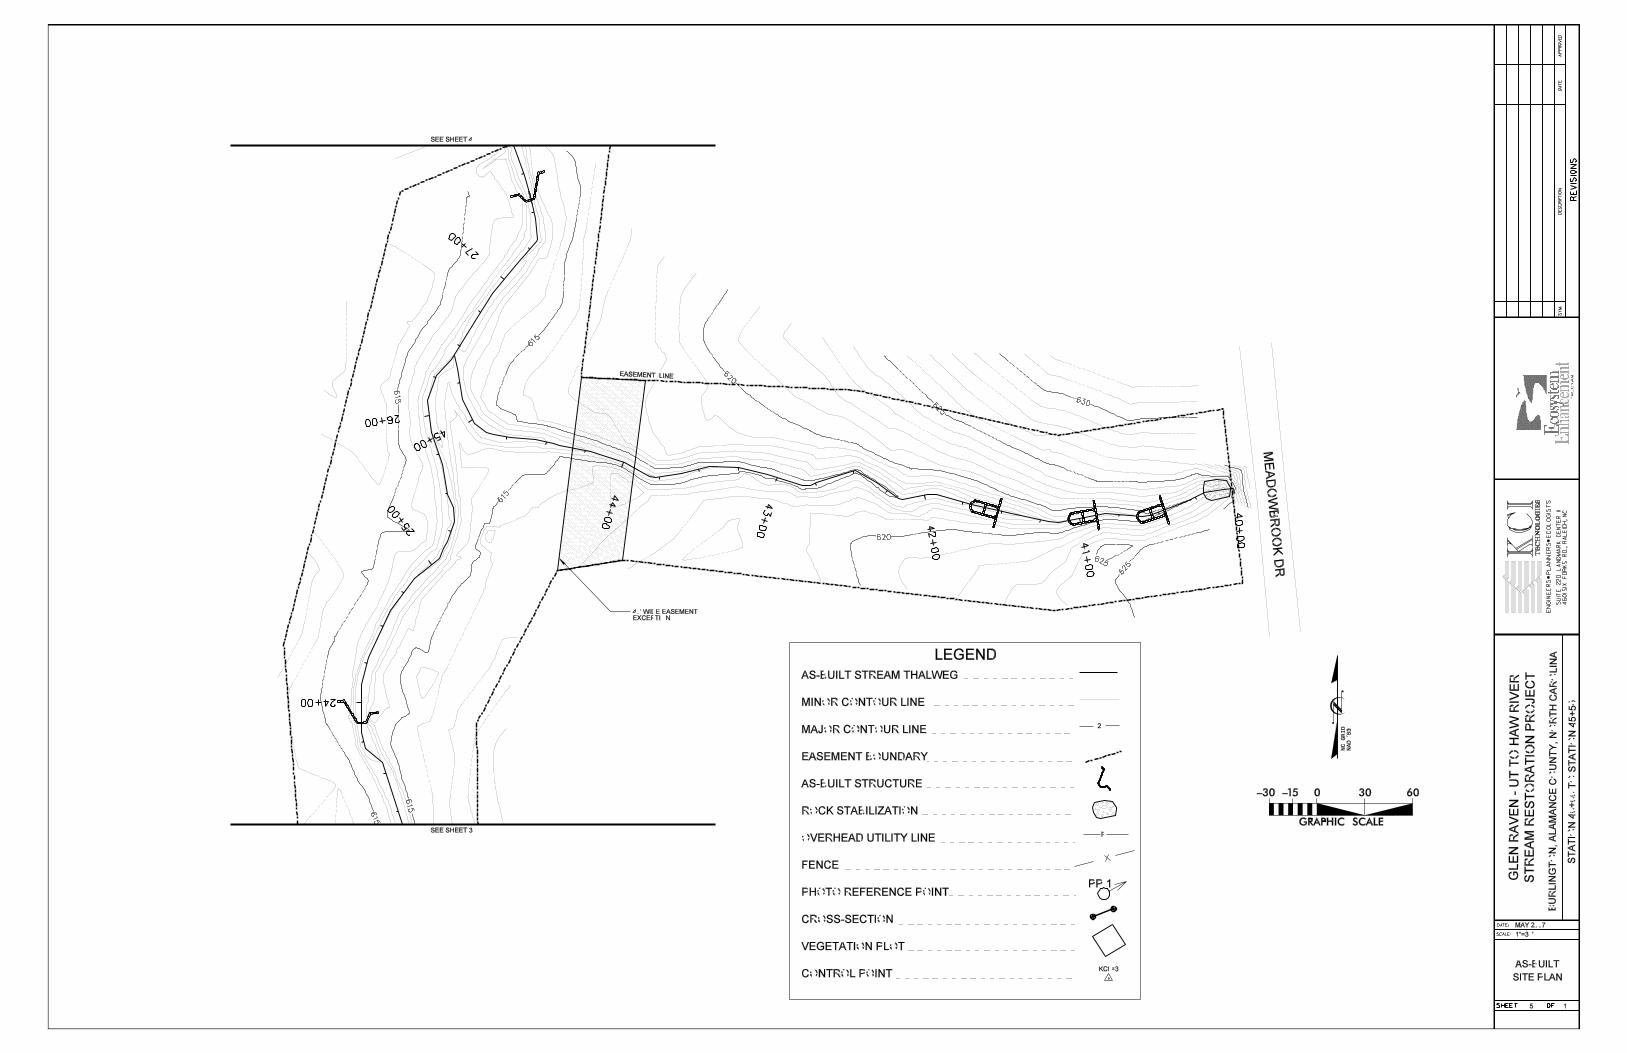


Mitigation Plan Glen Raven Stream Restoration
Appendix B
As-Built Vegetation Monitoring Plot Data Sheets

Site: Plot: 1 Date:
ID Height (m) Vigor
1 0.61 22 0.62 33 0.42 24 0.62 25 0.69 46 0.62 37 0.19 48 0.43 39 0.67 410 0.35 211 0.48 412 0.25 313 0.63 214 0.50 315 0.50 216 0.50 217 0.45 218 0.20 319 0.43 320 0.60 3
Vigor: 4=excellent, 3=good, 2=weak, 1=unlikely to survive year
4/30/2007Glen Raven
Unknown
Beautyberry (Callicarpa americana)Unknown IWinterberry (Ilex verticillata )Unknown I
Winterberry (Ilex verticillata )Unknown UnknownBeautyberry (Callicarpa americana)
Unknown IRiver Birch (Betula nigra)Green Ash (Fraxinus pennsylvanica )Beautyberry (Callicarpa americana)
Beautyberry (Callicarpa americana)Coralberry (Symphoricarpos obiculatas )Quercus sp.Winterberry (Ilex verticillata )
Species
Quercus sp.Unknown IUnknown
Comment
Plot Map
Vegetation Monitoring Worksheet
1
2
3
45
6
7
8
9
12
13
14
10
15
16
Photo Point
PVCMarker
11
17
18
19
20

% survivability
trees / acre
20 trees x 100 = 100Survivability:
Total Number of Trees 20 /
/ 0.025 acres = 800
Species Percent of TotalQuercus sp. 10.0%Coralberry (Symphoricarpos obiculatas ) 5.0%
Unknown
5.0%River Birch (Betula nigra )Green Ash (Fraxinus pennsylvanica ) 5.0%Beautyberry (Callicarpa americana ) 20.0%Winterberry (Ilex verticillata ) 15.0%Unknown I 20.0%
Density:Total Number of Trees 20
20.0%
Previous Current

Site: Plot: 2 Date:
ID Height (m) Vigor
1 0.38 42 0.47 33 0.58 44 0.57 45 0.36 36 0.60 37 0.62 28 0.51 39 0.53 310 0.59 411 0.60 212 0.57 413 0.59 414 0.54 315 0.30 116 0.53 417 0.56 418 0.51 3
Vigor: 4=excellent, 3=good, 2=weak, 1=unlikely to survive year
CommentSpecies
Winterberry (Ilex verticillata )Swamp Chestnut Oak (Quercus michauxii )Unknown ICoralberry (Symphoricarpos obiculatas )Quercus sp.Quercus sp.Quercus sp.Swamp Chestnut Oak (Quercus michauxii )Swamp Chestnut Oak (Quercus michauxii )Swamp Chestnut Oak (Quercus michauxii )UnknownSwamp Chestnut Oak (Quercus michauxii )Green Ash (Fraxinus pennsylvanica )Green Ash (Fraxinus pennsylvanica )UnknownSwamp Chestnut Oak (Quercus michauxii )Swamp Chestnut Oak (Quercus michauxii )Swamp Chestnut Oak (Quercus michauxii )
4/30/2007Glen Raven
Plot Map
Vegetation Monitoring Worksheet
1
2
3 4
5
6
7
8
9
10 11
12
13
17
15
16
14
18
Photo Point
PVCMarker

Density:Total Number of Trees 18
Coralberry (Symphoricarpos obiculatas )
5.6%Quercus sp. 16.7%Unknown IUnknown
11.1%5.6%
Winterberry (Ilex verticillata ) 5.6%Swamp Chestnut Oak (Quercus michauxii ) 44.4%
Species Percent of TotalGreen Ash (Fraxinus pennsylvanica ) 11.1%
/ 0.025 acres = 720
Survivability:Total Number of Trees 18 / 18 trees x 100 = 100 % survivability
trees / acre
Previous Current

Site: Plot: 3 Date:
ID Height (m) Vigor
1 0.40 22 0.45 23 0.34 24 0.67 25 0.49 36 0.55 47 0.57 28 0.61 29 0.57 210 0.22 311 0.65 212 0.58 213 0.61 214 0.45 415 0.55 316 0.58 317 0.63 418 0.55 219 0.61 320 0 421 0 422 0 423 0 224 0 225 0 426 0 427 0 428 0 2
Vigor: 4=excellent, 3=good, 2=weak, 1=unlikely to survive year
Silky Willow (Salix sericea) Live Stake
Comment
Live StakeLive StakeLive Stake
Live StakeLive Stake
Live Stake
Live Stake
Species
Unknown IIUnknownUnknown IIUnknownUnknown IIIUnknown IIUnknownUnknownUnknownSwamp Chestnut Oak (Quercus michauxii )UnknownUnknownUnknownSpicebush (Lindera benzoin)Sycamore (Platanus occidentalis)Sycamore (Platanus occidentalis)Coralberry (Symphoricarpos orbiculatas)Sycamore (Platanus occidentalis)Green Ash (Fraxinus pennsylvanica)Black Willow (Salix nigra)Black Willow (Salix nigra)Black Willow (Salix nigra)Unknown
Live Stake
4/30/2007
Silky Willow (Salix sericea)
Unknown
UnknownBlack Willow (Salix nigra)
Glen Raven
Plot Map
Vegetation Monitoring Worksheet
1 23 4
56789
1 12 13
14
11
16
17
15
Photo Point
PVCMarker
2120
19 18
23 2425 26
27 2822

Density:
14.3%Silky Willow (Salix sericea )
10.7%
Coralberry (Symphoricarpos orbiculatas ) 3.6%Green Ash (Fraxinus pennsylvanica )
Total Number of Trees 28
Unknown
3.6%
Black Willow (Salix nigra )3.6%
Swamp Chestnut Oak (Quercus michauxii ) 3.6%Sycamore (Platanus occidentalis ) 10.7%
Species Percent of TotalSpicebush (Lindera benzoin ) 3.6%
/ 0.025 acres = 1,120
Survivability:Total Number of Trees 28 / 28 trees x 100 = 100 % survivability
trees / acre
Unknown IIUnknown III
7.1%39.3%
Previous Current

Site: Plot: 4 Date:
ID Height (m) Vigor
1 0.33 22 0.31 33 0.36 34 0.58 25 0.37 26 0.52 37 0.42 38 0.30 39 0.15 310 0.30 311 0.57 412 0.14 313 0.59 314 0.38 315 0.70 216 0.32 417 0.20 318 0.40 419 0 220 0 221 0 322 0 423 0 2
Vigor: 4=excellent, 3=good, 2=weak, 1=unlikely to survive year
4/30/2007Glen Raven
Live StakeLive StakeUnknown
Silky Willow (Salix sericea)Black Willow (Salix nigra)Unknown
Black Walnut (Juglans nigra)Black Walnut (Juglans nigra)Black Walnut (Juglans nigra)Unknown
Shagbark Hickory (Carya ovata)Unknown IUnknownUnknown
Black Walnut (Juglans nigra)Shagbark Hickory (Carya ovata)Black Walnut (Juglans nigra)Unknown I
UnknownUnknownBlack Walnut (Juglans nigra)Black Walnut (Juglans nigra)
Species
UnknownBlack Walnut (Juglans nigra)Black Walnut (Juglans nigra)
Comment
Live StakeLive StakeLive Stake
Plot Map
Vegetation Monitoring Worksheet
9
1 2
11 12
13
10
8
3 4
567
Photo Point
PVCMarker
19
18
23
16 17
15 14
22 21 20

% survivability
trees / acre
23 trees x 100 = 100Survivability:
Total Number of Trees 23 /
/ 0.025 acres = 920
Species Percent of TotalBlack Walnut (Juglans nigra ) 39.1%Shagbark Hickory (Carya ovata ) 8.7%Silky Willow (Salix sericea ) 4.3%Black Willow (Salix nigra ) 4.3%Unknown 34.8%Unknown I 8.7%
Density:Total Number of Trees 23
Previous Current

Site: Plot: 5 Date:
ID Height (m) Vigor
1 0.23 22 0.74 33 0.25 24 0.31 25 0.42 26 0.58 37 0.53 48 0.59 29 0.67 410 0.46 211 0.56 212 0.39 213 0.52 314 0.43 415 0.62 216 0.39 217 0.71 218 0 419 0.25 320 0 421 0.40 322 0 323 0 3
Vigor: 4=excellent, 3=good, 2=weak, 1=unlikely to survive year
Comment
Live StakeLive Stake
Live Stake
Species
UnknownRiver Birch (Betula nigra)UnknownUnknownUnknownUnknownCoralberry (Symphoricarpos orbiculatas)UnknownCoralberry (Symphoricarpos orbiculatas)UnknownUnknownUnknown IISwamp Chestnut Oak (Quercus michauxii )Swamp Chestnut Oak (Quercus michauxii )UnknownUnknownUnknownBlack Willow (Salix nigra)Winterberry (Ilex verticulata)Silky Willow (Salix sericea)Spicebush (Lindera benzoin)Black Willow (Salix nigra)Silky Dogwood (Cornus amomum)
Live Stake
4/30/2007Glen Raven
Plot Map
Vegetation Monitoring Worksheet
Photo Point
PVCMarker
3 421
78
6
5
11
12 14
10
13
15
9
16
22
21
20
19
18
17
23

Density:Total Number of Trees 23
Silky Dogwood (Cornus amomum ) 4.3%Silky Willow (Salix sericea ) 4.3%
Spicebush (Lindera benzoin ) 4.3%
Swamp Chestnut Oak (Quercus michauxii ) 8.7%Winterberry (Ilex verticulata ) 4.3%
Coralberry (Symphoricarpos orbiculatas ) 8.7%Black Willow (Salix nigra ) 8.7%
Species Percent of TotalRiver Birch (Betula nigra ) 4.3%
/ 0.025 acres = 920
Survivability:Total Number of Trees 23 / 23 trees x 100 = 100 % survivability
trees / acre
Unknown 47.8%Unknown II 4.3%
Previous Current
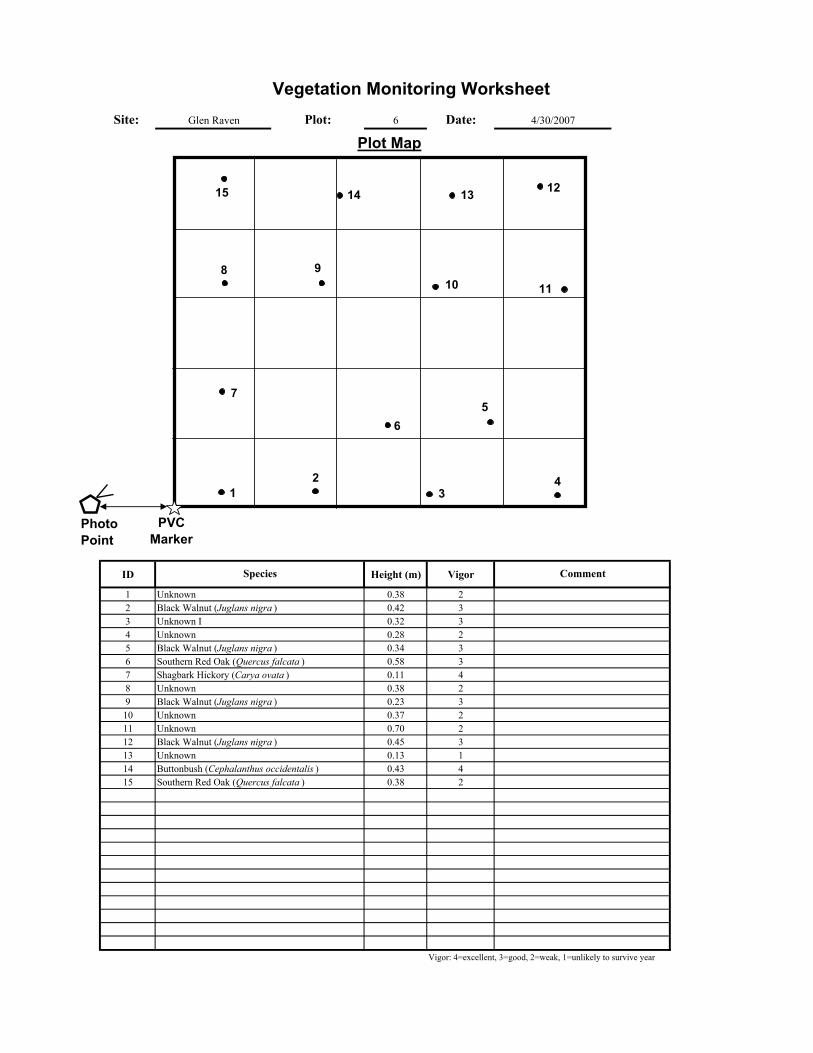
Site: Plot: 6 Date:
ID Height (m) Vigor
1 0.38 22 0.42 33 0.32 34 0.28 25 0.34 36 0.58 37 0.11 48 0.38 29 0.23 310 0.37 211 0.70 212 0.45 313 0.13 114 0.43 415 0.38 2
Vigor: 4=excellent, 3=good, 2=weak, 1=unlikely to survive year
4/30/2007Glen Raven
Black Walnut (Juglans nigra )UnknownButtonbush (Cephalanthus occidentalis )Southern Red Oak (Quercus falcata )
UnknownBlack Walnut (Juglans nigra )UnknownUnknown
UnknownBlack Walnut (Juglans nigra )Southern Red Oak (Quercus falcata )Shagbark Hickory (Carya ovata )
Species
UnknownBlack Walnut (Juglans nigra )Unknown I
Comment
Plot Map
Vegetation Monitoring Worksheet
1098
7
65
21 3
4
Photo Point
PVCMarker
14 13 12
11
15

% survivability
trees / acre
15 trees x 100 = 100Survivability:
Total Number of Trees 15 /
/ 0.025 acres = 600
Species Percent of TotalBlack Walnut (Juglans nigra ) 26.7%Southern Red Oak (Quercus falcata ) 13.3%Shagbark Hickory (Carya ovata ) 6.7%Buttonbush (Cephalanthus occidentalis ) 6.7%Unknown 40.0%Unknown I 6.7%
Density:Total Number of Trees 15
Previous Current

Site: Plot: 7 Date:
ID Height (m) Vigor
1 0.57 42 0.70 43 0 24 0 35 0 46 0 47 0 48 0.27 29 0.51 310 0.51 311 0.59 312 0.55 313 0.62 314 0.60 215 0.48 316 0.54 317 0.53 218 0.51 219 0.31 320 0.51 421 0.40 222 0.59 3
Vigor: 4=excellent, 3=good, 2=weak, 1=unlikely to survive year
Comment
Live Stake Live Stake Live Stake
Species
Willow Oak (Quercus phellos )Swamp Chestnut Oak (Quercus michauxii )UnknownBlack Willow (Juglans nigra )Black Willow (Juglans nigra )Black Willow (Juglans nigra )Silky Dogwood (Cornus amomum )Winterberry (Ilex verticulata )Green Ash (Fraxinus pennsylvanica )Green Ash (Fraxinus pennsylvanica )Green Ash (Fraxinus pennsylvanica )Swamp Chestnut Oak (Quercus michauxii )Green Ash (Fraxinus pennsylvanica )UnknownGreen Ash (Fraxinus pennsylvanica )Swamp Chestnut Oak (Quercus michauxii )Green Ash (Fraxinus pennsylvanica )UnknownSpicebush (Lindera benzoin )Swamp Chestnut Oak (Quercus michauxii )Unknown IGreen Ash (Fraxinus pennsylvanica )
Browsed
Browsed
4/30/2007Glen Raven
Browsed
Live Stake Live Stake
Plot Map
Vegetation Monitoring Worksheet
15
1112
14
10 9
1617
8
76
52
34
1
Photo Point
PVCMarker
20
2122
18
13
19

Unknown I 4.5%
Density:
4.5%Spicebush (Lindera benzoin ) 4.5%
Black Willow (Juglans nigra ) 13.6%Silky Dogwood (Cornus amomum )
Total Number of Trees 22
Unknown 13.6%
Winterberry (Ilex verticulata )4.5%
Green Ash (Fraxinus pennsylvanica ) 31.8%Swamp Chestnut Oak (Quercus michauxii ) 18.2%
Species Percent of TotalWillow Oak (Quercus phellos ) 4.5%
/ 0.025 acres = 880
Survivability:Total Number of Trees 22 / 22 trees x 100 = 100 % survivability
trees / acre
Previous Current

Site: Plot: 8 Date:
ID Height (m) Vigor
1 0.62 42 0.48 23 0.55 44 0.36 35 0.58 36 0.67 47 0.62 38 0.39 39 0.54 310 0.52 311 0.60 312 0 213 0 214 0 215 0 316 0 317 0 218 0 219 0 220 0.57 221 0.5 2
Vigor: 4=excellent, 3=good, 2=weak, 1=unlikely to survive year
4/30/2007Glen Raven
Live Stake
Live Stake
Live Stake Live Stake Live Stake
UnknownCoralberry (Symphoricarpos orbiculatas )
Silky Willow (Salix sericea )Silky Dogwood (Cornus amomum )UnknownSalix sp.
UnknownUnknownSilky Dogwood (Cornus amomum )Silky Dogwood (Cornus amomum )
Swamp Chestnut Oak (Quercus michauxii )Swamp Chestnut Oak (Quercus michauxii )Swamp Chestnut Oak (Quercus michauxii )Swamp Chestnut Oak (Quercus michauxii )
Swamp Chestnut Oak (Quercus michauxii )Swamp Chestnut Oak (Quercus michauxii )Swamp Chestnut Oak (Quercus michauxii )Swamp Chestnut Oak (Quercus michauxii )
Species
River Birch (Betula nigra )UnknownRiver Birch (Betula nigra )
Comment
Live Stake Live Stake
Live Stake
Plot Map
Vegetation Monitoring Worksheet
1412
10 911
13
65
7 8
12
4 3
Photo Point
PVCMarker
191817
1615
21
20

% survivability
trees / acre
21 trees x 100 = 100Survivability:
Total Number of Trees 21 /
/ 0.025 acres = 840
Species Percent of TotalRiver Birch (Betula nigra ) 9.5%Swamp Chestnut Oak (Quercus michauxii ) 38.1%Silky Dogwood (Cornus amomum ) 14.3%Silky Willow (Salix sericea ) 4.8%Salix sp. 4.8%Coralberry (Symphoricarpos orbiculatas ) 4.8%Unknown 23.8%
Density:Total Number of Trees 21
Previous Current

Mitigation Plan Glen Raven Stream Restoration
Appendix C
As-Built Cross Sections and Pebble Counts
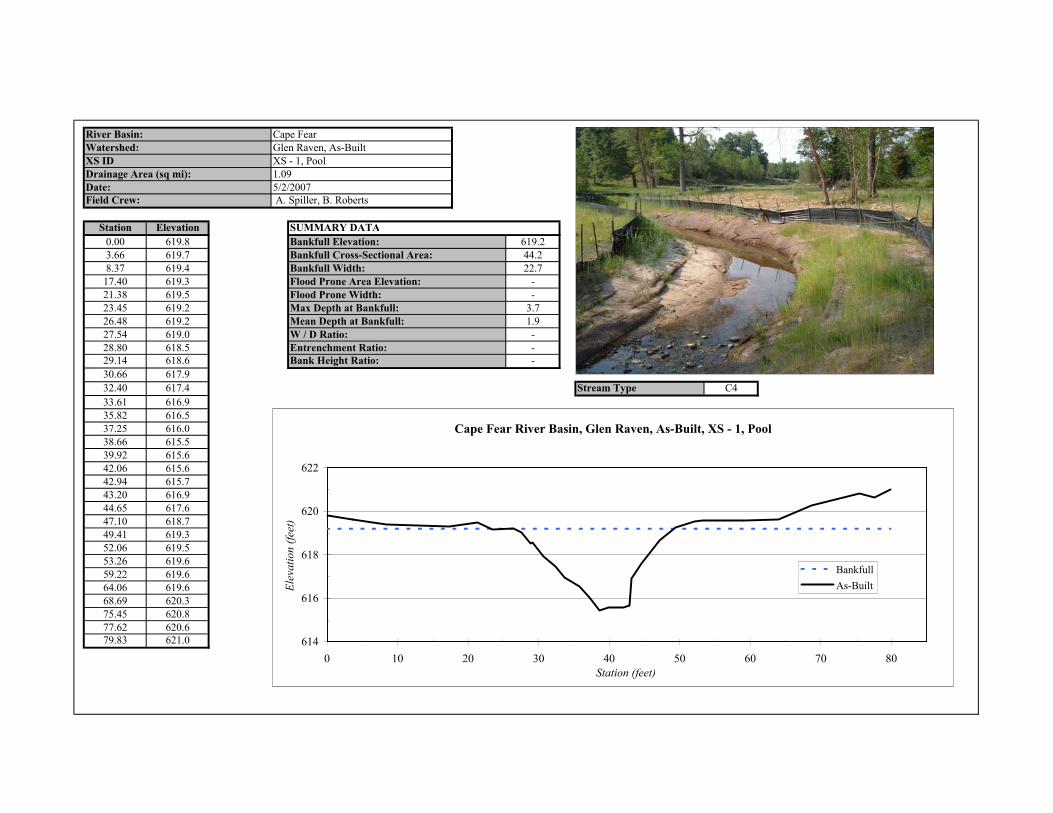
Station Elevation0.00 619.8 619.23.66 619.7 44.28.37 619.4 22.7
17.40 619.3 -21.38 619.5 -23.45 619.2 3.726.48 619.2 1.927.54 619.0 -28.80 618.5 -29.14 618.6 -30.66 617.932.40 617.4 C433.61 616.935.82 616.537.25 616.038.66 615.539.92 615.642.06 615.642.94 615.743.20 616.944.65 617.647.10 618.749.41 619.352.06 619.553.26 619.659.22 619.664.06 619.668.69 620.375.45 620.877.62 620.679.83 621.0
Bankfull Elevation:SUMMARY DATA
Drainage Area (sq mi):
Bankfull Cross-Sectional Area:
Date:Field Crew:
1.095/2/2007 A. Spiller, B. Roberts
Cape FearGlen Raven, As-BuiltXS - 1, Pool
River Basin:Watershed:XS ID
Bankfull Width:Flood Prone Area Elevation:Flood Prone Width:Max Depth at Bankfull:
Stream Type
Mean Depth at Bankfull:
Entrenchment Ratio:Bank Height Ratio:
W / D Ratio:
Cape Fear River Basin, Glen Raven, As-Built, XS - 1, Pool
614
616
618
620
622
0 10 20 30 40 50 60 70 80Station (feet)
Elev
atio
n (fe
et)
BankfullAs-Built
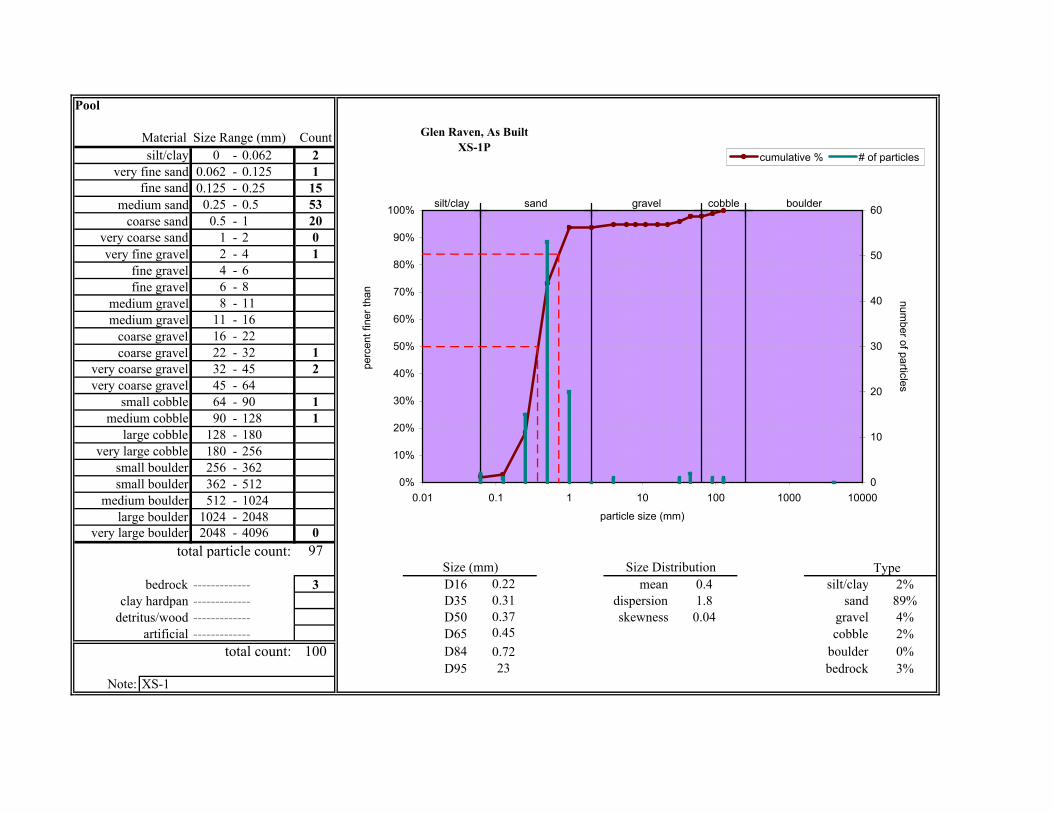
Pool
Material Size Range (mm) Count0 - 0.062 2
very fine sand 0.062 - 0.125 10.125 - 0.25 15
medium sand 0.25 - 0.5 53coarse sand 0.5 - 1 20
very coarse sand 1 - 2 0very fine gravel 2 - 4 1
fine gravel 4 - 6fine gravel 6 - 8
medium gravel 8 - 11medium gravel 11 - 16
coarse gravel 16 - 22coarse gravel 22 - 32 1
very coarse gravel 32 - 45 2very coarse gravel 45 - 64
small cobble 64 - 90 1medium cobble 90 - 128 1
large cobble 128 - 180very large cobble 180 - 256
small boulder 256 - 362small boulder 362 - 512
medium boulder 512 - 1024large boulder 1024 - 2048
very large boulder 2048 - 4096 0total particle count: 97
Typebedrock ------------- 3 D16 0.22 mean 0.4 silt/clay 2%
clay hardpan ------------- D35 0.31 dispersion 1.8 sand 89%detritus/wood ------------- D50 0.37 skewness 0.04 gravel 4%
artificial ------------- D65 0.45 cobble 2%total count: 100 D84 0.72 boulder 0%
D95 23 bedrock 3%Note: XS-1
Size (mm) Size Distribution
silt/clay
fine sand
Glen Raven, As BuiltXS-1P
silt/clay sand gravel cobble boulder
0%
10%
20%
30%
40%
50%
60%
70%
80%
90%
100%
0.01 0.1 1 10 100 1000 10000
particle size (mm)
perc
ent f
iner
than
0
10
20
30
40
50
60
number of particles
cumulative % # of particles

Station Elevation0.00 619.4 618.66.20 619.0 28.0
13.50 618.8 16.615.73 618.8 621.217.12 619.3 >64.919.42 618.9 2.721.57 618.5 1.722.54 618.6 9.824.44 617.7 >3.625.65 616.8 1.026.67 616.528.20 615.9 C429.79 616.031.08 616.031.92 616.034.05 615.935.05 617.136.11 617.737.60 618.238.95 618.540.15 618.941.68 618.746.30 618.651.91 618.755.90 618.757.97 619.459.77 619.164.93 619.3
Stream Type
Mean Depth at Bankfull:
1.095/2/2007 A. Spiller, B. Roberts
W / D Ratio:Entrenchment Ratio:Bank Height Ratio:
Bankfull Width:Flood Prone Area Elevation:
Cape FearGlen Raven, As-BuiltXS - 2, Riffle
River Basin:Watershed:XS ID
Bankfull Elevation:SUMMARY DATA
Drainage Area (sq mi):
Bankfull Cross-Sectional Area:
Date:Field Crew:
Flood Prone Width:Max Depth at Bankfull:
Cape Fear River Basin, Glen Raven, As-Built, XS - 2, Riffle
614
616
618
620
622
0 10 20 30 40 50 60Station (feet)
Elev
atio
n (fe
et)
BankfullFlood Prone AreaAs-Built

Riffle
Material Size Range (mm) Count0 - 0.062 2
very fine sand 0.062 - 0.1250.125 - 0.25 6
medium sand 0.25 - 0.5coarse sand 0.5 - 1 4
very coarse sand 1 - 2 8very fine gravel 2 - 4 4
fine gravel 4 - 6 2fine gravel 6 - 8 6
medium gravel 8 - 11 7medium gravel 11 - 16 7
coarse gravel 16 - 22 14coarse gravel 22 - 32 23
very coarse gravel 32 - 45 9very coarse gravel 45 - 64 2
small cobble 64 - 90 1medium cobble 90 - 128 2
large cobble 128 - 180very large cobble 180 - 256
small boulder 256 - 362small boulder 362 - 512
medium boulder 512 - 1024large boulder 1024 - 2048
very large boulder 2048 - 4096total particle count: 97
Typebedrock --------------------- 3 D16 1.4 3.4 mean 6.6 silt/clay 2%
clay hardpan --------------------- D35 8.7 12 dispersion 7.0 sand 18%detritus/wood --------------------- D50 17 17 skewness -0.35 gravel 74%
artificial --------------------- D65 23 20 cobble 3%total count: 100 D84 31 29 boulder 0%
D95 46 39 bedrock 3%Note: XS-2
Size (mm) Size Distribution
silt/clay
fine sand
Glen Raven, As BuiltXS-2R
silt/clay sand gravel cobble boulder
0%
10%
20%
30%
40%
50%
60%
70%
80%
90%
100%
0.01 0.1 1 10 100 1000 10000
particle size (mm)
perc
ent f
iner
than
0
5
10
15
20
25
number of particles
cumulative % # of particles

Station Elevation0.00 618.0 616.54.12 617.9 29.67.17 617.4 20.0
12.00 617.4 -17.36 616.9 -21.21 616.6 2.922.22 616.4 1.523.30 616.0 -24.99 615.2 -26.09 614.7 -26.40 614.227.40 613.6 C428.45 613.930.35 614.131.33 614.232.21 614.433.20 614.834.85 614.736.45 615.037.63 615.539.90 616.141.83 616.542.93 616.545.42 616.549.85 616.655.5 616.761.0 616.8764.8 616.74
Bankfull Elevation:SUMMARY DATA
Drainage Area (sq mi):
Bankfull Cross-Sectional Area:
Date:Field Crew:
1.095/7/2006 K. Knight, B. Roberts
Cape FearGlen Raven, As-BuiltXS - 3, Pool
River Basin:Watershed:XS ID
Bankfull Width:Flood Prone Area Elevation:Flood Prone Width:Max Depth at Bankfull:
Stream Type
Mean Depth at Bankfull:
Entrenchment Ratio:Bank Height Ratio:
W / D Ratio:
Cape Fear River Basin, Glen Raven, As-Built, XS - 3, Pool
612
614
616
618
620
0 10 20 30 40 50 60Station (feet)
Elev
atio
n (fe
et)
BankfullAs-Built
Pool
Material Size Range (mm) Count0 - 0.062 2
very fine sand 0.062 - 0.125 20.125 - 0.25 21
0.25 - 0.5 230.5 - 1 10
very coarse sand 1 - 2 7very fine gravel 2 - 4 4
4 - 6 16 - 8 6
medium gravel 8 - 11 4medium gravel 11 - 16 12
16 - 22 622 - 32 2
very coarse gravel 32 - 45very coarse gravel 45 - 64
64 - 90medium cobble 90 - 128
128 - 180very large cobble 180 - 256
256 - 362362 - 512
medium boulder 512 - 10241024 - 2048
very large boulder 2048 - 4096total particle count: 100
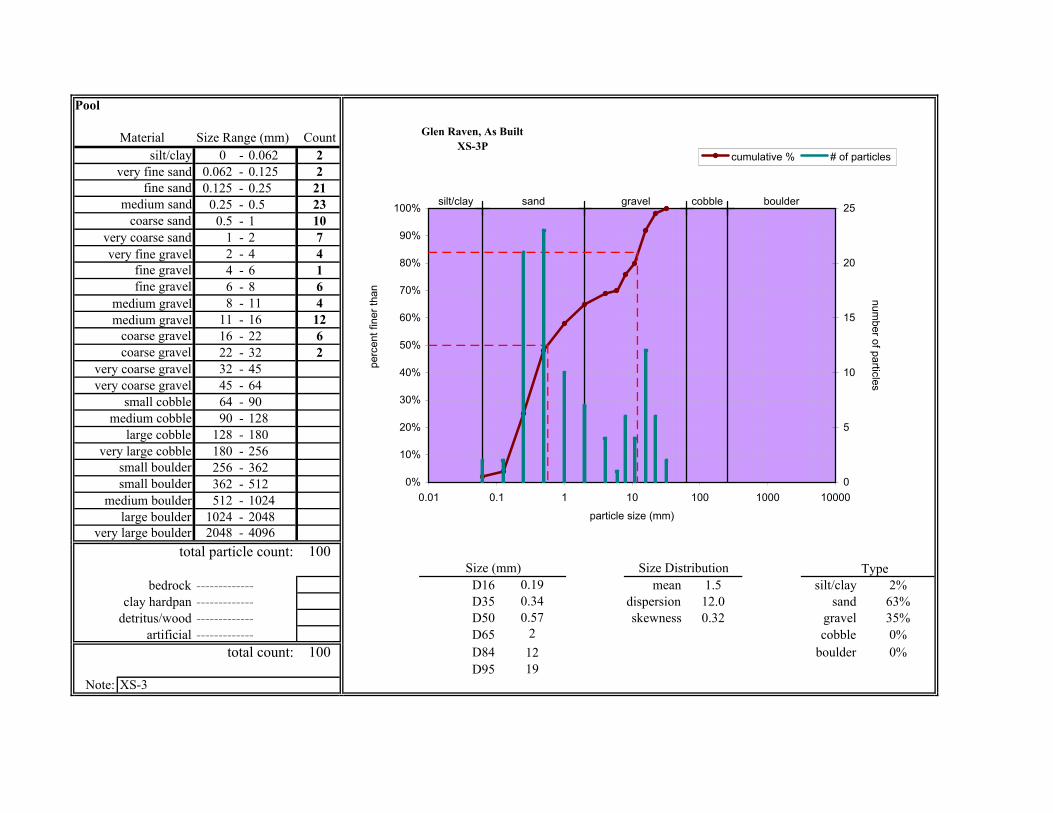
Typebedrock ------------- D16 0.19 mean 1.5 silt/clay 2%
clay hardpan ------------- D35 0.34 dispersion 12.0 sand 63%detritus/wood ------------- D50 0.57 skewness 0.32 gravel 35%
artificial ------------- D65 2 cobble 0%total count: 100 D84 12 boulder 0%
D95 19Note: XS-3
fine gravelfine gravel
small cobble
silt/clay
fine sandmedium sand
coarse sand
coarse gravelcoarse gravel
large cobble
large boulder
Size (mm) Size Distribution
small bouldersmall boulder
Glen Raven, As BuiltXS-3P
silt/clay sand gravel cobble boulder
0%
10%
20%
30%
40%
50%
60%
70%
80%
90%
100%
0.01 0.1 1 10 100 1000 10000
particle size (mm)
perc
ent f
iner
than
0
5
10
15
20
25
number of particles
cumulative % # of particles
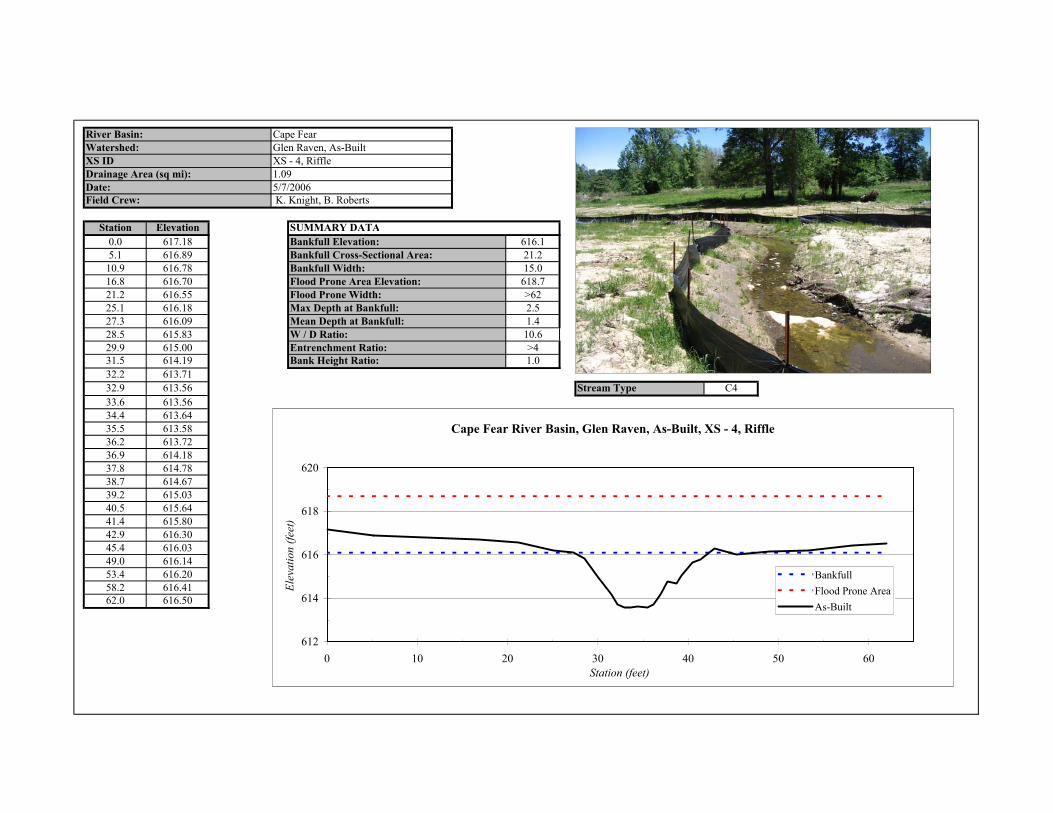
Station Elevation0.0 617.18 616.15.1 616.89 21.2
10.9 616.78 15.016.8 616.70 618.721.2 616.55 >6225.1 616.18 2.527.3 616.09 1.428.5 615.83 10.629.9 615.00 >431.5 614.19 1.032.2 613.7132.9 613.56 C433.6 613.5634.4 613.6435.5 613.5836.2 613.7236.9 614.1837.8 614.7838.7 614.6739.2 615.0340.5 615.6441.4 615.8042.9 616.3045.4 616.0349.0 616.1453.4 616.2058.2 616.4162.0 616.50
Stream Type
Mean Depth at Bankfull:
1.095/7/2006 K. Knight, B. Roberts
W / D Ratio:Entrenchment Ratio:Bank Height Ratio:
Bankfull Width:Flood Prone Area Elevation:
Cape FearGlen Raven, As-BuiltXS - 4, Riffle
River Basin:Watershed:XS ID
Bankfull Elevation:SUMMARY DATA
Drainage Area (sq mi):
Bankfull Cross-Sectional Area:
Date:Field Crew:
Flood Prone Width:Max Depth at Bankfull:
Cape Fear River Basin, Glen Raven, As-Built, XS - 4, Riffle
612
614
616
618
620
0 10 20 30 40 50 60Station (feet)
Elev
atio
n (fe
et)
BankfullFlood Prone AreaAs-Built

Riffle
Material Size Range (mm) Count0 - 0.062 3
very fine sand 0.062 - 0.125 10.125 - 0.25 18
medium sand 0.25 - 0.5 4coarse sand 0.5 - 1 5
very coarse sand 1 - 2 13very fine gravel 2 - 4 2
fine gravel 4 - 6 2fine gravel 6 - 8 6
medium gravel 8 - 11 1medium gravel 11 - 16 7
coarse gravel 16 - 22 8coarse gravel 22 - 32 12
very coarse gravel 32 - 45 4very coarse gravel 45 - 64 9
small cobble 64 - 90 7medium cobble 90 - 128 1
large cobble 128 - 180very large cobble 180 - 256
small boulder 256 - 362small boulder 362 - 512
medium boulder 512 - 1024large boulder 1024 - 2048
very large boulder 2048 - 4096total particle count: 103
Typebedrock --------------------- 4 D16 0.2 3.4 mean 3.0 silt/clay 3%
clay hardpan --------------------- D35 1.3 12 dispersion 21.0 sand 38%detritus/wood --------------------- D50 7.1 17 skewness -0.24 gravel 48%
artificial --------------------- D65 19 20 cobble 7%total count: 107 D84 46 29 boulder 0%
D95 74 39 bedrock 4%Note: XS-4
Size (mm) Size Distribution
silt/clay
fine sand
Glen Raven, As BuiltXS-4R
silt/clay sand gravel cobble boulder
0%
10%
20%
30%
40%
50%
60%
70%
80%
90%
100%
0.01 0.1 1 10 100 1000 10000
particle size (mm)
perc
ent f
iner
than
0
2
4
6
8
10
12
14
16
18
20
number of particles
cumulative % # of particles

Station Elevation0.0 611.0 608.82.6 610.9 28.05.1 610.2 20.9
10.2 609.2 611.313.8 608.8 >70.717.7 608.6 2.622.3 609.0 1.323.6 608.7 15.625.9 608.0 >329.1 607.1 1.030.7 606.532.2 606.3 C434.1 606.235.3 606.336.3 606.837.8 607.239.2 607.940.4 608.242.6 608.644.1 608.847.8 608.955.1 609.062.6 608.965.0 609.268.1 610.270.7 610.7
Bankfull Elevation:SUMMARY DATA
Drainage Area (sq mi):
Bankfull Cross-Sectional Area:
Date:Field Crew:
1.095/14/2007 A. Spiller, B. Roberts
Cape FearGlen Raven, As-BuiltXS - 5, Riffle
River Basin:Watershed:XS ID
Bankfull Width:Flood Prone Area Elevation:Flood Prone Width:Max Depth at Bankfull:
Stream Type
Mean Depth at Bankfull:
Entrenchment Ratio:Bank Height Ratio:
W / D Ratio:
Cape Fear River Basin, Glen Raven, As-Built, XS - 5, Riffle
604
606
608
610
612
0 10 20 30 40 50 60 70Station (feet)
Elev
atio
n (fe
et)
BankfullFlood Prone AreaAs-Built

Riffle
Material Size Range (mm) Count0 - 0.062 5
very fine sand 0.062 - 0.1250.125 - 0.25 1
medium sand 0.25 - 0.5 2coarse sand 0.5 - 1 4
very coarse sand 1 - 2 11very fine gravel 2 - 4 8
fine gravel 4 - 6fine gravel 6 - 8 7
medium gravel 8 - 11 1medium gravel 11 - 16 12
coarse gravel 16 - 22 11coarse gravel 22 - 32 8
very coarse gravel 32 - 45 9very coarse gravel 45 - 64 9
small cobble 64 - 90 4medium cobble 90 - 128 2
large cobble 128 - 180very large cobble 180 - 256
small boulder 256 - 362small boulder 362 - 512
medium boulder 512 - 1024large boulder 1024 - 2048
very large boulder 2048 - 4096total particle count: 94
Typebedrock ------------- 6 D16 1.2 mean 7.3 silt/clay 5%
clay hardpan ------------- D35 6.5 dispersion 7.4 sand 18%detritus/wood ------------- D50 14 skewness -0.22 gravel 65%
artificial ------------- D65 21 cobble 6%total count: 100 D84 45 boulder 0%
D95 71 bedrock 6%Note: XS-5
Size (mm) Size Distribution
silt/clay
fine sand
Glen Raven, As BuiltXS-5R
silt/clay sand gravel cobble boulder
0%
10%
20%
30%
40%
50%
60%
70%
80%
90%
100%
0.01 0.1 1 10 100 1000 10000
particle size (mm)
perc
ent f
iner
than
0
2
4
6
8
10
12
14
number of particles
cumulative % # of particles

Station Elevation0.0 611.4 608.63.3 610.9 27.47.6 610.1 26.8
12.6 609.4 -13.9 608.8 -16.3 608.7 2.917.3 609.1 1.022.6 608.6 -26.6 608.8 -30.1 608.8 -31.7 608.533.4 607.9 C435.3 607.737.2 607.138.7 606.439.9 606.240.9 605.941.9 605.742.6 605.743.7 606.445.5 607.247.8 608.050.0 608.351.5 608.656.4 608.662.4 608.865.1 609.368.4 610.569.6 610.9
Bankfull Elevation:SUMMARY DATA
Drainage Area (sq mi):
Bankfull Cross-Sectional Area:
Date:Field Crew:
1.095/14/2007 A. Spiller, B. Roberts
Cape FearGlen Raven, As-BuiltXS - 6, Pool
River Basin:Watershed:XS ID
Bankfull Width:Flood Prone Area Elevation:Flood Prone Width:Max Depth at Bankfull:
Stream Type
Mean Depth at Bankfull:
Entrenchment Ratio:Bank Height Ratio:
W / D Ratio:
Cape Fear River Basin, Glen Raven, As-Built, XS - 6, Pool
604
606
608
610
612
0 10 20 30 40 50 60 70Station (feet)
Elev
atio
n (fe
et)
BankfullAs-Built

Pool
Material Size Range (mm) Count0 - 0.062 16
very fine sand 0.062 - 0.125 130.125 - 0.25 14
medium sand 0.25 - 0.5 5coarse sand 0.5 - 1 6
very coarse sand 1 - 2 9very fine gravel 2 - 4 3
fine gravel 4 - 6 3fine gravel 6 - 8 1
medium gravel 8 - 11 7medium gravel 11 - 16 4
coarse gravel 16 - 22 6coarse gravel 22 - 32 5
very coarse gravel 32 - 45 6very coarse gravel 45 - 64 1
small cobble 64 - 90medium cobble 90 - 128
large cobble 128 - 180very large cobble 180 - 256
small boulder 256 - 362small boulder 362 - 512
medium boulder 512 - 1024large boulder 1024 - 2048
very large boulder 2048 - 4096total particle count: 99
Typebedrock --------------------- 1 D16 0.062 3.4 mean 1.1 silt/clay 16%
clay hardpan --------------------- D35 0.17 12 dispersion 20.0 sand 47%detritus/wood --------------------- D50 0.59 17 skewness 0.16 gravel 36%
artificial --------------------- D65 2.7 20 cobble 0%total count: 100 D84 18 29 boulder 0%
D95 36 39 bedrock 1%Note: XS-6
Size (mm) Size Distribution
silt/clay
fine sand
Glen Raven, As BuiltXS-6P
silt/clay sand gravel cobble boulder
0%
10%
20%
30%
40%
50%
60%
70%
80%
90%
100%
0.01 0.1 1 10 100 1000 10000
particle size (mm)
perc
ent f
iner
than
0
2
4
6
8
10
12
14
16
18
number of particles
cumulative % # of particles

Station Elevation0.0 624.0 619.52.9 624.2 8.77.0 624.1 10.09.5 624.1 621.1
12.6 623.5 24.914.6 623.7 1.616.5 622.8 0.918.6 622.1 11.520.5 622.2 2.521.8 621.8 1.024.3 621.227.6 620.7 B4c30.1 620.331.8 619.533.4 618.934.0 618.434.6 618.335.4 618.035.8 617.936.8 618.037.2 618.038.8 618.741.2 619.443.2 619.845.8 620.347.4 620.950.1 621.253.3 621.858.3 623.063.3 623.767.5 624.071.6 624.573.5 624.477.3 625.21
Bankfull Elevation:SUMMARY DATA
Drainage Area (sq mi):
Bankfull Cross-Sectional Area:
Date:Field Crew:
1.095/8/2006 K. Knight, B. Roberts
Cape FearGlen Raven, As-BuiltXS - 7, Riffle
River Basin:Watershed:XS ID
Bankfull Width:Flood Prone Area Elevation:Flood Prone Width:Max Depth at Bankfull:
Stream Type
Mean Depth at Bankfull:
Entrenchment Ratio:Bank Height Ratio:
W / D Ratio:
Cape Fear River Basin, Glen Raven, As-Built, XS - 7, Riffle
616
618
620
622
624
626
0 10 20 30 40 50 60 70Station (feet)
Elev
atio
n (fe
et)
BankfullFlood Prone AreaAs-Built

Riffle
Material Size Range (mm) Count0 - 0.062 7
very fine sand 0.062 - 0.125 50.125 - 0.25 23
medium sand 0.25 - 0.5 16coarse sand 0.5 - 1 9
very coarse sand 1 - 2 6very fine gravel 2 - 4 1
fine gravel 4 - 6fine gravel 6 - 8 1
medium gravel 8 - 11 4medium gravel 11 - 16 2
coarse gravel 16 - 22 4coarse gravel 22 - 32 12
very coarse gravel 32 - 45 4very coarse gravel 45 - 64 4
small cobble 64 - 90 2medium cobble 90 - 128 1
large cobble 128 - 180very large cobble 180 - 256 1
small boulder 256 - 362small boulder 362 - 512
medium boulder 512 - 1024large boulder 1024 - 2048
very large boulder 2048 - 4096total particle count: 102
Size (mm) Size Distribution Typebedrock ------------- D16 0.14 mean 2.0 silt/clay 7%
clay hardpan ------------- D35 0.26 dispersion 29.8 sand 58%detritus/wood ------------- D50 0.5 skewness 0.39 gravel 31%
artificial ------------- D65 2.5 cobble 4%total count: 102 D84 28 boulder 0%
D95 58Note: XS-7
silt/clay
fine sand
Glen Raven, As BuiltXS-7R
silt/clay sand gravel cobble boulder
0%
10%
20%
30%
40%
50%
60%
70%
80%
90%
100%
0.01 0.1 1 10 100 1000 10000
particle size (mm)
perc
ent f
iner
than
0
5
10
15
20
25
number of particles
cumulative % # of particles

Station Elevation0.0 619.5 616.93.7 619.5 14.1
10.3 619.1 14.915.8 618.9 -20.7 618.9 -26.1 618.5 2.031.6 617.6 0.935.2 616.8 -38.0 616.3 -40.3 615.8 -41.3 615.642.2 615.4 B4c42.9 615.143.4 615.144.4 615.045.1 614.945.6 615.247.1 616.148.4 616.649.7 616.951.8 617.953.9 618.556.2 619.358.7 619.859.9 620.264.3 620.367.0 620.770.2 620.974.0 621.277.1 621.7
Stream Type
Mean Depth at Bankfull:
Entrenchment Ratio:Bank Height Ratio:
W / D Ratio:
Bankfull Width:Flood Prone Area Elevation:Flood Prone Width:Max Depth at Bankfull:
Cape FearGlen Raven, As-BuiltXS - 8, Pool
River Basin:Watershed:XS IDDrainage Area (sq mi):
Bankfull Cross-Sectional Area:
Date:Field Crew:
1.095/8/2006 K. Knight, B. Roberts
Bankfull Elevation:SUMMARY DATA
Cape Fear River Basin, Glen Raven, As-Built, XS - 8, Pool
614
616
618
620
622
0 10 20 30 40 50 60 70 80Station (feet)
Elev
atio
n (fe
et)
BankfullAs-Built

Pool
Material Size Range (mm) Count0 - 0.062 7
very fine sand 0.062 - 0.125 50.125 - 0.25 23
medium sand 0.25 - 0.5 15coarse sand 0.5 - 1 4
very coarse sand 1 - 2 2very fine gravel 2 - 4 3
fine gravel 4 - 6 4fine gravel 6 - 8 6
medium gravel 8 - 11 2medium gravel 11 - 16 7
coarse gravel 16 - 22 8coarse gravel 22 - 32 12
very coarse gravel 32 - 45 1very coarse gravel 45 - 64
small cobble 64 - 90medium cobble 90 - 128
large cobble 128 - 180very large cobble 180 - 256
small boulder 256 - 362small boulder 362 - 512
medium boulder 512 - 1024large boulder 1024 - 2048
very large boulder 2048 - 4096total particle count: 99
Typebedrock --------------------- 1 D16 0.14 3.4 mean 1.7 silt/clay 7%
clay hardpan --------------------- D35 0.25 12 dispersion 22.2 sand 49%detritus/wood --------------------- D50 0.49 17 skewness 0.36 gravel 43%
artificial --------------------- D65 6.4 20 cobble 0%total count: 100 D84 20 29 boulder 0%
D95 28 39 bedrock 1%Note: XS-8
Size (mm) Size Distribution
silt/clay
fine sand
Glen Raven, As BuiltXS-8P
silt/clay sand gravel cobble boulder
0%
10%
20%
30%
40%
50%
60%
70%
80%
90%
100%
0.01 0.1 1 10 100 1000 10000
particle size (mm)
perc
ent f
iner
than
0
5
10
15
20
25
number of particles
cumulative % # of particles

Mitigation Plan Glen Raven Stream Restoration
Appendix D
As-Built Detailed Longitudinal Profile

Longitudinal ProfileUTHR As-Built
Stations 10+00 - 20+00
SBKF = -0.005x + 621.42
SWS = -0.0048x + 618.77
613
614
615
616
617
618
619
620
621
622
0 100 200 300 400 500 600 700 800 900 1000
Station (ft)
Elev
atio
n (ft
)
Monitoring Year 0 Water Surface Bankfull Bankfull Slope Water Surface Slope

Longitudinal ProfileUTHR As-Built
Stations 20+00 - 29+00
SBKF = -0.005x + 621.87
SWS = -0.0055x + 620.31
607
608
609
610
611
612
613
614
615
616
617
1000 1100 1200 1300 1400 1500 1600 1700 1800 1900 2000
Station (ft)
Elev
atio
n (ft
)
Monitoring Year 0 Water Surface Bankfull Bankfull Slope Water Surface Slope

Longitudinal ProfileUTHR As-Built
Stations 29+00 - 38+50
SBKF = -0.0042x + 619.86
SWS = -0.0032x + 614.61
604
605
606
607
608
609
610
611
612
2000 2100 2200 2300 2400 2500 2600 2700 2800 2900 3000
Stations (ft)
Ele
vatio
n (f
t)
Monitoring Year 0 Water Surface Bankfull Bankfull Slope Water Surface Slope

Longitudinal ProfileUT1 As-Built
Stations 40+00 - 45+50
SBKF = -0.0179x + 622.37
SWS = -0.0176x + 620.24
608
610
612
614
616
618
620
622
624
626
0 100 200 300 400 500 600
Stations (ft)
Ele
vatio
n (f
t)
Monitoring Year 0 Water Surface Bankfull Bankfull Slope Water Surface Slope
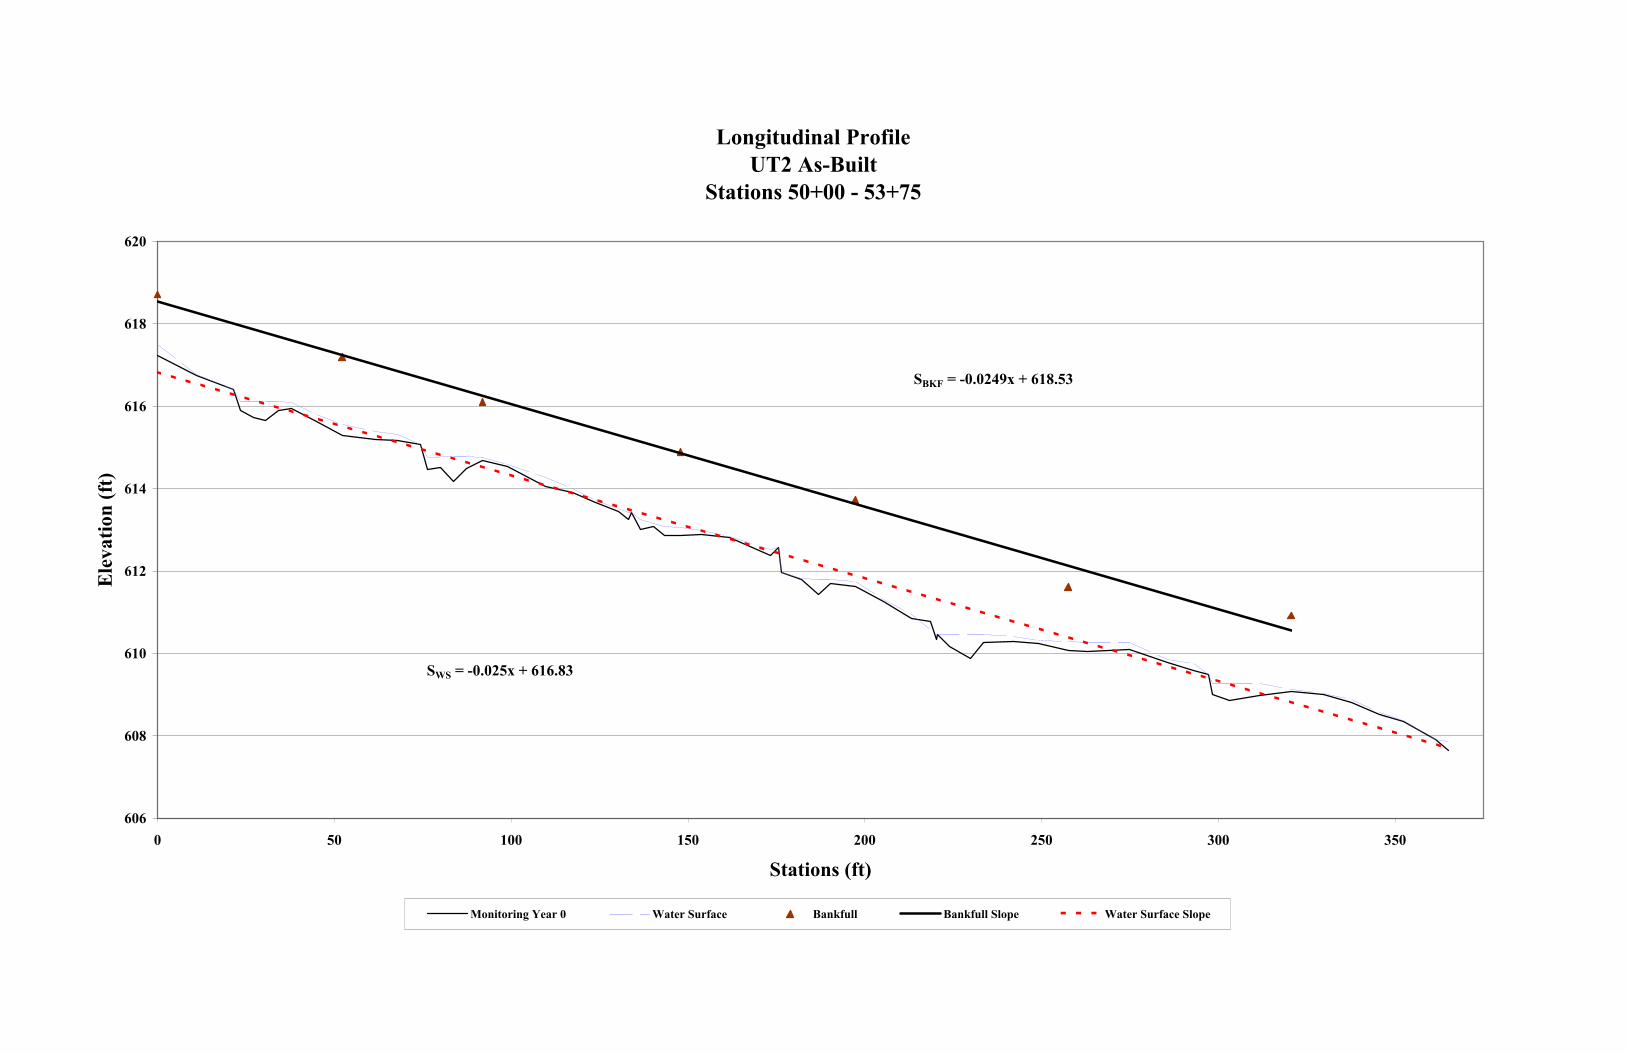
Longitudinal ProfileUT2 As-Built
Stations 50+00 - 53+75
SBKF = -0.0249x + 618.53
SWS = -0.025x + 616.83
606
608
610
612
614
616
618
620
0 50 100 150 200 250 300 350
Stations (ft)
Elev
atio
n (ft
)
Monitoring Year 0 Water Surface Bankfull Bankfull Slope Water Surface Slope

Mitigation Plan Glen Raven Stream Restoration
Appendix E
Permanent Photo Station Photos

Photo Point 1: View looking north from Power Line Road. 5/14/07 – As-Built
Photo Point 2a: View looking south near station 13+25. 5/14/07 – As-Built

Photo Point 2b: View looking north near station 13+25. 5/14/07 – As-Built
Photo Point 3a: View looking south near station 16+75. 5/14/07 – As-Built
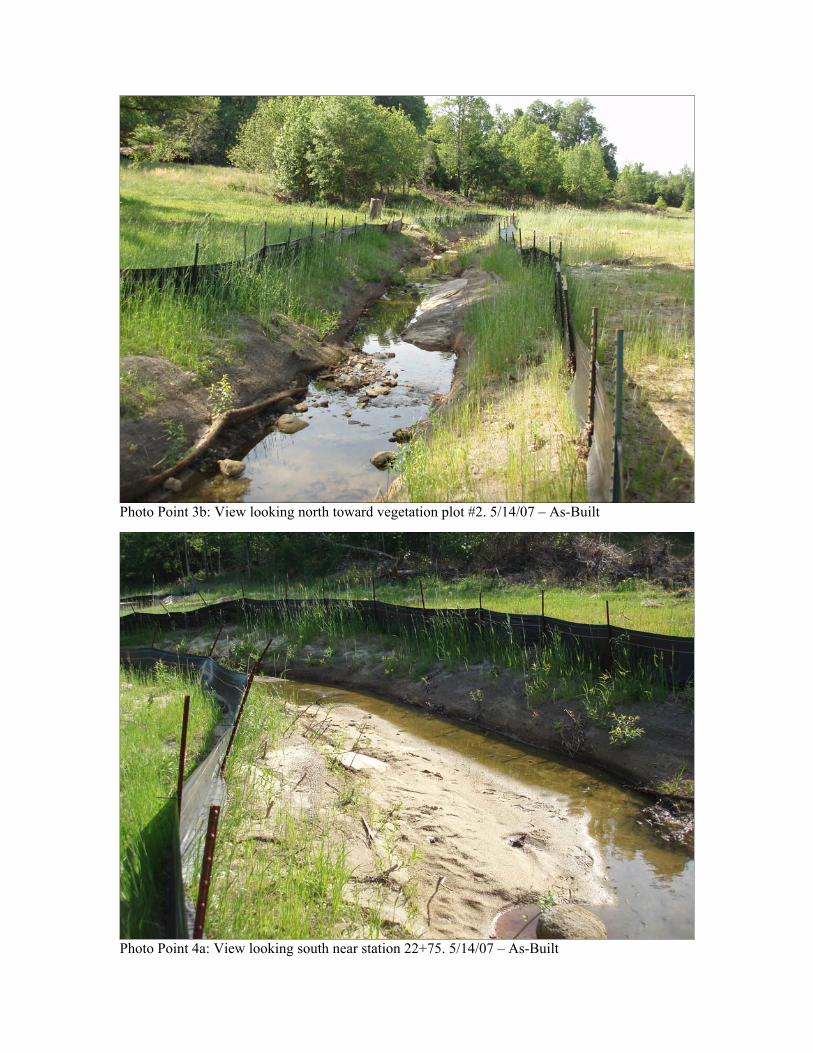
Photo Point 3b: View looking north toward vegetation plot #2. 5/14/07 – As-Built
Photo Point 4a: View looking south near station 22+75. 5/14/07 – As-Built

Photo Point 4b: View looking north toward vegetation plot #3. 5/14/07 – As-Built
Photo Point 5: View looking south from Gerringer Road culvert. 5/14/07 – As-Built

Photo Point 6: View looking north from Gerringer Road culvert. 5/14/07 – As-Built
Photo Point 7a: View looking south at confluence of UT2 and UTHR. 5/14/07 - As-Built

Photo Point 7b: View looking north near station 31+15. 5/14/07 – As-Built
Photo Point 8: View looking south near vegetation plot #7. 5/14/07 – As-Built

Photo Point 9a: View looking north toward vegetation plot #8. 5/14/07 – As-Built
Photo Point 9b: View looking north toward end of project. 5/14/07 – As-Built

Photo Point 10a: View looking upstream on UT1 near station 41+25. 5/14/07 – As-Built
Photo Point 10b: View looking downstream on UT1 near station 41+25. 5/14/07 – As-Built

Photo Point 11a: View looking east on UT1 with vegetation plot #4 on right. 5/14/07 – As-Built
Photo Point 11b: View looking downstream on UT1, before it enters UTHR. 5/14/07 – As-Built

Photo Point 12a: View looking upstream on UT2. 5/14/07 – As-Built
Photo Point 12b: View looking downstream on UT2 before it enters UTHR. 5/14/07 – As Built