gis.e- Web viewThe Pennsylvania State University, MGIS Capstone. Abstract. ... an Algonquian word...
19
More Than a Mollusk: Using GIS to Effectively Repopulate Oyster Habitats in the South River (a Tributary of the Chesapeake Bay) Parrish S Henderson The Pennsylvania State University, MGIS Capstone Abstract A once thriving natural resource and industry of the Chesapeake Bay has nearly been eradicated due to over population, pollution, and disease. Many people do not realize the importance of the soft mucous- like gray blobs that are served on a platter of ice with sides of horseradish, garlic-vinegar solutions and hot sauce but environmental scientists, fishing communities, and restauranteurs are all too familiar of the vital role that the Oyster plays as an organic filter of environmental aquatic pollutants. There are many regions in the United States that grow and harvest oysters such as the Puget Sound in the Pacific Northwest and British Columbia as well as Apalachicola Bay in the Southeastern United States to name a few. Perhaps no other region is more important however than the Chesapeake Bay which stretches from the southern shores of Virginia northward into the northeastern portions of Maryland. Unlike some of the areas mentioned above, the Chesapeake Bay at one time had more oysters than many of these areas combined and was known to be “the greatest and most productive estuary in North America” (Hinrichsen, 1998). In fact, the Native American tribes that inhabited the shores of the Chesapeake originally named it Chesepiook, an Algonquian word that translates to “Great Shellfish Bay” (Oyster Company of Virginia, 2016). With increasing awareness of the importance of these bi-valve mollusks to not only industry but more importantly the environment, many federal, state and local agencies are exploring ways to repopulate the Chesapeake Bay with this native resident so that the Bay’s waters can flow clean once again. While the Chesapeake Bay as a whole receives a bulk of the attention from the federal and state government by way of funding through grants and federally sanctioned restoration projects, many of the Bay’s smaller tributaries’ environmental not-for-profit organizations do not. The purpose of this project is to provide a Geographic Information System framework for repopulating and siting new oyster reefs within the area of operations of these smaller
Transcript of gis.e- Web viewThe Pennsylvania State University, MGIS Capstone. Abstract. ... an Algonquian word...

More Than a Mollusk: Using GIS to Effectively Repopulate Oyster Habitats in the South River(a Tributary of the Chesapeake Bay)
Parrish S Henderson
The Pennsylvania State University, MGIS Capstone
Abstract
A once thriving natural resource and industry of the Chesapeake Bay has nearly been eradicated due to over population, pollution, and disease. Many people do not realize the importance of the soft mucous-like gray blobs that are served on a platter of ice with sides of horseradish, garlic-vinegar solutions and hot sauce but environmental scientists, fishing communities, and restauranteurs are all too familiar of the vital role that the Oyster plays as an organic filter of environmental aquatic pollutants. There are many regions in the United States that grow and harvest oysters such as the Puget Sound in the Pacific Northwest and British Columbia as well as Apalachicola Bay in the Southeastern United States to name a few. Perhaps no other region is more important however than the Chesapeake Bay which stretches from the southern shores of Virginia northward into the northeastern portions of Maryland. Unlike some of the areas mentioned above, the Chesapeake Bay at one time had more oysters than many of these areas combined and was known to be “the greatest and most productive estuary in North America” (Hinrichsen, 1998). In fact, the Native American tribes that inhabited the shores of the Chesapeake originally named it Chesepiook, an Algonquian word that translates to “Great Shellfish Bay” (Oyster Company of Virginia, 2016).
With increasing awareness of the importance of these bi-valve mollusks to not only industry but more importantly the environment, many federal, state and local agencies are exploring ways to repopulate the Chesapeake Bay with this native resident so that the Bay’s waters can flow clean once again. While the Chesapeake Bay as a whole receives a bulk of the attention from the federal and state government by way of funding through grants and federally sanctioned restoration projects, many of the Bay’s smaller tributaries’ environmental not-for-profit organizations do not. The purpose of this project is to provide a Geographic Information System framework for repopulating and siting new oyster reefs within the area of operations of these smaller environmental organizations, mainly the South River Federation (SRF) so that they can restore and build new reefs in the South River. This framework will incorporate historical reef studies, bottom surface/depth data as well as water quality measurement data to help restoration efforts.
Background
The Chesapeake Bay which is fed primarily from the headwaters of the Susquehanna River runs roughly 200 miles south and empties into the Atlantic Ocean. This body of water which is believed to be the result of a meteor that struck the earth thirty-five million years ago, is home to approximately 300 species of fish, crabs, and shellfish. For years, these aquatic organisms have provided a sustainable livelihood for watermen (those that focus on crab and oyster harvesting) and fisherman alike. One of the most valuable crops is that of the Eastern Oyster, who Captain John Smith once noted, “reefs defined the major river channels” and would pose a serious “navigation hazard to ships sailing up the Bay” according to the National Oceanic and Atmospheric Administration (NOAA, 2016). These oysters, which at one time made travel up the bay difficult, remain one of the most important residents of the
Chesapeake Bay although their numbers are but a mere fraction of what they once were. Not only are they economically lucrative contributing to the nearly $1 billion-dollar revenue of the seafood industries of both Maryland and Virginia, but more importantly, they act as aquatic custodians through a process of nutrient cycling where they filter negative particulate matter from the water. Quite effective as filters, each Individual oyster has the ability to filter up to 50 gallons of water per day. Given the ability to filter such an amount of water on a daily basis combined with the historical estimation of nearly 200,000 acres of oyster beds at one time, it is estimated that during pre-colonial times, the Bay could be completely filtered in roughly one week.(Oysterva.org, 2016) Sadly, the oyster population, as previously mentioned has declined greatly to less than 1% of its’ pre-colonial levels in part to increased demand due to human population growth, limited regulation of fishing and harvesting, pollution, and diseases such as Dermo and Multinucleated Sphere Unknown (MSX).
Dermo or “Dermocystidium marinum” was first noticed in the Chesapeake Bay around 1949. Dermo is a free-floating parasite that is ingested as the oyster feeds. The parasite then works its way through the digestive system eventually killing the oyster in 1 to 2 months by destroying the tissue layers and blocking major blood delivery vessels. MSX, the second disease to show up in the bay in 1959 was caused by a single cell parasitic “Haplosporidium nelsoni” cell that would lodge itself in the gills of the oyster, entering the bloodstream and slowly invading all of the oysters’ tissues. (Galstoff, 1964). The oyster would then eventually die approximately 6 weeks after being infected. Oysters in the Chesapeake Bay are affected by both of these diseases as the Chesapeake Bay covers latitudes within the upper and lower reaches of each prospectively. Dermo was relatively easy to contain as transmission patterns show that dead and decayed oysters transmit the dermo through the water while MSX origins are still completely misunderstood. One factor that seems to be a main determinant of the success of transmission of the diseases however, is that of salinity. Both of these diseases do not seem to fare well in salinities below 8 parts per thousand (ppt) for Dermo and 10 ppt for MSX respectively. (NRAC, 1993)
Between limited regulation of harvesting and disease, decline of the oyster population has caused serious economic and environmental issues for the health of the Chesapeake Bay and its tributaries, resulting in not only lost revenue but more importantly turbid and polluted waters which affect not only the Bay’s aquatic ecosystem but the vegetation and human elements that benefit from the Bay as well. To combat the factors working against a healthy Bay, US and State run government agencies are making concentrated efforts to fund a number of Bay cleanup projects. The major government players in these recovery efforts are the US Army Corps of Engineers, National Oceanic and Atmospheric Administration, and Department of Natural Resources for both Maryland and Virginia. Assisting in more localized and focused efforts are Chesapeake Bay Foundation (Maryland and Virginia) and serval other non-profit organizations. Nearly all of these organizations are focused on recovering the overall health of the Bay. The only unaccounted areas are those covered by the major river tributaries of the Bay. Many of these bodies of water have their own environmental groups such as the Magothy River Association, Severn River Association and SRF whose names come from their respective river associations.
A major focus of each group is that of oyster reef site building and restoration efforts which some groups have more support than others. As stated previously, most of the major groups concentrate their restoration efforts on the larger Bay areas. This is accomplished through a multistep process all of which starts with comprehensive surveys measuring several factors of water quality, some of which include salinity levels, substrate conditions, dissolved oxygen in the water, and historic reef locations. (Oyster Recovery Partnership, 2015) After determining the proper areas, oyster shell and other substrate are collected and/or recycled for use in new oyster reefs as “spat”, a free-swimming larva that attaches to a hard substrate or shell and regenerates new adult oysters. Oyster and substrate collection programs range from dredging of reefs that are no longer active to shell collection programs where shells from

restaurants, oyster farms and the oyster consumer are collected, cleaned and replanted. (WBAL-TV11, 2012). The final step is to populate the new reefs with the spat and monitor the growth eventually allowing nature to take over the oyster reef process. This is a lengthy and resource intensive process that is manageable for larger organizations but poses a greater difficulty for smaller organizations such as the one that is the focus of this project, the SRF.
The SRF with its small staff and limited resources relies heavily on assistance from volunteers who help with the federations many environmental missions ranging from wetland restoration to oyster reef growth/restoration efforts within its ten-mile area of operation. One mission that they have been dedicated to over the past several years is the Marylanders Grow Oysters (MGO) program which allows waterfront property owners to participate in an oyster husbandry program after completing training on proper care and handling of oyster spat. This program provides the oyster spat which is grown in cages on recycled oyster substrate to maturity in roughly one years’ time. Once the oysters have reached maturity they are harvested and deposited in a location within the South River. The primary location, known as Glebe Bay, has a reputation of being a healthy oyster reef which is monitored by Maryland Department of Natural Resources as well due to size and longevity.
Currently, the extent of healthy oyster reefs in the South River is minimal at several acres in relation to the entirety of the South River which is approximately 6,400 acres of water surface. By depositing these oysters in only one small area of the South River, it will take years to make a noticeable difference as: environmental restoration is a slow process regardless of the project or discipline and a greater impact can be made by designating several sites in strategic areas within the river.
Goals and Objectives
The overall goal of this project was to develop a methodology through the use of GIS processes and tools allowing the SRF to determine which areas of the South River contain optimal suitability for oyster habitats. The methodology will afford the SRF with the ability to make educated decisions when selecting participants to raise oysters from spat to maturity, selecting suitable sites for new oyster reefs, and monitoring healthy oyster restoration areas to assure longevity and natural growth. Collectively, these actions will ultimately lead to a cleaner and healthier river which benefits the community and environment as a whole. For this project, a three-phased approach was developed to produce a successful oyster restoration model/workflow.
Phase I, determines an approach to selecting optimal waterfront homeowners within the confines of the South River to participate in the MGO program. In previous years, waterfront property owners that contain a “dock structure” on their property were (and still are) allowed to participate in the program. One major problem with this is that many of the participants were not in areas containing water with favorable conditions for oyster husbandry efforts. Through cooperation of the SRF, data was provided that allowed for building a suitability analysis of the South River based on water sample data taken from approximately 18 stations along the river. While the modeling is somewhat crude, it will allow the SRF the ability to focus solicitation efforts in future years to those properties that contain an accessible dock structure and meet the threshold for suitable surface water conditions.
Phase II is focused on refining much of the same SRF provided data from Phase I, incorporating updated data (as well as historical data), and developing models for siting the oysters grown in the South River through the MGO program. This phase is vital to the overall project as it will have the greatest effect on the overall restoration and cleanup efforts.
Phase III is perhaps the lengthiest of all phases being one vitality monitoring efforts. During this phase, much of the onus falls on the SRF to implement a plan of action based on the Phase I and Phase II

models and follow a process of “grow, plant, test, and repeat”. Phase III or the “monitoring phase” can take years of conducting measurements of oyster reef density by use of traditional means such as water quality tests at set locations as well as using technology to perform remote sensing change detection, down/side scan sonar surveys, or drone based analysis (Chesapeakebay.net, 2011)
Methodology
Research
As previously stated, this is a three-phase approach to providing a methodology that will benefit a small organization, the SRF in this case, with a means for growing oysters and siting them effectively to repopulate their areas of impact. In order to fully understand the particulars associated with this proposed methodology, it was necessary to gain an understanding of the role that water measurements and environmental factors play in oyster growth and vitality. Having already established a working relationship with the SRF and understanding the direction for this project, a review of other agency and organization efforts to site oyster reefs was vital in development of the project. Through publicly available whitepapers (historical and present day), abstracts, and personal interviews with members of the scientific community, a baseline of water quality data measurements meeting minimal, maximum, and optimal standards could be established for this project. Additionally, research efforts revealed other key aspects of oyster growth to include bottom surface makeup which plays an important role in oyster reef colony growth.
Data Collection
Data collection can be a daunting task regardless of the project being undertaken due to two distinct factors: First, the sheer amount of data sources available to a researcher can be overwhelming; Second, the accuracy or legitimacy of the data and data sources may be in question or can be outdated. Initially a deep dive of publicly available data was implemented and the data was retrieved for use. Next, storyboarding scenarios using the data collected helped eliminate some data and focus on those sets that are relevant. While this project does rely on data from outside agencies and sources, it would not be possible without organizational data provided from the SRF. Their data which consists of approximately 7 years of water quality data collected on a weekly basis is the crux of the project.
Examples of data beyond what is being supplied by SRF includes:
Historic Digitized Oyster Surveys: The Maryland Department of Natural Resources makes some of their shapefiles publicly available such as the “Maryland Shellfish – Historic Oyster Bottom” which represents historic oyster bottoms dating back to 1906.
Maryland Hydrologic Datasets: The Maryland Hydrologic datasets will provide the base data needed to establish detailed shoreline and water surface areas for appropriate modeling of the South River wetlands and water surface areas.
Maryland and Anne Arundel County Datasets: These sources include transportation, parcel, pier, digital elevation models, and address point data
Landsat and DigitalGlobe Imagery: These datasets were primarily used during the monitoring phase of the methodology but also provided assistance in verifying the historic oyster data from the state as well as that provided by the SRF through visual means.
United States Naval Survey Data, NGA, and NOAA: This data which is made publicly available, contains sonar created depth points of the South River used to interpolate a model of its bathymetry which will be an integral part of the analysis.
Ground Truthed (Collected) Data: A unique dataset personally created through the use of my vessel’s side scan sonar and “bottom mapping” tools which are built into my GARMIN chart

plotting Device. Additionally, use of Drone collected data was used to assess oyster habitat areas.
Data Preparation
While much of the data collected was delivered in a useable state, some of it had to be refined and constructed into useable layers to effectively perform analysis on all parts of this project. The first step was determining a database structure that would allow for easy use and distribution of the data. The data which consisted of vector files, raster files, and raw spreadsheet data needed to be consolidated into one master database containing smaller focused databases for each part of the project. Before putting the data into the databases however, some of the data would need to be custom built and all of it would need to be processed and normalized. All of the vector and downloaded raster files such as digital elevation models were reprojected and then clipped to a focused study area to allow for minimal processing time. Two custom-built layers were developed which would be vital to the project’s success. The first was river monitoring zones that were based on location and had to be topologically inspected and corrected prior to being reprojected and clipped (Figure 1). The second layer was a bathymetric layer where approximately 1600 sounding points were Kriged to create a representative layer of the rivers depths (Figure 2). The last part of the data to be processed was the spreadsheets of water quality data. This data was consolidated from many datasets to three. Once the data was standardized and consolidated, pivot tables were established so that raw data could be filtered as desired (by week, month, or year) and then joined to the custom-built water zone layers to create shapefiles for analysis.
The first database, “Basemaps GDB” contains all of the data required to build custom basemaps with which to portray the data. This database is not necessary as the data can be over layed on to any program with a basemap however with this project, a specially made basemap was developed to allow focus on the river layers without detraction from premade basemap layer tiles that can contain a lot of unnecessary information or clutter. This gdb consists of roads, city and county boundaries, DEM rasters, Hillshade rasters, sounding points, etc. The second database, “South River Master GDB” contains the data that is focused on the South River water boundaries. This gdb includes the water zones, water monitoring stations, shorelines, streams, tributaries, etc. The final database, “South River Raster GDB” contains all of the processed rasters that are converted from the water monitoring zone joins to be used in the analysis processing.
Figure 1. Water Monitoring Zones of South River Federation Figure 2. Bathymetric Layer of the South River kriged from sounding points.

Multi-phased Analysis
With the totality of the data in a useable state, the different phases of the analysis could be developed and run to grow, place and monitor oyster reefs in the South River.
Phase I – Oyster Husbandry Suitability and Participant Targeting
While all phases of the project are important this one is perhaps the most important as it provides the oysters that will eventually start a new reef in the river or bolster the effectiveness of an existing reef. Based upon research from the scientific community, a suitability model was constructed and then converted into a separate tool allowing any user with collected water quality data the ability to run a scenario that works best for their area of operations (Figure 3).
Initially, tabular data from the surface readings of the water data for Salinity and Dissolved Oxygen readings are joined to the water zone data shapefile and then these polygons are transformed to raster layers. The next step is to perform a raster analysis that includes the aforementioned layers and the bathymetry layer that was created during the data preparation stage. While there are many different combinations that can be used based on different areas of the country, the values used in this project were deemed as optimal in relation to the values set forth by the Mid Atlantic Tributary Assessment Coalition (MTAC) guidelines, Chesapeake Bay Foundation, and the South River Federation. These values were a bottom depth that was less than or equal to 5 feet, salinity that is greater than 7.3 parts per thousand (ppt) and dissolved oxygen that is greater than 8 milligrams per liter (mg/l). The result is a raster that deems areas suitable versus not suitable for being an oyster husbandry candidate. The resulting raster was then reclassified with non-suitable areas being classified as NoData and suitable being classified as 0. The resulting raster showed only those areas deemed suitable and was then converted to a polygon for the next step.
While the Marylanders Grow Oysters program is open to everyone, not everyone that participates resides in a suitable area which in past efforts has led to weak oyster growth or spat that never matured. To mitigate this, the suitable polygon is then over layed on the map with all of the pier structures in the South River and the piers are clipped to the suitable layer. With all of the suitable piers identified, the parcel and address points can be joined to these structures to provide a comprehensive list of property owners that can be solicited for participation. The goal is that these individuals will participate yielding a greater number of oysters to be populated in the river areas.
Figure 3. Phase I Analytic Workflow

Phase II – Identification of Suitable Oyster Reef Siting Candidates within the South River
Once the oysters have been harvested, it is vital to populate them into areas of the river that will afford the greatest opportunity for their survival. Having healthy oysters deposited into multiple reefs along the South River will benefit the overall river better than one or two reefs in a small area of the river would. Once again, the workflow (Figure 5). is based on several factors contributing to oyster health but whereas phase I was focused on surface water measurements due to oysters being raised from spat to maturity just below the water’s surface; phase II concentrates on the water measurements collected from the bottom of the river where the oysters will actually be planted.
Much like phase I, phase II is initiated by the joining of water data to the South River water monitoring zones layer. The tabular data layers created for this project were an average of calendar year 2016 values with the appropriate measurement types derived from MTAC guidelines as well as other organizations published guidelines. The important layers in this phase; Dissolved Oxygen, pH, Salinity, and Temperature. These layers once created were converted to raster layers at 1 inch resolution then processed through a raster analysis to determine suitability. To define the best suitable areas in the South River, optimal measurements of dissolved oxygen greater than 5.7 mg/l, pH greater than 7, salinity greater than or equal to 11.3 ppt and temperature greater than 20 degrees Celsius. The resulting raster layer was reclassified with non suitable areas being labeled as NoData and suitable areas being labeled as 0. The resulting layer was only the suitable areas of growth. While the resulting areas of the river are suitable, water quality is only one of two major factors affecting an oyster reef being able to be sited. The bottom surface composition is extremely important to successful growth as the oyster spat must have a proper substrate to latch onto. Oysters need a hard surface to attach to such as “cultch” which is a substrate of broken shells. Using a bottom surface composition layer derived from Maryland DNR and the suitable water quality layer, a second raster analysis is performed to provide the pinpointed areas of the river that are the most suitable candidates for siting an oyster reef.
Phase III – Monitoring Efforts of Existing and Planted Reef Sites
Figure 5. Phase II Oyster Site Suitability Workflow

The final phase of the project is one that is never truly complete; monitoring reef health. Regular monitoring of any reef is imperative in determining if a newly planted reef is maintaining its health or if an established reef is growing or declining. For this project, several different techniques were proposed and practiced. Some of these are newer techniques relying heavily on technology where as others are established methods with manual and rudimentary tasks.
Traditional Monitoring:
Traditional monitoring consists of several techniques that are commonplace among the environmental agency groups responsible for oyster restoration efforts. Some of these techniques consist of using a Sechi Disk (Figure 6) which helps measure water clarity using a disk with a pattern tied to a string and lowered until the pattern is no longer visible. Other methods consist of water sampling (Figure 7) to measure dissolved oxygen, salinity, and chlorophyll as well as obtaining samples of oysters and testing their tissues (Figure 8) to determine disease or other variants that could be affecting health of the oyster colonies.
Satellite, Aerial, and Drone Monitoring:
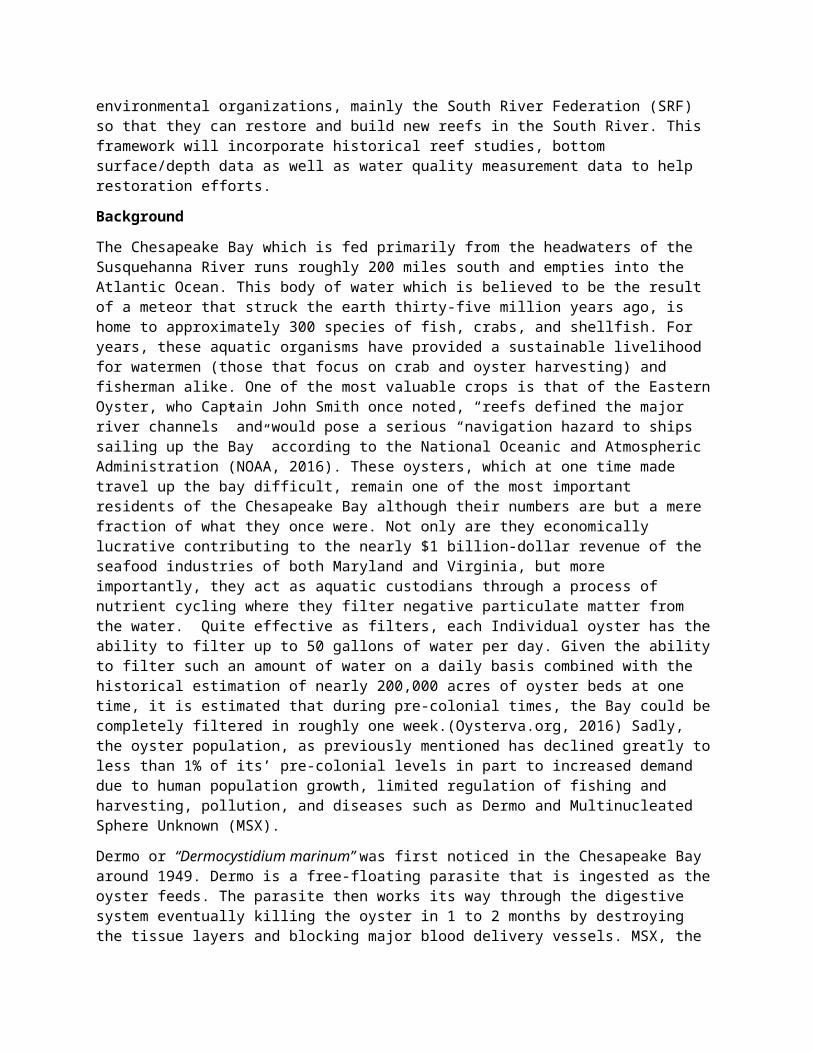
Several instances of remote sensing were employed to determine health of existing oyster reefs and many of these can be employed with other projects as well. Using Landsat imagery based on a color combination of Blue, Green, and NIR bands, it is possible to see bottom depths up to 25 meters. With the South River’s deepest depths being roughly 10 meters, the bottom should be discernable and able to be classified by depths. The key to using landsat and this actually pertains to any of the remote sensing methods is to assure that the imagery being used is from the winter months for three important reasons: 1. The winter months tend to have clearer water due to the cooler water temperatures allowing water to penetrate deeper, 2. The amount of boat traffic is minimal if not nonexistent during these months which allows for the water to be undisturbed controlling the amount of silt and particulate floating in the water, and 3. The tides in the winter are generally lower than sea level mean allowing for more of the surface to be visible. Use of a drone allows for spot checking certain areas known for oyster growth providing higher resolution than available by Landsat (30m pan sharpened to 15 m) or commercial imagery (Figure 9) which may be 1.5 feet at the best. Drone imagery (Figure 10) can provide up to 1 inch or sub inch resolution and through the use of filters, can pierce through the waters glare. Another advantage to using a drone for collection is that the user decides when and where to collect eliminating the need to wait for a programmed collect. The key to remote sensing oyster reefs is determining if reef area expands or diminishes from collection to collection.
Figure 6. Sechi Disk Monitoring (courtesy of Ben Meadows)Figure 7. Water Sampling (courtesy of CBF)
Figure 8. Tissue Sampling ( courtesy of CBF)

Sonar (Side Scan and Straight Down): Sonar technology is not new and sonar imaging has been available for several years, but as time progresses, the technology gets better and the prices become much more manageable for even commercial systems. For this project, a Garmin Echomap 74Se was used to monitor several of the known oyster sites in the South River. Through the use of the sonar the user can determine most surface bottom makeup as well as oyster reefs and structure. Most oyster reefs are very jagged and leave a distinct signature showing jutting of oyster edges turned upward or sideways (Figure 11). Other indicators of healthy reef structures is the evidence of schooling or larger fish in the areas of the oyster reefs (Figure 12). If a reef is checked several times and there are rarely signs of life near the reef, that may be an indicator of poor health and prompt the need for more traditional testing means such as “hand tonging” for oysters that can be tested as mentioned previously or possibly even diving the reefs for visual verification.
Figure 9. Landsat clipped to South River with oyster reefs located Figure 10. Drone Capture over Glebe Bay Oyster Reef with color modification
Figure 11. Evidence of well-established Oyster Reef in Glebe Bay Figure 12. Small Oyster Reef (AA 702) with evidence of Striped Bass in vicinity

Results
The projects revolving around oyster restoration were conducted in phases over a year long stretch. Initially, the only deliverable was going to be Phase I however after presenting the findings of this phase to the SRF and seeing the purpose that GIS could serve, the question of siting oyster bars was raised. At the time of inception, the SRF had one thriving oyster reef but the organization debated on additional suitable site locations. Their ultimate goal was to find suitable oyster reef locations in the river outside of the areas deemed suitable by the Maryland Department of Natural Resources. While it was anticipated that more suitable locations throughout the South River would be identified the SRF weren’t really sure of where other than their own speculation based on knowledge of the river boundaries. After seeing the success of Phase I the SRF encouraged using the same water data to determine the siting locations and the Phase II efforts were explored for feasibility. There was some confusion however on a way forward or how the water data was going to assist in furthering oyster siting efforts. After exploring and normalizing the data however, a clearer picture started to emerge and as with any project, one successful process opened the door to other possible processes leading to a very structured project with substantial and tangible results.
The final results of phase I were telling. In the initial years of Oyster Husbandry Efforts there were approximately 76 yearly participants that were scattered along the river from the headwaters to the mouth meeting the Chesapeake Bay in areas where the water quality is a favorable and unfavorable mix (Figure 13). The phase I results not only showed that the water quality was not favorable along the certain areas of the river, but it narrowed down the pier owners and allowed for a list to be generated that focuses on the approximately 672 pier/property owners for solicitation instead of the entirety of the river which is 1,719 (Figure 14). The results also encourage property owners to help clean the watershed that is their home through the use of scientific means.
The results of phase II go one step further in proving through scientific methodology that there are good and bad places in the river to deposit matured oysters. These results reveal that of roughly seven miles of river areas there are only 19 suitable areas with the largest area being only several acres in size. While these areas are small, if all of them could be populated with healthy oyster reefs, the surrounding areas would possibly become useable as well, as healthy reefs continue to spread outward from the center of the original sites through both natural and human repopulation efforts (Figure 15).
Figure 13. Oyster Husbandry Past Candidates Figure 14. Oyster Husbandry Suitable Candidates and Piers

One aspect of the results that may sometimes be overlooked is that of “gaps”. Gaps refer to areas revealed that may lead to more questions. As an example, the analysis for phase II sites that there are 19 different areas that are suitable for oyster growth based on the water quality factors and the bottom surface composition. However, there was a category where water was favorable but the bottom surface in these areas was unknown. With this knowledge, the SRF is motivated to research bottom surface composition to determine if these favorable areas reveal more locations than the original 19. Another “gap” is trying to understand the effect that many of the tributaries have on water quality and bottom surface composition where heavy rains move pollutants and spread muddy silt over areas that ultimately contribute to the river.
Deliverables
When all processes are complete, what happens to the data, methods, and tools developed? They don’t go to waste or sit on a desktop computer, instead all of the processes are documented and provided to the SRF as well as presented to the local and scientific communities. From this project, several deliverables were created:
Data: All of the data was normalized and placed in a structured geodatabase for the SRF specifically to use to repeat the processes over and over for years to come making their mission more effective. This cleaned data assures that future projects are not daunting and that with a few quick clicks answers can be achieved that provide intelligent solutions to hard problems.
Figure 15. Suitability of South River Possible Oyster Restoration sites

Tools: All of the processes/workflows were developed into python scripted models and developed into toolboxes to be used in ArcGIS Desktop. After learning that the SRF held an account for ArcGIS online, those models are being developed into geoprocessing models that can be added to the ArcGIS portal for greater accessibility of analysis.
Presentations: The entire project was developed into a power point presentation with notes for a presenter to easily brief. This brief has been presented to the SRF and at the 2017 ESRI User Conference and the feedback has been overwhelmingly positive. This presentation is slated to be given again to a group of students at Columbia University in the Fall as well as to the SRF quarterly community meeting.
Workflows: All workflows were documented with step by step instructions so that non-GIS individuals could confidently understand the reasoning behind the “button pushing” and explain in a confident manner how their results were obtained.
Concluding Remarks
The Chesapeake Bay and more directly the South River although having improved water quality over the past few years is still faced with threats to water quality which ultimately effects the entire watershed. A once thriving ecological environment where oysters played a pivotal role has been diminished to levels that dwarf what it once was. Using processes such as those developed in this project may not be a primary means for restoring these watersheds to their historic level of purity, but they will help. Being able to determine willing oyster husbandry participants in prime locations along the river and having a sound method for siting the programs products will at the very least assure a path towards restoring the South River to a level of purity that will benefit the rivers inhabitants as well as the waterbodies that it feeds.
Acknowledgements
Pennsylvania State University Advisors: Fritz Kessler and Justine Blanford
Chesapeake Bay Foundation: Jackie Shannon
South River Federation: Jesse Illiff, Nancy Merrill, Sarah Giordano
References
South River Federation | protect, preserve, restore and celebrate the South River. (n.d.). Retrieved September 06, 2016, from http://www.southriverfederation.net/
Galtsoff, P. S. (1964). The American oyster: Crassostra virginica Gmelin. Washington: Government Printing Office.
Virginia Oyster Reef Restoration Map Atlas. (2010, December 23). Retrieved September 02, 2016.
"Dissolved Oxygen." Chesapeake Bay Program. Chesapeake Bay Foundation, 2012. Web. 3 Sept. 2016.
Administrator, and Blue Water Media, Inc., (202)861-0000, Www.bluewatermedia.com. "Oyster Restoration - Oysters - Chesapeakebay.noaa.gov." Oyster Restoration - Oysters - Chesapeakebay.noaa.gov. N.p., n.d. Web. 06 Sept. 2016.
Woods, Helen, William J. Hargis, Jr., Carl H. Hershner, and Pam Mason. "Improving Siting and Construction Criteria for Oyster Reef Restoration." Ccrm.vims.edu. William and Mary University, 2004. Web. 6 Sept. 2016.
Oyster History. (2014). Retrieved September 3, 2016, from oysterva.com/oyster-history.html
Shellfish Related Programs. (n.d.). Retrieved September 06, 2016, from http://dnr2.maryland.gov/fisheries/Pages/oysters/index.aspx
Ewart, John W., Ford, Susan E. “History and Impact of MSX and Dermo Diseases on Oyster Stocks in the Northeast Region”, Northeastern Regional Aquaculture Center Fact Sheet No. 200 – 1993.
Oyster Recycling Bins to Help Replenish Population [Video file]. ( 2012, August 13). Retrieved from http://www.wbaltv.com/news/maryland/Oyster-recycling-bins-to-help-replenish-population/16091216
Steinberg, S. L., & Steinberg, S. J. (2015). GIS research methods: Incorporating spatial perspectives. Redlands, CA: ESRI Press.
Florida Oceanographic Society, 2012. Oyster Filtration. Retrieved from https://www.youtube.com/watch?v=saAy7GfLq4w
Jackie Shannon, CBF.org, Oyster Restoration Questions, 13 October, 2016
Oyster Recycling Bins to Help Replenish Population [Video file]. ( 2012, August 13). Retrieved from http://www.wbaltv.com/news/maryland/Oyster-recycling-bins-to-help-replenish-population/16091216
Steinberg, S. L., & Steinberg, S. J. (2015). GIS research methods: Incorporating spatial perspectives. Redlands, CA: ESRI Press.

Mid-Atlantic Tributary Assessment Coalition,2011. Sampling and data analysis protocols for Mid-Atlantic tidal tributary indicators.