
GEOG 596B - MGIS Capstone Project Final Report · PDF fileGEOG 596B - MGIS Capstone Project...
31
1 PENNSTATE Department of Geography World Campus GEOG 596B - MGIS Capstone Project Final Report Decision Support Tool for Planning Infrastructure Improvement July 2017 Elsit Mandal Advisor: Dr. Jan Oliver Wallgrun
Transcript of GEOG 596B - MGIS Capstone Project Final Report · PDF fileGEOG 596B - MGIS Capstone Project...
1
PENNSTATE
Department of Geography
World Campus
GEOG 596B - MGIS Capstone Project Final Report
Decision Support Tool for Planning Infrastructure Improvement
July 2017
Elsit Mandal
Advisor: Dr. Jan Oliver Wallgrun
2
Abstract
Highway bridges with vertical clearance limitations, weight restrictions or roundabouts act as
barriers to oversize overweight (OSOW) truck traffic. This project involves the development of
an ArcGIS Decision Support Tool Set to assist in planning the allocation of funding for
transportation infrastructure improvements. The tool set developed includes scripts to analyze
and visualize OSOW data and to select candidate bridges for improvement or replacement
based on their spatial location in the context of OSOW traffic demand. The tools are Python
scripts that use the ArcGIS network analyst extension to determine the shortest path without
and with barriers. A routable network and the restricted bridges as a point feature class are
required to perform the analysis along with the origin-destination (OD) pairs representing
OSOW traffic demand.

3
Disclaimer
The contents of this report reflect the views of the author who is responsible for the facts and
accuracy of the data presented herein. The contents do not necessarily reflect the views or the
policies of KDOT or the State of Kansas. This report does not constitute a standard,
specification or regulation.
4
Contents Abstract ........................................................................................................................................................ 2
Disclaimer .................................................................................................................................................... 3
Contents ...................................................................................................................................................... 4
1. Introduction ............................................................................................................................................. 5
2. Background ............................................................................................................................................. 5
3. Literature Review ................................................................................................................................... 8
3.1 Decision Support Systems (DSS) and Tools .............................................................................. 8
3.2 OSOW Truck Traffic Studies.......................................................................................................... 8
4. Motivation ................................................................................................................................................ 9
5. Goals ...................................................................................................................................................... 10
6. User Requirements .............................................................................................................................. 10
7. Analysis & Classification of OSOW Data ......................................................................................... 11
8. Methodology & Approach ................................................................................................................... 13
8.1 Methodology ................................................................................................................................... 13
8.2.Approach ......................................................................................................................................... 17
9. The Developed Python Script Tools ................................................................................................. 18
9.1 The OSOW Data Analysis Tool ................................................................................................... 19
9.2 Tool Set for Prioritization of Bridges .......................................................................................... 21
9.3. Barrier Grouping in Removal of Barriers ................................................................................... 23
10. Tool Test Runs & Discussion of Results ........................................................................................ 24
11. Conclusions & Outlook ..................................................................................................................... 27
11.1 Conclusions .................................................................................................................................. 27
11.2 Further Work ................................................................................................................................ 27
12. Bibliography ........................................................................................................................................ 28
5
1. Introduction
Transportation costs include fuel costs, vehicle operating costs and travel time costs. Travel
times are affected by posted speed limits, traffic congestion and length of chosen routes. In the
case of oversize or overweight (OSOW) trucks, the presence of load posted bridges, load
restricted bridges, vertical clearance limited bridges or roundabouts cause the trucks to take
alternate routes to complete the traffic demand. These alternate routes may not be the best in
terms of vehicle operating cost or other transportation costs. Transportation planners need to
know the traffic demand and should be able to run 'what if' scenarios to determine benefit cost
ratios to make decisions to improve the transportation infrastructure. The tool set developed in
this project includes scripts to analyze and visualize OSOW data and to select candidate
bridges for improvement or replacement based on their spatial location in the context of OSOW
traffic demand. The tools are Python scripts that use the ArcGIS network analyst extension to
determine shortest path without and with barriers. A routable network and the restricted bridges
as a point feature class are required to perform the analysis along with the origin-destination
(OD) pairs representing OSOW traffic demand.
2. Background
Kansas has the advantage of being in the heartland and thus is a hub (Figure 2.1) of freight
accessibility [5]. In Kansas, trucks having more than 14 feet height or weighing more than 40 T
gross vehicle weight (GVW), or length > 120 FT or width > 8 FT 6 IN are required to obtain a
permit to use the highways.

6
Figure 2.1. Freight Delivery Times from Kansas [5]
(Credit: Kansas Freight Advisory Committee)
KTRIPS (Kansas Truck Routing Intelligent Permitting System) [20] was implemented in 2014 to
issue permits and routing for OSOW trucks on the state's highways. Improving or replacing the
bridges to provide more vertical clearance is costly for the State. But trucks taking alternate
routes is costly to the truck industry in terms of lost time and additional mileage travelled on
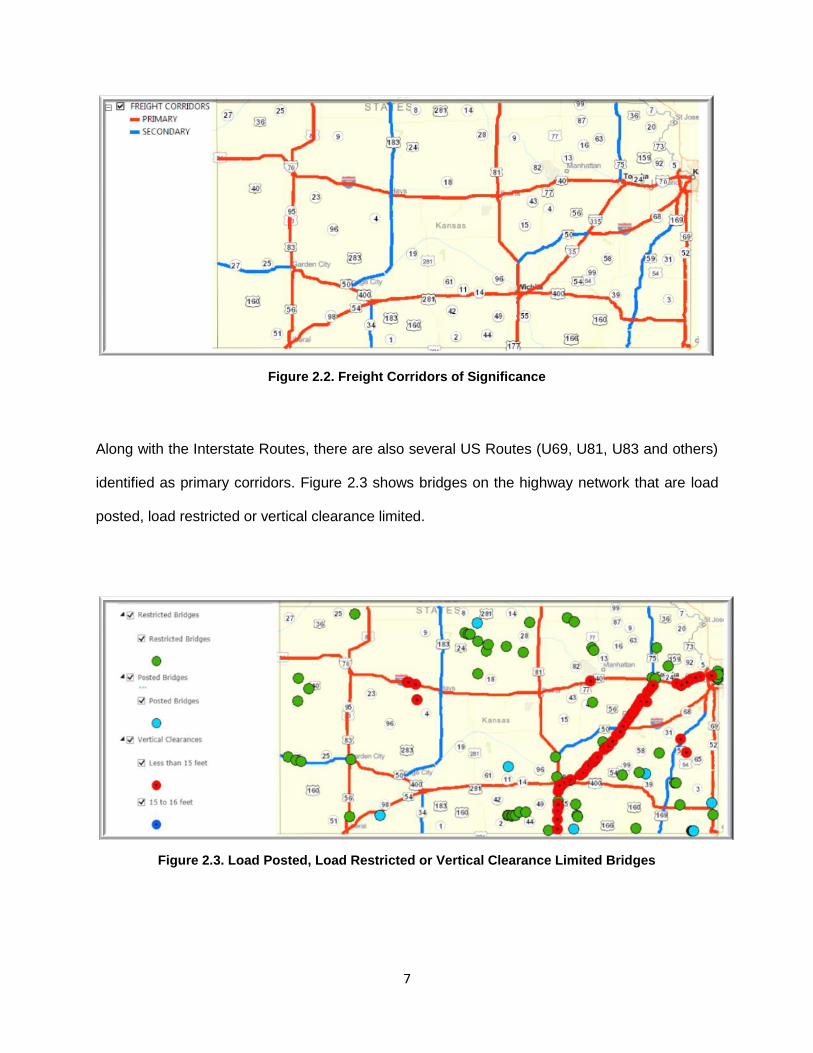
alternate routes. It is costly in terms of lost revenue for the State. The primary and secondary
freight corridors of significance (Figure 2.2), which are also the major highways that the OSOW
traffic uses, are identified by the Kansas Freight Advisory Committee based on traffic patterns.
7
Figure 2.2. Freight Corridors of Significance
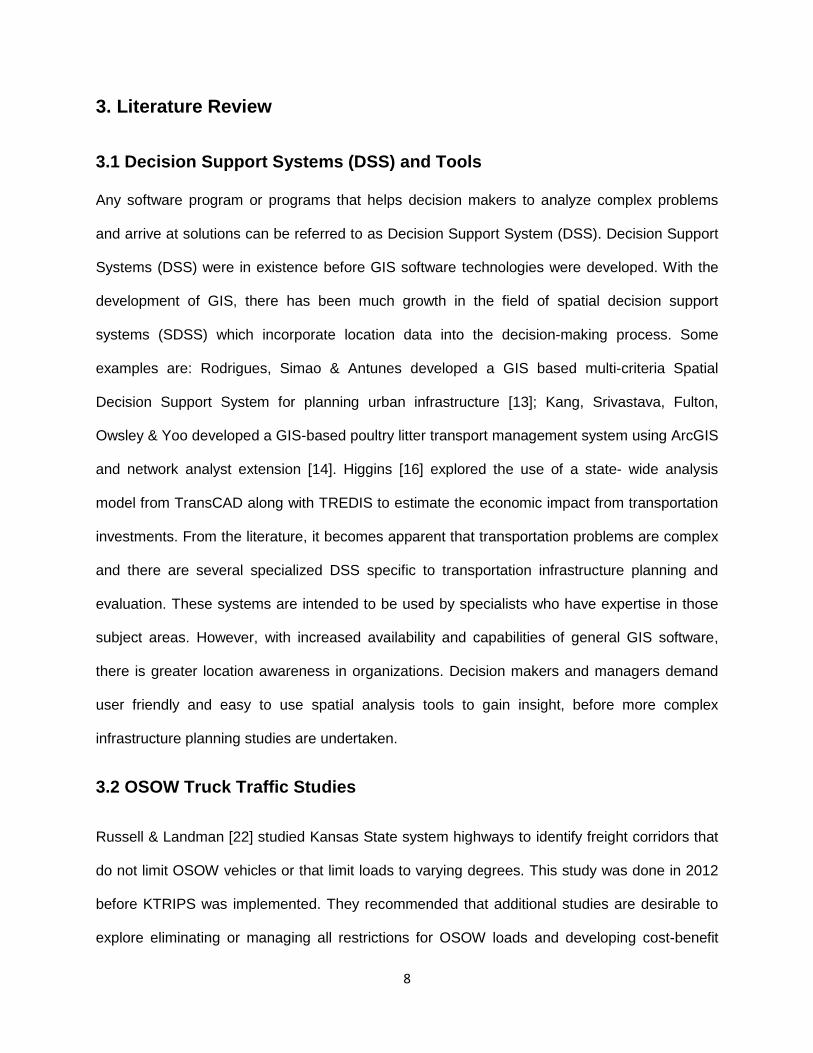
Along with the Interstate Routes, there are also several US Routes (U69, U81, U83 and others)
identified as primary corridors. Figure 2.3 shows bridges on the highway network that are load
posted, load restricted or vertical clearance limited.
Figure 2.3. Load Posted, Load Restricted or Vertical Clearance Limited Bridges
8
3. Literature Review
3.1 Decision Support Systems (DSS) and Tools
Any software program or programs that helps decision makers to analyze complex problems
and arrive at solutions can be referred to as Decision Support System (DSS). Decision Support
Systems (DSS) were in existence before GIS software technologies were developed. With the
development of GIS, there has been much growth in the field of spatial decision support
systems (SDSS) which incorporate location data into the decision-making process. Some
examples are: Rodrigues, Simao & Antunes developed a GIS based multi-criteria Spatial
Decision Support System for planning urban infrastructure [13]; Kang, Srivastava, Fulton,
Owsley & Yoo developed a GIS-based poultry litter transport management system using ArcGIS
and network analyst extension [14]. Higgins [16] explored the use of a state- wide analysis
model from TransCAD along with TREDIS to estimate the economic impact from transportation
investments. From the literature, it becomes apparent that transportation problems are complex
and there are several specialized DSS specific to transportation infrastructure planning and
evaluation. These systems are intended to be used by specialists who have expertise in those
subject areas. However, with increased availability and capabilities of general GIS software,
there is greater location awareness in organizations. Decision makers and managers demand
user friendly and easy to use spatial analysis tools to gain insight, before more complex
infrastructure planning studies are undertaken.
3.2 OSOW Truck Traffic Studies
Russell & Landman [22] studied Kansas State system highways to identify freight corridors that
do not limit OSOW vehicles or that limit loads to varying degrees. This study was done in 2012
before KTRIPS was implemented. They recommended that additional studies are desirable to
explore eliminating or managing all restrictions for OSOW loads and developing cost-benefit
9
ratios. Prozzi J. et al [23] conducted research on OSOW load traffic issues to prioritize research
needs. Analysis of the OSOW data is very important to establish policies or to plan for
infrastructure improvements.
4. Motivation
Government agencies responsible for maintaining transportation infrastructure utilize some form
of GIS software to manage the roadway network and inventory data. ArcGIS is the most widely
deployed GIS software in government organizations. KDOT needed a tool that can be used to
analyze data from the KTRIPS system and assist in infrastructure improvement decisions. An
ArcGIS tool will fit the needs because of the availability of several concurrent licenses in the
organization and also due to the ease of customization with Python coding for ArcGIS. The
ArcGIS Network Analyst extension has several tools that utilize routable networks to solve
driving time/cost minimization problems, which could be used for analyzing barrier scenarios for
a given traffic demand.
Other GIS software that provide decision support for project planning and infrastructure
investments are AASHTOWare Bridge Management software (BrM) and TRANSCAD (by
Caliper Corp.) [2]. BrM is a specialized software for bridge management, which has some GIS
functionalities including ability to access googlemaps within the system. It does not provide
routing based analytic capabilities. TransCAD is a specialized transportation planning GIS
software that has routing and travel demand forecasting capabilities. TransCAD has been in use
for many years. However, it is not as widely deployed as ArcGIS in organizations. Some
customization using GISDK (GIS Developer's Kit) would be needed in TransCAD to solve this
specific problem because automated tools do not exist. TransCAD Standard version for single
user license with nationwide HERE data (routable network data) costs $15,000. ArcGIS is much
cheaper with Enterprise licensing.
10
5. Goals
The goals of this project include development of a user-friendly ArcGIS tool that supports
analysis and visualization of OSOW truck traffic and prioritization of bridge infrastructure
improvement scenarios. The proposed tool requires a routable network dataset, origin-
destination pair features(OD pairs) and point barrier feature data sets. The point barriers in this
project are restricted bridges having vertical clearance limitations, weight restrictions or
roundabouts. The barrier feature data set also may contain the cost of improving the restrictions
for each one of the bridges. Even though the idea for this project was originated from KDOT's
need to analyze project scenarios with respect to improving restricted bridges on Kansas
Highways to accommodate oversize/overweight trucks, the tool could be used on any routable
network, OD pairs and point barriers.
6. User Requirements
A prototype of the tool, that creates prioritized list of bridges, was presented at an internal
meeting at KDOT to solicit inputs from the anticipated users from the Bureau of Transportation
Planning and Bridge Management (Bureau of Structures and Geotechnical Services) of KDOT.
Five people attended the presentation, three from Transportation Planning, and one from
Bureau of structures. The attendees provided inputs and suggestions. It became clear that the
users also needed some tools to analyze the available KTRIPS data to gain insight into the
OSOW traffic demand and patterns. The Statewide planning unit in the Bureau of
Transportation Planning is responsible for conducting analysis for infrastructure investment
studies with input from other Bureaus and stakeholders.

11
7. Analysis & Classification of OSOW Data
Each year about 75,000 OSOW truck permits are issued from KTRIPS. Data from KTRIPS is
available as route geometry and truck/load size (Length, Width and Height) and weight
characteristics. Table 7.1 shows the summary of OSOW data from KTRIPS for 2014 and 2015.
The weights are classified into three groups 40-60 T, 60-75 T and > 75 T. OSOW loads are not
allowed on load posted bridges. The restricted bridges do not allow OSOW loads that are
greater than 60 T. Weights > 75 T are called superloads.
Table 7.1. Summary Classification of KTRIPS Data for 2 Years
Figure 7.1. shows the OD pairs that are derived from KTRIPS route geometry data for one
month.
12
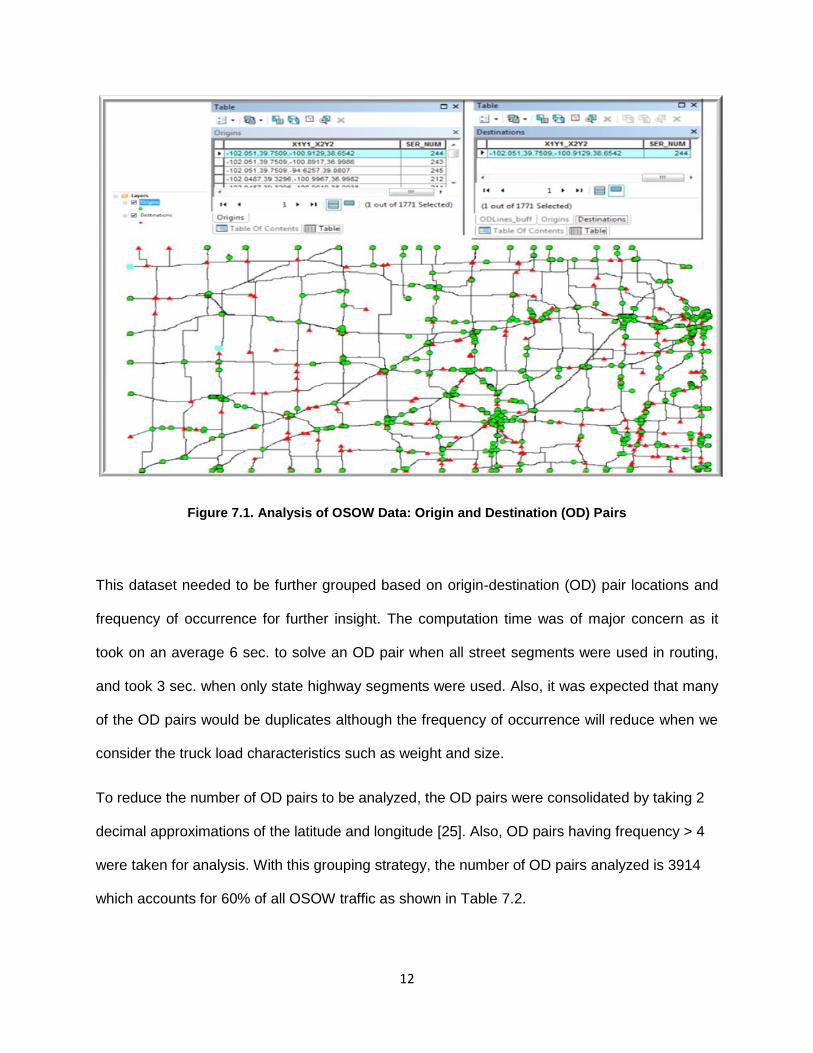
Figure 7.1. Analysis of OSOW Data: Origin and Destination (OD) Pairs
This dataset needed to be further grouped based on origin-destination (OD) pair locations and
frequency of occurrence for further insight. The computation time was of major concern as it
took on an average 6 sec. to solve an OD pair when all street segments were used in routing,
and took 3 sec. when only state highway segments were used. Also, it was expected that many
of the OD pairs would be duplicates although the frequency of occurrence will reduce when we
consider the truck load characteristics such as weight and size.
To reduce the number of OD pairs to be analyzed, the OD pairs were consolidated by taking 2
decimal approximations of the latitude and longitude [25]. Also, OD pairs having frequency > 4
were taken for analysis. With this grouping strategy, the number of OD pairs analyzed is 3914
which accounts for 60% of all OSOW traffic as shown in Table 7.2.

13
Table 7.2. Summary Classification Used for Analysis
8. Methodology & Approach
8.1 Methodology
The development of the tool using the network analyst extension requires a network dataset and
OD pairs representing traffic demand. ESRI StreetMaps (routable network data) [21] is used as
the network dataset. The network dataset properties are shown in Fig. 8.1.1. DrivingTime and
Length are assigned as cost parameters. Length is assigned as impedance attribute and
DrivingTime is assigned as accumulate_attribute in Network Analyst's ‘RouteSolver’ properties.

14
Figure 8.1.1. Network Dataset Properties
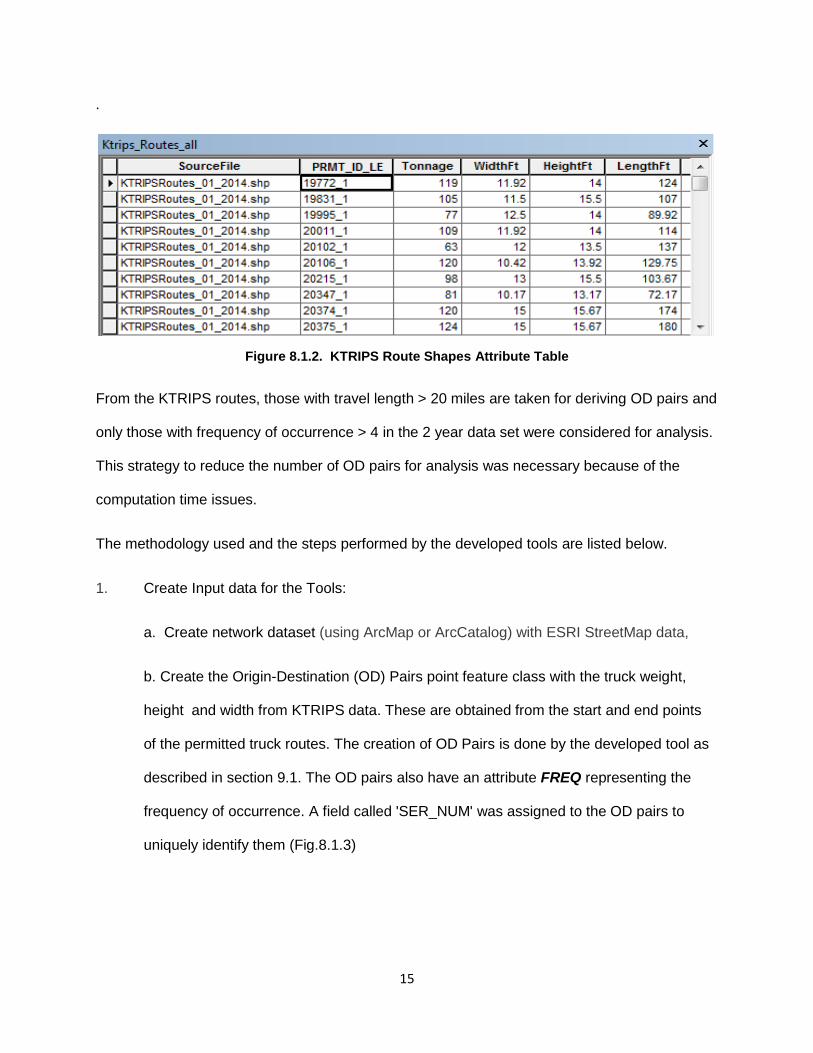
KTRIPS freight data consists of the spatial geometry of the route traversed by the permitted
trucks, truck size, permit type and other attributes. Figure 8.1.2 shows a sample of such route
shape attributes that shows the unique ID for the permit data (PRMT_ID_LE) and truck /load
dimensions. Bridges that do not have enough vertical clearance or weight restrictions were
considered point barriers in the route Length or DrivingTime calculation process. The bridge
attributes including vertical clearances and spatial location on the roadway network are
available from the AASHTOWare BrM (formerly PONTIS) database.
15
.
Figure 8.1.2. KTRIPS Route Shapes Attribute Table
From the KTRIPS routes, those with travel length > 20 miles are taken for deriving OD pairs and
only those with frequency of occurrence > 4 in the 2 year data set were considered for analysis.
This strategy to reduce the number of OD pairs for analysis was necessary because of the
computation time issues.
The methodology used and the steps performed by the developed tools are listed below.
1. Create Input data for the Tools:
a. Create network dataset (using ArcMap or ArcCatalog) with ESRI StreetMap data,
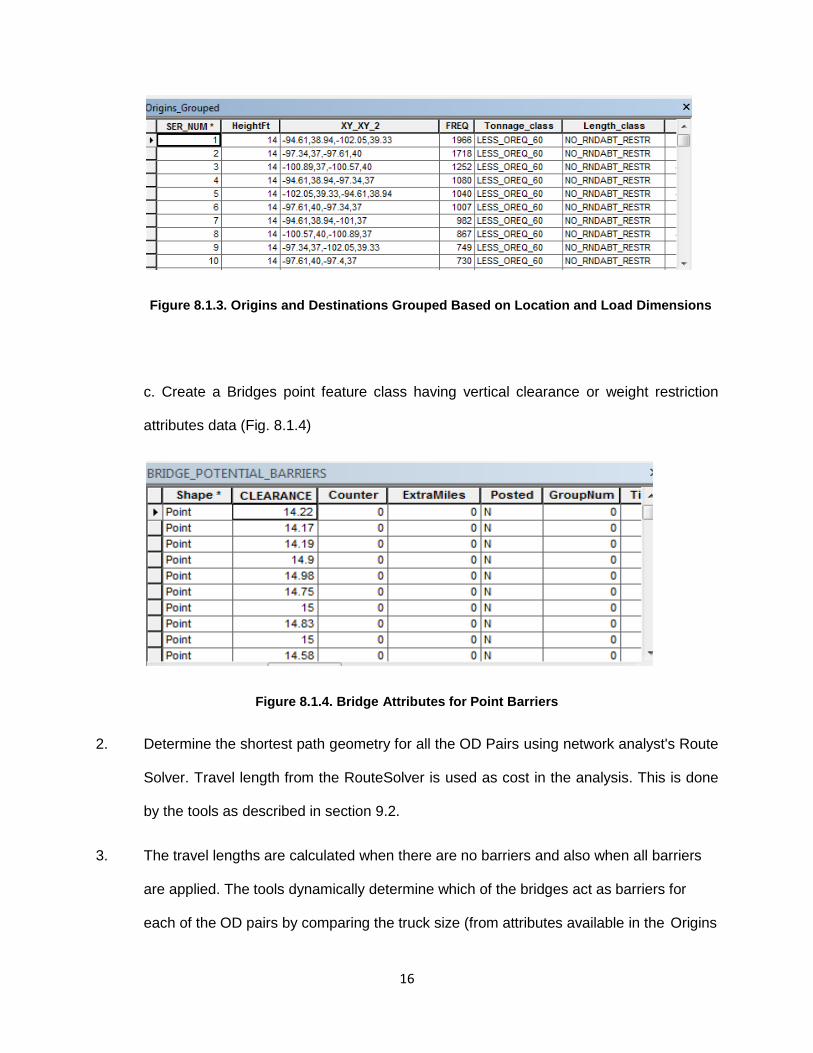
b. Create the Origin-Destination (OD) Pairs point feature class with the truck weight,
height and width from KTRIPS data. These are obtained from the start and end points
of the permitted truck routes. The creation of OD Pairs is done by the developed tool as
described in section 9.1. The OD pairs also have an attribute FREQ representing the
frequency of occurrence. A field called 'SER_NUM' was assigned to the OD pairs to
uniquely identify them (Fig.8.1.3)
16
Figure 8.1.3. Origins and Destinations Grouped Based on Location and Load Dimensions
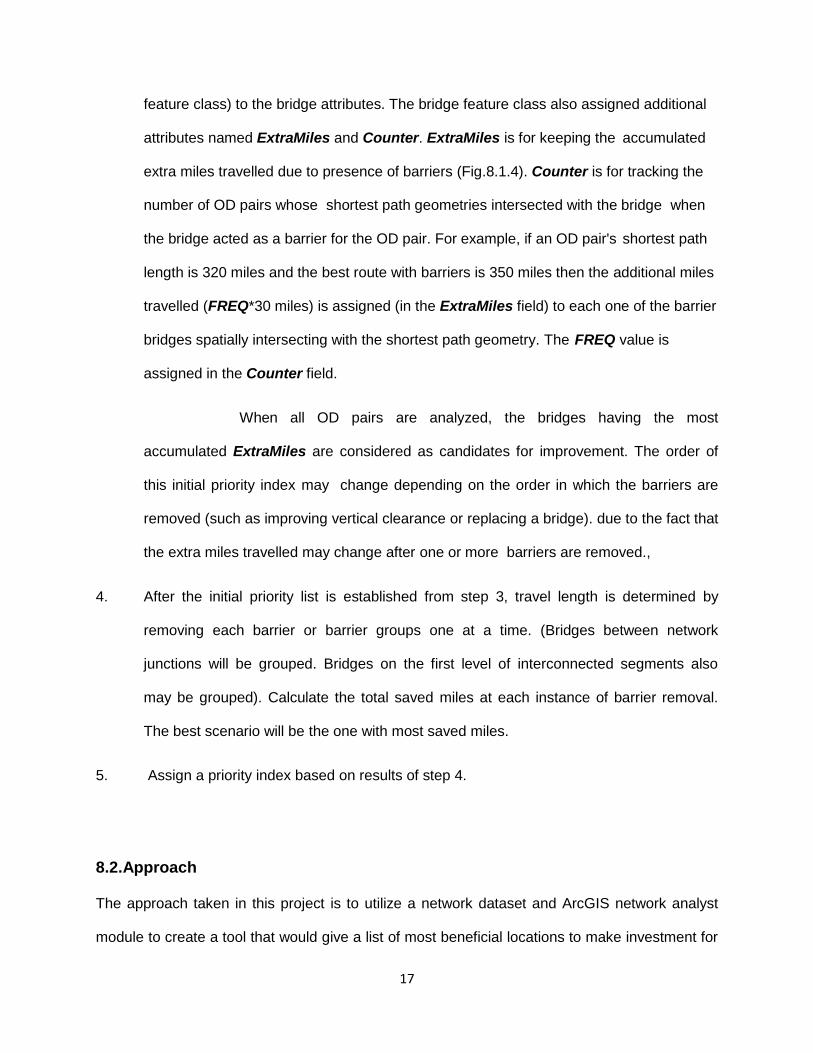
c. Create a Bridges point feature class having vertical clearance or weight restriction
attributes data (Fig. 8.1.4)
Figure 8.1.4. Bridge Attributes for Point Barriers
2. Determine the shortest path geometry for all the OD Pairs using network analyst's Route
Solver. Travel length from the RouteSolver is used as cost in the analysis. This is done
by the tools as described in section 9.2.
3. The travel lengths are calculated when there are no barriers and also when all barriers
are applied. The tools dynamically determine which of the bridges act as barriers for
each of the OD pairs by comparing the truck size (from attributes available in the Origins
17
feature class) to the bridge attributes. The bridge feature class also assigned additional
attributes named ExtraMiles and Counter. ExtraMiles is for keeping the accumulated
extra miles travelled due to presence of barriers (Fig.8.1.4). Counter is for tracking the
number of OD pairs whose shortest path geometries intersected with the bridge when
the bridge acted as a barrier for the OD pair. For example, if an OD pair's shortest path
length is 320 miles and the best route with barriers is 350 miles then the additional miles
travelled (FREQ*30 miles) is assigned (in the ExtraMiles field) to each one of the barrier
bridges spatially intersecting with the shortest path geometry. The FREQ value is
assigned in the Counter field.
When all OD pairs are analyzed, the bridges having the most
accumulated ExtraMiles are considered as candidates for improvement. The order of
this initial priority index may change depending on the order in which the barriers are
removed (such as improving vertical clearance or replacing a bridge). due to the fact that
the extra miles travelled may change after one or more barriers are removed.,
4. After the initial priority list is established from step 3, travel length is determined by
removing each barrier or barrier groups one at a time. (Bridges between network
junctions will be grouped. Bridges on the first level of interconnected segments also
may be grouped). Calculate the total saved miles at each instance of barrier removal.
The best scenario will be the one with most saved miles.
5. Assign a priority index based on results of step 4.
8.2.Approach
The approach taken in this project is to utilize a network dataset and ArcGIS network analyst
module to create a tool that would give a list of most beneficial locations to make investment for

18
improving infrastructure. The network dataset was created using ESRI StreetMaps North
America Dataset. The network dataset is a roadway network segmented at intersecting
roadways. These segments are called edges and the intersection points are called junctions.
The routable network is created from the roadway features that has the following attributes:
Segment length, one-way indicator (will indicate whether the segment is one-way or two-way
and the direction of travel), F_Elev (holds begin vertex point elevation level:0 for ground level, 1
for next level), T_Elev (holds ending vertex point elevation level), Speed and hierarchy
(hierarchy indicators: primary-1, secondary-2, local-3 etc.; for example, Interstate routes will be
assigned primary). The segment length and speed are used to calculate the driving time on
each segment. Turning delays are not included because specific data are not available. Global
turn delays are applied while creating the network dataset. The main highways were selected
using the attribute query SHIELD_CL in(1,2,3) OR ROAD_CL=3 OR ROADCLASS in (1,2,3).
This query selected 106,595 segments (out of 699,196 segments within Kansas State
Boundary) including many off-state system segments. The selected segments were exported to
a file geodatabase and then off-State system segments were removed as much as possible
manually. After creating the network dataset, 'Dissolve' is applied to further reduce the number
of network edges and junctions
9. The Developed Python Script Tools
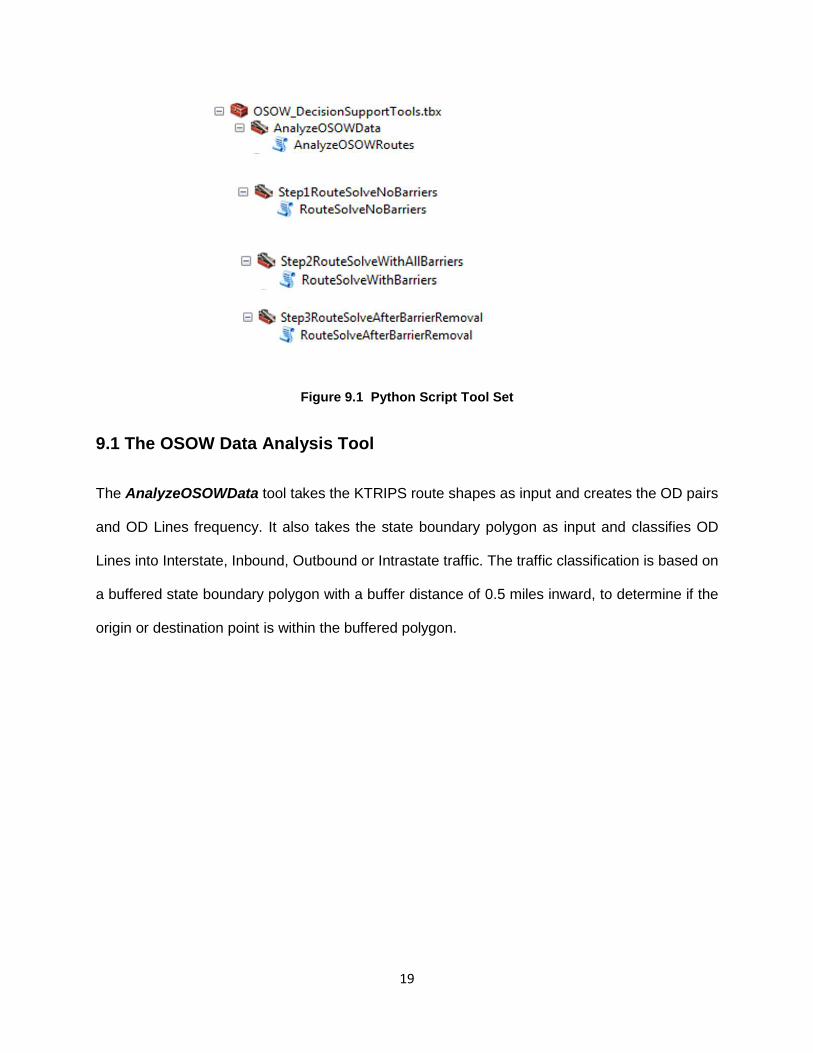
There are four tools in the developed Python toolbox as shown in Figure 9.1, for use in the
decision making process for infrastructure improvement to support OSOW traffic.
19
Figure 9.1 Python Script Tool Set
9.1 The OSOW Data Analysis Tool
The AnalyzeOSOWData tool takes the KTRIPS route shapes as input and creates the OD pairs
and OD Lines frequency. It also takes the state boundary polygon as input and classifies OD
Lines into Interstate, Inbound, Outbound or Intrastate traffic. The traffic classification is based on
a buffered state boundary polygon with a buffer distance of 0.5 miles inward, to determine if the
origin or destination point is within the buffered polygon.
20
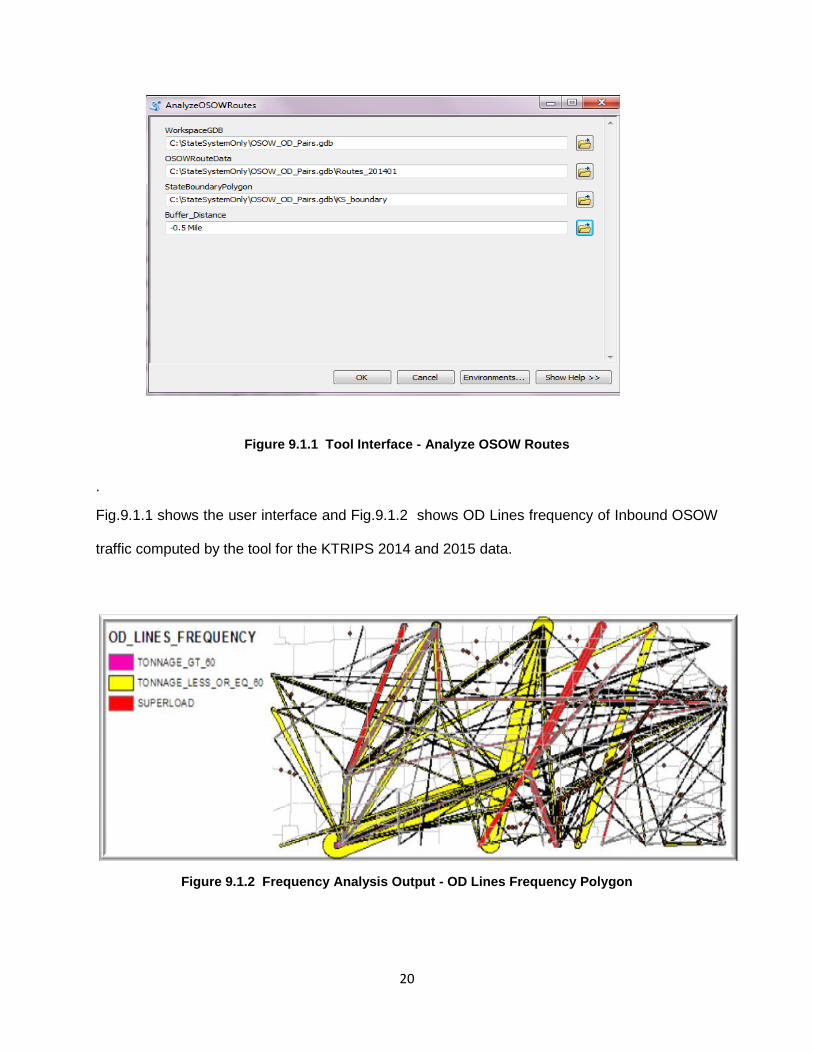
Figure 9.1.1 Tool Interface - Analyze OSOW Routes
.
Fig.9.1.1 shows the user interface and Fig.9.1.2 shows OD Lines frequency of Inbound OSOW
traffic computed by the tool for the KTRIPS 2014 and 2015 data.
Figure 9.1.2 Frequency Analysis Output - OD Lines Frequency Polygon
21
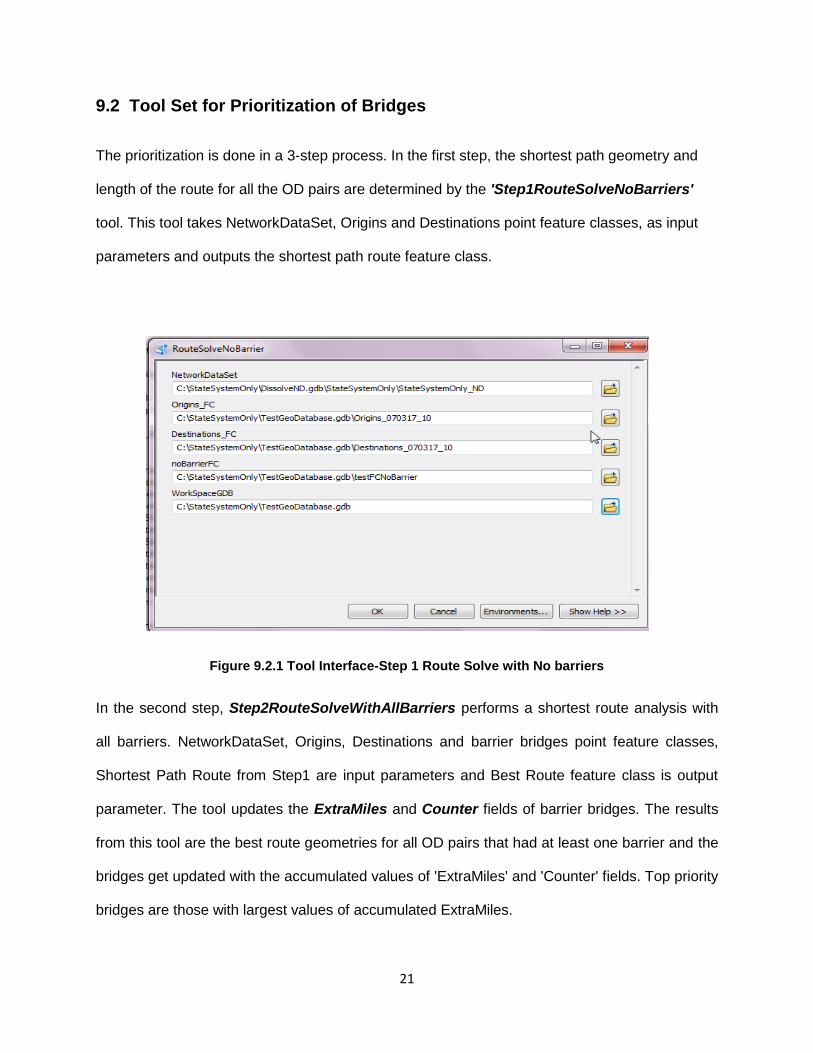
9.2 Tool Set for Prioritization of Bridges
The prioritization is done in a 3-step process. In the first step, the shortest path geometry and
length of the route for all the OD pairs are determined by the 'Step1RouteSolveNoBarriers'
tool. This tool takes NetworkDataSet, Origins and Destinations point feature classes, as input
parameters and outputs the shortest path route feature class.
Figure 9.2.1 Tool Interface-Step 1 Route Solve with No barriers
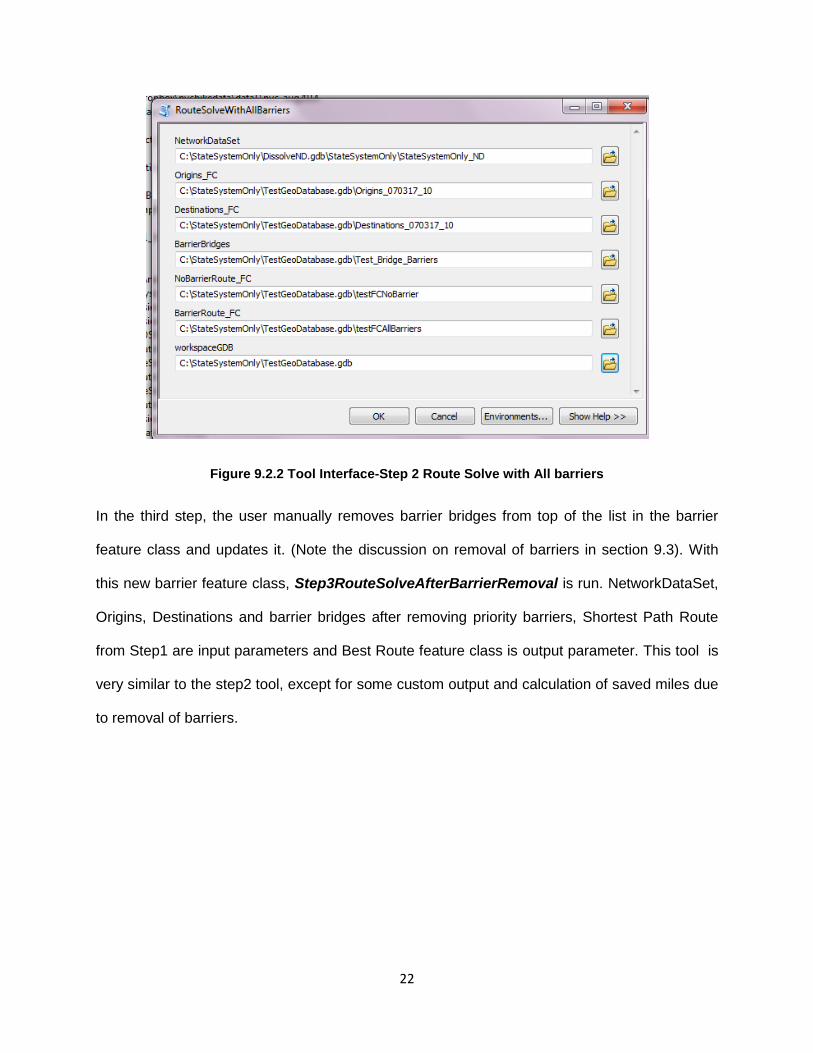
In the second step, Step2RouteSolveWithAllBarriers performs a shortest route analysis with
all barriers. NetworkDataSet, Origins, Destinations and barrier bridges point feature classes,
Shortest Path Route from Step1 are input parameters and Best Route feature class is output
parameter. The tool updates the ExtraMiles and Counter fields of barrier bridges. The results
from this tool are the best route geometries for all OD pairs that had at least one barrier and the
bridges get updated with the accumulated values of 'ExtraMiles' and 'Counter' fields. Top priority
bridges are those with largest values of accumulated ExtraMiles.
22
Figure 9.2.2 Tool Interface-Step 2 Route Solve with All barriers
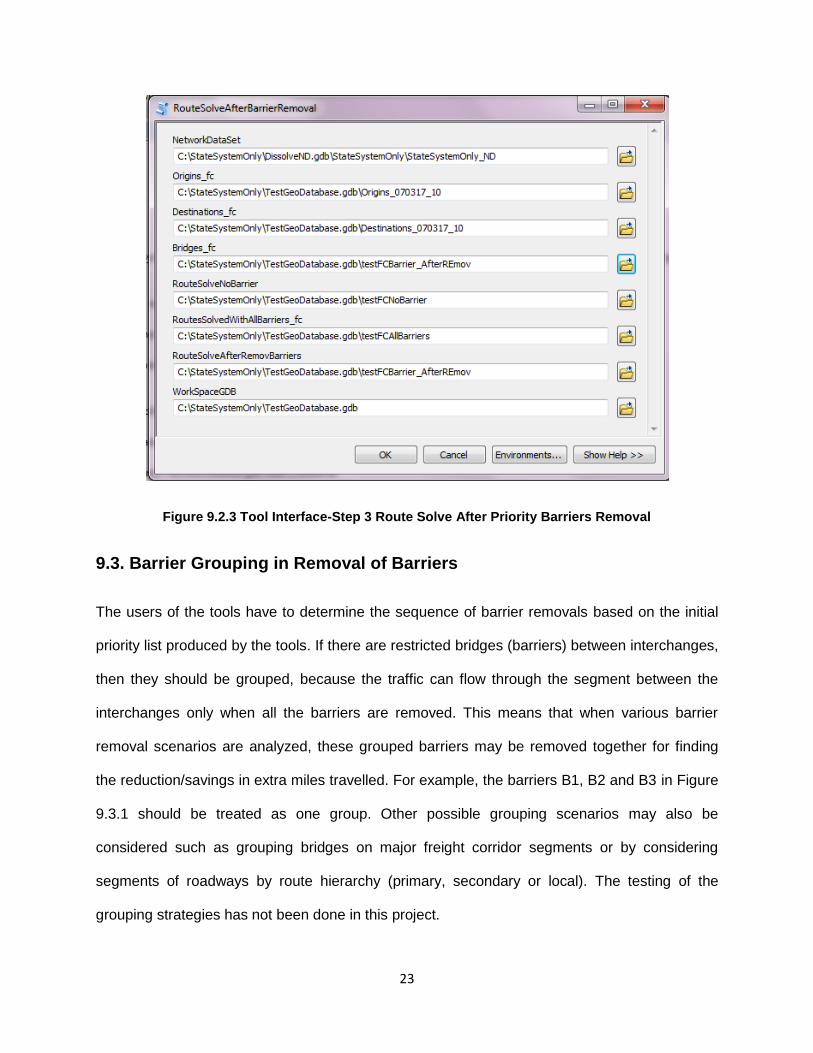
In the third step, the user manually removes barrier bridges from top of the list in the barrier
feature class and updates it. (Note the discussion on removal of barriers in section 9.3). With
this new barrier feature class, Step3RouteSolveAfterBarrierRemoval is run. NetworkDataSet,
Origins, Destinations and barrier bridges after removing priority barriers, Shortest Path Route
from Step1 are input parameters and Best Route feature class is output parameter. This tool is
very similar to the step2 tool, except for some custom output and calculation of saved miles due
to removal of barriers.
23
Figure 9.2.3 Tool Interface-Step 3 Route Solve After Priority Barriers Removal
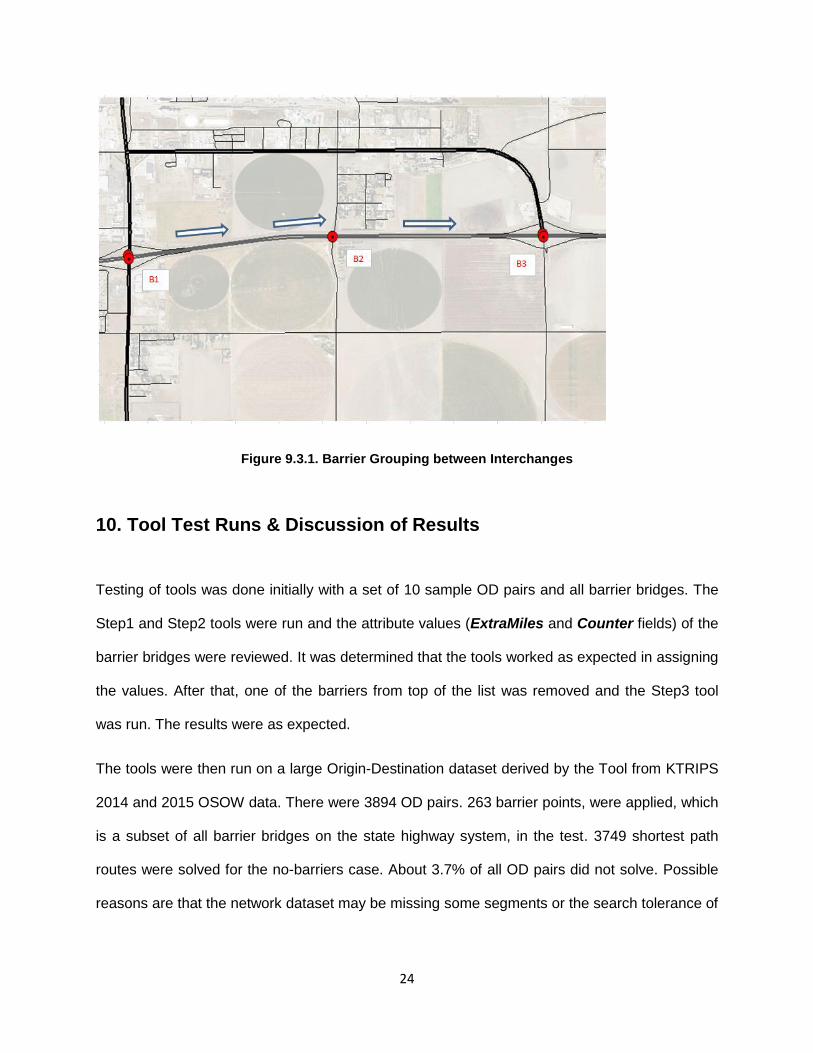
9.3. Barrier Grouping in Removal of Barriers
The users of the tools have to determine the sequence of barrier removals based on the initial
priority list produced by the tools. If there are restricted bridges (barriers) between interchanges,
then they should be grouped, because the traffic can flow through the segment between the
interchanges only when all the barriers are removed. This means that when various barrier
removal scenarios are analyzed, these grouped barriers may be removed together for finding
the reduction/savings in extra miles travelled. For example, the barriers B1, B2 and B3 in Figure
9.3.1 should be treated as one group. Other possible grouping scenarios may also be
considered such as grouping bridges on major freight corridor segments or by considering
segments of roadways by route hierarchy (primary, secondary or local). The testing of the
grouping strategies has not been done in this project.
24
Figure 9.3.1. Barrier Grouping between Interchanges
10. Tool Test Runs & Discussion of Results
Testing of tools was done initially with a set of 10 sample OD pairs and all barrier bridges. The
Step1 and Step2 tools were run and the attribute values (ExtraMiles and Counter fields) of the
barrier bridges were reviewed. It was determined that the tools worked as expected in assigning
the values. After that, one of the barriers from top of the list was removed and the Step3 tool
was run. The results were as expected.
The tools were then run on a large Origin-Destination dataset derived by the Tool from KTRIPS
2014 and 2015 OSOW data. There were 3894 OD pairs. 263 barrier points, were applied, which
is a subset of all barrier bridges on the state highway system, in the test. 3749 shortest path
routes were solved for the no-barriers case. About 3.7% of all OD pairs did not solve. Possible
reasons are that the network dataset may be missing some segments or the search tolerance of
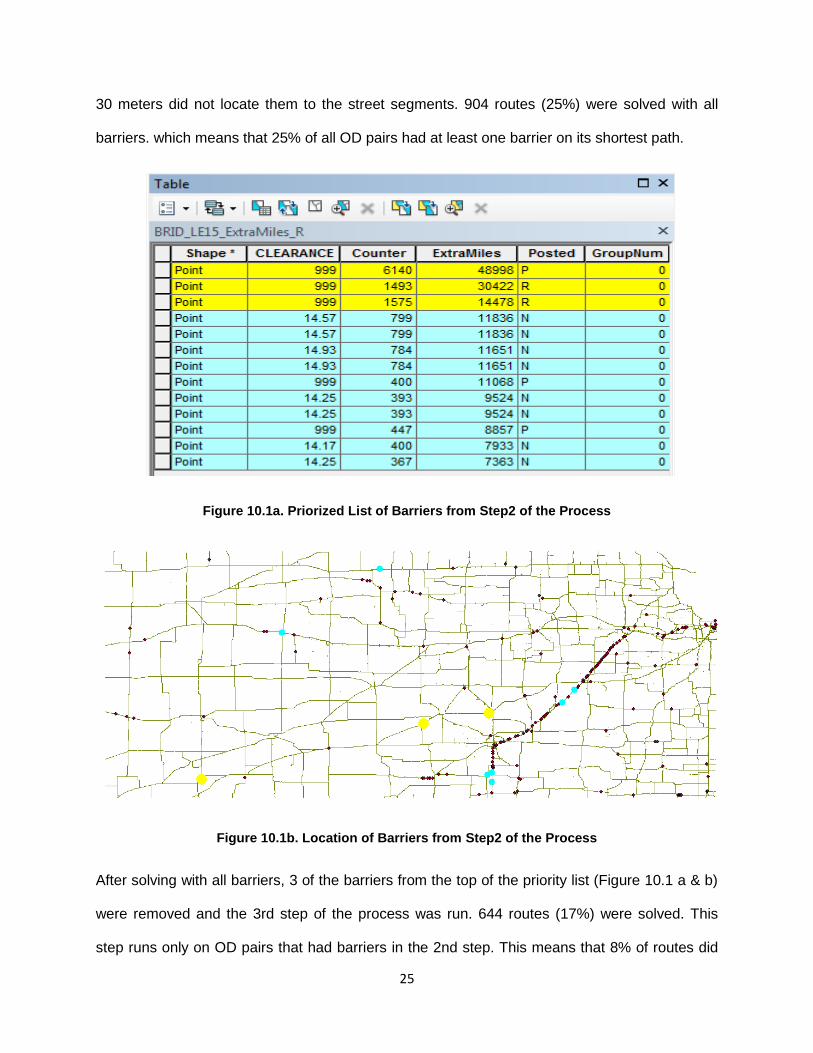
25
30 meters did not locate them to the street segments. 904 routes (25%) were solved with all
barriers. which means that 25% of all OD pairs had at least one barrier on its shortest path.
Figure 10.1a. Priorized List of Barriers from Step2 of the Process
Figure 10.1b. Location of Barriers from Step2 of the Process
After solving with all barriers, 3 of the barriers from the top of the priority list (Figure 10.1 a & b)
were removed and the 3rd step of the process was run. 644 routes (17%) were solved. This
step runs only on OD pairs that had barriers in the 2nd step. This means that 8% of routes did
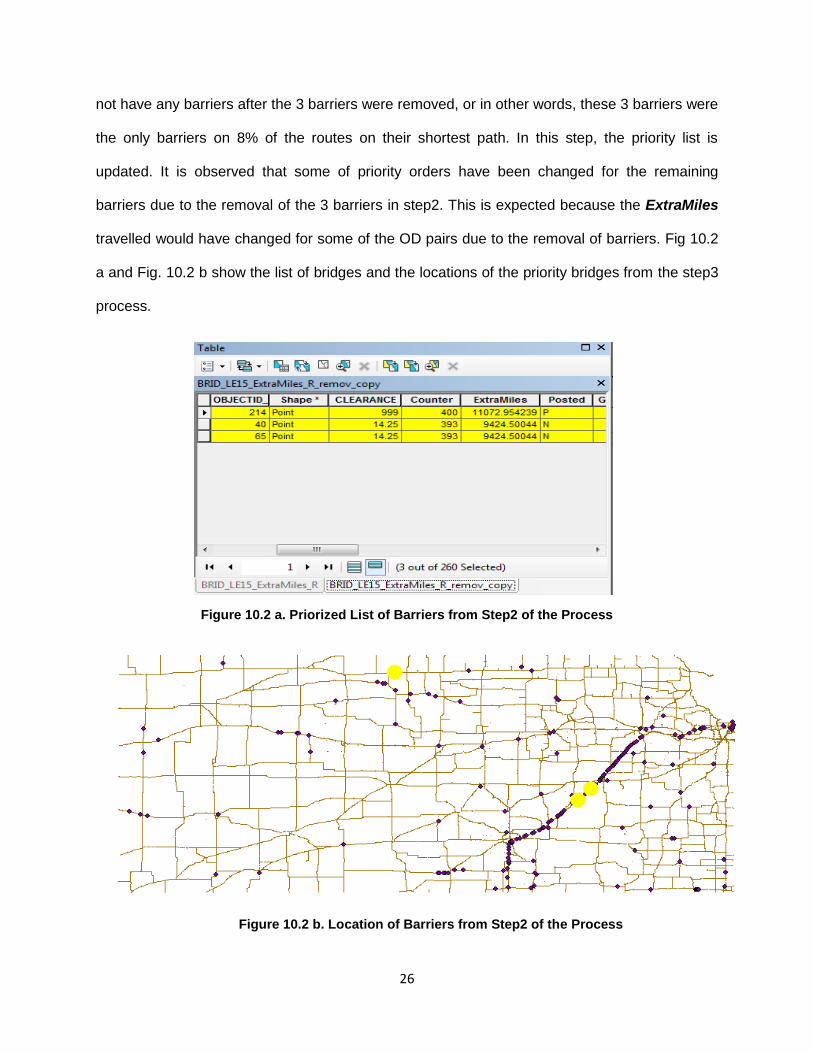
26
not have any barriers after the 3 barriers were removed, or in other words, these 3 barriers were
the only barriers on 8% of the routes on their shortest path. In this step, the priority list is
updated. It is observed that some of priority orders have been changed for the remaining
barriers due to the removal of the 3 barriers in step2. This is expected because the ExtraMiles
travelled would have changed for some of the OD pairs due to the removal of barriers. Fig 10.2
a and Fig. 10.2 b show the list of bridges and the locations of the priority bridges from the step3
process.
Figure 10.2 a. Priorized List of Barriers from Step2 of the Process
Figure 10.2 b. Location of Barriers from Step2 of the Process

27
11. Conclusions & Outlook
11.1 Conclusions
For completing this project, it was required that a routable network dataset and point barrier
feature class are available for analysis tool development and testing. KDOT currently does not
have a routable network. Bridges are kept in a Bridge management database (BrM). Therefore,
development and testing of the tools was done by extracting state highway system segments
from the ESRI Streetmap dataset. Using lat, long values of bridges in the BrM, a point feature
class was created and snapped to the network dataset and barrier points assigned on divided
highways. Posted bridges, load restricted bridges, roundabouts and vertical clearance <= 15 ft
bridges were included in the barrier feature class. KTRIPS data from 2014 and 2015 were used
by the tool to derive OD pairs.
From running the tools with the above data sets, it is concluded that the tools provide insight for
planning purposes by providing spatial data analysis/visualization capabilities for the OSOW
truck traffic data from KTRIPS. It creates an initial list of prioritized bridges for consideration in
creating a final list of improvement projects. The set of tools makes it possible to validate or
evaluate the initial priority list by analyzing different barrier removal scenarios. The tools are
provided for download on GitHub at URL:https://github.com/ekmandal/CapstoneProjectTools
This project was exploratory in nature because of the complexity of the problem. It would have
been greatly useful to establish some test cases to check the scripts. Also, some version control
measures would have been helpful. The routable network still needs more review to make sure
that there are no missing street segments. The barrier bridges also need to be verified that they
are snapped to appropriate street segments.
11.2 Further Work

28
Further work is necessary to fully analyze and interpret the results produced by the Prioritization
Tool for the effects of the applied methodology. It is desirable to run the tool on different
datasets for further evaluation of results. Even though significant patterns may not be observed
for these loads, monthly/seasonal patterns can be easily analyzed because of the availability of
the tools developed in this project. Computation time has been a major issue for analysis, so it
would be helpful to further explore ways to reduce computation time.
There are many other investigations possibly be conducted as future work
1. Investigate the effects of grouping bridges in barrier removal scenarios.
2. Explore different methods of applying cost of barrier such as dividing the additional
miles travelled by the total number of barriers when assigning ExtraMiles and see how
that affects the priority list.
3. Using ton-miles Instead of miles in assigning ExtraMiles to account for the effect of
over-weight trucks for the additional miles travelled.
4. Generate cost-benefit ratios for various barrier removal scenarios using the cost of
bridge replacement from FHWA's National Bridge Inventory (NBI) System Tables [18]
for replacing bridges or using costs of improving vertical clearances as completed by the
Kansas Turnpike Authority (KTA) [24] would be desirable.
5. Explore consolidating origin and destination points based on hot spot analysis
12. Bibliography
1. Arif, Farrukh., Bayaraktar ,Mehmet E., Chowdhury, Arindham G., Decision Support
Framework for Infrastructure Maintenance Investment Decision Making, Journal of Management
In Engineering, ASCE, 2015
29
2. TRANSCAD, Transportation Planning Software, Caliper Corp.,
http://www.caliper.com/PDFs/TransCADBrochure.pdf, Retrieved November 12, 2015
3. An Analysis of the Operational Cost of Trucking, A 2014 Update, American Transportation
Research Institute, September 2014. http://atri-online.org/wp-content/uploads/2014/09/ATRI-
Operational-Costs-of-Trucking-2014-FINAL.pdf , retrieved December 1, 2015
4. Kansas DOT, KDOT vertical clearance maps,
http://www.ksdot.org/burtransplan/maps/VerticalClear.asp, retrieved October 27, 2015
5. Kansas DOT,
http://ksdot1.ksdot.org/bureaus/burRail/rail/pdf/KFACKickoffMeetingPresentation.pdf, retrieved
October 27, 2015
6. FHWA, Safety, Vertical Clearance,
http://safety.fhwa.dot.gov/geometric/pubs/mitigationstrategies/chapter3/3_verticalclearance.cfm,
retrieved October 24, 2015
7. Resources for Measuring Transportation Costs and Benefits, Transportation Costs &
Benefits, Victoria Transportation Policy Institute, http://www.vtpi.org/tdm/tdm66.htm, retrieved
November 15, 2015
8. ASCE, http://www.infrastructurereportcard.org/cat-item/bridges/ retrieved August 1, 2017
9. Sugumaran, R.,Degroote, J., Spatial Decision Support systems: Principles and Practices,
CRC Press, Ringgold Inc, Portland, USA, 2011
10. Bridge Age, Kansas Bridge Fact Sheet,
http://www.ksdot.org/Assets/wwwksdotorg/Headquarters/PDF_Files/pressrelease2015/BRIDGE
AGE2015.pdf, Retrieved December 8, 2015
30
11. ESRI, ArcGIS Network Analyst,
http://www.esri.com/software/arcgis/extensions/networkanalyst/, retrieved December 1, 2015
12. AASHTOWare Bridge Update,
http://bridges.transportation.org/Documents/2015%20SCOBS%20presentations/General%20Se
ssion/E-Todd%20Thompson-AASHTOWare%20Bridge%20Update.pdf, retrieved December 10,
2015
13. Rodrigues, J.C., Simao, A., Antunes, C.H., A GIS based multicriteria Spatial Decision
Support System, Journal of Decision Support Systems (2011) pp 720-726
14. Kang, M.S., Srivastava, P., Fulton, J.P. et al, A Comprehensive GIS-based poultry litter
management system for nutrient management planning and litter transportation, Computers and
Electronics in Agriculture, Vol. 64, pp 212-224, 2008
15. Kim H.Y., Lee H.K., Enhanced validity and reliability of spatial decision support systems for
sustainable transportation decision making, Applied Geography, Vol. 51, July 2014, pp 65-71
16. Higgins, S.M., Estimating Economic Impacts from Transportation Investments Using Texas
Statewide Analysis Model and TREDIS, MSCE Thesis, University of Texas, Austin 2013.
17. Creating Network Datasets-Esri Video, http://video.esri.com/watch/2556/network-
analystcreating-network-datasets, Retrieved December 10, 2015
18. Bridges & Structures, Unit Cost, FHWA, http://www.fhwa.dot.gov/bridge/nbi/unit_cost.cfm,
Retrieved July 20, 2016
19. ArcGIS Resources, Dissolve Network,
http://desktop.arcgis.com/en/arcmap/10.3/tools/network-analyst-toolbox/dissolve-network.htm,
Retrieved September 2016
31
20. Kansas Truck Routing Intelligent Permitting System, KS Company User Guide,
https://www.k-trips.com/KTRIPS%20Company%20User%20Guide%20and%20Training.pdf,
Retrieved December 2015
21. About StreetMap North America, Esri,
http://resources.arcgis.com/EN/HELP/MAIN/10.1/index.html#//001z00000039000000, June
2016.
22. Russell, E.R., Landman, D.E., Optimizing the Analysis of Routing Oversize/Overweight
Loads to Provide Efficient Freight Corridors, Kansas State University, 2012
http://transport.ksu.edu/files/transport/imported/Reports/KSU114_Final-3.pdf, Retrieved July 20,
2016
23. Prozzi, J. et al, Oversize Overweight Vehicle Research Priorities , Texas A& M
Transportation Institute, 2014, https://static.tti.tamu.edu/tti.tamu.edu/documents/PRC-14-10-
F.pdf, Retrieved July 2017
24. Raising Bridges, Kansas Turnpike Authority, 2016. You tube video
https://www.youtube.com/watch?v=dDocoFVr82Q, Retrieved June 2017
25. Measuring Accuracy of Latitude and Longitude,
https://gis.stackexchange.com/questions/8650/measuring-accuracy-of-latitude-and-
longitude/8674#8674, Retrieved June 2017.