GIS for the Insurance Claims Process - Esri · Esri, 380 New York St., Redlands, CA 92373-8100 USA...
23
An Esri ® White Paper • April 2012 GIS for the Insurance Claims Process: Five Steps for an Effective Workflow Esri, 380 New York St., Redlands, CA 92373-8100 USA TEL 909-793-2853 • FAX 909-793-5953 • E-MAIL [email protected] • WEB esri.com
Transcript of GIS for the Insurance Claims Process - Esri · Esri, 380 New York St., Redlands, CA 92373-8100 USA...

An Esri ® White Paper • April 2012
GIS for the Insurance Claims Process: Five Steps for an Effective Workflow
Esri, 380 New York St., Redlands, CA 92373-8100 USA TEL 909-793-2853 • FAX 909-793-5953 • E-MAIL [email protected] • WEB esri.com

Copyright © 2012 Esri All rights reserved. Printed in the United States of America. The information contained in this document is the exclusive property of Esri. This work is protected under United States copyright law and other international copyright treaties and conventions. No part of this work may be reproduced or transmitted in any form or by any means, electronic or mechanical, including photocopying and recording, or by any information storage or retrieval system, except as expressly permitted in writing by Esri. All requests should be sent to Attention: Contracts and Legal Services Manager, Esri, 380 New York Street, Redlands, CA 92373-8100 USA. The information contained in this document is subject to change without notice. Esri, the Esri globe logo, ArcGIS, StreetMap, ArcMap, ArcInfo, arcgis.com, esri.com, and @esri.com are trademarks, service marks, or registered marks of Esri in the United States, the European Community, or certain other jurisdictions. Other companies and products or services mentioned herein may be trademarks, service marks, or registered marks of their respective mark owners.

J10081
Esri White Paper i
GIS for the Insurance Claims Process: Five Steps for an Effective Workflow
An Esri White Paper Contents Page Introduction and Purpose of the Paper .................................................. 1 Geographically Enabling the Insurance Claims Process ...................... 2
Understanding Geography as a Common Frame of Reference ...... 2 Justifications for Incorporating GIS into Business Processes and IT Systems .............................................................................. 2
Five Steps for Optimizing the Insurance Claims Process ..................... 4
Data Organization ........................................................................... 4 Case Study: Explore Information.............................................. 5
Analysis and Planning..................................................................... 6 Case Study: USDA's Risk Management Agency ..................... 6
Mobility........................................................................................... 8 Case Study: Amica Mutual Insurance....................................... 9
Management .................................................................................... 11 Case Study: EQECAT............................................................... 11
Customer Engagement .................................................................... 12 Case Study: Willis Re ............................................................... 13
GIS Software Considerations ................................................................ 16 Esri GIS for the Insurance Claims Process—The Future Is Now ......... 18
Esri Interoperability and SOA ........................................................ 18 How to Get Started.......................................................................... 18

J10081
Esri White Paper 1
GIS for the Insurance Claims Process: Five Steps for an Effective Workflow
Introduction and Purpose of the Paper
Filing an insurance claim to cover the loss of personal property, health, or even life can be an emotional time for a policyholder. For some customers, filing a claim is the only time they interact with an insurance company representative. This makes it even more important that an insurance company focus on the needs of its customers and deliver quality claims service. This "moment of truth" can be brand defining for the insurance organization—helping customers back on their feet quickly and efficiently provides them with the service they expect and increases their confidence in the organization's ability to assist them. Claims loss payouts and related expenses are the most significant cost to property insurance organizations and subsequently have the largest impact on underwriting profits. It is important to an insurance company's viability that the claims process be effective and efficient. Historically, claims organizations have relied on a large pool of knowledgeable, highly skilled staff to provide effective customer service and support. However, as the American work force shrinks and businesses look for ways to improve worker effectiveness, increase productivity, and enhance customer satisfaction, it is imperative to automate the claims process. Making an investment in technology can help claims process automation. This white paper describes how geographic information system (GIS) technology can be part of a more expedient claims process. GIS is a key component in modernizing the information technology (IT) of many organizations. By leveraging the data management, analysis, and visualization capabilities of GIS, claims adjusters are empowered to deliver services more efficiently. After reading this white paper, ■ Management of insurance claims organizations will understand the importance of
geographically enabling information systems (with GIS) to support their core missions.
■ Claims professionals will recognize how GIS can support their claims processes and
workflows. ■ IT personnel will understand that Esri® technology is scalable from the desktop to
the server to mobile devices and is available in the cloud.
GIS for the Insurance Claims Process: Five Steps for an Effective Workflow
J10081
April 2012 2
Geographically Enabling the
Insurance Claims Process
As the single largest expense for property and casualty (P&C) carriers, the claims management process is a focal point in driving improved customer satisfaction and increased underwriting profits. In fact, a recent study by Deloitte shows that improvement of a single percentage point in claims costs could return significant savings for insurers. If this is true, what can be done to improve costs? The answer: build a workflow based on intelligent maps. Think about the process of managing the response to a catastrophic weather event. Animated weather maps track the storm's path and intensity only. Once the storm makes landfall, the information about the impact and severity may be available, but there is no way to accurately gauge the true area or understand the extent of the damage that has occurred. Today, responding to customers who have had a loss depends on receiving their calls. Adjuster assignments are scheduled based on the order a call is received instead of the more efficient manner of proximity to the location of the adjuster's last visit. This lag in action can add time to the process, which often drives higher costs and can increase customer dissatisfaction. Insurers that have built their claims management workflow on intelligent maps are achieving significantly better results including quicker response time and better estimation of loss. Real-time event tracking and geocoded customer points, integrated on a map using GIS, simplify and improve the accurate identification of customers in the impacted area. Customer information that is stored in the map is used before the event to make reverse 911 calls, plan triage support, and calculate maximum potential loss in real time. Intelligent maps both in the office and on an adjuster's mobile device efficiently route customer visits. Mobile maps also give adjusters access to location information, such as "before" photos, that improves their effectiveness at the loss site. Maps embedded in dashboards in the corporate office provide easy-to-use tools that management needs to effectively staff offices, manage performance, and identify potential fraud by providing a holistic view of the business. The integration of intelligent maps in the claims process holds the key to achieving a percentage point or more improvement in claims costs.
Understanding Geography as a
Common Frame of Reference
Modernizing insurance information systems to facilitate more efficient business processes requires geographically referenced information. The science of geography recognizes that almost everything that exists can be described in terms of its location. A standard framework of spatial coordinates to communicate and relate the placement of people, things, and events can be applied to anything, wherever that may be. Geography provides a spatial baseline that is used for storing, analyzing, and communicating almost every type of data. Geography can supply a structurally coherent common ground for decision support mechanisms.
Justifications for Incorporating GIS
into Business Processes and IT
Systems
Place matters in the insurance claims process. Knowing where helps insurers better understand how to respond to customers. Carriers can make more timely decisions by understanding the location of a claim, and knowledge of exposures and other data about location ensures that they have adequate resources available to service their customers at a time when they are needed most.

GIS for the Insurance Claims Process: Five Steps for an Effective Workflow
J10081
Esri White Paper 3
Geographically enabled IT systems coupled with appropriate GIS technology provide claims insurance agents with enhanced capabilities that may be leveraged throughout many business processes. Claims insurance agents stand to benefit profoundly from the increased application of location intelligence through GIS technology. ■ GIS improves organizational performance through significant administrative and
program savings:
● Improved quality of geographic data to provide policy and practice decision support
● Time and money saved by correcting wrong addresses
● Time and money saved on more efficient routing of adjusters in the field after a
disaster
● Geographically enabled address management and geocoding that vastly improve accuracy and decision making
● Timely identification of provider and client fraud
■ GIS improves service delivery:
● Increased referral compliance for clients through maps and directions
● Improved call center efficiency using reverse geocoding to identify caller locations
● More efficient routing of adjusters
● Early identification of significant issues after a catastrophe
■ GIS facilitates data integration:
● Integration of a variety of third-party and externally collected data from many organizations to support the claims process
■ GIS helps perform essential analyses:
● Eligibility determination
● Referral (closest option, options within a distance range or area, options on a route)
● Access to services (including performance measures, network analysis, and
service area definition)
● Trend analysis and detection

GIS for the Insurance Claims Process: Five Steps for an Effective Workflow
J10081
April 2012 4
● Use of services by geography
● Fraud detection Besides the justifications listed above, GIS helps insurance organizations develop more customer-centric IT systems facilitated by common standards, interoperability with other organizations, and web-based access and integration. For a system to be customer-centric, it is absolutely necessary to know where the customer lives and his or her relative location to risks. GIS facilitates such analyses and enhances customer-centric claims processes and a positive customer experience. Increasingly, insurance companies are advocating common standards through which information systems can interoperate with other systems. Esri's current technologies have appropriate open application programming interfaces and support key data interchange formats and web services standards for ensuring relevant GIS and IT interoperability between systems over wired and/or wireless networks. Another example of a common data standard critical in day-to-day operations is an address management and geocoding system. As the standard GIS for organizations around the world, Esri technology provides many data management and analysis tools for integrating all the information needed to make an effective claims process.
Five Steps for Optimizing the
Insurance Claims Process
There are five steps performed by GIS to create more accurate and descriptive information, using location, that is important to the claims process. The five steps are
1. Data organization 2. Analysis and planning 3. Mobility 4. Management 5. Customer engagement
Data Organization Access to and organization of data about an insured asset and where it is located are cornerstones to effective delivery of claims service. Establishing a consistent, relevant, and reliable point of reference is a necessary first step. Ensuring that the location of the property insured is accurate to the rooftop is a smart business decision. Geocoding is the first step toward making better decisions. Insurers can't fully understand risks or customers until they know exactly where those risks and customers are. Geocoding is the process to find and link geographic coordinates to data, such as addresses and postal codes to customer locations, infrastructure, and assets. The process includes searching for the address in the reference data and finding a best match and then returning a latitude-longitude coordinate or point feature on a map. Geocoding is used to find the location of customers or assets and understand the spatial relationships between the location and other geographic data, such as flood zones, school districts, or electoral boundaries.

GIS for the Insurance Claims Process: Five Steps for an Effective Workflow
J10081
Esri White Paper 5
Reference files, input address records, address locators, and software are required to perform geocoding. Whether on the desktop, on a server, or online, Esri offers a variety of geocoding options in products built on ArcGIS® technology.
Case Study: Explore Information
Based in Eagan, Minnesota, Explore Information Services aggregates, analyzes, and delivers location-based risk intelligence to insurance carriers in the United States. For more than two decades, the company has built online solutions that are integrated into insurance underwriting and rating workflows. Explore's solutions help insurers reduce expenses and better align the price of each policy to actual risk exposures using, among other factors, the location of the policy. The first solution Explore created using GIS and models was the automated fire protection information service FIRESAFE (www.exploredata.com). FIRESAFE organizes and analyzes data Explore has gathered about fire stations across the United States, including personnel, staffing, equipment capabilities, and jurisdiction boundaries. From this analysis, Explore produces emergency response times to the location of the property and performs the corresponding risk analysis. Explore staff use ArcGIS for Server and Microsoft SQL Server to create and maintain FIRESAFE. ArcGIS for Server can create, manage, and distribute GIS services over the web to support desktop, mobile, and web mapping applications. ArcGIS for Server helps analysts evaluate the risk of fire peril and provide the data for FIRESAFE. Depending on the solution, hundreds of attributes are assigned to a particular location and analyzed, and risk scores are assigned. Using ArcGIS and Microsoft SQL Server, Explore staff work with very large databases, many containing millions of records. After integrating ArcGIS into FIRESAFE, Explore built additional solutions including Auto Location Insight. Auto Location Insight helps insurance carriers assess location-based risk for automobile policyholders derived from their garaging address and the likely commute routes in the area. Analysis is done with ArcGIS for Server and Esri StreetMap™ Premium—a dataset from providers and Esri partners NAVTEQ and TomTom. Street addresses are converted into spatial data that is displayed on a map; analysis can then be run against that data to find the shortest or fastest distance between locations. The commute time is highly accurate due to the information provided with the street networks. Historical traffic data, such as the average travel speed for roadways to create more accurate arrival time projections and avoid congestion based on day and time, can be applied to the modeling. The solution provides a more accurate risk assessment by using the actual address rather than by modeling traditional ZIP Code-level territories. Additional georeferenced data can be analyzed, including traffic, weather, and crime. Explore staff has achieved higher levels of accuracy than before by using ArcGIS for Server and StreetMap Premium. Explore's solutions help insurance carriers fine-tune premiums to maximize their profitability. Ironically, Explore's clientele, insurance carriers, don't even see a map. Most of Explore's GIS work is done on the back end of the solutions it provides. Explore's actuarial staff takes the geocoded information that is created and implements it into the company's predictive analytics solutions. The result is delivered to the customer in

GIS for the Insurance Claims Process: Five Steps for an Effective Workflow
J10081
April 2012 6
various forms, such as a table with risk scores that carriers use to more accurately price their policies. With GIS, Explore's service to customers has also increased. Before switching to ArcGIS, the entire process of updating, rebuilding, and republishing street networks to analyze policies required the system to be taken offline each quarter. This could take the time equivalent to one full-time employee's work for a month. Now, the entire process takes less than two days.
Analysis and Planning
Location analysis leverages information about geography and spatial relationships to make assessments and identify opportunities to manage issues that might create inefficiencies or compromise the quality of service. Location analysis of geocoded books of business, along with georeferenced hazard data such as fire ring or storm footprint data, allows a claims organization to add dimension and context that is useful to understanding customers who are at greatest risk of suffering a loss. Armed with this insight, claims organizations can proactively plan staffing and identify resources needed to respond to events. This is especially true for extreme events. Typical of most large events, the First Notice of Loss (FNOL) usually drives claims engagement strategy. Weather event tracking integrated in an interactive map makes it possible for insurance companies to plan a proactive response to an approaching event. The transparency and accuracy of information derived from analytics performed on maps like these mitigate the complexities of tasks such as identifying the right skills and competencies, staging resources, assigning central points of distribution for adjusters, and assigning locations for mobile claims units. This allows claims staff and organizational stakeholders to focus on protecting their customers and responding to their needs.
Case Study: USDA's Risk Management
Agency
The United States Department of Agriculture's (USDA) Risk Management Agency (RMA), based in Washington, DC, with 10 regional offices and 6 compliance offices throughout the United States, helps food producers manage their business risks through effective market-based risk management solutions. As part of this mission, RMA manages the Federal Crop Insurance Corporation (FCIC) to provide American farmers and ranchers with crop insurance. RMA develops and approves the premium rate, administers premium and expense subsidies, approves and supports products, and reinsures the private-sector insurance providers through the Standard Reinsurance Agreement (SRA). In crop year 2009, RMA managed nearly $80 billion worth of potential liability. RMA relies on maps that are standardized across the country in creating fair and equitable pricing and making the process transparent to the producers. RMA has created handbooks for each office so they can standardize editing performed on maps. Now everyone is following the same standards, so producers have the same risk assessments across their lands and understand risk assignments in all geographic areas.

GIS for the Insurance Claims Process: Five Steps for an Effective Workflow
J10081
Esri White Paper 7
The RMA Actuarial Information Browser map viewer is used by farmers, crop insurance agents, approved insurance providers, and RMA to view insurance offers at a subcounty level.
This is important, since where crops are physically located dictates the type of coverage producers are offered. Insurance offers are based on the crop yield for a particular parcel of land. This information is garnered from the farmer's production history, the harvest-time futures price set at a commodity exchange before the policy is sold, and the type of crop planted. The policy will pay an indemnity if the combination of the actual yield and the cash settlement price in the futures market is less than the guarantee. Using GIS to drill down past the county designation, RMA can designate subcounty insurance offers that are considered high risk, which excludes the insurance history from the calculations that are used to determine the premium rates for the entire county. The result is a premium rate decrease for most producers, as more high-risk acreage is reported correctly.
GIS for the Insurance Claims Process: Five Steps for an Effective Workflow
J10081
April 2012 8
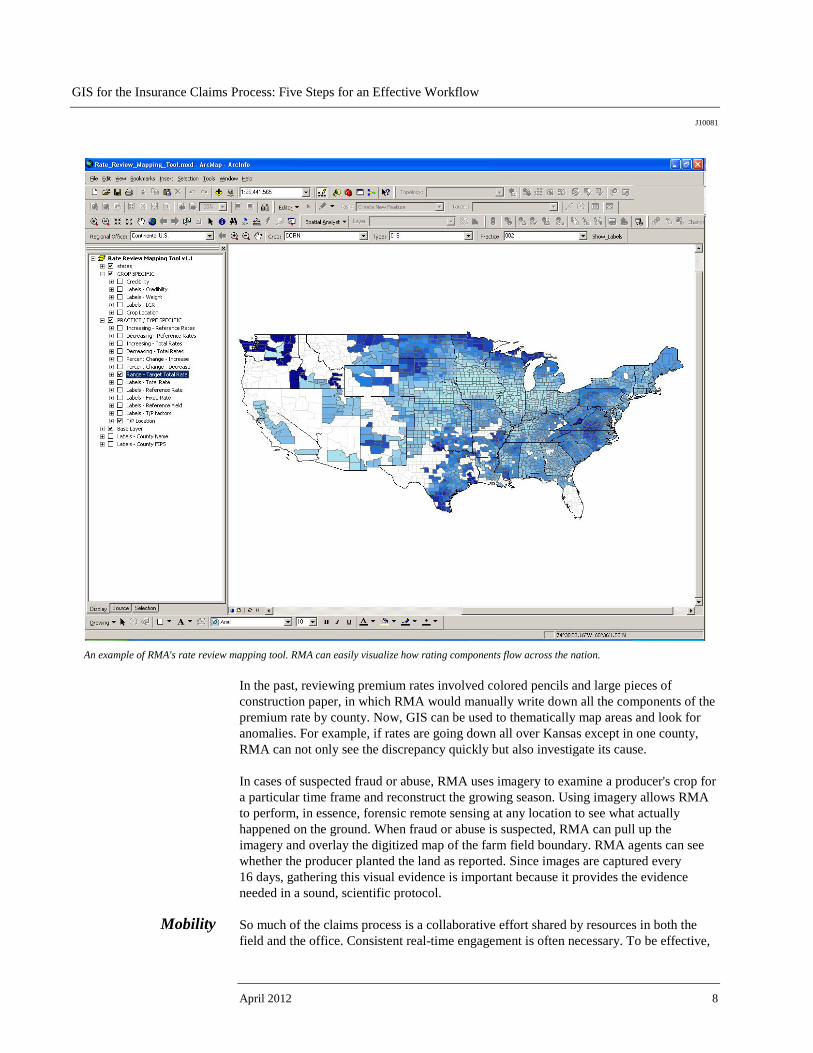
An example of RMA's rate review mapping tool. RMA can easily visualize how rating components flow across the nation.
In the past, reviewing premium rates involved colored pencils and large pieces of construction paper, in which RMA would manually write down all the components of the premium rate by county. Now, GIS can be used to thematically map areas and look for anomalies. For example, if rates are going down all over Kansas except in one county, RMA can not only see the discrepancy quickly but also investigate its cause. In cases of suspected fraud or abuse, RMA uses imagery to examine a producer's crop for a particular time frame and reconstruct the growing season. Using imagery allows RMA to perform, in essence, forensic remote sensing at any location to see what actually happened on the ground. When fraud or abuse is suspected, RMA can pull up the imagery and overlay the digitized map of the farm field boundary. RMA agents can see whether the producer planted the land as reported. Since images are captured every 16 days, gathering this visual evidence is important because it provides the evidence needed in a sound, scientific protocol.
Mobility So much of the claims process is a collaborative effort shared by resources in both the field and the office. Consistent real-time engagement is often necessary. To be effective,
GIS for the Insurance Claims Process: Five Steps for an Effective Workflow
J10081
Esri White Paper 9
field personnel must be process enabled and well informed about customers, their assets, contracts, and the conditions that they might find at the site after a loss. To complete an on-site inspection and assessment of the damage, field adjusters need directions to the loss site, accurate location information, and the tools and forms needed to capture information about the loss details. GIS adds efficiency to the process by giving field adjusters with mobile devices access to the same maps and information that are available to personnel in the office. Tasks such as validating insured location, optimizing a field adjuster's workload using customer proximity, identifying and counting buildings on a parcel, and accessing information such as dimensions and measurements improve efficiency and effectiveness. Additionally, making maps available to managers via mobile devices as a common operational view gives them what they need to track productivity of workers or assess resource needs and make real-time decisions.
Case Study: Amica Mutual Insurance
Because many Amica Mutual Insurance policyholders owned homes or other property in the path of Hurricane Irene, the company wanted to ensure that it had adequate resources to provide services when these people needed them most. Amica, a provider of personal insurance for autos, homes, and boats, is headquartered in Lincoln, Rhode Island. Known in the industry for its high standard of customer service, the company has been awarded several J.D. Power customer satisfaction awards. Amica monitored Irene last summer as the hurricane moved up the East Coast of the United States, using real-time weather warnings from the National Oceanic and Atmospheric Administration (NOAA). This information, which included live radar loops focused on the strongest parts of the storm, was brought into ArcGISSM Online as map services, a standard way to view location-based information on the web. By viewing live data streams and comparing them with internal policy data, Amica personnel were able to watch the storm in real time and quickly identify which areas were likely to generate the most claims. Before their eyes, the path of destruction passed through North Carolina and Virginia, all the way up the East Coast.
GIS for the Insurance Claims Process: Five Steps for an Effective Workflow
J10081
April 2012 10
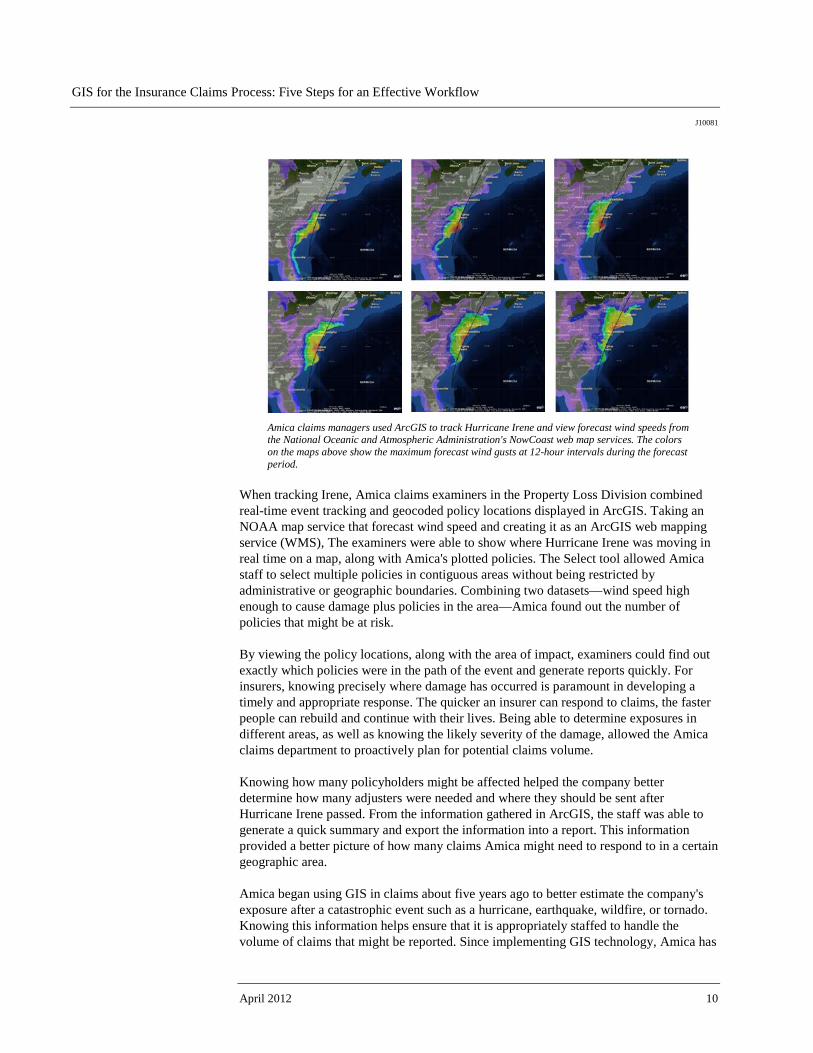
Amica claims managers used ArcGIS to track Hurricane Irene and view forecast wind speeds from the National Oceanic and Atmospheric Administration's NowCoast web map services. The colors on the maps above show the maximum forecast wind gusts at 12-hour intervals during the forecast period.
When tracking Irene, Amica claims examiners in the Property Loss Division combined real-time event tracking and geocoded policy locations displayed in ArcGIS. Taking an NOAA map service that forecast wind speed and creating it as an ArcGIS web mapping service (WMS), The examiners were able to show where Hurricane Irene was moving in real time on a map, along with Amica's plotted policies. The Select tool allowed Amica staff to select multiple policies in contiguous areas without being restricted by administrative or geographic boundaries. Combining two datasets—wind speed high enough to cause damage plus policies in the area—Amica found out the number of policies that might be at risk. By viewing the policy locations, along with the area of impact, examiners could find out exactly which policies were in the path of the event and generate reports quickly. For insurers, knowing precisely where damage has occurred is paramount in developing a timely and appropriate response. The quicker an insurer can respond to claims, the faster people can rebuild and continue with their lives. Being able to determine exposures in different areas, as well as knowing the likely severity of the damage, allowed the Amica claims department to proactively plan for potential claims volume. Knowing how many policyholders might be affected helped the company better determine how many adjusters were needed and where they should be sent after Hurricane Irene passed. From the information gathered in ArcGIS, the staff was able to generate a quick summary and export the information into a report. This information provided a better picture of how many claims Amica might need to respond to in a certain geographic area. Amica began using GIS in claims about five years ago to better estimate the company's exposure after a catastrophic event such as a hurricane, earthquake, wildfire, or tornado. Knowing this information helps ensure that it is appropriately staffed to handle the volume of claims that might be reported. Since implementing GIS technology, Amica has

GIS for the Insurance Claims Process: Five Steps for an Effective Workflow
J10081
Esri White Paper 11
realized that pushing this technology to the front lines could have a profound impact on the way it services its policyholders.
Management As efforts to automate processes have begun to take hold, data is becoming more accessible. Providing all stakeholders with actionable information from the data collected is an industry-wide objective. GIS provides mapping tools for actionable intelligence from organizational to operator levels. Location analysis for claims organizations can be as granular or high level as necessary to make informed decisions. Rather than relying on anecdotal views of a situation derived from reports, maps add another dimension to information important to managing events. Location analysis gives managers a real-world view of conditions, workload, field adjuster effectiveness, and performance. Organizationally, GIS can help discover how the claims operation is effectively meeting its obligations to resolve claims in a timely fashion. An organization's leadership team has access to claims status information by geography and in real time for greater agility and active response to mitigating service issues. Interactive and bidirectional feeds between the map, charts, and graphs of a dashboard allow users to more thoroughly analyze and monitor organizational performance. GIS also provides insurance agents with the ability to collaborate with other data providers and third-party operators contracted to act on the company's behalf in settling claims. GIS facilitates response and recovery and enhances the project management, cooperation, and coordination that need to happen between insurers, emergency services, and other service providers. GIS can be the key to ensuring seamless integration of information important to responding to and fully resolving the event.
Case Study: EQECAT After a magnitude 9.0 earthquake rocked Japan on March 11, 2011, and set off a tsunami, the catastrophe risk modeling firm EQECAT, Inc., headquartered in Oakland, California, quickly went to work gathering information for clients. Besides collecting economic and scientific data related to the disaster, EQECAT needed digital maps that showed the tsunami flood zones, where aftershocks were located, damaged areas including roads, and the location of population centers in the affected areas. The maps were created by Esri staff using ArcGIS Online, a platform anyone can use to create and share geographic content and build GIS and mapping applications. Accessible via ArcGIS.com, ArcGIS Online hosts maps, applications, and tools published by the GIS user community that can be shared freely. EQECAT knows the power of seeing where natural disasters strike. The consulting firm helps clients in the insurance, financial, and commercial industries more fully understand the risk of earthquakes, typhoons, and tsunamis so they can better manage their business operations. Just seven days after the earthquake struck the Japan Trench megathrust fault off Honshu's east coast, EQECAT was in action. The company gathered staff and clients from around the world for a report called a Catastrophe Watch, or CatWatch, that delved into what occurred.

GIS for the Insurance Claims Process: Five Steps for an Effective Workflow
J10081
April 2012 12
Satellite imagery provides a very quick and accurate sense of what happens on the ground after a catastrophic event, including where damage has occurred. This image shows the location of impassable roads in Japan after the 2011 earthquake and tsunami.
Broadcast via a webinar, this report on the earthquake detailed postevent effects including economic and insured losses. CatWatch was attended by primary insurers, reinsurance agencies, brokers, corporations, hedge fund managers, and investment firms that have business dealings in Japan. EQECAT's clients were provided with a comprehensive overview of the event, in part due to the maps created using ArcGIS Online. Maps were produced displaying data on the tsunami flood zone, data on Japan's highways and major roads, topographic data, and even population information from the Japan Society of Family Sociology.
Customer Engagement
As the proliferation of social media continues, insurance organizations are beginning to harvest Tweets and other social media posts to plan and execute their response to events. As the relationship between maps and social media matures, insurers have found that the information and insight gained serve as vehicles to ground truthing assumptions. Mapping posts from Twitter, YouTube, and Facebook feeds provides options for insurance agents to connect with their insurers on claims or coverage needs. From the recent catastrophes in Haiti, Japan, and the United States, insurers have learned to harness the collaborative power of social media and maps. These mediums provide a means for customers to track damage and share the progress of repairs and also provide information about their health and safety. As events were reported, social media also
GIS for the Insurance Claims Process: Five Steps for an Effective Workflow
J10081
Esri White Paper 13
provided a mechanism for bilateral communication, which was not possible because other means of communication were down. As one insurer viewed it, using maps and social media gives customers access to tools that help them help themselves more effectively than they have ever been able to in the past.
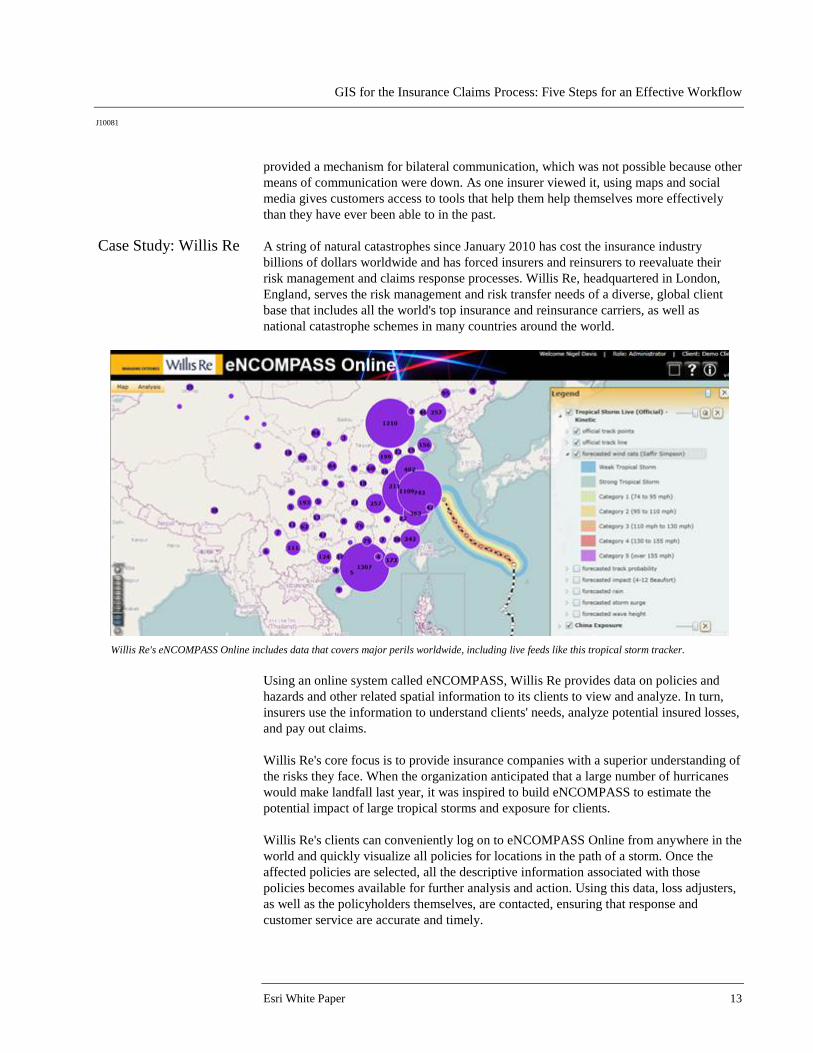
Case Study: Willis Re A string of natural catastrophes since January 2010 has cost the insurance industry billions of dollars worldwide and has forced insurers and reinsurers to reevaluate their risk management and claims response processes. Willis Re, headquartered in London, England, serves the risk management and risk transfer needs of a diverse, global client base that includes all the world's top insurance and reinsurance carriers, as well as national catastrophe schemes in many countries around the world.
Willis Re's eNCOMPASS Online includes data that covers major perils worldwide, including live feeds like this tropical storm tracker.
Using an online system called eNCOMPASS, Willis Re provides data on policies and hazards and other related spatial information to its clients to view and analyze. In turn, insurers use the information to understand clients' needs, analyze potential insured losses, and pay out claims. Willis Re's core focus is to provide insurance companies with a superior understanding of the risks they face. When the organization anticipated that a large number of hurricanes would make landfall last year, it was inspired to build eNCOMPASS to estimate the potential impact of large tropical storms and exposure for clients. Willis Re's clients can conveniently log on to eNCOMPASS Online from anywhere in the world and quickly visualize all policies for locations in the path of a storm. Once the affected policies are selected, all the descriptive information associated with those policies becomes available for further analysis and action. Using this data, loss adjusters, as well as the policyholders themselves, are contacted, ensuring that response and customer service are accurate and timely.

GIS for the Insurance Claims Process: Five Steps for an Effective Workflow
J10081
April 2012 14
The software on which eNCOMPASS is built is ArcGIS, which was chosen following a deliberate and intense review of potential technologies. Willis Re is one of the first in the insurance business community to understand and implement a solution that integrates all levels and supports open access, collaboration, and transparency. It is able to do this because it has access to authoritative data and can create high-quality maps that support visualization, spatial analysis, and models through a rich application. eNCOMPASS Online includes data that covers major perils worldwide, from flood zones in Latin America to earthquakes in New Zealand. Willis Re staff use live feeds for real-time or near real-time information on events. For example, the United States Geological Survey (USGS) live feed is used to display recent significant earthquake activity around the globe. When the earthquake and subsequent tsunami hit Japan, Willis Re staff derived a bespoke—or custom-made—estimated representation of the tsunami zone using GIS geoprocessing, a digital elevation model (DEM), and ground observations. The DEM was derived from Advanced Spaceborne Thermal Emission and Reflection Radiometer (ASTER) sensors. ASTER provides remotely sensed terrain data that is easy to access and of a reasonable resolution (30 m) and wide coverage. Land elevation and slope were derived to analyze where inundation from water would take place. This tsunami dataset was loaded in eNCOMPASS Online soon after the event for analysis purposes. Willis Re staff also provided earthquake ShakeMaps from USGS and displayed this data on top of a world topographic map from Esri.

GIS for the Insurance Claims Process: Five Steps for an Effective Workflow
J10081
Esri White Paper 15
Visualizing social media posts allows insurers to get reports on events as they happen.
One of the powerful analytic functions of the solution is the tsunami impact footprint. Using a mapcentric view of risks in a portfolio makes it much easier to identify insurance risks impacted by the tsunami. Using ArcGIS, risks in the tsunami zone were easily identified, extracted, and exported for offline loss estimation. Finding the correct location of policyholders was more difficult. Often, insurance companies hold policy data aggregated in various levels, such as administrative boundaries. Instead of providing point data for each policy at the street address level, many insurers hold policy location information only by postal codes, counties, or municipalities. This is often true in Japan, as well as many other countries. Substandard addresses are the result of incomplete data capture, poor addressing systems for a particular country, or perhaps high purchase costs for geocoding to high resolution in a particular country. While many insurers believe that the cost of creating the geocodes surpasses the benefit of doing so, not providing accurate address-level information means that there is not much to work with when estimating damage. Willis Re worked with clients in Japan to find the most accurate location information it could. Coupled with data on flood inundation, Willis Re was able to begin providing the services required to assist people in rebuilding their homes and businesses. Next time, hopefully, the process will be easier. After the various catastrophes this year, Willis Re observed an increase in the appetite for better address data to use in tools, such as eNCOMPASS Online, to facilitate decision

GIS for the Insurance Claims Process: Five Steps for an Effective Workflow
J10081
April 2012 16
making. Insurers have begun capturing policy data, including the address, not just a postal or ZIP Code, and passing this up to the broker. Another aspect assisting in collection of more accurate data is a phenomenon called volunteered geographic information. Willis became aware of many people on the ground who are connected by virtue of their personal devices: laptops, smartphones, and digital assistants, to name a few. Instead of remotely sensed data, Willis staff was able to get "near-sensed" data from people using social media to report on events as they happened via text messages or photos they took on the ground. If these on-the-scene reports contain a location—and many do—this information can be harnessed. Location-aware social networks have a huge potential to enable people in a community to help themselves during a crisis. Spatial analysis makes crowdsourced data actionable. While one Flickr, Twitter, or Facebook post may not be critical, if there are many posts, a heat map from data collected on the ground pertaining to property damage, hazards, evacuations, power outages, and help and services can be collected from the best source of data—those affected. Visualizing this data as hot spots or trends gives an idea of the density of reports coming from a single area. This can assist in allocating resources to those who need the help most or aid the validation of whether incidents reported are corroborated by others, adding increased clarity to a situation. More than just dots on maps, hot spots organize lots of data and quickly provide a better understanding of the data. Reports can also be filtered by date to see daily trends. Providing this information in a spatial context can connect individuals and optimize the use of trained resources. For example, GIS can help brokers find all the Flickr posts within 100 meters of an insured property, for example, to get a real understanding of damage and claims from those actually in the area. The Internet is a natural platform for geospatial analysis. Many participants can easily move from data sharing to creating shared services in this environment. The technology makes it possible: collaborative computing, service integration, mashups, user-contributed content, and distributed data management are some of the many ways that access has been opened to new users and applications. While the technology opens the gates, it takes more than technology to create applications that are useful. Having access to authoritative data and committing the platform resources allow communities to use the technology in the manner they need to accomplish their tasks.
GIS Software Considerations
Identifying common software needs will make specification, standardization, and implementation of GIS applications for IT modernization more cost-effective and enhance the sharing of data, software, and other resources. Standard capabilities of GIS software may be used to support the needs of any insurer. The type of software used in insurance IT modernization must be able to do the following: Manage data: Comprehensive data management and administrative reporting systems will have the ability to be used throughout the organization. Successful use of data management capabilities depends on adherence to the standard geographic or spatial reference system based on Esri technology. Esri technology meets this requirement fully and provides a comprehensive array of analytic tools. Use a relational database management system (RDBMS) integrated with GIS: enhanced and more accurate RDBMS-maintained data provides a decision support system of
GIS for the Insurance Claims Process: Five Steps for an Effective Workflow
J10081
Esri White Paper 17
reliable, usable, and accurate data necessary to support an organization's critical business operations like claims process management. An RDBMS provides the following advantages to insurance organizations: ■ Improved performance, scalability, and portability ■ Improved data integrity ■ Enhanced flexibility and maintainability ■ Enhanced security features Esri technology meets this requirement fully. The geodatabase is the common data storage and management framework for ArcGIS, Esri's GIS technology. ArcGIS can be used wherever it is needed—on desktops, in servers (including on the web), or on mobile devices. ArcGIS implements the geodatabase as either a collection of files in a file system or a collection of tables within an RDBMS. Maintain data accuracy: To ensure that all the mapped information is correctly positioned requires verifying geographic information supplied by clients and providers. This demands stringent controls and authenticated data as well as ascertaining that the customer's location is accurate. Esri technology supports geocoding in ArcGIS, and it is also possible to build simple geocoding web applications with ArcGIS for Server. Additional solutions include Esri's ArcGIS Online for Organizations, and a number of Esri partners offer services in address management and geocoding. Handle map creation and display: GIS will help insurance claims agents create and display their results in different forms—maps, charts, graphs, and other graphics. Maps dynamically linked to charts, graphs, and other graphics allow greater exploratory spatial data analysis. In addition to the capacity of producing maps in traditional paper formats, GIS enables maps to be easily exchanged in digital format on the intranet or Internet or through other storage media. For example, insurance claims professionals may create a series of maps and reports to demonstrate accessibility of services after a catastrophe and share it internally via an intranet, with their customers as printed maps, on the web, or in apps. Esri's GIS solutions meet this requirement fully. Include web functionality: The web has become a way of sharing and transmitting information. Insurance professionals can leverage web functionality to deliver and improve services that seek to lower cost. Solutions must support multiple interfaces in an efficient manner. Esri's GIS solutions meet this requirement fully. Query and display databases: GIS query tools are frequently used to search for data in the database and display results in both map and tabular formats. Esri's GIS solutions meet this requirement fully.

GIS for the Insurance Claims Process: Five Steps for an Effective Workflow
J10081
April 2012 18
Esri GIS for the Insurance Claims
Process—The Future Is Now
Esri Interoperability
and SOA Insurance organization needs are evolving. There has been an evolution from desktop analysis to server-based applications. Esri has responded to this fundamental technological shift by enabling ArcGIS as a service-oriented architecture (SOA), with full web service integration. This allows insurance organizations to readily expose ArcGIS standards-based functionality to other applications and interfaces, dramatically improving its value and return on investment. With SOA-enabled GIS from Esri, insurance organization IT systems can leverage their GIS advances as they progress from desktop analysis to server applications to enterprise approaches. Esri recognizes that data and software capabilities need to be available to a wide range of users in an organization, each of whom may access and use different business tools. The distributed nature of GIS has many implications for interoperability with respect to hardware environments, operating systems, data management, deployment of application logic (desktop, server, mobile), web services integration, and openly documented application programming interfaces (APIs) and documented XML data schemas. Esri has addressed interoperability comprehensively by implementing a variety of standards, strategies, and techniques in ArcGIS. Esri is also positioned to assist insurance claims organizations and their systems integrators as they pursue planning and development. In addition to technology products, Esri offers many resources to facilitate the governance, business, and architecture of SOA deployment. Esri's Professional Services Division includes insurance and business enterprise domain specialists, and its partner program includes both organizations that have developed SOA connectors and those with domain specialty in insurance claims services.
How to Get Started Esri's insurance team includes domain specialists who are prepared to have discussions with staff from insurance claims organizations regarding how GIS can support their programmatic goals. Management and staff at insurance claims organizations are advised to do the following: ■ Visit the Esri insurance web pages. ■ Contact [email protected]. ■ Subscribe to Esri News for Business, a quarterly newsletter about software, events,
and user stories affecting the business community, including insurance organizations. ■ Join the Esri Insurance User Group, an active community of insurance professionals
dedicated to sharing information, ideas, and experiences about Esri technology in the insurance industry.
■ Managers should attend the Esri Business Summit.

GIS for the Insurance Claims Process: Five Steps for an Effective Workflow
J10081
Esri White Paper 19
■ Technical staff should attend the Esri International User Conference. ■ View insurance presentations from past Esri conferences. ■ Take a class through the Esri Virtual Campus. ■ Learn more about Esri Professional Services. ■ Connect with the Esri Partner Network.

Printed in USA
Contact Esri
380 New York Street Redlands, California 92373-8100 usa
1 800 447 9778 t 909 793 2853 f 909 793 5953 [email protected] esri.com
Offices worldwide esri.com/locations
Esri inspires and enables people to positively impact their future through a deeper, geographic understanding of the changing world around them.
Governments, industry leaders, academics, and nongovernmental
organizations trust us to connect them with the analytic knowledge
they need to make the critical decisions that shape the planet. For
more than 40 years, Esri has cultivated collaborative relationships
with partners who share our commitment to solving earth’s most
pressing challenges with geographic expertise and rational resolve.
Today, we believe that geography is at the heart of a more resilient
and sustainable future. Creating responsible products and solutions
drives our passion for improving quality of life everywhere.