Getting to Carbon Neutral: A Review of Best Practices in...
24
244 Getting to Carbon Neutral: A Review of Best Practices in Infrastructure Strategy C. Kennedy,* D. Bristow, S. Derrible, E. Mohareb, S. Saneinejad, R.Stupka, L. Sugar, R. Zizzo, and B. McIntyre CHAPTER 7 Summary: Measures of cost-effectiveness for reducing GHG emissions from cities are established for 22 case studies, mainly involving changes to infrastruc- ture. GHG emissions from cities are primarily related to transportation, energy use in buildings, electricity supply, and waste. A variety of strategies for reducing emissions are examined through case studies ranging from US$0.015 million to US$460 million of capital investment (US dollars). e case studies have been collected to support a Guide for Canadian Municipalities on Getting to Carbon Neutral (G2CN). e cost effectiveness, given by annual GHG emissions saved per dollars of capital investment, is found to vary between 3 and 2,780 t e CO 2 / yr / US$million for the G2CN database. e average cost-effectiveness of the database of 550 t e CO 2 / yr / US$million is significantly exceeded by solid waste projects in Canada (FCM); and by developing world projects under the Clean Development Mechanism (CDM). Five case studies in the G2CN database with GHG savings over 100,000 t eCO 2 are highlighted. Yet, cities need to start planning projects with reductions of the order 1 million plus t eCO 2 per year in order to substantially reduce emissions below current levels for smaller cities (1 million people) and mega-cities. *Corresponding author: [email protected]
Transcript of Getting to Carbon Neutral: A Review of Best Practices in...

244 �
Getting to Carbon Neutral: A Review of Best Practices
in Infrastructure StrategyC. Kennedy,* D. Bristow, S. Derrible, E. Mohareb, S. Saneinejad,
R.Stupka, L. Sugar, R. Zizzo, and B. McIntyre
CHAPTER7
Summary: Measures of cost-effectiveness for reducing GHG emissions from cities are established for 22 case studies, mainly involving changes to infrastruc-ture. GHG emissions from cities are primarily related to transportation, energy use in buildings, electricity supply, and waste. A variety of strategies for reducing emissions are examined through case studies ranging from US$0.015 million to US$460 million of capital investment (US dollars). The case studies have been collected to support a Guide for Canadian Municipalities on Getting to Carbon Neutral (G2CN). The cost effectiveness, given by annual GHG emissions saved per dollars of capital investment, is found to vary between 3 and 2,780 t e CO2 / yr / US$million for the G2CN database. The average cost-effectiveness of the database of 550 t e CO2 / yr / US$million is significantly exceeded by solid waste projects in Canada (FCM); and by developing world projects under the Clean Development Mechanism (CDM). Five case studies in the G2CN database with GHG savings over 100,000 t eCO2 are highlighted. Yet, cities need to start planning projects with reductions of the order 1 million plus t eCO2 per year in order to substantially reduce emissions below current levels for smaller cities (1 million people) and mega-cities.
*Corresponding author: [email protected]
CHAPTER 7 � 245
1. INTRODUCTION
The main sources of greenhouse gas (GHG) emissions attributable to cities are transportation, energy use in buildings, electricity supply, and to a lesser extent waste (Kennedy et al. 2009). Transportation emissions per capita are inversely related to urban density; sprawling, low density cities designed around automo-biles have higher emissions than more compact cities with substantial public transportation. Building energy use is primarily dependent on climate, i.e., heating degree days, but can also be impacted by the quality of building envelopes. Emissions from electricity depend to some extent on the level of consumption, but more significant is the means of power generation; nuclear and renewable sources (hydro, solar, wind, etc.) have close to zero direct emissions. Emissions from landfill waste, which are often particularly significant for cities in the devel-oping world, are primarily dependent on the extent to which waste methane or other gases are captured. Overall, it is clear that urban GHG emissions are highly dependent on a range of infrastructure systems.
In order to reduce GHG emissions, it is necessary to first understand the scale of such emissions. Inventories of emissions primarily from western cities typically vary from about 3 t eCO2 per capita to over 20 t e CO2 per capita (Kennedy et al. 2009). This means that for mega-cities of close to 10 million people, GHG emission are of the order 100 million t e CO2. For example, Los Angeles County has estimated emissions of 122 million t e CO2; and New York City has emissions of 85 million t e CO2 (Table 1). Smaller western cities, of 1 million people, typically have emission of the order 10 million t e CO2.
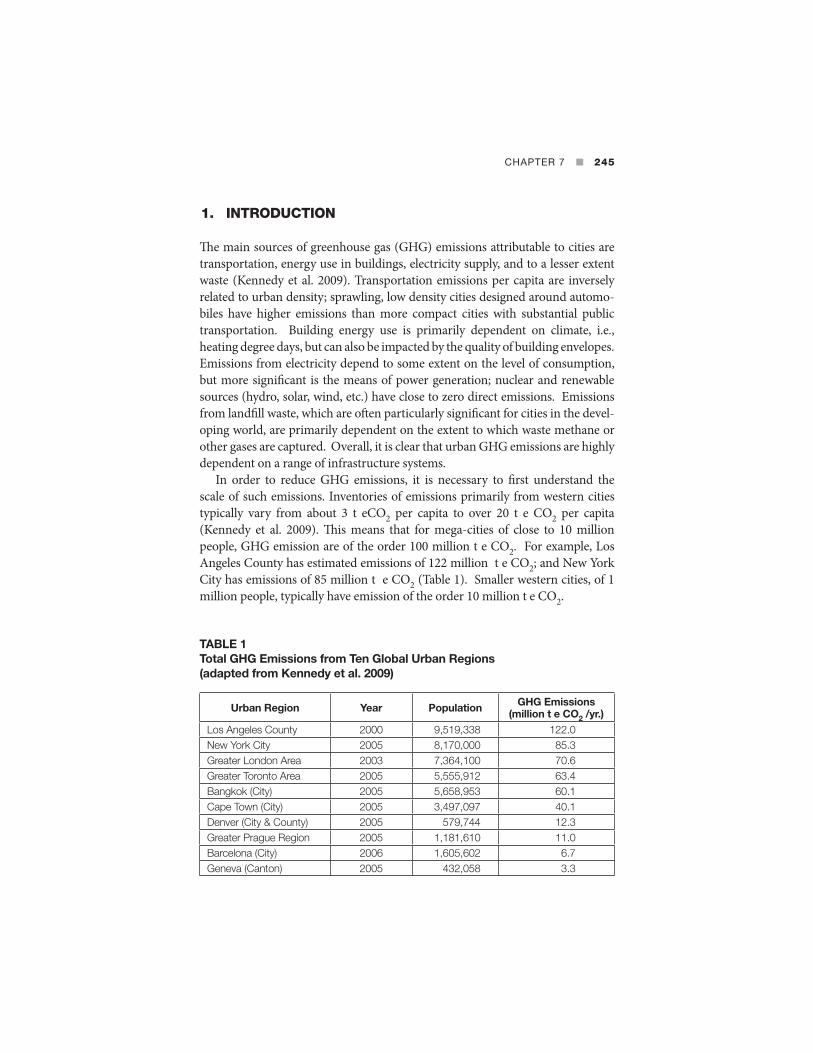
TABLE 1 Total GHG Emissions from Ten Global Urban Regions (adapted from Kennedy et al. 2009)
Urban Region Year Population GHG Emissions(million t e CO2 /yr.)
Los Angeles County 2000 9,519,338 122.0New York City 2005 8,170,000 85.3Greater London Area 2003 7,364,100 70.6Greater Toronto Area 2005 5,555,912 63.4Bangkok (City) 2005 5,658,953 60.1Cape Town (City) 2005 3,497,097 40.1Denver (City & County) 2005 579,744 12.3Greater Prague Region 2005 1,181,610 11.0Barcelona (City) 2006 1,605,602 6.7Geneva (Canton) 2005 432,058 3.3
246 � CITIES AND CLIMATE CHANGE
Many different infrastructure strategies can be employed in reducing GHG emissions from cities. Table 2 displays a range of strategies under categories of transportation/land-use, buildings, energy supply, solid waste, water/waste-water and carbon sequestration. Most of these strategies entail changes to infra-structure or built form, but a few economic strategies, e.g., congestion pricing, are also considered. The strategies are also classified in terms of their scale of engagement. Those strategies with higher scales of engagement generally entail higher investments and produce higher GHG reductions (relative to strategies in the same row). The designation of scale of engagement in Table 2 is essentially a preliminary hypothesis for this research, though based on 10 years of research and teaching on sustainable urban infrastructure. Clearly, the GHG reductions achieved through building a subway or a concentrating solar plant are much higher than those from a bicycle lane, or a vertical axis wind-turbine. The aim of the authors is to quantify this scale of engagement more rigorously.
Amongst the strategies in Table 2 are some that reduce GHG emissions through increased energy efficiency and others that use carbon free technologies. Strategies such as high occupancy vehicle lanes, bus rapid transit, green roofs and improved building operations make more efficient use of energy, but in absence of other strategies still entail GHG emissions; these are examples of low carbon alternatives. Other strategies, such as pedestrianization, photovoltaics, wind turbines and concentrating solar generation, eliminate direct GHG emissions. Further, strategies in Table 2 can also be emissions free, depending on condi-tions. For example, a carbon free electricity supply will enable the use of light rail transit, subways, electric vehicles and ground source heat pumps that have no GHG emissions. Employing strategies that use fossil fuel energy more efficiently help cities approach carbon neutral, but to reach carbon neutrality will substan-tially require carbon free technologies.

CHAPTER 7 � 247
TABLE 2 Preliminary Classification of GHG Reduction Strategies by Scale of Engagement Scale of Engagement
Category Minor Medium Major
Transpor-tation/ Land-use
High occupancy vehicle lanes; smart commute; car-pool networks; car share
Natural gas vehicles(e.g. municipal buses)
Bus rapid transit
On-road bike lanesBike share
Financial penalties to auto use (e.g., tolls, congestion charging)
Incentives for use of low-emission vehicles.
Light rail transit
Segregated bike lanes
Pedestrianization of city centres
Infrastructure for plug-in-hybrid electric vehicles
Subways
Bicycle highways
Buildings Building energy retrofits
Green roofs
Energy star buildings
Improved building operations
Photovoltaics
Solar water/ air heaters
Ground source heat pumps
Demolition and reconstruction with high energy efficiency green buildings
Energy Vertical axis wind turbines
District energy systems
Borehole or aquifer thermal storage
Nuclear power plants
Concentrating solar generation
Solid Waste Landfill methane capture
Vacuum collection of solid waste
Solid waste gasification
Increased recycling
Greening supply chains
Water/ Wastewater
Reduced demand through low-flush toilets or low-flow shower heads
Reduced demand through grey-water systems
Anaerobic waste water treatment plants
Carbon Sequestration
Planting of urban forestry
Algae
Residential scale urban agriculture in CO2-enriched greenhouses
Industrial scale urban agriculture in CO2 -enriched greenhouses
Carbon offsets
Note: the seventh category, integrated community design, cuts across the six categories shown. Source: Kennedy and Mohareb 2009

248 � CITIES AND CLIMATE CHANGE
2. OBJECTIVES OF THE PAPER
The specific objectives of this paper are to:
i) Identify which infrastructure strategies can lead to the greatest reductions in GHG emissions from cities, in both developed and developing nations.
ii) Identify which infrastructure strategies are most cost-effective in reducing GHG emissions (i.e., quantify reductions in t CO2 equiv. per dollar investment)
The objectives are addressed by collecting data from approximately 70 case studies of best practices in carbon neutral urban design. This review of case studies is the first phase of a larger project, described in section 3, which aims to produce a Guide for Canadian Municipalities on Getting to Carbon Neutral (G2CN). The results of the case studies show projects ranging from USUS$ 0.015 million to US US$460 million of investment, with GHG savings between 45 t e CO2 and 950,000 t e CO2. Findings from the data set are compared to those from two other sources: projects under the Federation of Canadian Municipal-ities Green Municipal Fund; and those funded under the United Nations Clean Development Mechanism. Caveats to the case study approach are included in the discussion.
3. BACKGROUND: GETTING TO CARBON NEUTRAL
As part of the Toronto Region’s Living City initiative (TRCA 2008), the Sustainable Urban Infrastructure Group at the University of Toronto is producing a guidebook to assist medium to large Canadian municipalities down the path to becoming carbon neutral (Kennedy 2009). As per the analysis undertaken for this guidebook under the G2CN project, the authors define carbon neutrality to require that direct and indirect emissions from the municipality minus sequestered carbon and offsets sum to zero, a definition that has been extended to this paper as well. Getting to carbon neutral state will first entail developing low carbon cities.
As a first step to addressing climate change many cities have established inven-tories of GHG emissions, often using the simple, pragmatic approach of ICLEI1. Within Canada, 157 municipalities are participating in the Partners for Climate
1See International Local Government GHG Emissions Analysis Protocol Draft Release Version 1.0.: http://www.iclei.org/fileadmin/user_upload/documents/Global/Progams/GHG/LGGHGEmissionsProtocol.pdf Accessed May 2009.

CHAPTER 7 � 249
Protection (PCP) program. Most of these municipalities have established inven-tories of GHG emissions, but many are struggling, however, to develop and implement strategies for substantially reducing GHGs.
Yet there are many examples of sustainable design practices both in Canada and elsewhere that have lead to lower GHG emissions for various neighbour-hoods or infrastructure systems within cities2. Many of the strategies employed for these are substantial, long-term endeavours requiring serious investment and some degree of societal change. They demonstrate that if municipalities were to aggressively pursue a wide-range of GHG emissions reducing strategies, subject to their own unique conditions, it may be technically feasible for many of them to become carbon neutral.
The first phase of the G2CN (Getting To Carbon Neutral) project entails collecting and analyzing best case practices and strategies in sustainable urban design and planning. The review includes case studies in areas of transportation, buildings, energy systems, waste management, water infrastructure, carbon sequestration and integrated community design. The case studies are discussed further below.
The second stage involves developing best practice strategies for reducing municipal GHG emissions in the categories of buildings, transportation/land-use, energy supply, municipal services and carbon sequestration/offsets (Table 3). For each strategy the guide provides simple, generic rules of thumb for approximately quantifying the reductions in GHG emissions that can be achieved. The formulae can be used, for example, to estimate GHG reductions from installing X km of light-rail; constructing a gasification plant to process Y tonnes of solid waste; or servicing Z% of homes in a municipality using a district energy scheme3. The rules of thumb typically calculate changes to intermediary quantities, such as energy use and vehicle kilometres travelled, from which GHG emissions are subsequently determined. The guide does not seek to be prescriptive in how the GHG reduction strategies are selected; it offers a menu of choices.
2 Canadian examples include: Calgary’s wind-powered C-train, Toronto’s deep-lake water cooling, and sustainable neighbourhood developments at Dockside Green (Victoria), South East False Creek (Vancouver), and Okotoks (nr. Calgary). To these, international examples such as Malmo’s port, Hammarby (Stockholm) and Kronsberg (Hannover) can be added. A few western cities such as London, UK, and Freiburg, Germany, have reduced per capita automobile use and associated emissions. Currently under development are communities such as Masdar, near Abu Dhabi, and Dongtan, near Shanghai, which aim to be the world’s first carbon neutral sustainable cities.3An example rule of thumb is that retrofitting of residential homes typically reduces average energy demand by 20 to 25% in Canada.

250 � CITIES AND CLIMATE CHANGE
4. METHODOLOGY
In this paper, data from the case studies assessed in the G2CN guide is used to estimate the cost effectiveness of GHG emissions savings initiatives. Cost effec-tiveness has been defined as follows:
Annual GHG emissions savedCost effectiveness =
Capital investment
The above measure only considers initial capital costs; it excludes recurring costs, user fees, financial benefits, low-cost financing and/or government subsidies. Given this, cost effectiveness may be considered as a limited economic measure since it gives no indication of financial returns. However, it is useful from the perspective of capital budgeting to reduce GHG emissions.
Table 3. Strategies for Reducing Municipal Greenhouse Gas Emissions
BUILDINGSStrategy 1: Reduce Energy DemandStrategy 2: Utilize Solar EnergyStrategy 3: Ground Source Heat Pumps
TRANSPORTATION / LAND USEStrategy 1: Appropriate Land UseStrategy 2: Public TransportationStrategy 3: Active TransportationStrategy 4: Deter Automobile UseStrategy 5: Changing Vehicle Technology
ENERGY SUPPLYStrategy 1: Electricity from Renewable SourcesStrategy 2: Aquifer and Borehole Energy StorageStrategy 3: District Heating and Cooling Strategy 4: Combined Heat and Power
WASTE, WATER & MUNICIPAL SERVICESStrategy 1: Increased RecyclingStrategy 2: Waste Incineration & GasificationStrategy 3: Methane CaptureStrategy 4: Water Demand Management
CARBON SEQUESTRATION and OFFSETSStrategy 1: Urban Agriculture & CO2-enriched GreenhousesStrategy 2: Urban ForestryStrategy 3: Geological & Mechanical Sequestration
Source: Kennedy 2009

CHAPTER 7 � 251
The case study selection procedure sought to establish leading edge examples of initiatives being taken by municipalities, cities or regions to reduce GHG emissions, both in Canada and worldwide. Extensive teaching and research experience on a wide range of sustainable urban design topics, including green buildings (Zachariah et al. 2002; Dong et al. 2005; Saiz et al. 2006), urban water systems (Sahely and Kennedy 2007; Racoviceanu et al. 2007), sustainable urban transportation (Kennedy 2002; Kennedy et al. 2005), alternative energy systems (Kikuchi et al. 2009), sustainable neighborhoods (Engel-Yan et al. 2005; Codoban and Kennedy 2008) and urban metabolism (Sahely et al. 2003; Kennedy et al. 2007), and the application of the principles of industrial ecology to the design of sustainable cities (Kennedy 2007), provided an initial background to the selection of the case studies.
For each case study, the aim was to establish a database on costs, benefits, barriers to implementation, and GHG savings. The case studies, thus, also provided empirical data to support/verify the rules of thumb developed in the above-mentioned Guide. The purpose of this paper is to use the data from the case studies to examine the cost effectiveness of strategies for reducing emissions. In this context, the criteria for selection of the case studies were:
The use of strategies that reduce, or prevent growth of, greenhouse gas emissions
The coverage of both Canadian and non-Canadian best practices
Inclusion of examples from both medium and large municipalities
Strategies that primarily focused on technological and urban design solutions, rather than economic measures
The availability of information.
The chosen case studies (Table 4) include a wide range of strategies, essentially covering the categories established in Table 2.

252 � CITIES AND CLIMATE CHANGE
TABLE 4 Capital Costs and Annual Greenhouse Gas Savings for the Case Studies
PROJECT LOCATIONCAPITAL
COST($ million US)
ANNUAL GHG SAVING
(kt CO2 e)
TRANSPORTATION / LAND USE
Light Rail Transit Calgary 447 591(v)
Rubber-tired streetcar Caen 279
Quality Bus Corridor Dublin 68
Bus Rapid Transit Vancouver, BC 39.2 1.8
Metrolink: Express Bus Halifax, NS. 9.3(v) 1.125(*)
Heavy-Duty HCNG Transit Buses-Hydrogen Highway
Port Coquitlam, BC.
2.3(v) 0.12(v)
Low Emission Zone London 90(v)
Congestion Charging London 244(v) 120(v)
Bike Share Paris 132(v) 18(*)
Bike Share Barcelona 1.92
Bike Campaign Whitehorse 1.5(v) 0.0045(v)
Real time information Portland 6
High Occupancy Vehicle Lanes Seattle 2.3 (v)
Parking Cash Out California 0.24(v)
BUILDINGS
Demolition / Reconstruction Toronto 31.4 (v)
Solar Air Heating Montreal 1.96 1.342
Solar Hot Water Heating Paris 0.91 (v) 0.214 (v)
Ground Source Heat Pump Concord, Ontario 2.862
Building Integrated Photovoltaic
Coney Island, New York City
0.086
Green Roof San Francisco 2.64
Heat Recovery from Restaurant Exhaust
Toronto 0.015 0.0075
ENERGY
Solar Central Receiver Station Seville 41 110(*)
Solar Thermal Electricity Plant Mojave Desert 270(*)
Tidal Stream System N. Ireland 5.4 (v) 2(v)
Solar Power and Borehole Thermal Storage
Okotoks, Alberta 3.8 (v) 0.26 (v)

CHAPTER 7 � 253
PROJECT LOCATIONCAPITAL
COST($ million US)
ANNUAL GHG SAVING
(kt CO2 e)
Photovoltaic Plant Olmedilla de Alarcon, Spain
460 29(*)
Wave Power Plant Portugal 10.6 1.8(*)
Geothermal Power Northern California 950(*)
Lake Water District Air Conditioning Toronto 79
Small Hydro Cordova Mines, Ontario
1.36 0.06(*)
Urban Wind Power Toronto 1.21 0.38
Vertical Axis Wind Liverpool 0.46 (v) 0.0014(*)
SOLID WASTE
Source-Separation & Methane Production
Sydney 75 (v) 210 (v)
Incineration-Based CHP Gothenburg 453 (v) 205 (v)
Methane Capture Toronto 24 (v)
WATER / WASTEWATER
Biogas from sewage Stockholm 15 14
Co-Generation at Wastewater Treatment Plant
Ottawa 3.4
Wastewater heat recovery Sony City, Japan 3.5 (v)
CARBON SEQUESTRATION AND OFFSETS
Doubling Urban Canopy Chicago 10/year (v) 170 (v)
SUSTAINABLE COMMUNITY
Vauban Freiburg 2.1
Dockside Green Victoria, B.C. 4.5 (v) 5.2 (v)
Dongtan Shanghai 750 (v) expected
(v = verified; * = GHG calculation undertaken by the project team). Source: Kennedy 2009
TABLE 4, continued

254 � CITIES AND CLIMATE CHANGE
The geographical extent of the case studies is biased first towards Canada, and second towards North America and Western Europe. The locations of the case studies are shown in Figure 1. Clearly it would be useful to include more examples from other parts of the world, especially Asia4.
Information on each case study was first assembled from websites describing the infrastructure or other relevant literature. This information was then e-mailed to owners, designers or managers of the infrastructure, who were invited to verify, update and add to the case study descriptions. Case studies for which the infor-mation has been verified are marked with a ‘v’ in Table 4.
FIGURE 1 Locations of Case Studies for the Getting To Carbon Neutral Project (as represented in a google map)
Source: adapted from the project website: www.utoronto.ca/sig.
4 The authors would be pleased to receive further suggestions for infrastructure projects that substantially reduce GHG emissions; a form for submitting information on new case studies can be accessed on the project website: www.utoronto.ca/sig/g2cn

CHAPTER 7 � 255
In some cases, information was only obtained on energy saved, or vehicle kilometers reduced, thus requiring the study team to estimate the corresponding GHG savings. For example, if the case study involved electricity supply from a renewable source, the authors established the GHG savings relative to the conventional supply, based on provincial, state or national GHG intensity as documented, for example by OPA (2007), or EIA (2006). Another illustrative example is the calculation of GHG savings related to the MetroLink express bus project in Halifax. For this, the authors multiplied the number of round trips made in the year 2008 by the average daily GHG savings per passenger, assuming that all riders used a private automobile prior to using the MetroLink. Similar assumptions are made by a number of other agencies, e.g., City of Calgary, in calculating and reporting the GHG savings of other case studies presented in this report. Case studies for which GHG savings were estimated by the authors are marked by an asterisk (*) in Table 4.
5. RESULTS
From the 68 case studies for which information was sought, data on annual GHG savings and/or capital costs was obtained for 42 cases. Of these, 34 have data on GHG savings, 30 have data on capital costs, and 22 have both sets of data (Table 4).
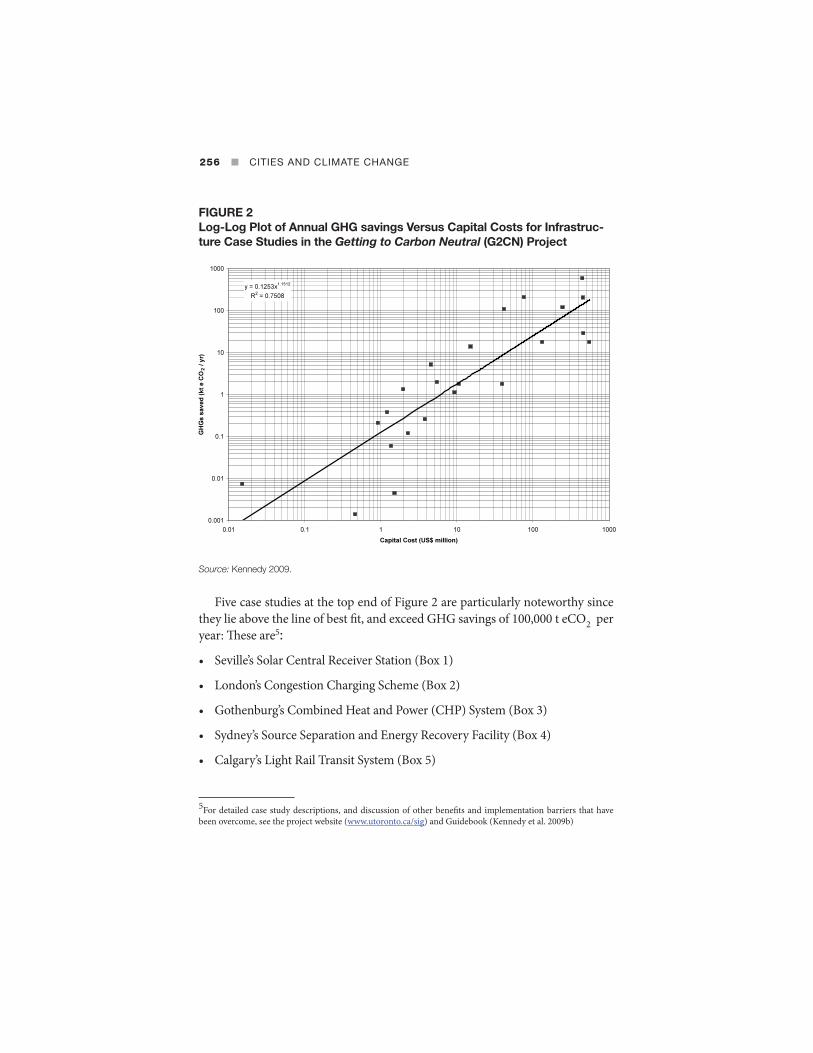
For the case studies where the capital costs and GHG emissions are both known there is a relatively consistent fit of increased emissions savings with higher investments (Fig. 2). The data is, however, plotted on a log-log basis, since both the costs and GHG emissions vary over orders of magnitude. The log-log plot disguises the very large deviations in the data set. For example, a bike campaign in Whitehorse costing US$1.51 million is estimated to save 45 t eCO2 per year; while a solar air heating system in Montreal costing US$1.96 million has reported GHG savings of 1,342 t eCO2 per year. Another comparison can be made between a subway line in Rennes, France, saving 18,000 t e CO2 per year at a capital cost of US$550 million; and Calgary’s light rail transit, powered by wind-generated electricity, which saves 591,000 t eCO2 per year after a capital cost of US$447 million. Clearly there are significant differences in cost-effectiveness between the case studies, with respect to reducing GHG emissions.
While the line of best fit in Figure 2 is of limited use as a predictor, it helps to distinguish the infrastructure investments achieving the most cost-effective reductions in GHG emissions. Points that lie above the line, in the middle range of costs, include cases of solar hot water heating, urban wind power, tidal stream power, and generating biogas from sewage, as well as the Montreal solar air heating system.
256 � CITIES AND CLIMATE CHANGE
FIGURE 2 Log-Log Plot of Annual GHG savings Versus Capital Costs for Infrastruc-ture Case Studies in the Getting to Carbon Neutral (G2CN) Project
Source: Kennedy 2009.
Five case studies at the top end of Figure 2 are particularly noteworthy since they lie above the line of best fit, and exceed GHG savings of 100,000 t eCO2 per year: These are5:
Seville’s Solar Central Receiver Station (Box 1)
London’s Congestion Charging Scheme (Box 2)
Gothenburg’s Combined Heat and Power (CHP) System (Box 3)
Sydney’s Source Separation and Energy Recovery Facility (Box 4)
Calgary’s Light Rail Transit System (Box 5)
5For detailed case study descriptions, and discussion of other benefits and implementation barriers that have been overcome, see the project website (www.utoronto.ca/sig) and Guidebook (Kennedy et al. 2009b)
CHAPTER 7 � 257
BOX 1
BOX 2
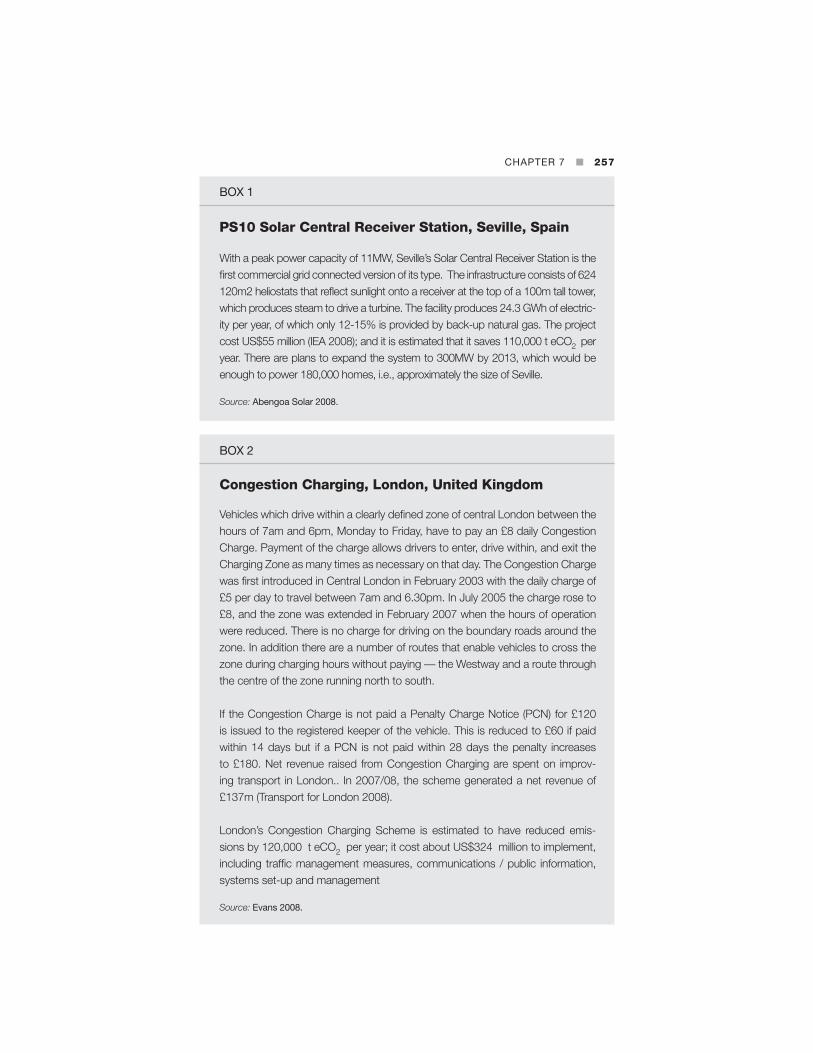
PS10 Solar Central Receiver Station, Seville, Spain
Congestion Charging, London, United Kingdom
With a peak power capacity of 11MW, Seville’s Solar Central Receiver Station is the first commercial grid connected version of its type. The infrastructure consists of 624 120m2 heliostats that reflect sunlight onto a receiver at the top of a 100m tall tower, which produces steam to drive a turbine. The facility produces 24.3 GWh of electric-ity per year, of which only 12-15% is provided by back-up natural gas. The project cost US$55 million (IEA 2008); and it is estimated that it saves 110,000 t eCO2 per year. There are plans to expand the system to 300MW by 2013, which would be enough to power 180,000 homes, i.e., approximately the size of Seville.
Source: Abengoa Solar 2008.
Vehicles which drive within a clearly defined zone of central London between the hours of 7am and 6pm, Monday to Friday, have to pay an £8 daily Congestion Charge. Payment of the charge allows drivers to enter, drive within, and exit the Charging Zone as many times as necessary on that day. The Congestion Charge was first introduced in Central London in February 2003 with the daily charge of £5 per day to travel between 7am and 6.30pm. In July 2005 the charge rose to £8, and the zone was extended in February 2007 when the hours of operation were reduced. There is no charge for driving on the boundary roads around the zone. In addition there are a number of routes that enable vehicles to cross the zone during charging hours without paying — the Westway and a route through the centre of the zone running north to south.
If the Congestion Charge is not paid a Penalty Charge Notice (PCN) for £120 is issued to the registered keeper of the vehicle. This is reduced to £60 if paid within 14 days but if a PCN is not paid within 28 days the penalty increases to £180. Net revenue raised from Congestion Charging are spent on improv-ing transport in London.. In 2007/08, the scheme generated a net revenue of £137m (Transport for London 2008).
London’s Congestion Charging Scheme is estimated to have reduced emis-sions by 120,000 t eCO2 per year; it cost about US$324 million to implement, including traffic management measures, communications / public information, systems set-up and management
Source: Evans 2008.

258 � CITIES AND CLIMATE CHANGE
BOX 3
BOX 4
CHP from Solid Waste, Gothenburg, Sweden
Source Separation and Energy Recovery, Sydney, Australia
Gothenburg’s Combined Heat and Power (CHP) system, fuelled by waste incinera-tion, reduces municipal solid waste disposal needs and displaces fossil fuel gener-ated heat and electricity. Approximately 1,200,000 MWh of electricity were produced from incineration of waste in 2006. Annual benefits from the sale of electricity are US$33.6 million. Other benefits may include avoided landfill disposal costs and car-bon credits. The system cost US$600 million; and saves about 205,000 t eCO2 per year through separation and combustion of degradable organic carbon.
Source: Climate Leadership Group 2008a.
Sydney’s Source Separation and Energy Recovery Facility achieves a 70% di-version of municipal solid waste from landfill. An anaerobic digestion process produces methane, which is combusted to produce electricity to power the sep-aration facility. Compost from the organic stream is sold for US$20-US$30 per tonne. The estimated GHG savings are 210,000 t eCO2 per year, as landfill gas emissions are avoided through separation / combustion of degradable organic carbon. The facility was constructed with a capital cost of US$100 million.
Source: Climate Leadership Group 2008b.
CHAPTER 7 � 259
In addition to the above five cases, the data set includes four other projects with annual GHG savings over 100,000 t eCO2, but for which the capital costs are not available to the study team. These are: a solar thermal electricity plant in the Mojave desert (270,000 t eCO2 per year); a series of over twenty geothermal power plants in Northern California (950,000 t eCO2 per year); Chicago’s plan to double its tree canopy (170,000 t eCO2 per year); and the planned Dongtan sustainable community development near Shanghai (750,000 t eCO2 per year). However, it must be mentioned that doubts have been raised on whether the Dongtan development will proceed (The Economist Mar 19, 2009).
The case studies mentioned above, with savings over 100,000 t eCO2 per year, cover a variety of sectors: transportation, solid waste, energy and urban forestry. This is encouraging, as it shows that a diverse range of effective strat-egies can be adopted to reduce emissions. For some of these nine case studies, it is clear that the strategy adopted exploits local conditions, such as high solar
BOX 5
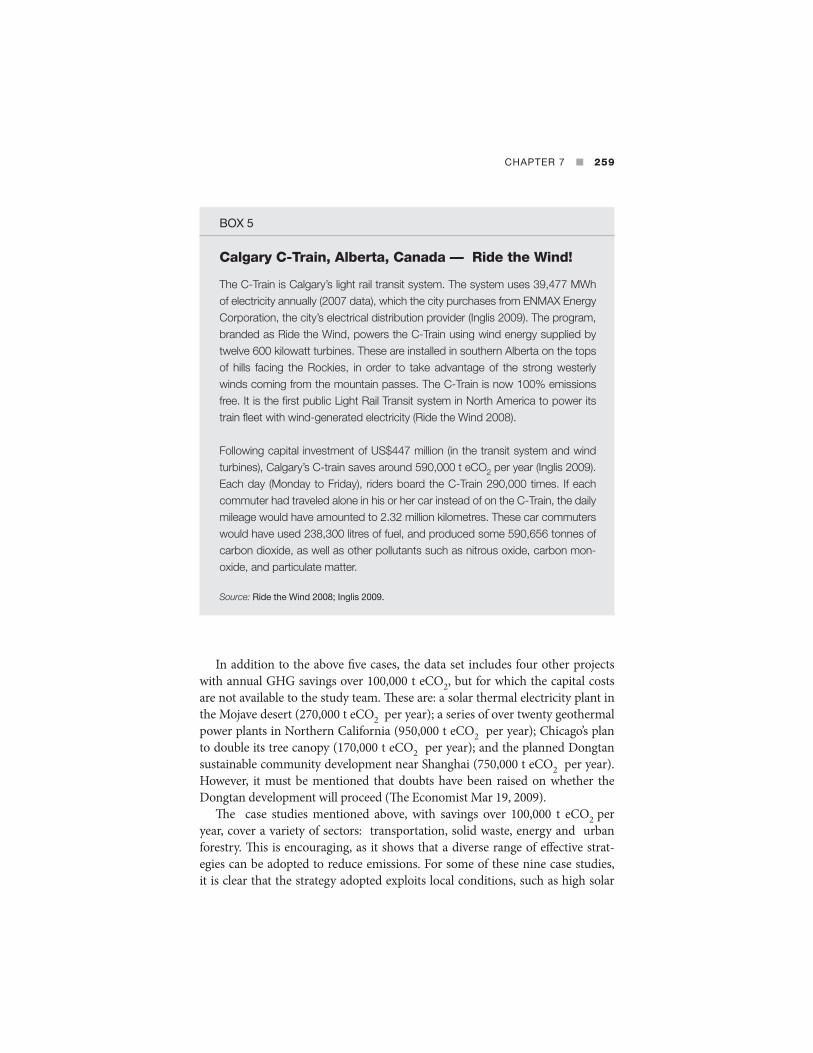
Calgary C-Train, Alberta, Canada — Ride the Wind!
The C-Train is Calgary’s light rail transit system. The system uses 39,477 MWh of electricity annually (2007 data), which the city purchases from ENMAX Energy Corporation, the city’s electrical distribution provider (Inglis 2009). The program, branded as Ride the Wind, powers the C-Train using wind energy supplied by twelve 600 kilowatt turbines. These are installed in southern Alberta on the tops of hills facing the Rockies, in order to take advantage of the strong westerly winds coming from the mountain passes. The C-Train is now 100% emissions free. It is the first public Light Rail Transit system in North America to power its train fleet with wind-generated electricity (Ride the Wind 2008).
Following capital investment of US$447 million (in the transit system and wind turbines), Calgary’s C-train saves around 590,000 t eCO2 per year (Inglis 2009). Each day (Monday to Friday), riders board the C-Train 290,000 times. If each commuter had traveled alone in his or her car instead of on the C-Train, the daily mileage would have amounted to 2.32 million kilometres. These car commuters would have used 238,300 litres of fuel, and produced some 590,656 tonnes of carbon dioxide, as well as other pollutants such as nitrous oxide, carbon mon-oxide, and particulate matter.
Source: Ride the Wind 2008; Inglis 2009.

260 � CITIES AND CLIMATE CHANGE
radiation, or suitable conditions for geothermal energy. In other cases, the strategy was a response to local stresses, e.g., traffic congestion in London, heat waves in Chicago; but for some cases it was just a matter of being more creative and efficient with solid waste.
6. COMPARISON WITH OTHER DATA SETS
The results from the G2CN case studies discussed in this paper can be compared to those from two other data sets:
i) The Federation of Canadian Municipalities (FCM) records the expected savings in GHG emissions from some projects supported by the Green Municipal Funds. These funds, which were endowed by the Canadian Government, provide grants and below-market loans to directly support municipal initiatives in Canada.
ii) The United Nations Framework Convention on Climate Change (UNFCCC) has a database of projects funded under the Clean Development Mechanism (CDM). The CDM arrangement, developed under the Kyoto Protocol, allows industrialized countries to invest in emissions reduction projects in devel-oping countries, as alternatives to more expensive strategies in their own countries.
The majority of projects in the FCM database, for which both GHG savings and capital costs are reported, are in the solid waste sector (twelve). In addition, data is available for four transportation projects, four energy supply projects, and one community development project – an eco-industrial park in Hinton, Alberta (Canada).
Generally speaking, the nine data for the non-waste sectors are distributed in a relatively similar manner to our case study data (again on a log-log plot). The line of best fit of G2CN data, from Figure 2, is shown with the FCM data in Figure 3 for comparison. The cost-effectiveness of the nine non-waste sector projects (2,040 t e CO2 / yr / US$million) is on average better than for the G2CN case studies (550 t e CO2 / yr / US$million); eight of the nine points lie above the regression line of G2CN data. Furthermore, it is quite apparent that the solid waste projects in the FCM dataset substantially out-perform the data from G2CN case studies. The average cost-effectiveness of the FCM solid waste projects is 37,400 t e CO2 / yr / US$million.

CHAPTER 7 � 261
FIGURE 3 Log-Log Plot of Annual GHG Savings Versus Capital Costs for Infrastructure Projects Funded Under the Federation of Canadian Municipalities “Green Municipal Fund”
The dotted line is from the regression of G2CN data shown in Figure 2. Source: FCM 2009; Kennedy 2009.
The United Nations database of CDM projects was accessed on-line between January and April, 2009. At this time, there were over 1,500 registered CDM projects, with several thousand more under review. Capital cost data are taken from project design documents, assuming that capital cost was equal to incre-mental cost for the project (thus operations and maintenance costs are ignored), and that the baseline scenario is to do nothing. Conversions of costs are made to US dollars as of the project registration date6. Where capital costs could not be located in the project design document, the project was not included as a data point. There are many solid waste and energy projects in the database. Figure 4 plots waste and energy projects at the high end of expected GHG reductions, i.e. all energy projects over 500,000 t e CO2 / yr, and all waste projects over 250,000 t e CO2 / yr are shown, as well as a few other smaller scale projects that were of interest to the study team, and some agricultural and industrial projects. There are also a small number of transportation and afforestation / reforestation projects in the CDM database; these are plotted in Figure 4 as well.
6 using the currency conversion website Oanda.com at the inter-bank rate

262 � CITIES AND CLIMATE CHANGE
Figure 4 Log-log Plot of Annual GHG Savings Versus Capital Costs for a Subset of United Nations Clean Development Mechanism Infrastructure Projects
The dotted line is from the regression of G2CN data shown in Figure 2. Source: UNFCC 2009; Kennedy 2009.
In comparison to the G2CN data, the CDM projects are much more cost-effective, as should be expected for developing countries. All of the CDM projects lie above the regression line for the G2CN data. The spread amongst the CDM projects is quite remarkable. For example, the Alto-Tietê landfill gas capture project in Brazil has certified reductions of 481,000 t eCO2/yr for a capital cost of US$2.31 million, while a bus rapid transit project in Bogota, Colombia saves 247,000 t eCO2/yr, at a capital cost of US$532 million. As with the FCM data, the solid waste projects are the low hanging fruit in terms of cost-effectiveness. This is apparent when comparing the energy and waste projects in Figure 4 (again recognizing that these are partial data). The average cost-effectiveness of the CDM waste projects is 64,800 t eCO2/yr / US$million, compared to 10,300 t eCO2/yr / US$million for energy projects.

CHAPTER 7 � 263
7. LIMITATIONS
Several caveats apply to the interpretation of the results above and the compari-sons with other datasets. First, the estimation of GHG emissions for projects in the dataset used for the study has not necessarily been undertaken with a consis-tent methodology. Other than the few cases where the authors calculated the GHG savings, the quality of the dataset depends on the calculations undertaken individually for each project by the concerned project team.
Furthermore, the study team has undertaken a broad scan of infrastructure strategies for reducing GHG emissions. Generally, only one or two cases of a particular type of strategy are included in the dataset, and these may not neces-sarily be representative of the average performance of such a strategy. Where there is multiple data for a particular strategy, such as landfill gas to energy in the CDM and FCM datasets, then a high degree of variation in cost-effectiveness is apparent.
Part of the variation in costs and GHG savings between projects can be attributed to differences in local conditions. Costs of projects vary due to factors such as costs of labour, access to resources, access to technology, economies of scale, etc. GHG emissions saved when generating electricity from renewable sources depend on the GHG intensity of the local power grid. So even if costs are the same, the cost-effectiveness is higher in regions that currently have greater dependence on coal for power generation. GHG reduction strategies that are cost effective in one region may not be so in another.
Several of the projects considered in the dataset are cutting edge applications of new or developing technologies. As such the costs of these projects, which may be considered trials or experiments, can be expected to come down as the technology develops.
Another important caveat is that few, if any, of the infrastructure projects considered in the dataset were designed solely for the purpose of reducing GHG emissions. Reducing emissions is only one goal. Transportation systems are designed to move people and goods; energy infrastructure is designed to provide heating, lighting and electrical service, etc. By virtue of differences in their functionality, various types of infrastructure can be expected to differ in terms of cost effectiveness for reducing GHGs; this is less apparent with the G2CN data, but clearly the case with the FCM and CDM datasets.
Finally, while cost-effectiveness has some merits as an economic measure, it is of limited use from an investment perspective. The private sector, in particular, must expect to achieve satisfactory rates of return if it is to invest in infrastructure that reduces GHG emissions. OECD/IEA (2008) have identified a number of energy efficiency initiatives in a few cities, such as building retrofits, LED (Light Emitting Diode) traffic signals, and pool heat recovery, for which rates of return of

264 � CITIES AND CLIMATE CHANGE
over 100% are achieved.. Kikuchi et al. (2009) have also shown that investments in alternative energy technologies in Ontario can offer investors reasonable rates of return at relatively low risk, depending on the sector. The investments considered in both of the above studies are, however, relatively small scale. Further studies of returns on investment are perhaps warranted with respect to infrastructure projects that substantially reduce GHG emissions.
8. CONCLUSIONS
The case studies presented in this paper cover a variety of infrastructure strategies with savings in GHG emissions ranging from 45 t eCO2 to over 500,000 t eCO2. The size of the GHG reductions generally increases with the magnitude of capital investment, as expected, but there is significant variation. Measures of cost-effec-tiveness vary between 3 and 2,780 t eCO2/ yr / US$million for the database.
The average cost-effectiveness of the G2CN database is 550 t eCO2/yr / US$million. This could be used as a benchmark to compare GHG savings for urban infrastructure investments in developed nations. However, much higher levels of cost-effectiveness have been achieved with solid waste projects in Canada (FCM); and with developing world CDM projects. Thus a higher benchmark should perhaps be set for infrastructure projects in developed world cities, depending upon the type of infrastructure available.
This paper has highlighted five case studies in particular, which are above the average cost-effectiveness achieved in the G2CN dataset, and have GHG savings over 100,000 t eCO2. These are: a solar central receiver station in Seville; the congestion charging scheme in London; CHP in Gothenburg; source separation and energy recovery in Sydney; and light rail transit in Calgary. A further four projects in the database have GHG savings over 100,000 t eCO2, but the capital costs of these initiatives are not available to the authors.
While the GHG savings from the nine cases are substantial, these should be assessed with reference to the GHG inventories of cities. A GHG saving of 100,000 t eCO2 per year is still two orders of magnitude below the typical emissions for a city of 1 million people, and three orders of magnitude below that for a mega-region, as discussed in the introduction (Table 1). Cities arguably need to start planning projects with reductions of the order 1 million plus t eCO2 per year.
Acknowledgements
Financial support for this work was provided by Toronto and Region Conserva-tion Authority.

CHAPTER 7 � 265
References
Abengoa Solar. 2008. “PS10: The First Commercial Tower of the World.” http://www.abengoasolar.com/sites/solar/en/our_projects/solucar/ps10/index.html. [Accessed November, 2008].
Climate Leadership Group. 2008a. “Best Practices.” Gothenburg, Sweden: C40 Cities. http://www.c40cities.org/bestpractices. [Accessed November 7, 2008].
Climate Leadership Group. 2008b. “Best Practices.” Sydney, Australia: C40 Cities. http://www.c40cities.org/bestpractices. [Accessed November 7, 2008].
Codoban N., and C. A. Kennedy. 2008. “The Metabolism of Neighborhoods.” ASCE J. of Urban Planning and Development 134 (1): 21–31.
Dong B., C. A. Kennedy, and K. Pressnail. 2005. “Comparing Life Cycle Implications of Building Retrofit and Replacement Options.” Canadian Journal for Civil Engineering 32 (6): 1051–63.
Engel Yan J., C. A. Kennedy, S. Saiz, and K. Pressnail. 2005. “Towards Sustainable Neigh-bourhoods: The Need to Consider Infrastructure Interactions.” Canadian Journal for Civil Engineering 32 (1): 45–57.
Evans, R. 2008. “Central London Congestion Charging Scheme: Ex-Post Evaluation of the Quantified Impacts of the Original Scheme.” Transport for London. http://www.tfl.gov.uk/assets/downloads/Ex-post-evaluation-of-quantified-impacts-of-original-scheme-07-June.pdf. [Accessed November 8, 2008].
FCM. 2009. Federation of Canadian Municipalities. http://gmf.fcm.ca/Search/Search/Search.aspx?lang=e (Green Municipal Fund Approved Projects Database; accessed April 2009).
IEA SolarPaces. 2008. Spain PS10, http://www.solarpaces.org/Tasks/Task1/PS10.HTM, [Accessed October, 2008].
Inglis, P. 2009. Personal correspondence with The City of Calgary.Kennedy, C. A. 2002. “A Comparison of the Sustainability of Public and Private Transpor-
tation Systems: Study of the Greater Toronto Area.” Transportation 29: 459–93.______. 2007. “Applying Industrial Ecology to Design a Sustainable Built Environment:
The Toronto Port Lands Challenge.” Paper presented at the Engineering Sustainability Conference, Pittsburgh, USA, April 15-18.
Kennedy, C. A., and E. Mohareb. 2009. To be published in 2010. “Greenhouse Gas Emissions from Cities.” Chapter 7 in Cities in Evolution: Urbanization, Environmental Change and Sustainability, ed. Xuemei Bai, Thomas Graedel and Akio Morishima. Cambridge University Press.
Kennedy, C. A., E. Miller, A. Shalaby, H. MacLean, and J. Coleman. 2005. “The Four Pillars of Sustainable Urban Transportation.” Transport Reviews 25 (4): 393–414.
Kennedy, C. A., J. Cuddihy, Yan J. Engel. 2007. “The Changing Metabolism of Cities.” Industrial Ecology 11 (2): 43–59.
Kennedy, C., J. Steinberger, B. Gasson, T. Hillman, M. Havránek, Y. Hansen, D. Pataki, A. Phdungsilp, A. Ramaswami, G. Villalba Mendez. 2009. “Greenhouse Gas Emissions from Global Cities.” Environmental Science and Technology 43: 7297–302.
Kennedy, C. A., ed. 2009. Getting to Carbon Neutral: A Guide for Canadian Municipalities. Prepared for the Toronto and Region Conservation Authority. http://www.utoronto.ca/sig.

266 � CITIES AND CLIMATE CHANGE
Kikuchi, E, D. Bristow, and C. A. Kennedy. 2009. “Evaluation of Region-specific Residential Energy Systems for GHG reductions: Case Studies in Canadian Cities.” Energy Policy 37 (4): 1257–66.
OECD/IEA. 2008. “Promoting Energy Efficiency, Best Practice in Cities: A Pilot Study.” Working Paper, IEA, Paris.
OPA (Ontario Power Authority). 2007. “Integrated Power Systems Plan.” http://www.powerauthority.on.ca/Page.asp?PageID=1224&SiteNodeID=320. [Accessed April 2008].
Racoviceanu, A, B.W. Karney, C. A. Kennedy and A. F. Colombo. 2007. “Life Cycle Energy Use and Greenhouse Gas Emissions Inventory for Water Treatment Systems.” ASCE J. of Infrastructure Systems 13 (4): 261–70.
Ride the Wind! 2008. The C-Train, Re-Energy. http://www.re-energy.ca/ridethewind/backgrounder.shtml. [Accessed November 7, 2008].
Sahely, H. R., and C. A. Kennedy. 2007. “Integrated Systems Flow Model for Quantifying Environmental and Economic Sustainability Indicators: Case Study of the City of Toronto Urban Water System.” ASCE Journal of Water Resources Planning and Management 133 (6): 550-–9.
Sahely, H. R., S. Dudding and C. A. Kennedy. 2003. “Estimating the Urban Metabolism of Canadian Cities: GTA Case Study.” Canadian Journal for Civil Engineering 30: 468–83.
Saiz, S, C. A. Kennedy, B. Bass, and K. Pressnail. 2006. “Comparative Life Cycle Assessment of Standard and Green Roofs.” Environmental Science and Technology 40 (13): 4312–16.
Transport for London. 2008. Congestion Charging, Transport for London. http://www.tfl.gov.uk/roadusers/congestioncharging/. [Accessed November 8, 2008].
TRCA (Toronto and Region Conservation Authority) Living City Project. 2008. www.trca.on.ca/Website/TRCA/website.nsf/WebPage/thelivingcity/. [Accessed Sept 2008].
UNFCCC (United Nations Framework Convention on Climate Change) Clean Devel-opment Mechanism Database. http://cdm.unfccc.int/Projects/projsearch.html. [Accessed April 2009].
US EIA (Energy Information Administration). 2006. State Electricity Profiles. http://www.eia.doe.gov/cneaf/electricity/st_profiles/e_profiles_sum.html. [Accessed Feb. 2009].
Zachariah, L, C. A. Kennedy, and K. Pressnail. 2002. “What Makes a Building Green?” International Journal of Environmental Technology and Management 2 (1-3): 38–53.

CHAPTER 7 � 267
Abbreviations
CDM Clean Development Mechanism
CHP Combined Heat and Power
FCM Federation of Canadian Municipalities
GHG Greenhouse Gas
G2CN Getting to Carbon Neutral
t e CO2 Tones of Carbon Dioxide equivalents
PCP Partners for Climate Protection
ICLEI International Council for Local Environmental Initiatives
LED Light Emitting Diode